Article

Structural Behavior of Amphiphilic Triblock Copolymer P104/Water System

by
Edgar Benjamín Figueroa-Ochoa
1,
Lourdes Mónica Bravo-Anaya
2,3,4,*,
Ricardo Vaca-López
1,
Gabriel Landázuri-Gómez
2,3,
Luis Carlos Rosales-Rivera
3,
Tania Diaz-Vidal
3,
Francisco Carvajal
5,6,†,
Emma Rebeca Macías-Balleza
3,
Yahya Rharbi
2 and
J. Félix Armando Soltero-Martínez
2,3,*
1
Departamento de Química, Universidad de Guadalajara, Blvd. M. García Barragán #1451, Guadalajara 44430, Jalisco, Mexico
2
Université Grenoble Alpes, CNRS, Grenoble INP (Institut of Engineering Univ. Grenoble Alpes), 38000 Grenoble, France
3
Departamento de Ingeniería Química, Universidad de Guadalajara, Blvd. M. García Barragán #1451, Guadalajara 44430, Jalisco, Mexico
4
Université de Rennes, Institut des Sciences Chimiques de Rennes, Équipe CORINT, CNRS, UMR 6226, Campus de Beaulieu, Bat 10A, 35042 Rennes Cedex, France
5
Centro Universitario UTEG, Departamento de Investigación, Héroes Ferrocarrileros #1325, Guadalajara 44460, Jalisco, Mexico
6
CUTonalá, Departamento de Ingenierías, Universidad de Guadalajara, Nuevo Periférico # 555, Ejido San José Tatepozco 45425, Jalisco, Mexico
*
Authors to whom correspondence should be addressed.
In memoria.
Polymers 2023, 15(11), 2551; https://doi.org/10.3390/polym15112551
Submission received: 13 May 2023 / Revised: 26 May 2023 / Accepted: 28 May 2023 / Published: 31 May 2023
(This article belongs to the Special Issue Characterization and Properties of Block Copolymers)

Abstract

:
A detailed study of the different structural transitions of the triblock copolymer PEO27–PPO61–PEO27 (P104) in water, in the dilute and semi-dilute regions, is addressed here as a function of temperature and P104 concentration (CP104) by mean of complimentary methods: viscosimetry, densimetry, dynamic light scattering, turbidimetry, polarized microscopy, and rheometry. The hydration profile was calculated through density and sound velocity measurements. It was possible to identify the regions where monomers exist, spherical micelle formation, elongated cylindrical micelles formation, clouding points, and liquid crystalline behavior. We report a partial phase diagram including information for P104 concentrations from 1 × 10⁻⁴ to 90 wt.% and temperatures from 20 to 75 °C that will be helpful for further interaction studies with hydrophobic molecules or active principles for drug delivery.

Graphical Abstract

1. Introduction

Amphiphilic block copolymers are synthetized to self-assemble in aqueous solvents as different structures such as spheres and cylinders, among others [1,2,3,4]. AB diblock and ABA triblock copolymers, which consist of only two components, are the two most studied and characterized molecules in the linear block copolymers [5]. However, more recently, some studies have been also emphasized ABC triblock copolymers for their specific bulk morphologies, which present several differences from those observed in linear diblock copolymers through their higher complexity [6]. Amphiphilic triblock copolymers, also known by their commercial name Pluronic®, consisting of poly(ethylene oxide) (PEO) and poly(propylene oxide) (PPO) blocks as follows: PEOx–PPOy–PEOx, have been studied due to their efficiency during drug delivery processes [7,8,9,10]. Drug incorporation into the micelle core formed by these amphiphilic block copolymers can provide metabolic stability, superior drug circulation time, and an increment of solubility [9,11]. Therefore, micelle core-shell structure and characteristics are essential for their efficiency in drug delivery [12]. This core is also a compartment incompatible with water but is able to store different kinds of therapeutic reagents [11,13]. Gene delivery is another pharmaceutical application that has been proposed for several block copolymers [9,14,15,16,17]. Furthermore, interactions between multidrug-resistant cancer cells and triblock copolymer unimers have also been studied, resulting in the sensitization of the cells to diverse anticancer agents [18,19].
All these applications depend on the amphiphilic block copolymer structure. In water, they are able to form micelles above the critical micellar temperature (CMT) and the critical micellar concentration (CMC) [2,10]. In these amphiphilic triblock copolymers, it has been shown that the CMC decreases promptly as temperature increases, as well as the CMT diminishing as the copolymer concentration increases [1,2,4]. Furthermore, it has been shown that spherical micelles grow to form worm-like micelles with increasing temperature and amphiphilic triblock copolymer concentration. A drastic viscosity increase of several orders of magnitude is an important characteristic of this growth process [20,21]. The phase behavior of these triblock copolymers in water is particularly dependent on temperature and the relative block size [22]. Furthermore, at higher concentrations and temperatures, these copolymers tend to form a numerous variety of lyotropic liquid crystals [23,24].
The selection of a Pluronic as the best delivery system seems to be dependent on the drug involved [18]. There is now a great choice in the literature, depending on the drug solubility and the release properties of Pluronics [19]. Nevertheless, only a few studies have examined micellar structure changes of Pluronic micelles on the uptake of drug molecules [7,8,9,10,19].
Particularly, P104 amphiphilic triblock copolymer has been one of the most investigated copolymers among the Pluronic family due to its rich versatility [25,26,27,28,29,30,31]. It is considered as a potential candidate for drug delivery [10,32,33,34], for solubilization and encapsulation [35,36,37,38,39], emulsification [40,41,42,43,44], as well as a template for the elaboration of organosilicon mesostructures [28,29,45,46].
All these applications require fine control of the different copolymer structures and the transitions between them. Thus, several studies have dealt with many aspects of the P104 properties, including its self-assembly [47,48,49,50,51,52], its overall structure [53,54,55] as well as the core and the corona morphologies [37,54,56,57,58]. The interactions between the core and the corona and the surrounding aqueous phase (hydration) was also investigated particularly in the diluted case [59]. Some aspects of the rheology of P104 copolymer were also investigated in the concentrated regime. These investigations were carried out using numerous methods including light scattering [37,55,60], neutron scattering [61,62], IFTR [63,64,65], fluorescence [55,66,67,68], and calorimetry [55,69]. Yet, since P104 is a commercial copolymer, its properties are affected by impurities as well as PPO and PEO polydispersities. Therefore, these studies should be performed on the same batch of polymer in the same state.
Small-angle neutron scattering (SANS) measurements have been used to study structural changes in a series of Pluronics, including P104, a moderately hydrophilic ethylene oxide–propylene oxide triblock, upon addition of increasing amounts of the drug ibuprofen, showing that the addition of ibuprofen to P104 reduces the CMT from approximately 20 °C to below 13 °C [19]. Scattering and rheology studies on micellar characteristics of P104 in the presence of anthranilic acid (AA) revealed important variations by changing the pH solution [70]. Furthermore, P104 has also been used in the study of dynamics between Pluronic micelles and liposomes for the vectorization of hydrophobic molecules using a fluorescence technique [11]. The exchange dynamics between both of them, studied at different liposome concentrations, were demonstrated to be a collective mechanism characterized by presenting two rate constants: one rate independent of liposome concentration and the second one with dynamics linearly dependent on liposomes concentration [11].
The aim of this work is to present a detailed study of the formation of micellar structures and morphology of PEO27–PPO61–PEO27 Pluronic (P104) in aqueous solution. This study was performed in the dilute and semi-dilute regions using rheology, dynamic light scattering (DLS), polarized light microscopy, densimetry (ρ), sound velocity (Us), viscosimetry, rheometry, and turbidimetry measurements. With the obtained results, it was possible to determine the transition zones between monomers and micelles, i.e., where P104 monomers are in thermodynamic equilibrium with P104 micelles, followed by the formation of spherical micelles (CMT), the sphere-to-rod micellar transition (GMT), the cloud point temperature (CPT), soft gel and hard gel transitions, as well as the liquid crystalline behavior. Here we report a phase diagram including information for P104 concentrations from 1 × 10⁻⁴ to 90 wt.% and temperatures from 20 to 75 °C that will be helpful for further studies, applications and interaction studies with hydrophobic molecules, or active principles for drug delivery.

2. Materials and Methods

2.1. Triblock Copolymer P104/H2O Solutions Preparation

Triblock copolymer, Pluronic® P104 [(PEO)27–(PPO)61–(PEO)27] was obtained from BASF and was used as received. This Pluronic® has a Mw = 5900 kg/mol. Water was drawn from a Millipore Milli-Q purification system.
Samples were prepared by weighing suitable amounts of P104 and water in 50 mL glass vials within a concentration range from 1 × 10⁻⁴ to 90 wt.%. Each sample was left at the temperature of measurement during 24 h to reach the equilibrium. The glass vials were covered with aluminum foil to prevent light degradation of P104 solutions.

2.2. Crossed-Light Polarized Microscopy

P104 samples with concentrations from 20 to 95 wt.% were observed with an Olympus BX51 light polarizing microscope (Olympus, Tokyo, Japan) with an objective of 4× and a Q Imagine Camera (Meyer Instrument, Houston, TX, USA) or a Leica DMLM polarizing microscope (Leica Microsystems, Wetzlar, Germany) with an objective 4× and a 3.0 MP Moticam (Kowloon, Hong Kong), between crossed polarizers at different temperatures. The samples were placed on a glass slide and covered with a cover slip, previously cleaned with ethanol, and carefully washed in distilled water.

2.3. Viscosity Measurements

An automatic viscometer AMVn from Anton Paar (Graz, Austria) was selected to carry out viscosity measurements for P104 concentrations from 1 to 20 wt.% at temperatures from 10 up to 50 °C. Measurements were performed from the highest temperature to the lowest temperature. The temperature sweeps were performed by taking viscosity values every two degrees in the temperature range from 50 to 10 °C. The sample was stabilized during 5 min at each temperature change. All samples were analyzed at different inclination angles, i.e., 30°, 50° and 70°; and 5 replicates were performed for each sample. The temperature dependence of the dynamic viscosity (η0) of P104/water samples was analyzed by the Andrade-Eyring equation [71]:
η0 = A × e(B/RT)
where A and B are empirical constants in this equation. B value may represent the energy (kJ/mol) necessary for the fluid to start to flow.

2.4. Density and Ultrasound Velocity Measurements

Density and ultrasound velocity measurements were simultaneously, automatically, and continuously measured using an Anton Paar DSA 5000 densimeter and a sound velocity analyzer. The equipment consists of two cells for density measurements and another for the speed of sound. The temperature constant was maintained within ±1 × 10⁻³ K using the Peltier method. Density and ultrasound measurements reproducibility are ±1 × 10⁻⁶ g/cm3 and ±1 × 10⁻² m/s, respectively. Density and sound velocity are measured using the vibrating tube method. P104/water solutions in a concentration range from 1 × 10⁻⁴ to 15 wt.% were placed in a venoclysis-type syringe and were subsequently injected into a chamber inside the hydrometer, letting the solution rest for 10 min to eliminate all bubbles. Experiments were programmed to perform measurements in a temperature range of 5 to 60 °C. At the end of each experiment the hydrometer chamber was washed with alconox solution, to clean all residues and avoid errors in subsequent measurements. The densimeter was calibrated with HPLC water.
The experimental measurements of density and sound velocity are used to calculate the apparent molar volume (Vϕ) and the apparent molar adiabatic compression (Kϕ), which were determined by using the experimental values obtained for P104 solutions density and sound velocity. Equations (2) and (3) were used to calculate Vϕ and Kϕ, respectively [72]. Apparent (molar) properties are not constants, even at a given temperature, but are functions of the composition.
Vϕ = [(Mws) − ((ρsρw) × 103)/(m × ρs × ρw)]
Kϕ = [((βsβw) × 103/(m × ρw)) + (βs × Vϕ)]
where ρs is the solution density (g/cm3) at the corresponding molality m, ρw is the solvent density, and Mw is the molecular weight of the solute (g/mol); βs and βw are the adiabatic compressibilities of P104 solution and the solvent, respectively, and are given by Equations (4) and (5).
βs = [(10−3)/(U2s × ρs)]
βw = [(10−3)/(U2w × ρw)]
where Us and Uw correspond to the sound velocities of the solution and solvent, respectively, in m/s.
From density and ultrasound velocity measurements, the hydration number was determined by using the following equation:
nH = lim(nd → 0) (nw/nd) × (1 − βs/βw)
where nH is the hydration number, nw and nd are the moles of water and moles of solute, respectively, βs and βw are the adiabatic compressibility of the solution and of pure water, respectively [73].

2.5. Dynamic Light Scattering Measurements

Dynamic light scattering (DLS) measurements were carried on in a Malvern Zetasizer 5000 instrument equipped with a 7132 multibit correlator and multiangle goniometer (Malvern Panalytical, Malvern, UK). The light source was a laser of He–Ne (5 mW) having a wavelength of 632.8 nm. The light-scattering intensity of P104 samples was measured through a 400 μm pinhole. The correlation functions were averaged over 60 s for 5 measurements in the equilibrated sample. DLS measurements for P104 were performed at the following angles: 45°, 90°, and 135°, in the temperature range from 10 up to 64 °C.

2.6. Turbidity Measurements

Temperature variations of the turbidity of the amphiphilic block copolymer P104 solutions were monitored by employing a Turbidity Measuring Module Haze QC ME from Anton Paar using a wavelength of 650 nm ± 30 nm (MEBAK- and EBC-compliant) and cell with adjustable constant temperature; measurements were performed in the temperature range from 5 to 40 °C, stabilizing the temperature with an accuracy of 0.001 °C.

2.7. Rheometry

The rheological behavior of P104/water system was studied using a rheometer AR-G2 from TA Instruments (New Castle, DE, USA). Two different geometries were selected depending on P104 solution concentration: (i) for P104 solutions with concentrations between 1 and 25 wt.%, a titanium cone with diameter of 60 mm and an angle of 1° was used; (ii) for P104 solutions with concentrations higher than 25 wt.% and up to 60 wt.%, a steel cone geometry with a diameter of 40 mm and an angle of 2° was used. Both geometries were used with a humidity controlling chamber to avoid evaporation of the samples.
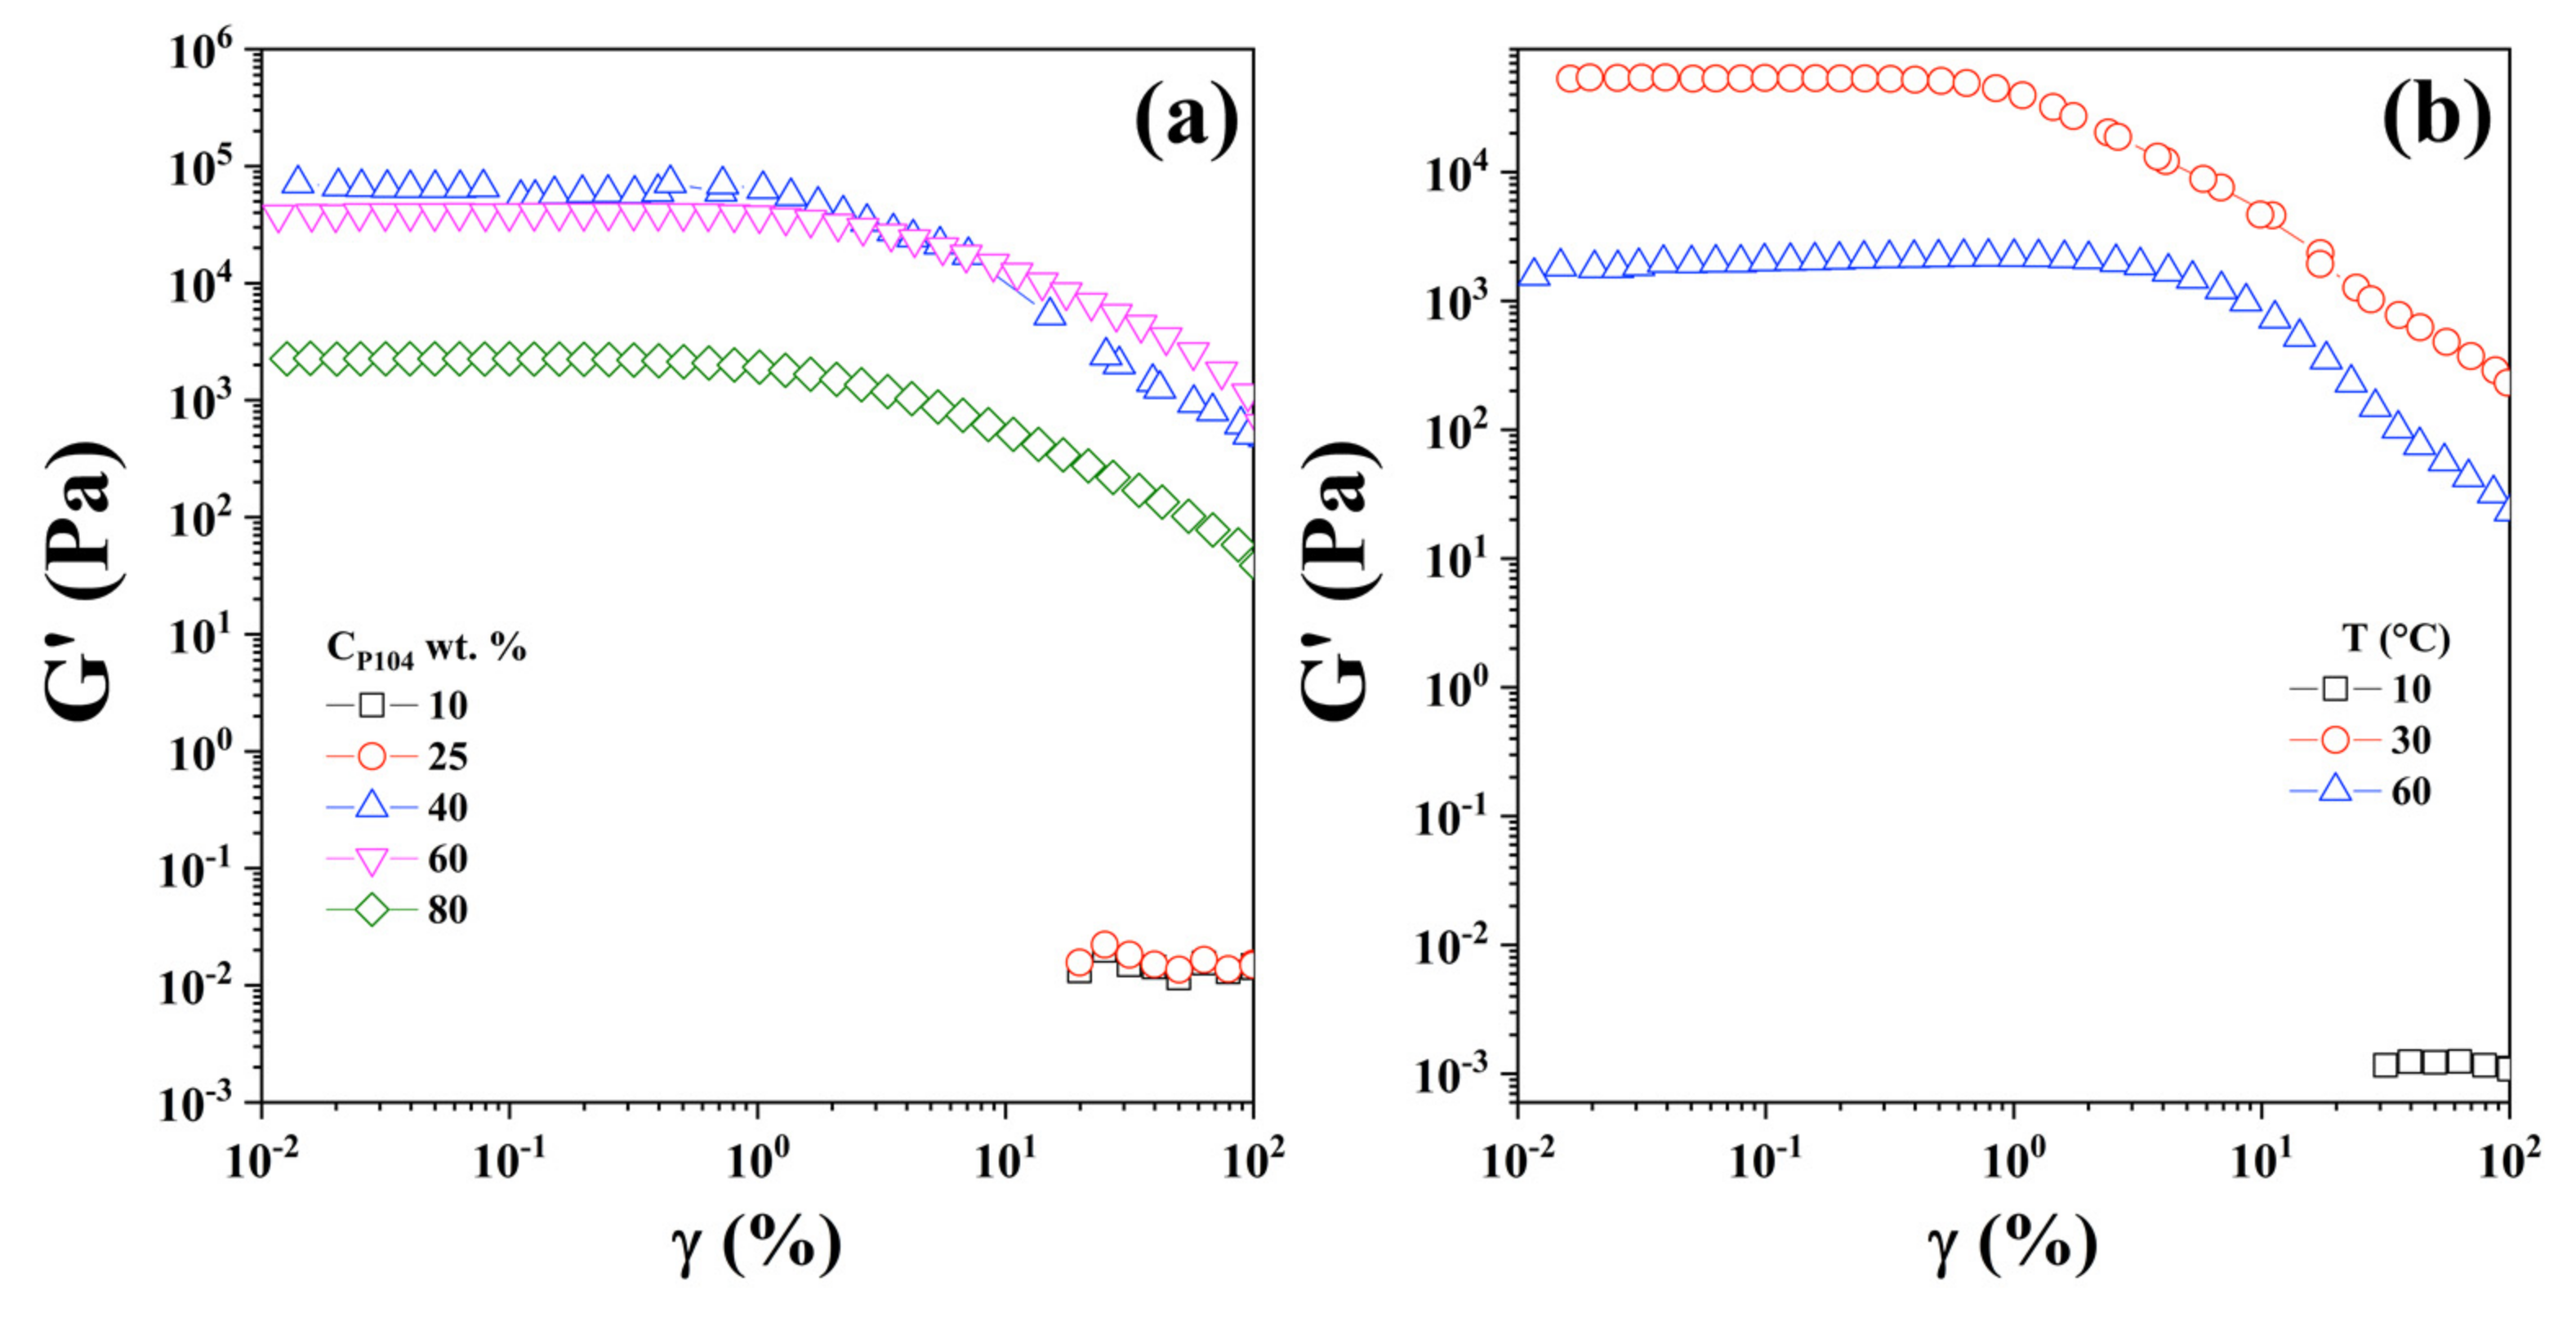
  • Strain sweeps: in order to obtain the linear viscoelastic regimes, the oscillation strain sweeps were performed at a controlled angular frequency of 10 rad/s in a strain range between 0.1% and 100%, using 10 points per decade. A strain sweep was performed for each P104 sample at a selected temperature depending on the chosen concentration.
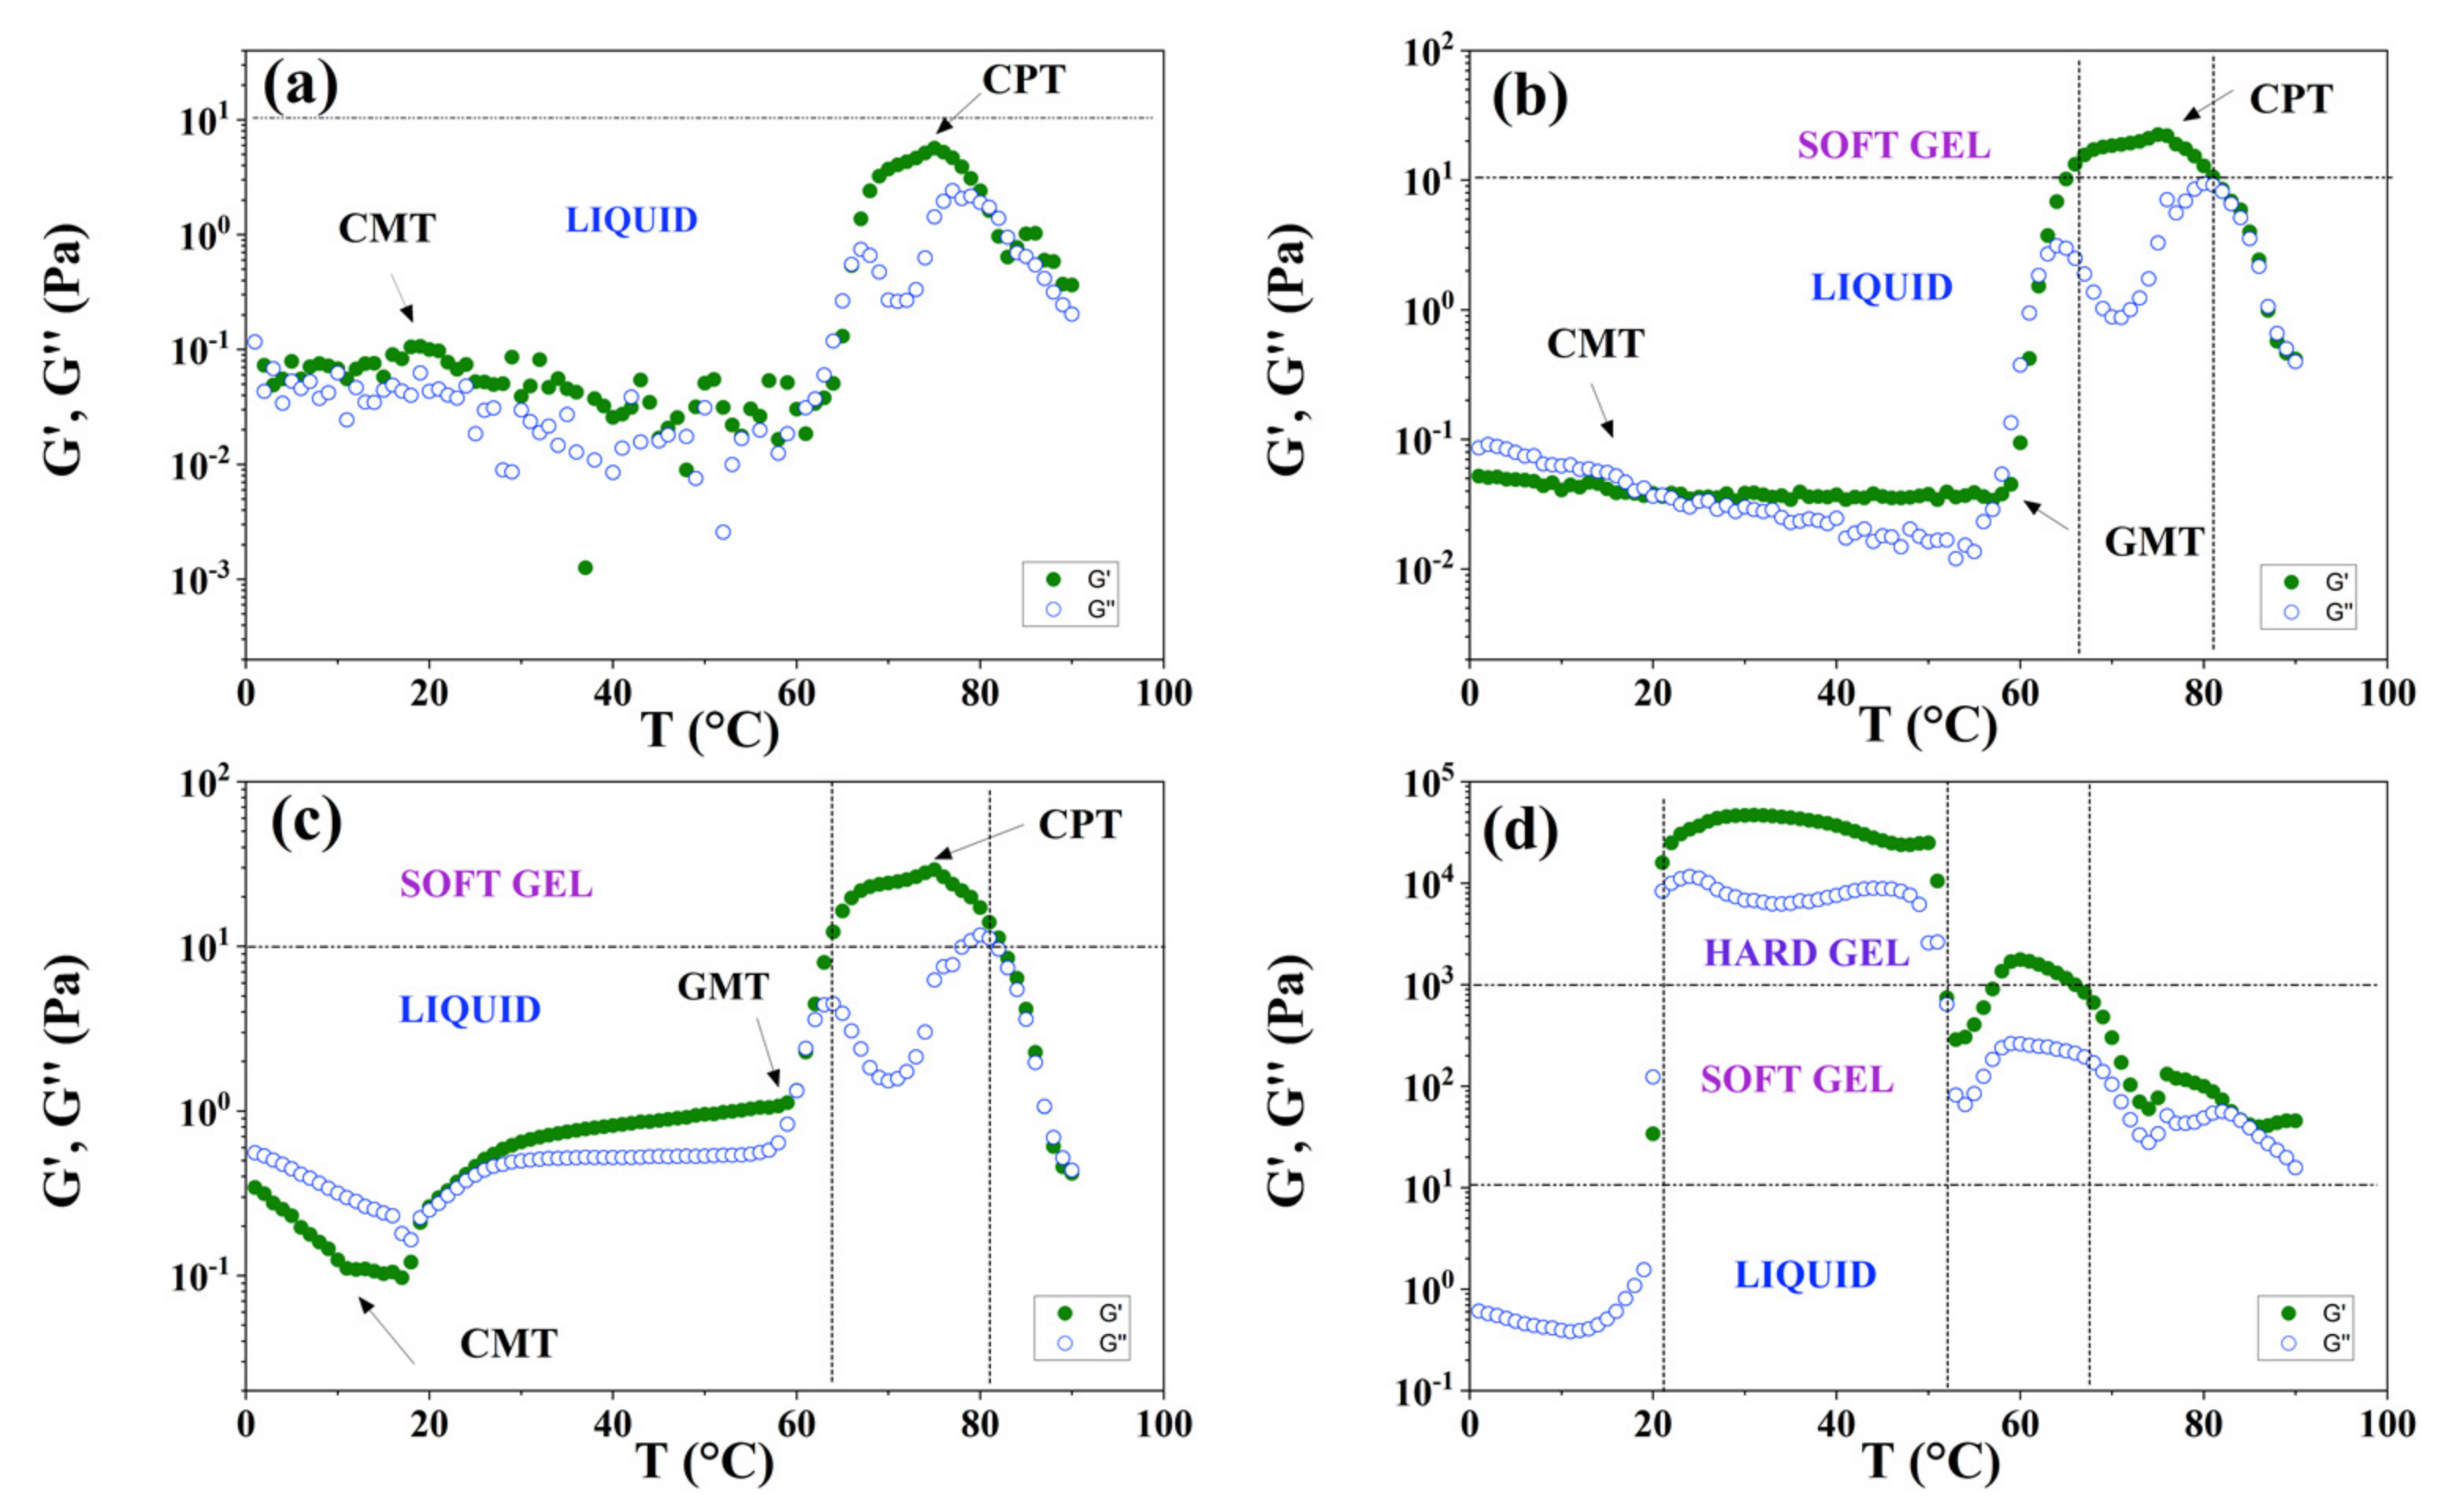
  • Temperature sweeps: these sweeps were performed for each P104 sample using a strain value in the linear viscoelastic region, selected from previous experiments, applying an angular frequency of 10 rad/s in a temperature range from 1 to 90 °C, with a heating rate of 1 °C/min.

3. Results and Discussion

3.1. Visual Observations

Since P104 is quite soluble in water, we monitored the visual changes exhibited by the samples at different temperatures and triblock concentrations. For concentrations and temperatures lower than 20 wt.%, and 60 °C respectively, all the samples are transparent and exhibit a liquid-like behavior. At temperatures around 60 °C, i.e., 3 wt.% sample (see Figure S1a in Supplementary Materials) becomes bluish and slightly whitish and exhibits birefringence when it was shaken and observed through crossed polarized plates. This transition temperature can be associated with the onset of the micellar growth temperature (MGT) were the spherical-to-rod micellar transition appears. As soon as the sample temperature increases, the whiteness increases up to about 70 °C, when a separation phase is detected. This transition may be due the onset of the cloud point temperature (CPT) [70,74]. At higher concentrations, i.e., sample of 20 wt.% it exhibits a similar trend to the more diluted sample (see Figure S1b in Supplementary Materials), but some differences were detected; about 60 °C where the MGT appears the sample exhibits a gel-like behavior. This may be due to the growth of the rods, which forms worm-like micelles with very long length; moreover, the birefringence induced by shear becomes stronger, and the CPT moves at higher temperatures (75 °C). On the other hand, for samples more concentrated (see Figure S1c in Supplementary Materials), i.e., 50 wt.% the sample turned whitish, and the gel-like behavior was detected at about 50 °C; the whitish intensity decreases as temperature increases up to about a temperature of 70 °C when a second white phase appears due the onset of the cloud point temperature. In this temperature interval (50–70 °C), the sample exhibits static birefringence when it is observed through crossed polarized plates. In order to identify the microstructure, the sample was analyzed by polarized light microscopy; the textures observed are typical of the hexagonal phase (see Figure S2 in Supplementary Materials) [53,75,76].

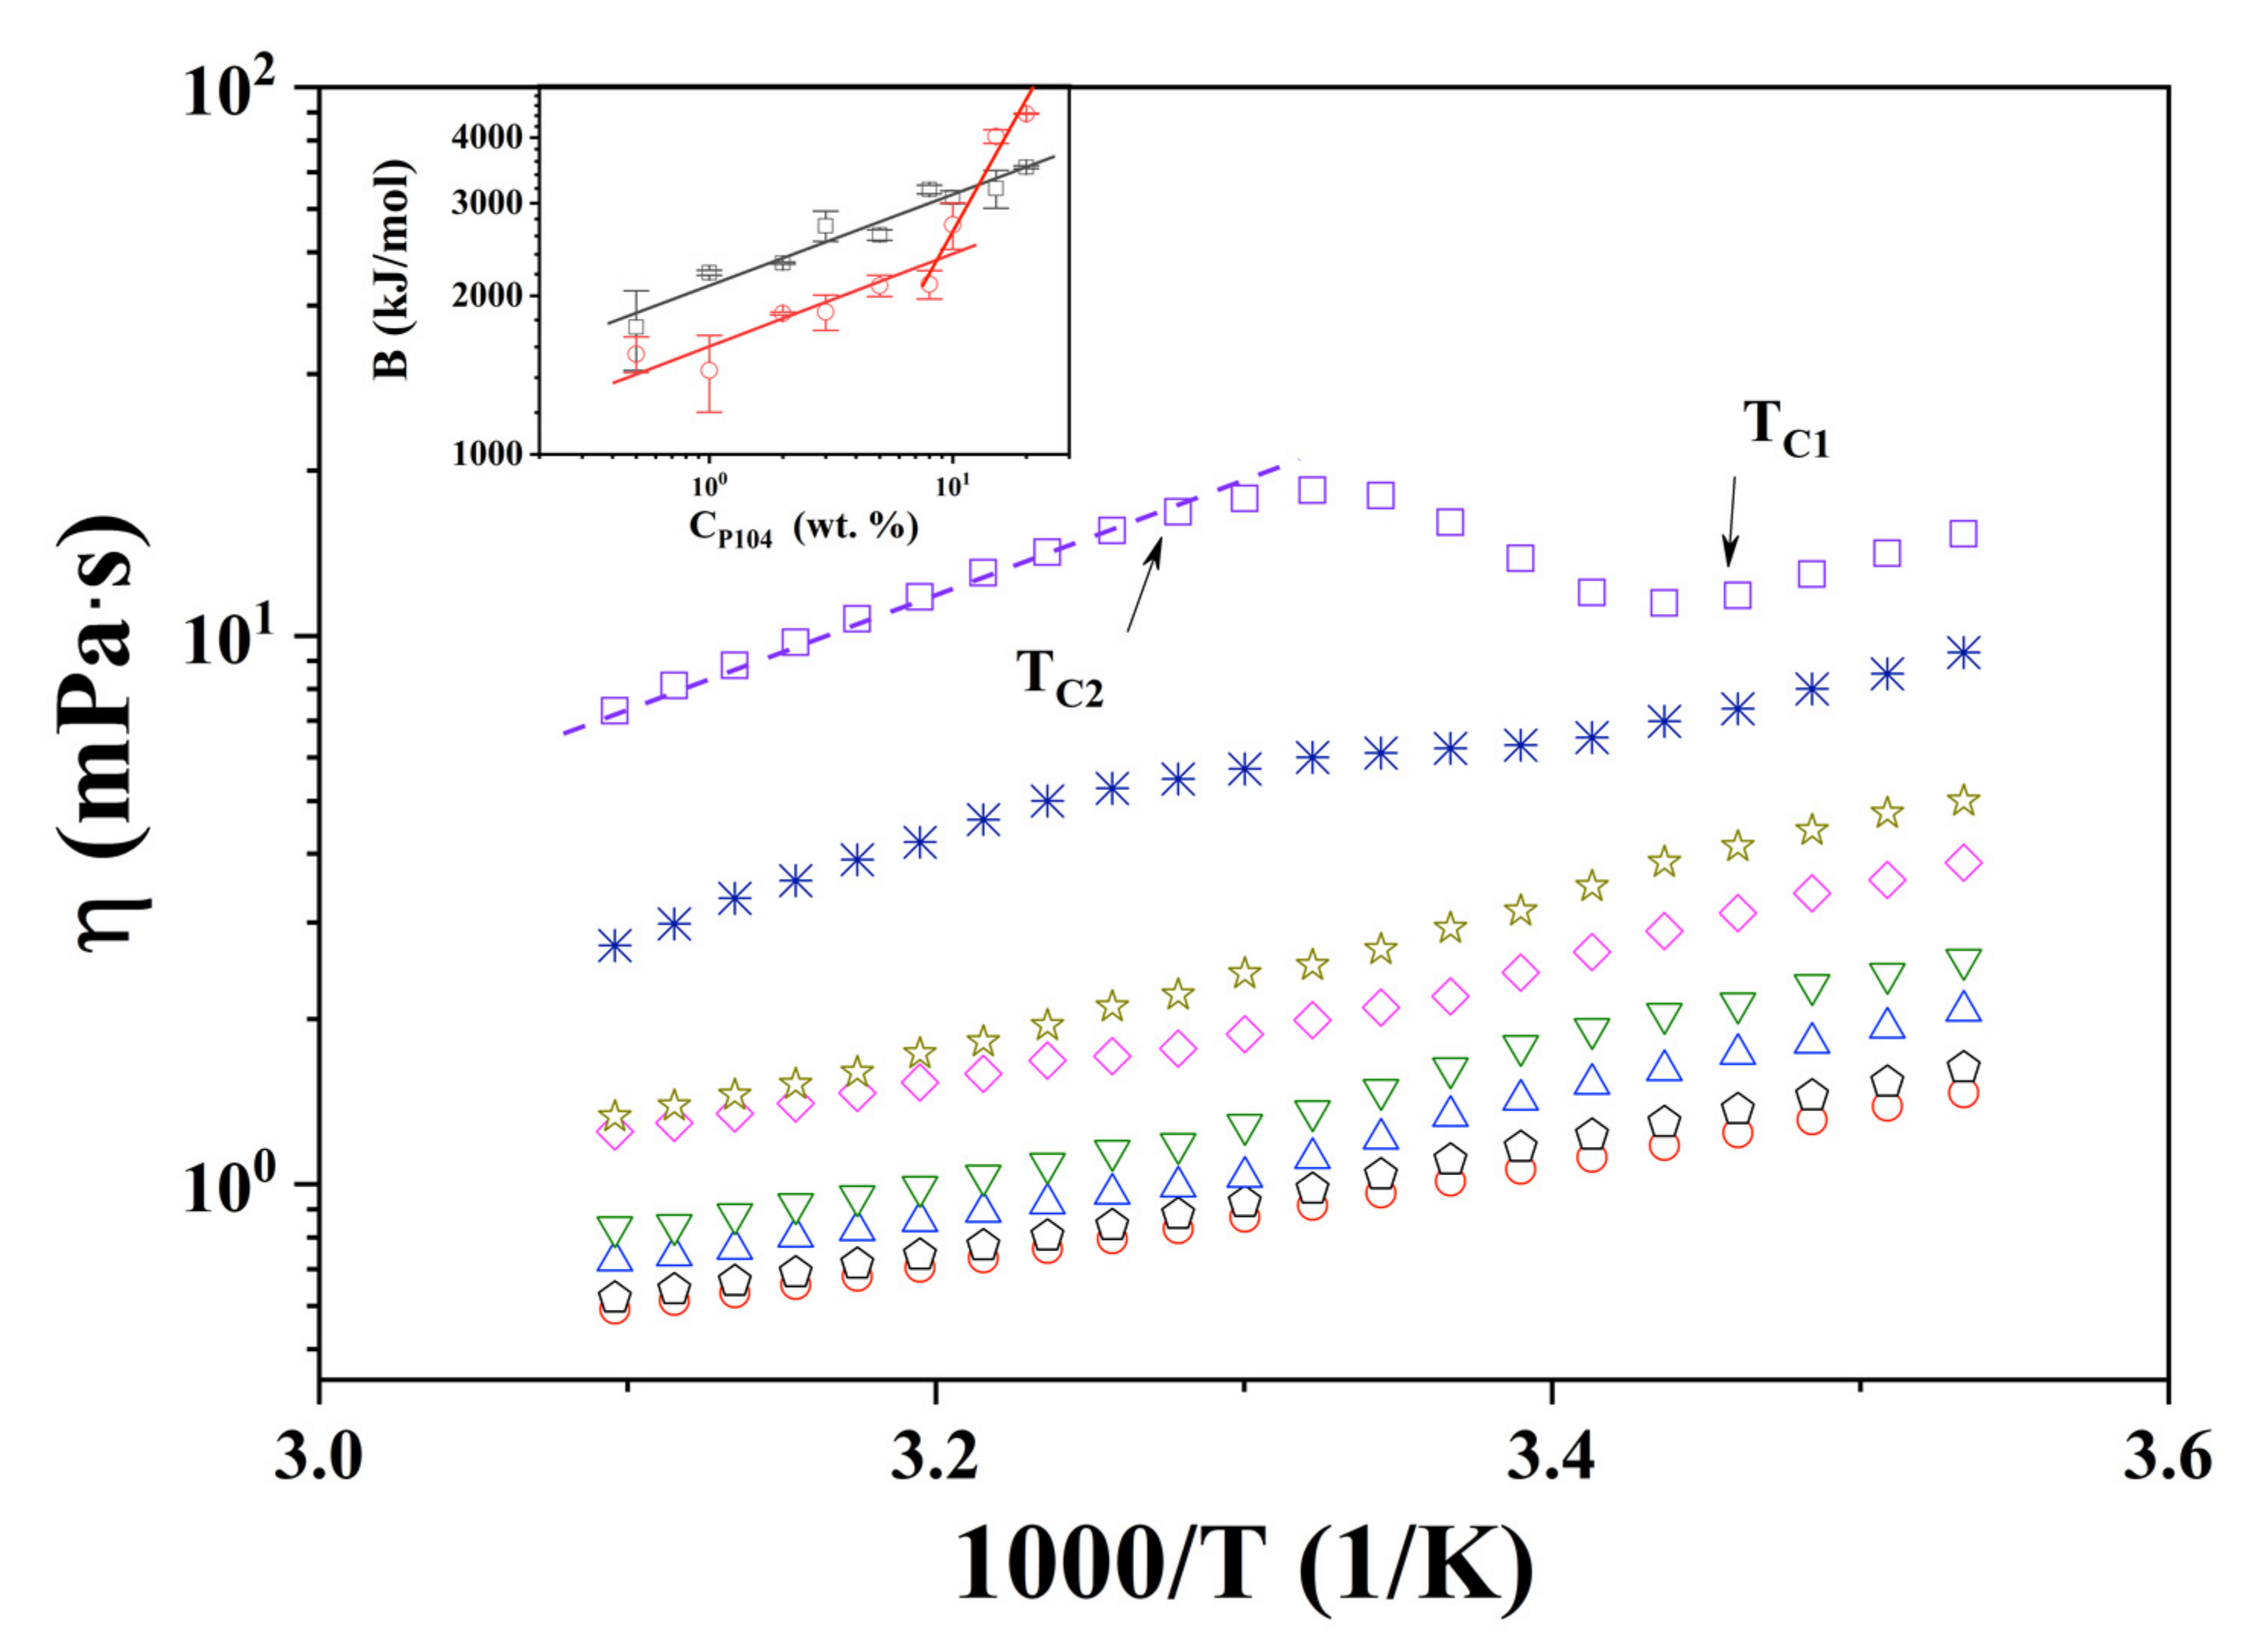
3.2. P104 Micellization in Water Evaluated through Viscosity Measurements

The effect of temperature on the viscosity (η) of P104 samples was analyzed in order to detect and validate previously observed phase transitions and structural changes determined by visual observations. Measurements were performed at three different angles; viscosity data obtained were independent of the angle value used (shear rate), this means that at this concentration and temperatures range studied, samples exhibit a Newtonian behavior. Figure S3 (see in Supplementary Materials) presents the obtained results for the viscosity of P104 solutions as a function of the temperature at the following CP104: 1, 2, 3, 5, 8, 10, 15 and 20 wt.%. As expected, an increase in viscosity is observed with the increase on P104 concentration [77]. On the other hand, it is evident that log η decreases linearly as temperature increases up to a temperature interval where viscosity curves exhibit an inflexion, and then at higher temperatures log η decreases linearly again. In this Figure S3 (see in Supplementary Materials), one can observe that the inflection slope exhibits a change from negative to positive at concentrations higher than 10 wt.%. Figure 1 shows the log η as a function of the reciprocal of absolute temperature for the same samples. It can be observed that all curves exhibit three zones. In the first (I) and third (III) zones, which were detected at lower and higher temperatures respectively, data follow the Andrade-Eyring equation. The parameters A and B of Equation (1) were fitted to the viscosity data for each P104 concentration using least squares regression. Values of A and B parameters are shown in Table 1. The temperature value where the inflexion starts (I–II) moves at lower temperatures as surfactant concentration increases; these critical temperatures (TC1) are related to the onset of formation of spherical micelles when unimers start to aggregate and form spherical micelles (CMT) due to the increase of temperature and the dehydration of PPO segment. In contrast, the ending temperature values (II–III) of the second zone remains constant (~34 °C); these temperatures (TC2) are related to the end of the micellization [72,78]. Furthermore, the interval of temperatures ΔT (=TC2 − TC1) increases as triblock copolymer concentration increases; in this ΔT spherical and monomers coexist. TC1 and TC2 values for each concentration are shown in Table 2. It is possible that the inflection in viscosity is due to two contrary overlapping temperature effects: the first one the diminishing of viscosity due the temperature increment and second one the increasing viscosity due to the formation of spherical micelles induced by temperature (T ≥ CMT). For P104 concentrations ≤ 10 wt.%, it seems to be that the first effect is higher than the second one. For higher concentrations, it is evident that viscosity augments as temperature increases; in this case the increment in temperature and concentration causes an increment in the number of micelles, which produces an increasing viscosity that is larger than that the decreasing of viscosity due the augment in temperature. This effect can be seen in Table 1 where values for BI and BIII are shown. It is clear that BI is larger than BIII for samples with CP104 ≤ 10 wt.%; at higher concentrations, BIII values are bigger than BI.
The dependence of log BI and log BIII as a function of log CP104 are shown in inset in Figure 1. Here it can be seen that BI, obtained for temperatures lower than TC1 (CMT), exhibits a linear dependence with CP104 with a power of 0.17 ± 0.02 (kJ/mol). On the other hand, BIII, obtained at temperatures higher than TC2, the curve shows a change in the slope at a concentration of about 9 wt.% from 0.14 ± 0.03 to 0.77 ± 0.12. This may be due to the increase in the concentration of micelles and the interaction between micelles corona begins, which produces a greater increase in viscosity, and the beginning of the gel like behavior.

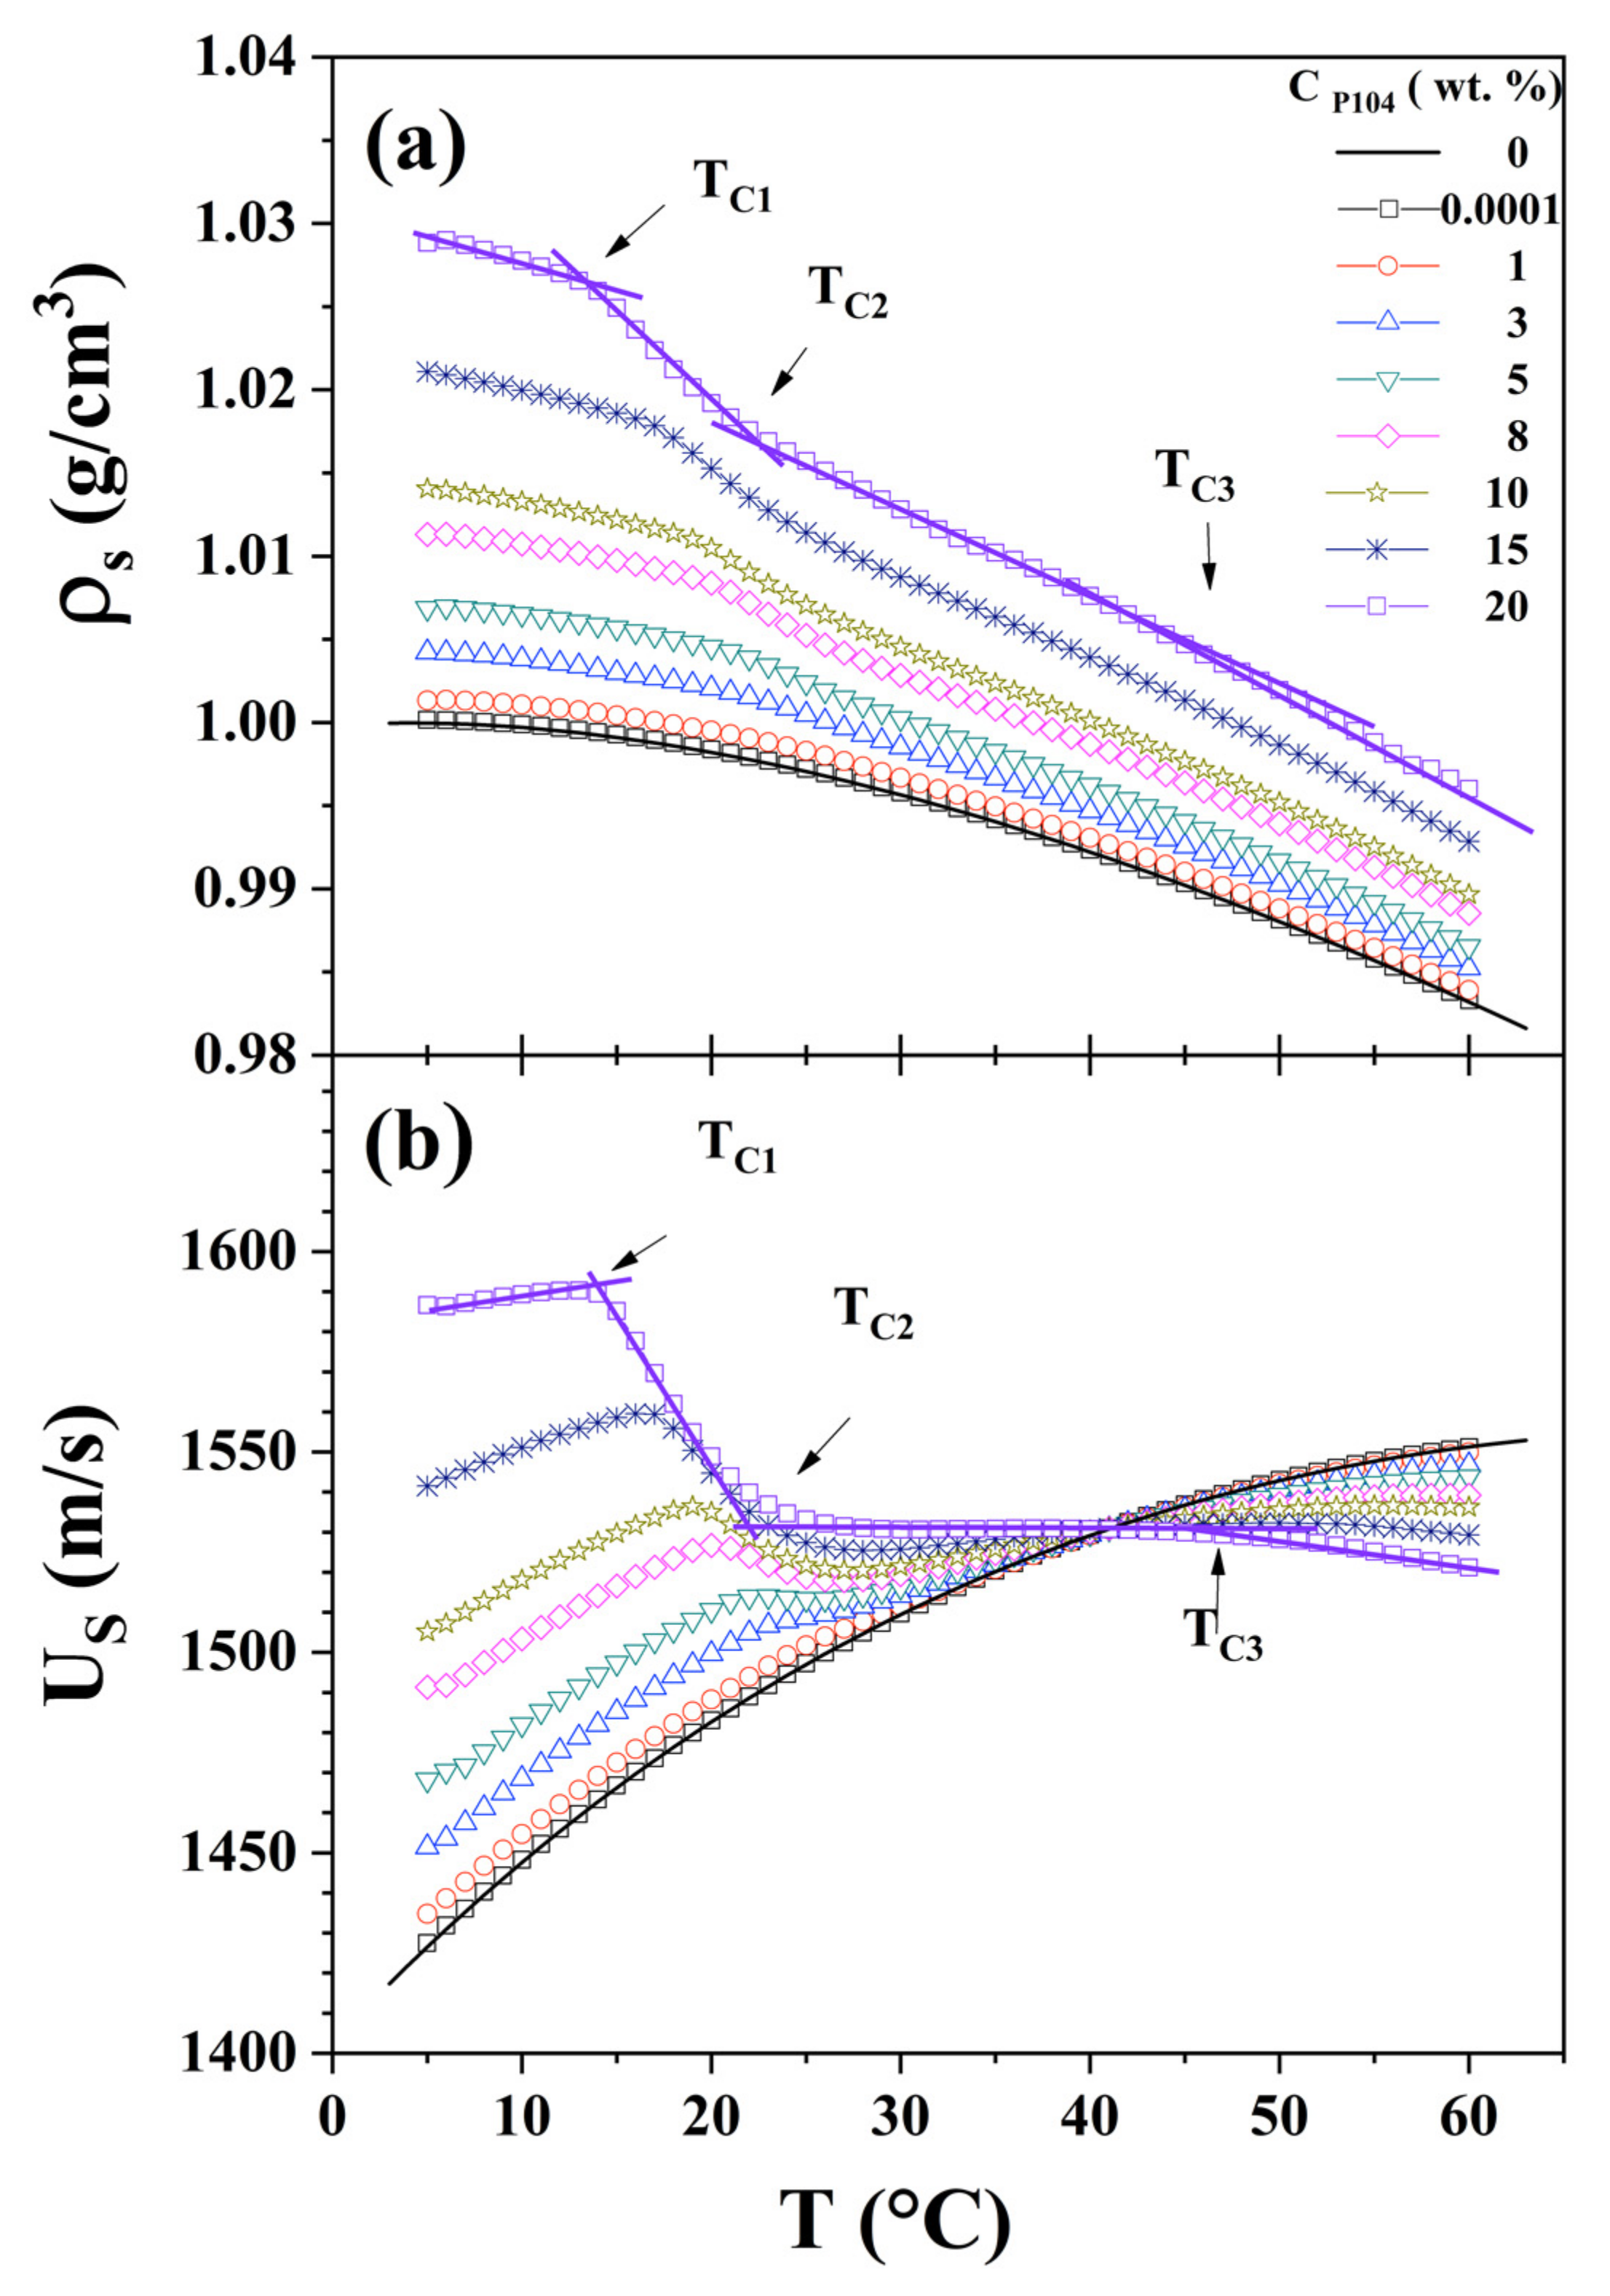
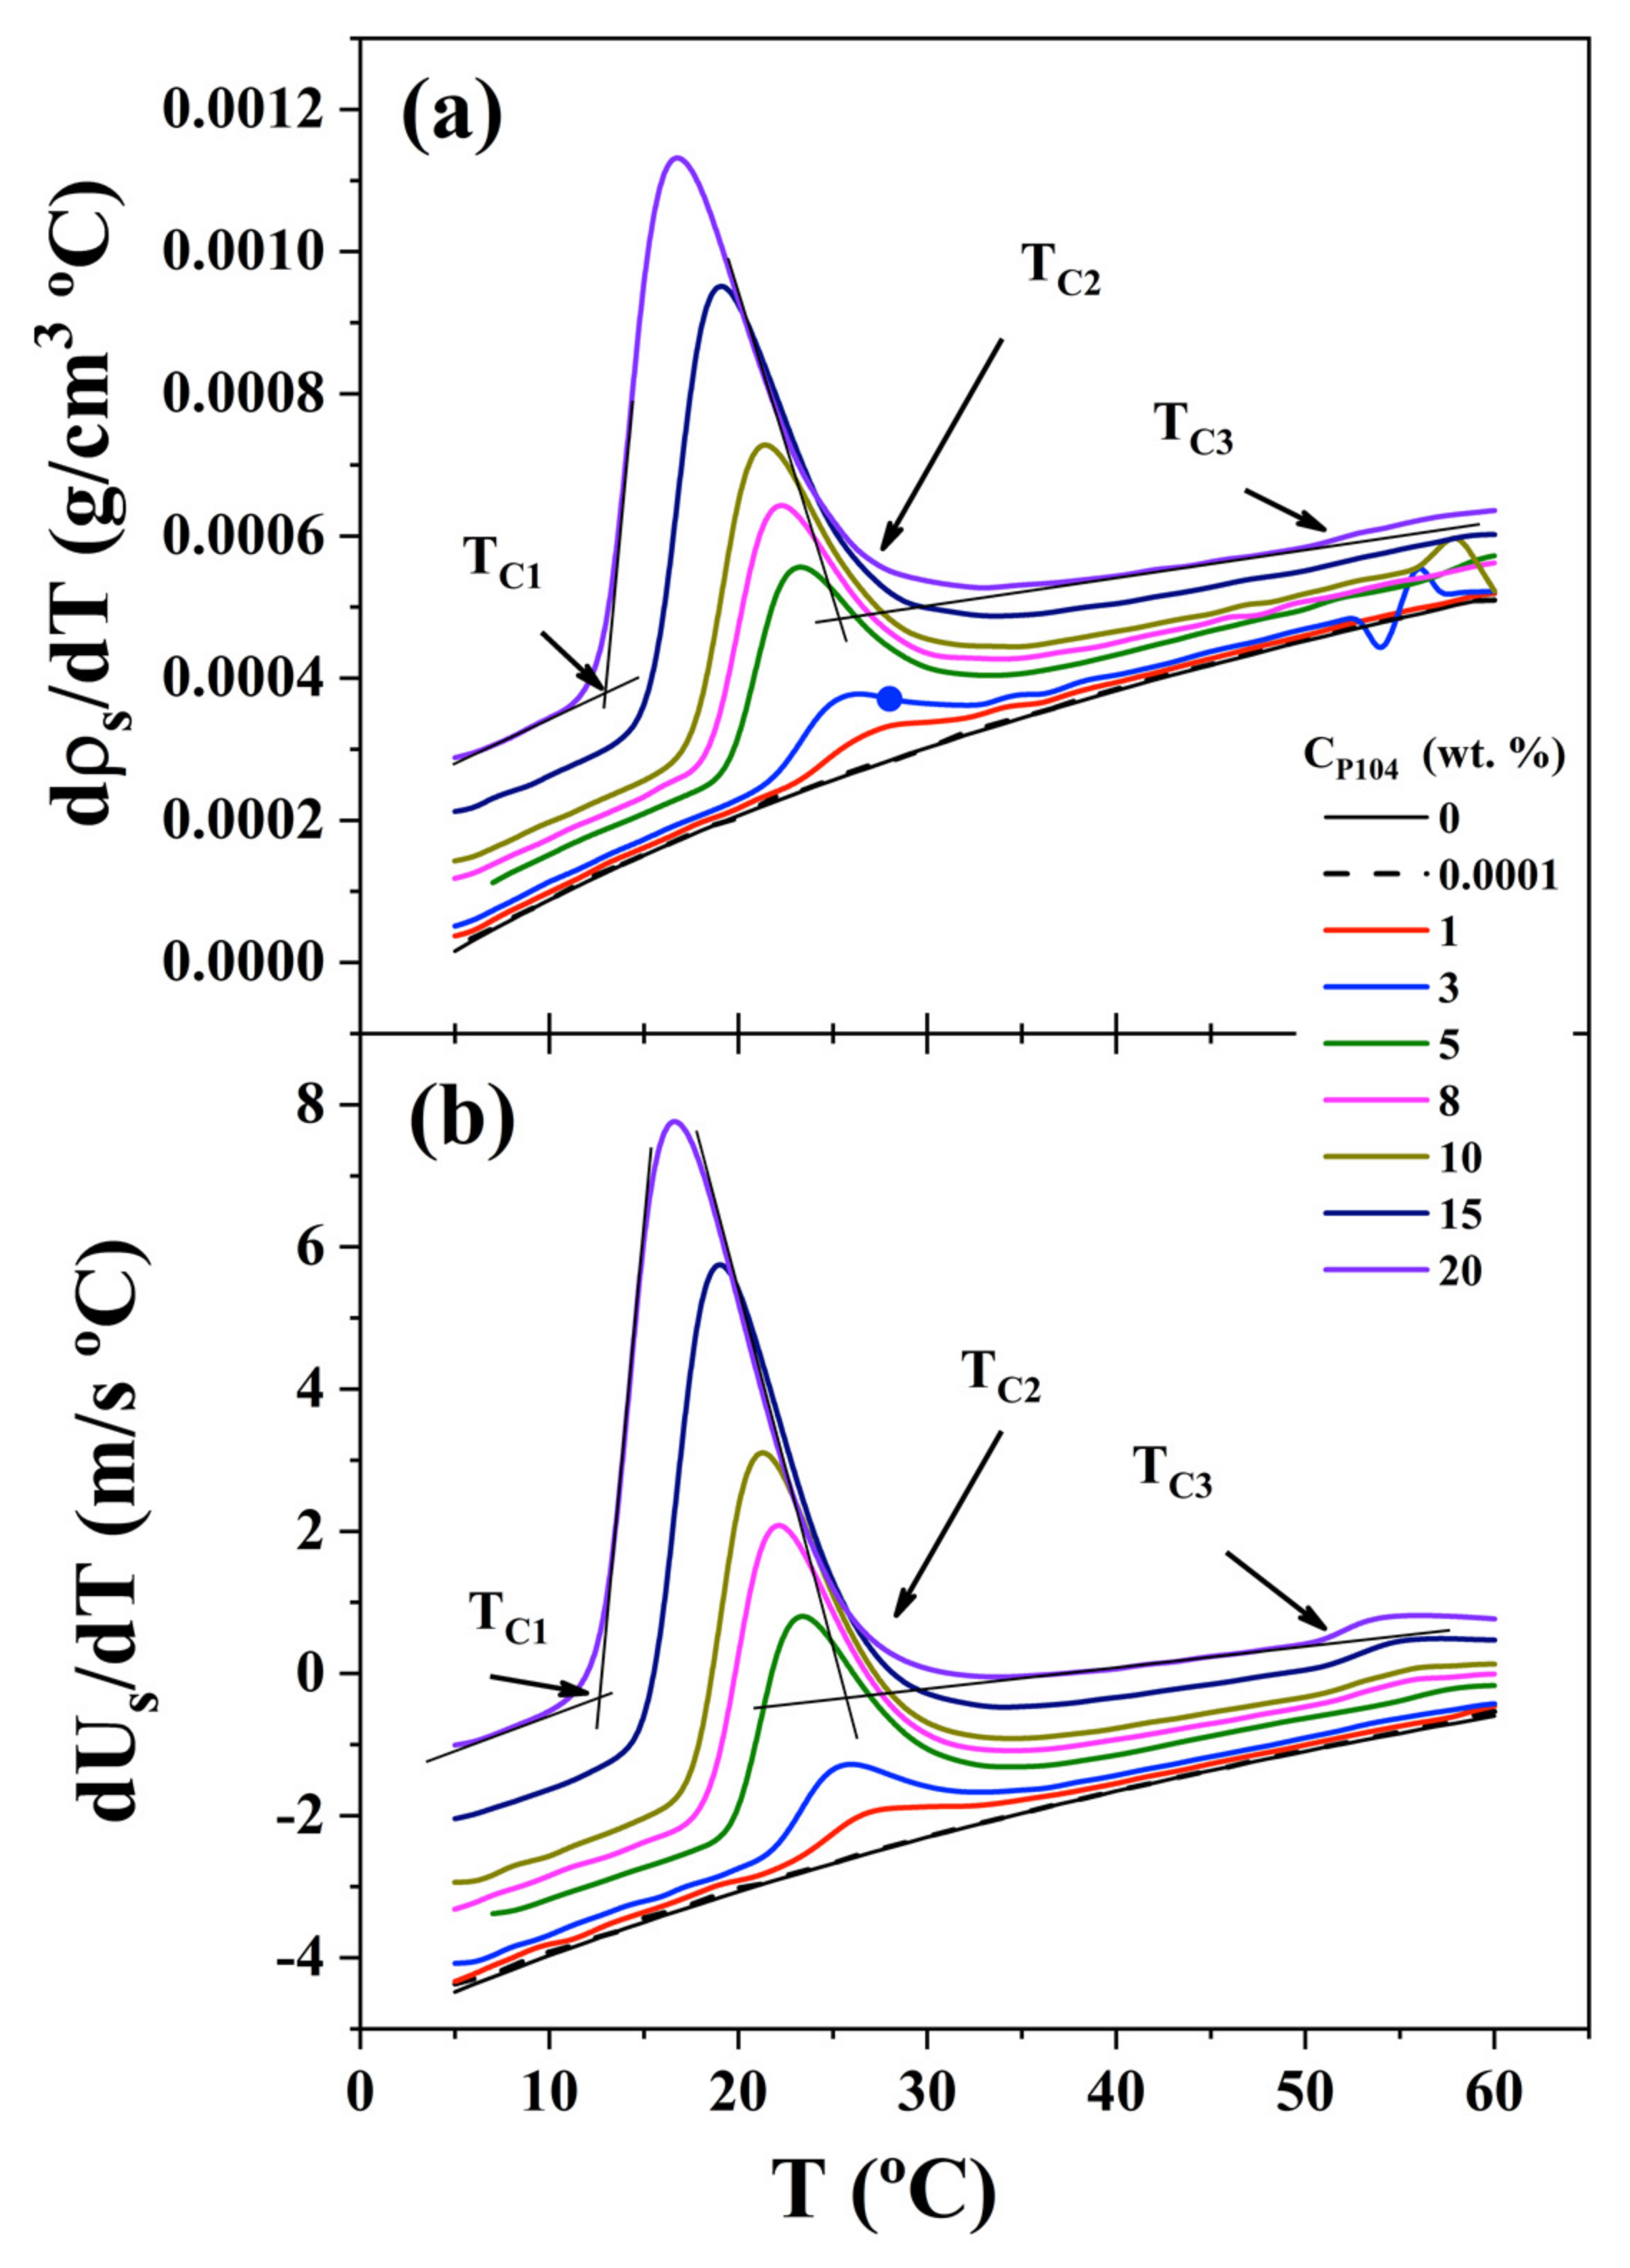
3.3. P104 Micellization Process Studied through Density and Sound Velocity Measurements

The study of the dependence of density and sound velocity with concentration and temperature gives information about structural changes in triblock copolymers aqueous solutions. With the obtained data, it becomes possible to determine critical concentrations, the regions where only unimers of amphiphilic block copolymers exist, the formation of spherical micelles (CMT) as well as their maximum formation rate, the sphere-to-rod-like micelle transition (GMT), and the cloud point temperature (CMT) [72].
Figure 2a shows the behavior of P104 density (ρs) as a function of temperature for several CP104. In this figure it is possible to observe that density increases as P104 concentration augments and decreases with temperature up to a critical temperature value, where a more pronounced decrease is evident. Furthermore, this critical temperature shifts to lower temperature while increasing P104 concentration. A second critical temperature is detected, where density starts decreasing monotonically with temperature. These critical temperatures values are in good agreement with those detected by dynamic viscosity measurements, which correspond to TC1 and TC2, respectively. This behavior was reported elsewhere for P103/water [72] and P94/water [78] systems. This transition is then attributed to the critical micellar temperature (CMT). TC2 on the other hand, as was described in viscosity measurements, indicates the finishing of the spherical micelle formation, this temperature transition moves to lower temperatures as concentration increases [72,78]. This transition is 1 °C lower than that obtained with viscosity measurements. In this temperature interval (TC1–TC2), P104 monomers and micelles coexist, besides (TC1–TC2) becomes broader as P104 concentration decreases. At higher temperatures, a third transition is detected (TC3), which coincides with the growing micellar transition (GMT), which was detected by visual observations. This means that in this temperature interval (TC2–TC3) samples are formed only by spherical micelles [72].
Figure 2b depicts the dependence of P104 sound velocity (Us) with temperature for several P104 concentrations. It is evident in this figure that at low temperatures for all samples the sound velocity increases as temperature increases, the same trend as that of water, and then a transition is detected as was observed in density measurements, such as in density measurements. Sound velocity data exhibit three critical temperatures, TC1, TC2, and TC3, both TC1 and TC2 shift to lower temperature values as P104 concentration increases and is nearly the same as the value determined through density measurements (see Table 1). On the one hand, TC3 is independent of P104 concentration. Moreover, these transition temperatures are sharper than that detected by density measurements, this is due to the fact that sound velocity measurements are more sensitive at structural transitions [72]. At temperatures lower than TC1, the presence of P104 unimers in the solution increases with P104 concentration, so sound velocity increases also. However, at the onset of micellization, P104 unimers begin to aggregate due to the increase of temperature and the dehydration around the PPO segments. This phenomenon results in a drop of sound velocity produced by the diminution on the number of effective particles in the solution [72]. This transition is associated with the critical micellar transition (CMT) [72]. At temperatures below the micellization boundary (CMT), amphiphilic block copolymers exist as individual molecules in solution, i.e., unimers. Then, beyond the micellization border, micelles coexist in equilibrium with unimers [55]. The obtained values are in good agreement with other literature reports [2]. After the transition temperature, since CP104 and temperature increase, the size of the micellar aggregates also growths, resulting in stronger interactions among them and in the decrease in their number density, producing the decrease of the sound velocity values. This causes the sound velocity curves for all P104 concentrations studied to cross the water curve and then become lower than that of water at a temperature about 40 °C [72]. The Uw-Us difference increases as P104 and temperature augments. In order to detect the transition temperatures values, derivatives of ρs and Us were obtained.
Figure 3a,b, depict −s/dT) and −(dUs/dT) respectively as a function of T. In the one hand, plot of −(s/dT) against temperature shows a sharp peak between TC1 and TC2; it is evident that the peak moves at lower temperatures with increasing P104 concentration, indicating that the temperature of the onset of formation of micelles CMC (TC1) moves at lower temperatures as was observed by dynamic viscosity measurements; moreover, the GMT (TC3) is clearer in Figure 3a than that in Figure 2a. The peaks may be representing the rate of spherical micelles formation and then the maximum represents the highest rate micellar formation. On the other hand, −(dUs/dT) versus temperature in Figure 3b, depicts a similar trend to −s/dT against temperature. The three critical temperatures are detected; however, the critical temperature TC3 is more evident in this case.
Then, Equation (3) was used to calculate the apparent molar adiabatic compression (Kϕ), which is directly related to the apparent molar volume (Vϕ). The apparent molar adiabatic compressibility (Kϕ) was inspected as a function of temperature for P104 solutions with different concentrations (see Figure S4a in Supplementary Materials). Two linear regions with a sharp increase with temperature are identified in all the curves. First onset is directly related to the CMT, as previously described. First derivative of Kϕ was then determined as a function of temperature (see Figure S4b in Supplementary Materials). A sharp peak is detected for each CP104 and is directly related to the onset of micellization, the CMT. As expected, a shift of the position of the peaks to lower values of temperature is observed with the increase on P104 concentration. At higher temperatures, a slight shoulder is detected around 55 °C, which could be related to a transition from micelles to rod-like micelles (GMT). However, since micellization of P104 block copolymer takes place at higher temperatures than other triblock copolymers [1,2,4,72] the use of techniques such as density measurements is limited by the temperature interval measurements of the equipment. The CMT values obtained by both density and sound velocity measurements coincide (see Table 2).

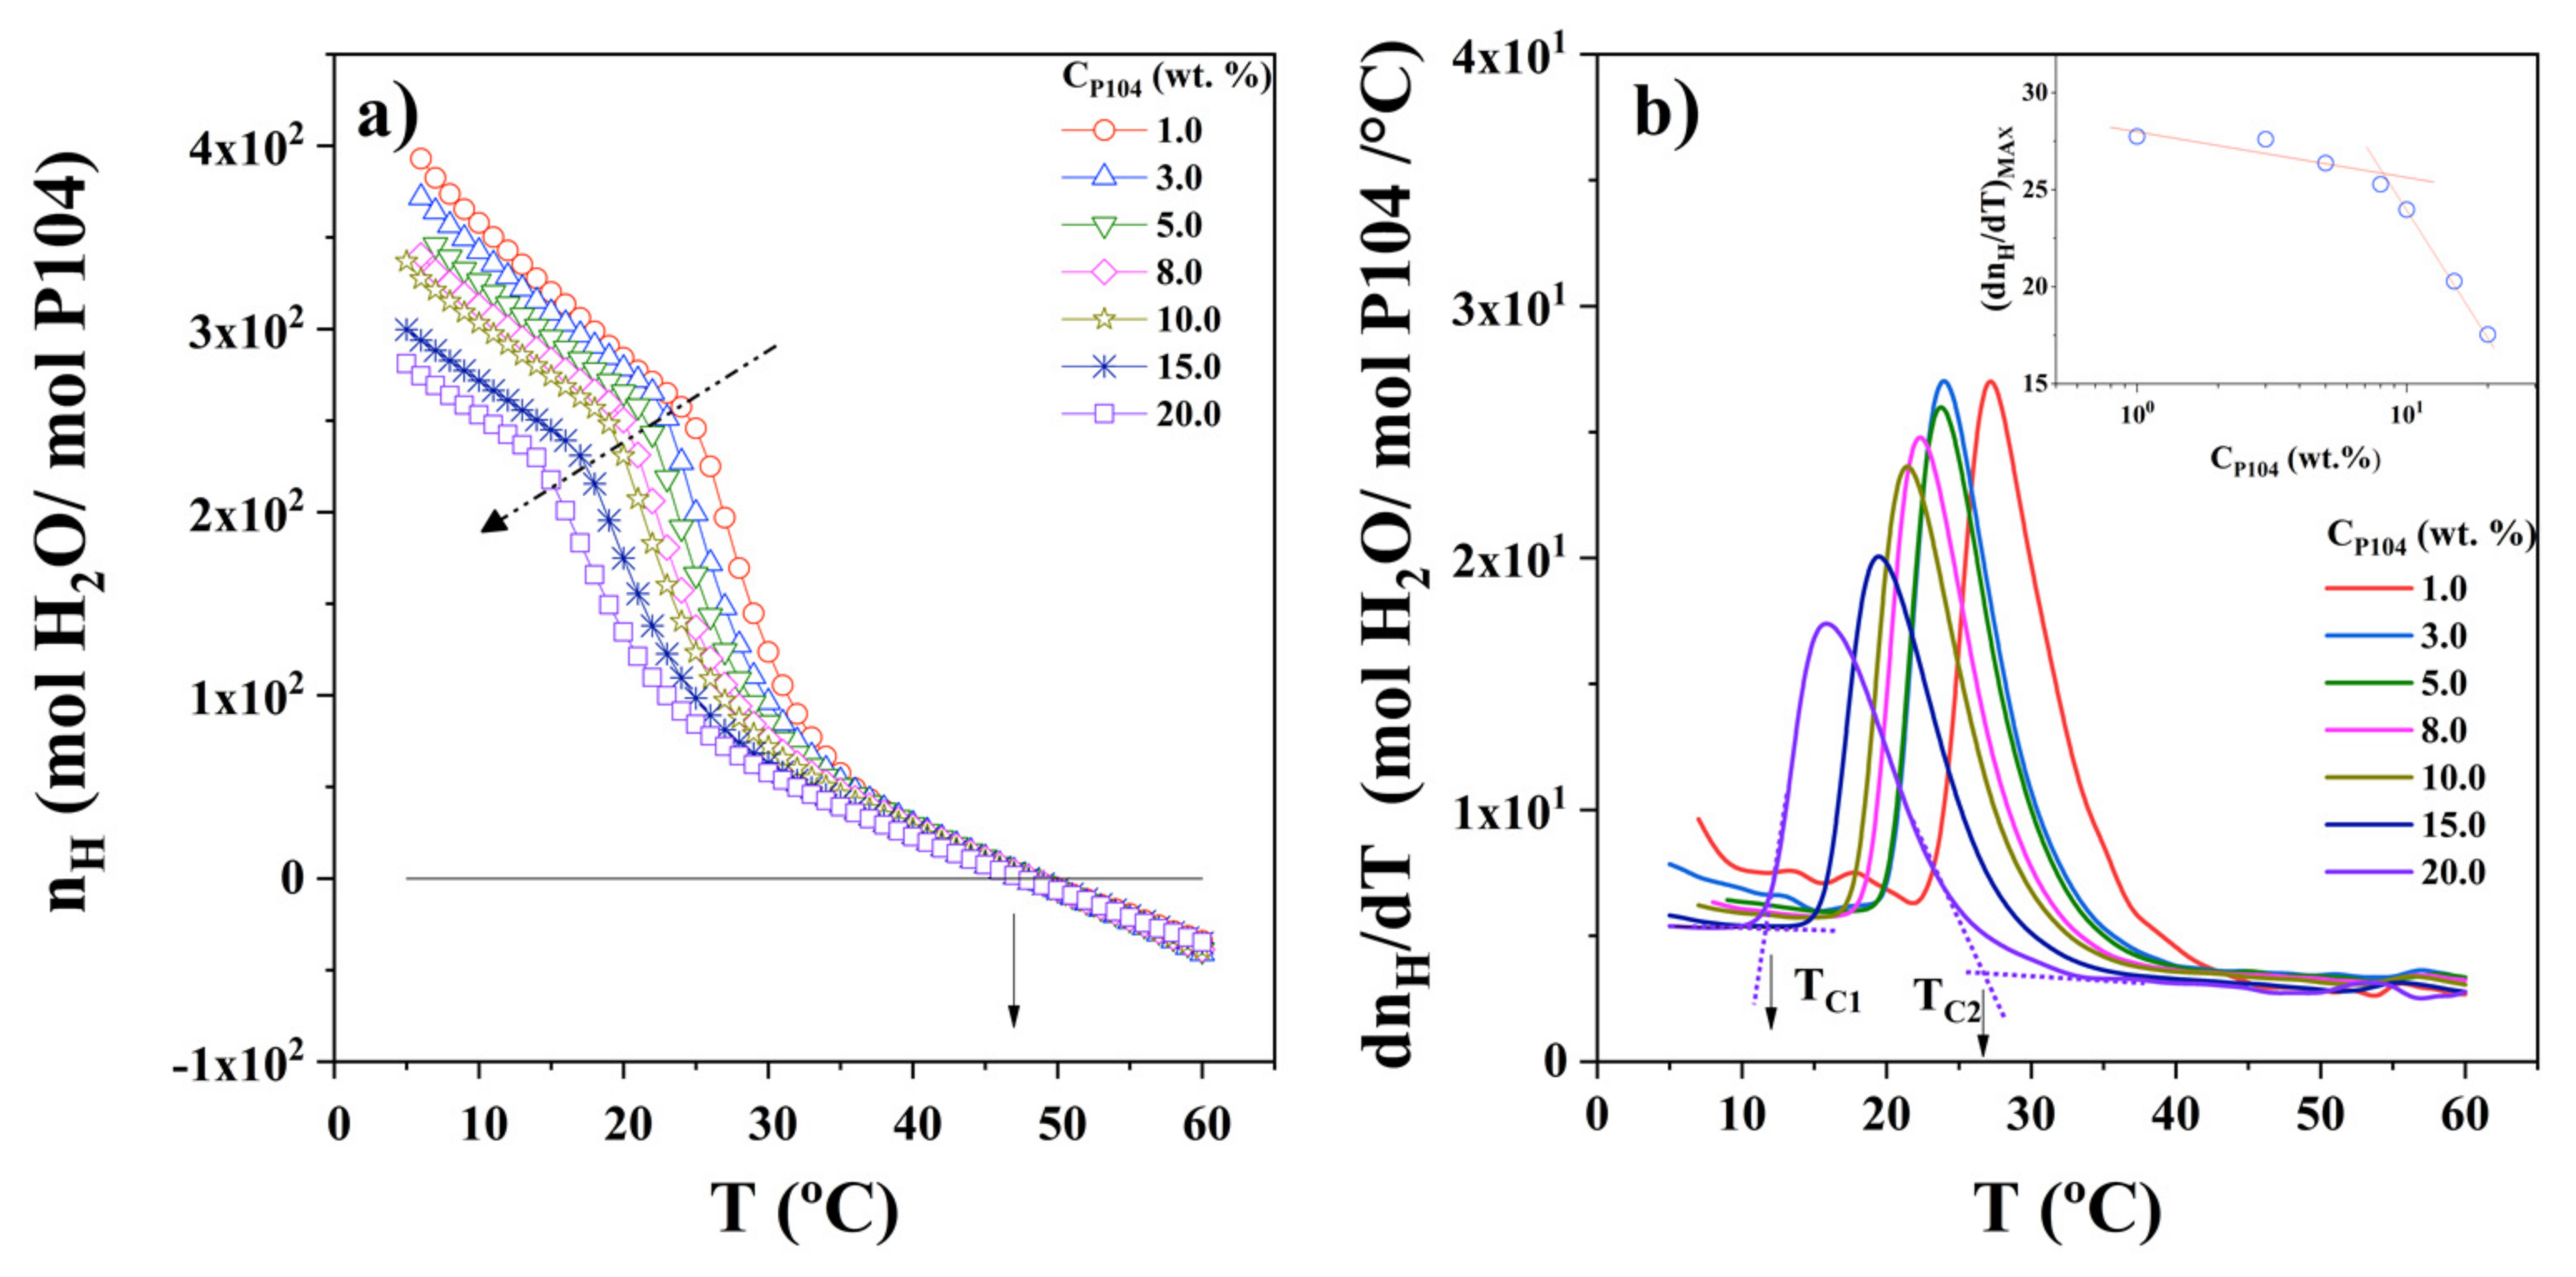
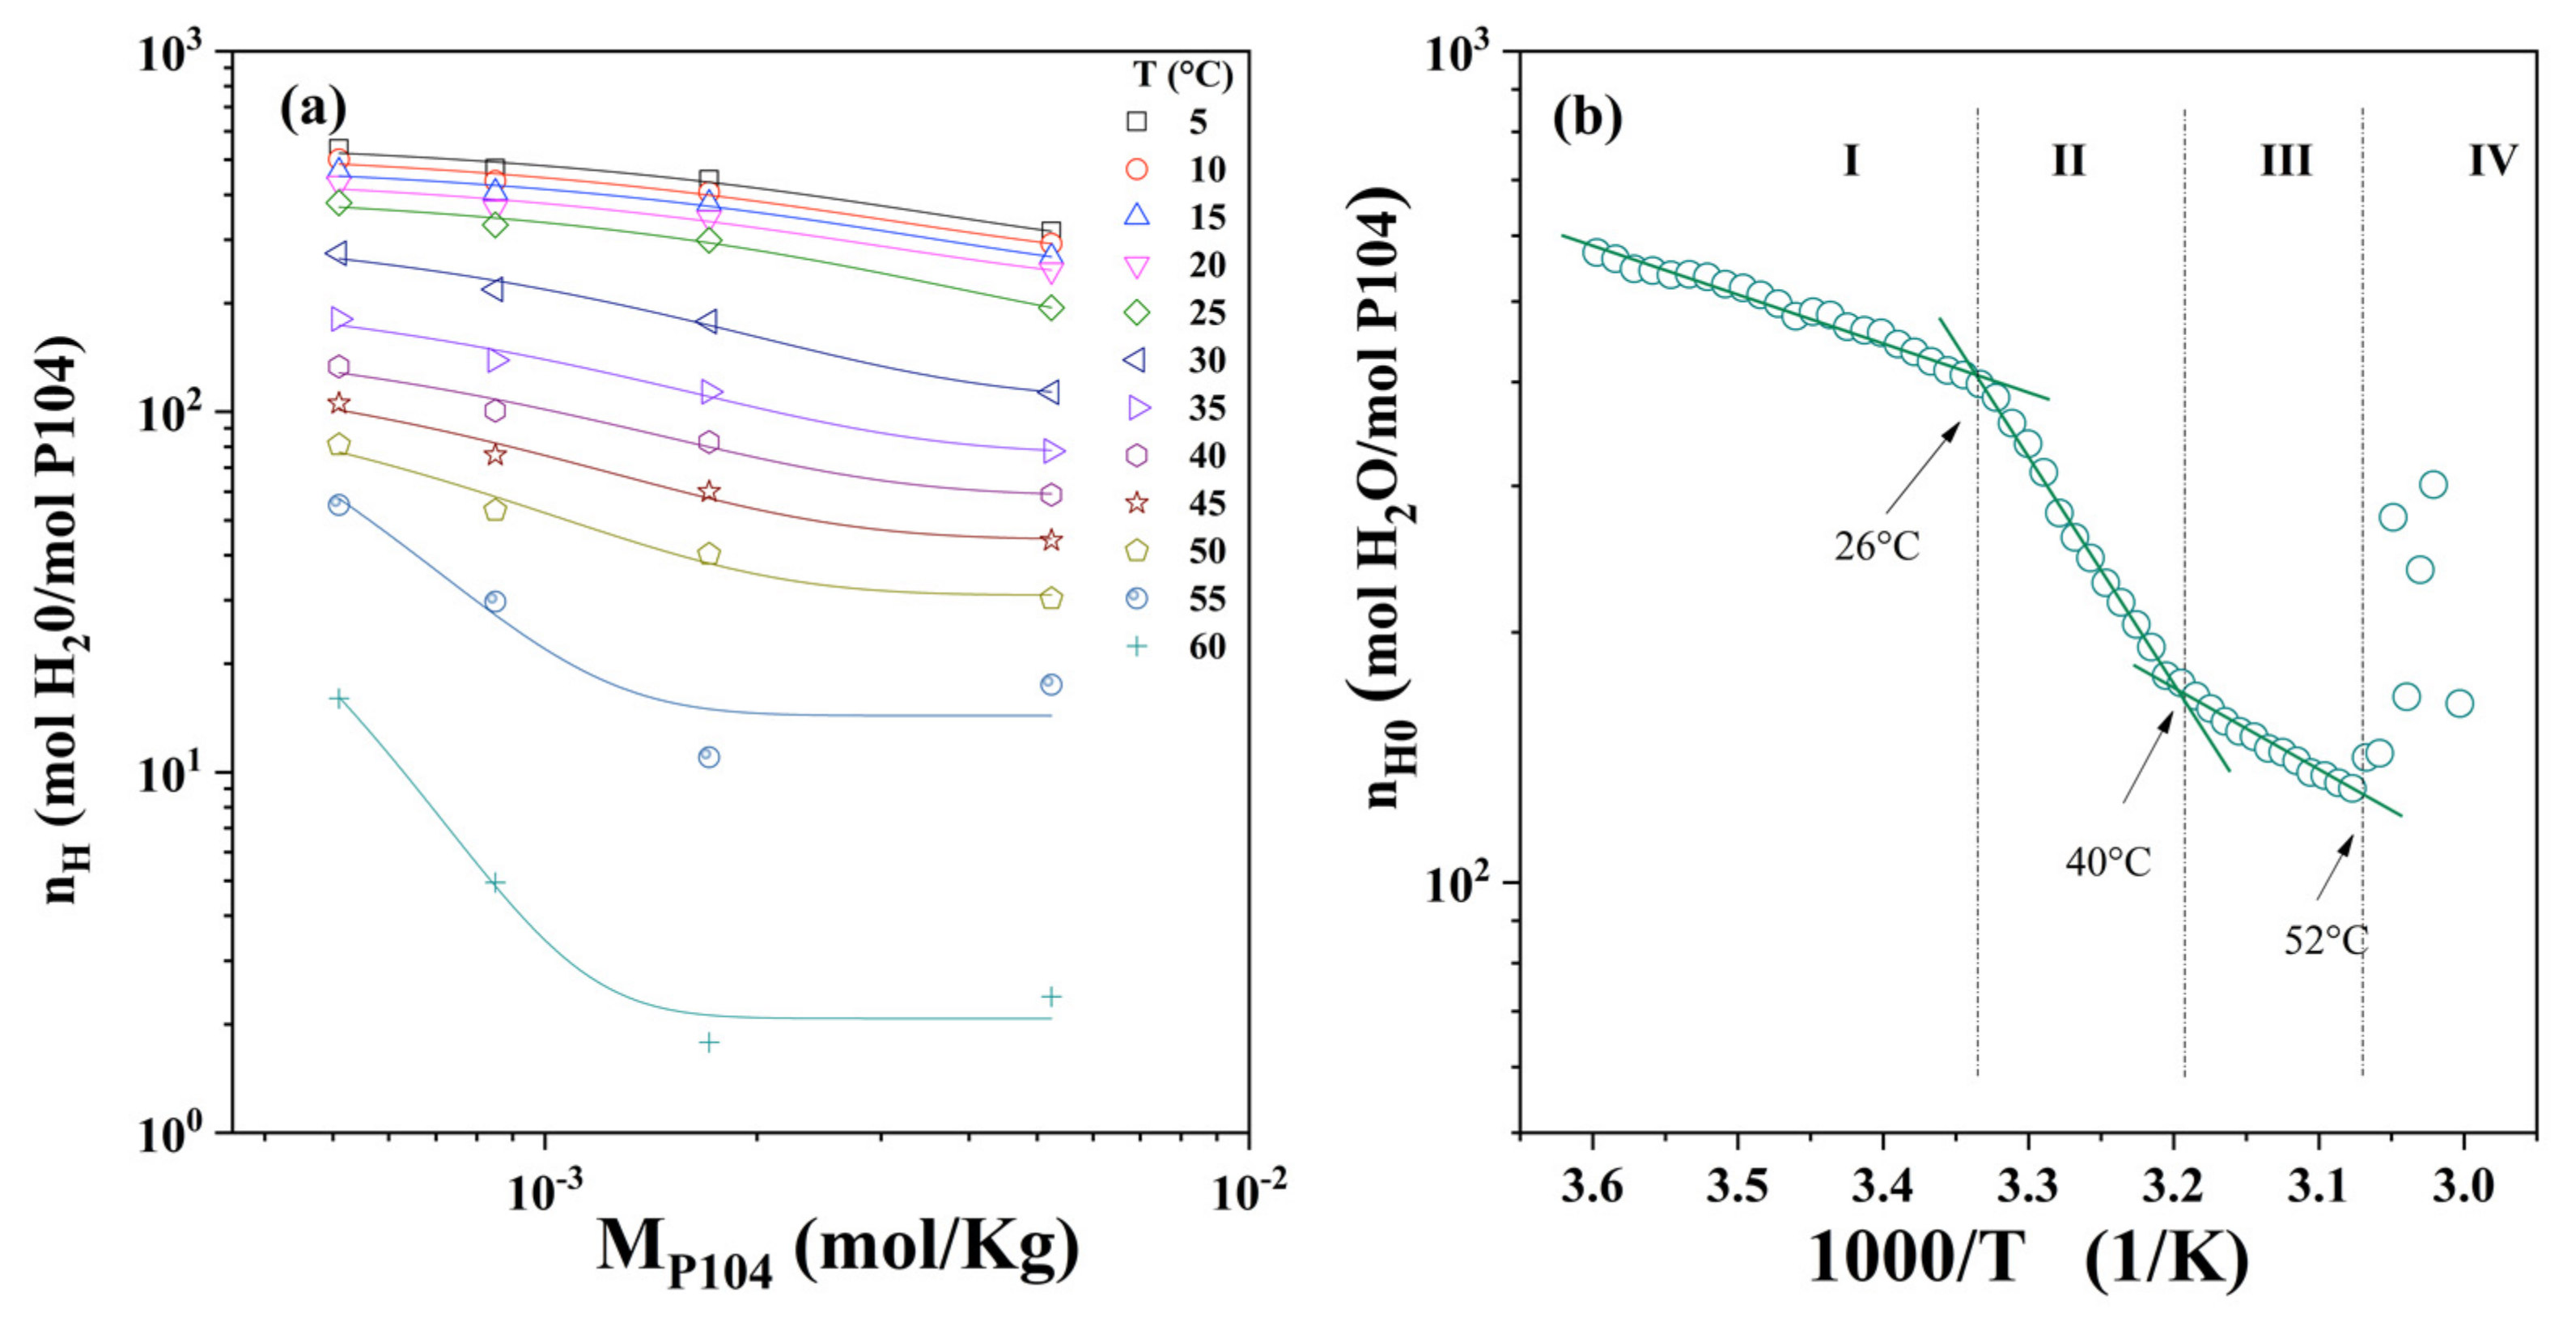
3.4. Evaluation of the Hydration Number of P104/Water System

In previous reports in the literature [78], Vϕ and Kϕ data obtained from aqueous solutions of some drug compounds have been qualitatively interpreted in terms of solute–solvent and solute-solute interactions. There, the adiabatic compressibility was correlated with the hydrational behavior of the solute molecule and was found to be sensitive to the structural features of the solute, such as shape, size, branching, and presence of aromatic rings. Furthermore, it has been proposed that relationships between the chemical structures and hydration environment of polymers can provide significant comprehension of water–amphiphilic polymer interactions [79].
Figure 4a shows the hydration number of P104/water system obtained using Equations (4)–(6) as a function of temperature for a set of P104 concentrations (from 1 to 20 wt.%). It can be observed that, independently of the temperature, hydration number decreases while P104 concentration increases. A similar trend was detected by Liu et al. for P84 and P104 triblock copolymers aqueous solutions performed by Small Angle Neutron Scattering (SANS) [60]. They reported that, at given temperature, the number of water molecules bounded is independent of triblock concentration. The micelles formed with P84 copolymer are less hydrated than those formed with the P104 copolymer; the hydration number decreases, and the micelles become more compact as temperature increases. Here, it has been mentioned previously, the dehydration around the hydrophobic PPO segments forming the core and the hydration of hydrophilic PEO segments forming the corona are responsible for amphiphilic block copolymer micelle formation [72,78].
Figure 4a shows, as an example, an inflection points in the hydration number curve at the temperature of 20 °C for the P104/water solution having a concentration of 8 wt.%. The inflection point; attributed to the critical micellar temperature (CMT); decreases as the concentration of the system increases. A decrease in CMT with an increase in amphiphilic block copolymer concentration has been widely observed and is a well-known effect reported for several Pluronic systems [2,55,80,81,82]. The CMT values for the Pluronic copolymer solutions (at a given copolymer concentration) decrease also as a function of the number of PO segments, showing that polymers with a larger hydrophobic domain form micelles at lower temperatures [2]. At temperatures higher than 47 °C, the hydration number exhibits negative values. This is due to the crossover of the sound velocity curves for all P104 with the water curve, where they become lower than that of water (see Figure 3b). In order to obtain accurate critical temperatures, the derivative of the hydration number as a function of temperature was calculated, and the curves obtained are depicted in Figure 4b. It can be seen in this figure that all samples show a sharp peak; which, as was mentioned, is related to the onset of micellization (CMT) and the maxima in the peaks represent the maximum rate velocity of dehydration and therefore the maximum rate of micellization; the dehydration rate exhibits an inflection with P104 concentration at around 9 wt.% similar to that observed in viscosity measurements. Moreover, peaks exhibit a shift of the position of the peaks to lower values of temperature with increasing P104 concentration. At higher temperatures, a third transition is detected at about 55 °C, which may be related to a transition from micelles to rod-like micelles. The CMT and GMT values obtained by hydration measurements are depicted in Table 2. The hydration number obtained by density and sound velocity in this work are lower to that reported by Liu et al. [60].
Furthermore, when plotting the hydration number as a function of P104 molar concentration (Figure 5a), it is possible to see that it decreases when either P104 concentration or temperature increases. The fit to the experimental data was performed in order to obtain the hydration number values at infinite dilution (nH0). The ln nH0 as a function of 1/T is shown in Figure 5b. In this Figure, four zones that are bounded by three critical temperatures can be observed in this Figure. In the zone I, nH0 decreases up to around a temperature of 26 °C, where the curve presents a slope change, this transition may be associated with the onset of the CMT. The second zone (II) was detected in the temperature interval from the CMT to 40 °C; this second temperature transition may be related to the finishing of the monomer–spherical micelle transition. The last temperature transition appears at 52 °C, which coincides with the shape change of micelles from spherical to prolate. Finally, from Figure 5b, the slopes for the three zones where ln(nH) are plotted as functions of the reciprocal of the absolute temperature, and were adjusted with a linear regression, An equation of the following form can be written
ln nH0 = A − B × (1/T)
where B is the slope and A is the intercept with the y-axis. In analogy with the van’t Hoff equation for a chemical reaction [83], it was proposed that B should be ΔEDH/R, where ΔEDH is the driving dehydration energy and R is the gas constant; ΔEDH values for the three zones are shown in Table 3.

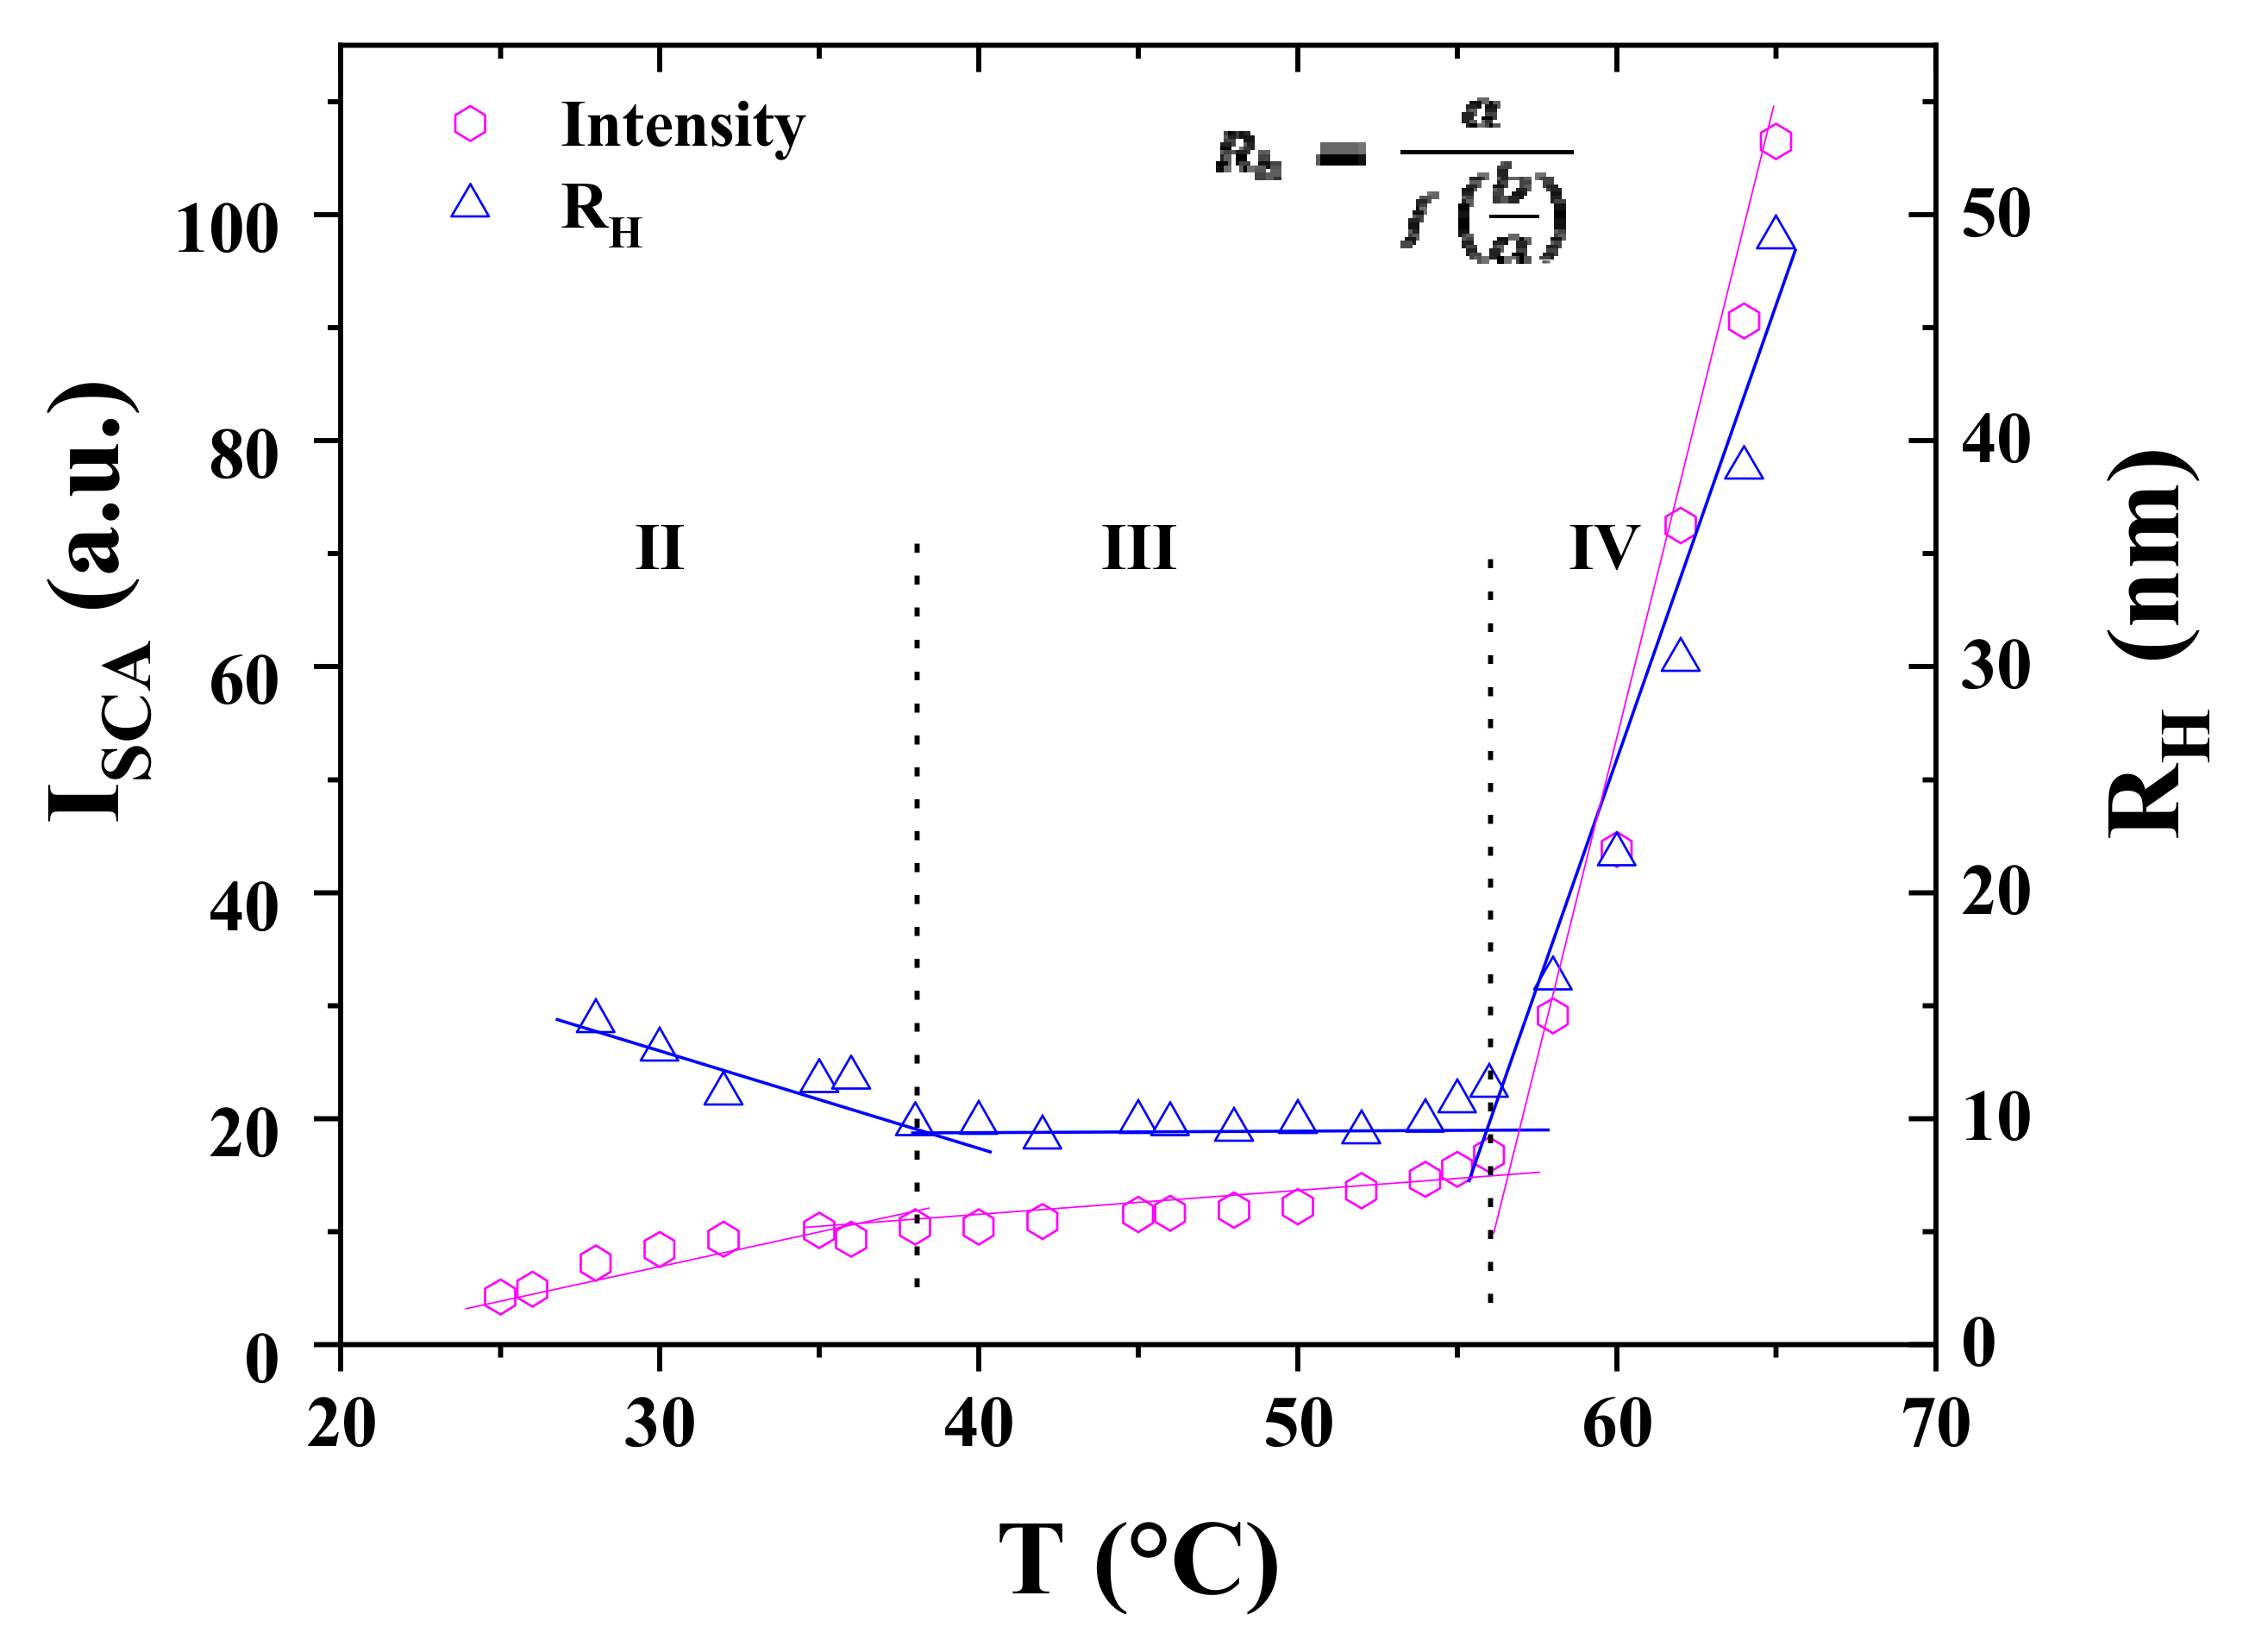
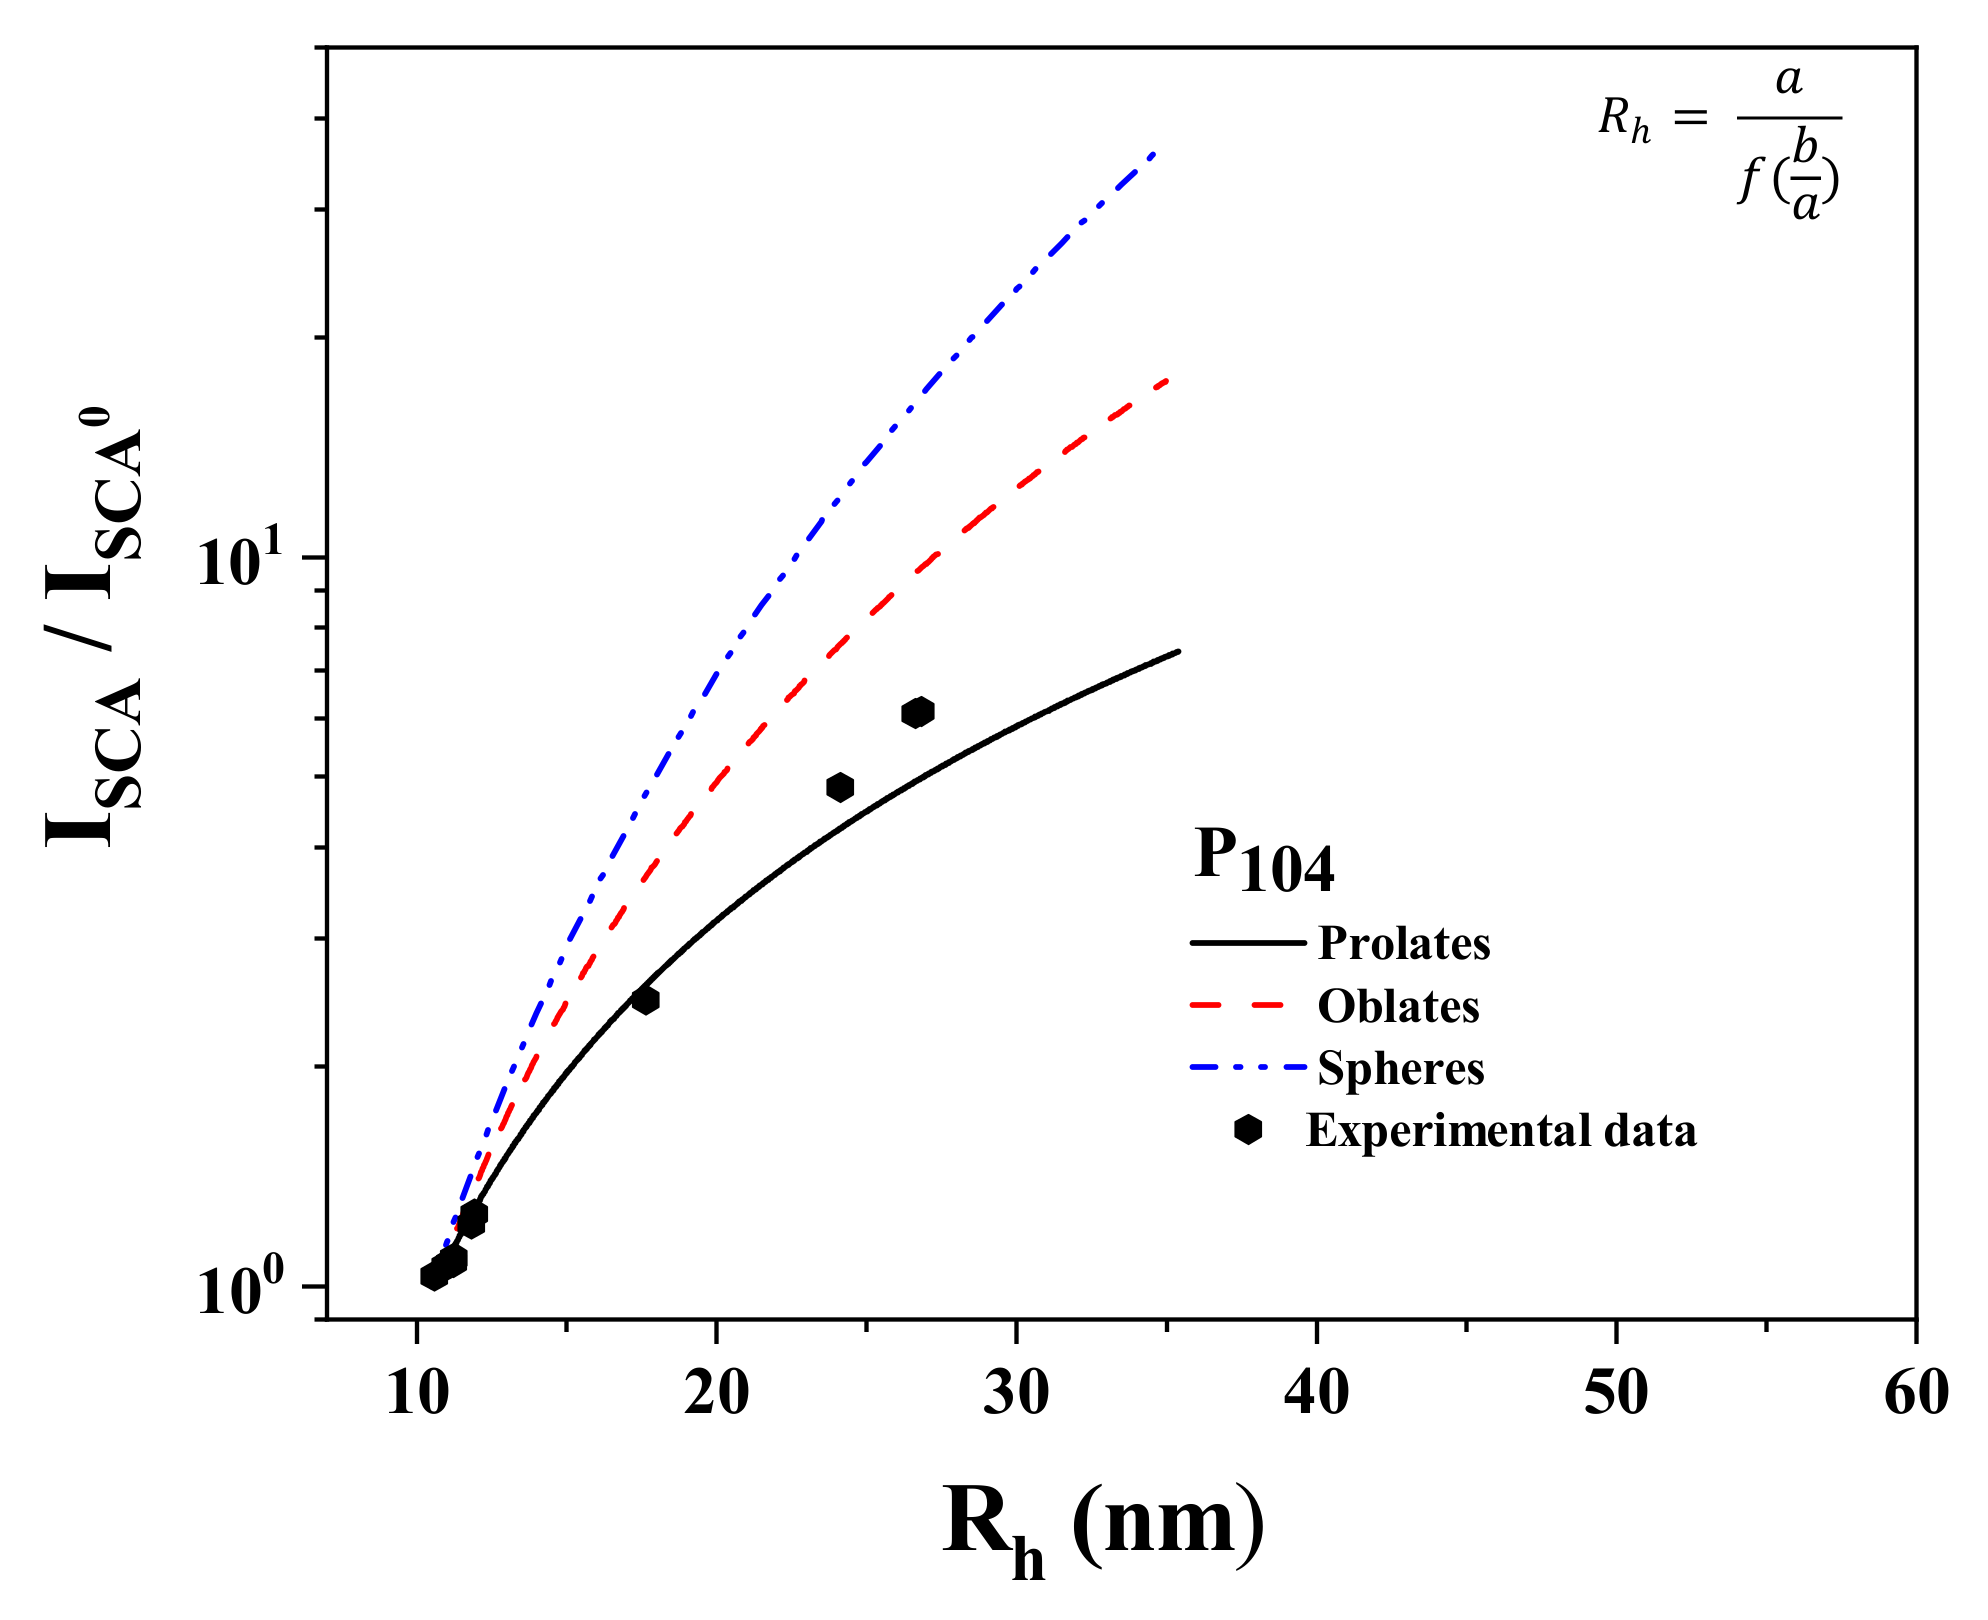
3.5. Morphology of P104 Micelles in Water by Dynamic Light Scattering (DLS)

Information about the shape of the micelles was obtained, as first approximation, by performing Dynamic Light Scattering (DLS) measurements in a temperature range from 10 to 64 °C, from the combination of the scattering intensity and the hydrodynamic radius [84,85,86,87]. The information about the hydrodynamic radius of particles is usually obtained through DLS measurements by using the Stokes–Einstein equation (Equation (8)) and the measured diffusion coefficient (D). For these experiments, low concentrations of copolymer need to be selected so concentration will not affect the diffusion coefficient. Here, it was noticed that between 0.5 and 2 wt.%, reliable data were still obtained. Above these concentrations, an apparent diffusion coefficient and a smaller apparent hydrodynamic radius was obtained.
Rh = (kBT)/(6πηsD)
where, kBT is the Boltzmann constant, ηs is the viscosity of the solvent, and T is the absolute temperature.
Figure 6 shows the effect of temperature on the hydrodynamic radius, Rh, and the scattered light intensity (ISCA) for a 1 wt.% P104 in water. From these results it was possible to identify that micelles are formed in a temperature range between 26 and 54 °C. Their average hydrodynamic radius is 11.4 ± 1 nm. The low scattered light intensity observed at temperatures below 26 °C is directly related to the presence of P104 unimers in the solution [60]. Therefore, the temperature of 26 °C is related to the CMT of P104 triblock copolymer at 1 wt.%, which is in good agreement with the CMT value reported in the literature for a P104/water system evaluated at the same concentration [2,11]. After the appearance of the CMT, while increasing the temperature, the scattered light intensity also increases and remains almost constant in the following temperature range: from 26 to 54 °C, though, after 55 °C, the progressive increase of ISCA until reaching a two-magnitude order difference from the initial value suggests the appearance of a new P104 structure. This morphology transition, due to an increase in temperature, is in good agreement with the one obtained through the evaluation of dKϕ/dT. This phenomenon has been described in terms of the enhanced dehydration of the micelle corona, consisting essentially of PEO, during the increase of temperature [55,88].
Furthermore, the formation of new structures was proposed through the analysis of the variations of the intrinsic asymmetry [Z] [89]. This parameter was obtained by calculating the ratio of the scattering intensity values measured at 45° and the scattering intensity values measured at 135° (I45°/I135°) (see Figure S5 in Supplementary Materials). The analysis of this aspect factor I45°/I135° as a function of temperature for a P104/water solution having a concentration of 1 wt.% allowed identifying the onset of an I45°/I135° ratio different than 1 at the temperature of 54 °C. Then, the ratio between the characteristic dimension of the structure and the wavelength (D/λ) is found to be around 0.04 when [Z] ≈ 1, i.e., between 10 and 54 °C, suggesting spherical micelle morphology [89]. Micellar growth is then detected at higher temperatures.
Furthermore, another approximation about micelle shape was determined through the Perrin model [90]. This model is used to estimate the sizes of micelles for prolate and oblate ellipsoids [91,92,93] The expression for the prolate case is given by the following equation:
Rh = (b/2) × [(p2 − 1)1/2/(ln(P + (p2 − 1)1/2))]
where p = a/b, b corresponds to the semiminor axis and a corresponds to the semimajor axis. For prolate, a is the micelle length L and b corresponds to the diameter of the spherical micelle b = 2Rh0. In this case, Rh0 corresponds to the hydrodynamic radius of the micelle at 38 °C.
On the other side, the expression for the oblate ellipsoid is given by the following equation:
Rh = (a/2) × [((1/p)2 − 1)1/2/(arctan((1/p)2 − 1)1/2)]
where a = 2Rh0.
The volume of the micelle (Vmic) is given by the following expression:
ISCA αVmic × P(q)
where ISCA is the total scattering intensity and P(q) is the micelle form factor. P(q) for spherical, prolate, and oblate ellipsoids can be determined by using the Debye and Anacker equation [93].
The scattered intensity ISCA/ISCA0 as a function of the hydrodynamic radius Rh is presented in Figure 7 for a 1 wt.% P104 solution in water. The curve corresponding to ISCA/ISCA0 is compared to the Perrin model of prolate ellipsoids, oblate ellipsoids, and spheres. ISCA and Rh were measured at six different temperatures from the spherical micelle domain to the elongated micelles domain. ISCA0 is the scattering intensity taken at 38 °C, which corresponds to the initial temperature, selected in the spherical micelle domain. The evolution of ISCA/ISCA0 as a function of Rh is close to the predicted behavior for prolate ellipsoids, suggesting that P104 micelles grow as prolate rods. A similar behavior was also obtained for P103 micelles in water [90].
A spherical micelle morphology of P104 triblock copolymer can be proposed from this DLS study since ISCA did not show any dependence on the scattering angle. Above 54 °C, both ISCA and Rh increase steadily with increasing temperature, suggesting a structural transition from spheres to elongated micelles. This conclusion is supported by the variation of the aspect factor (I45°/I135°) from ~1 between 25 and 54 °C to above 1.5 for T > 54 °C (see Figure S5 in Supplementary Materials). Then, the evolution of ISCA as a function of Rh was also compared with the Perrin model, taking b = 2Rh0 and a = 2Rh0 for prolate ellipsoid and oblate ellipsoid respectively, determining a small prolate rod growth.
The obtained micellar structure for P104 amphiphilic copolymer in water in the temperature range between 25 and 55 °C, corresponding to the spherical micelle domain, is suitable to be used a micellar nanocarrier for drug-controlled release and their dynamics are now being studied with lipidic membranes through hydrophobic pyrene probe transfer [11]. Their nanoscale size makes them a suitable option for targeted drug delivery applications, including storage, controlled release, and protection of the hydrophobic drugs [94]. Contrary to P103 triblock copolymer, which starts to aggregate at 37 °C, the spherical micellar stability of P104 at the temperature of 37 °C represents a good selection that allows maintaining a specific shape and size at the average body temperature. Then, the morphology could be modified through a determined stimulation (temperature, pH or ionic strength variations) in order to release the hydrophobic drug. The shape of micelles is affected by temperature, which can be exploited for the design of new formulations.

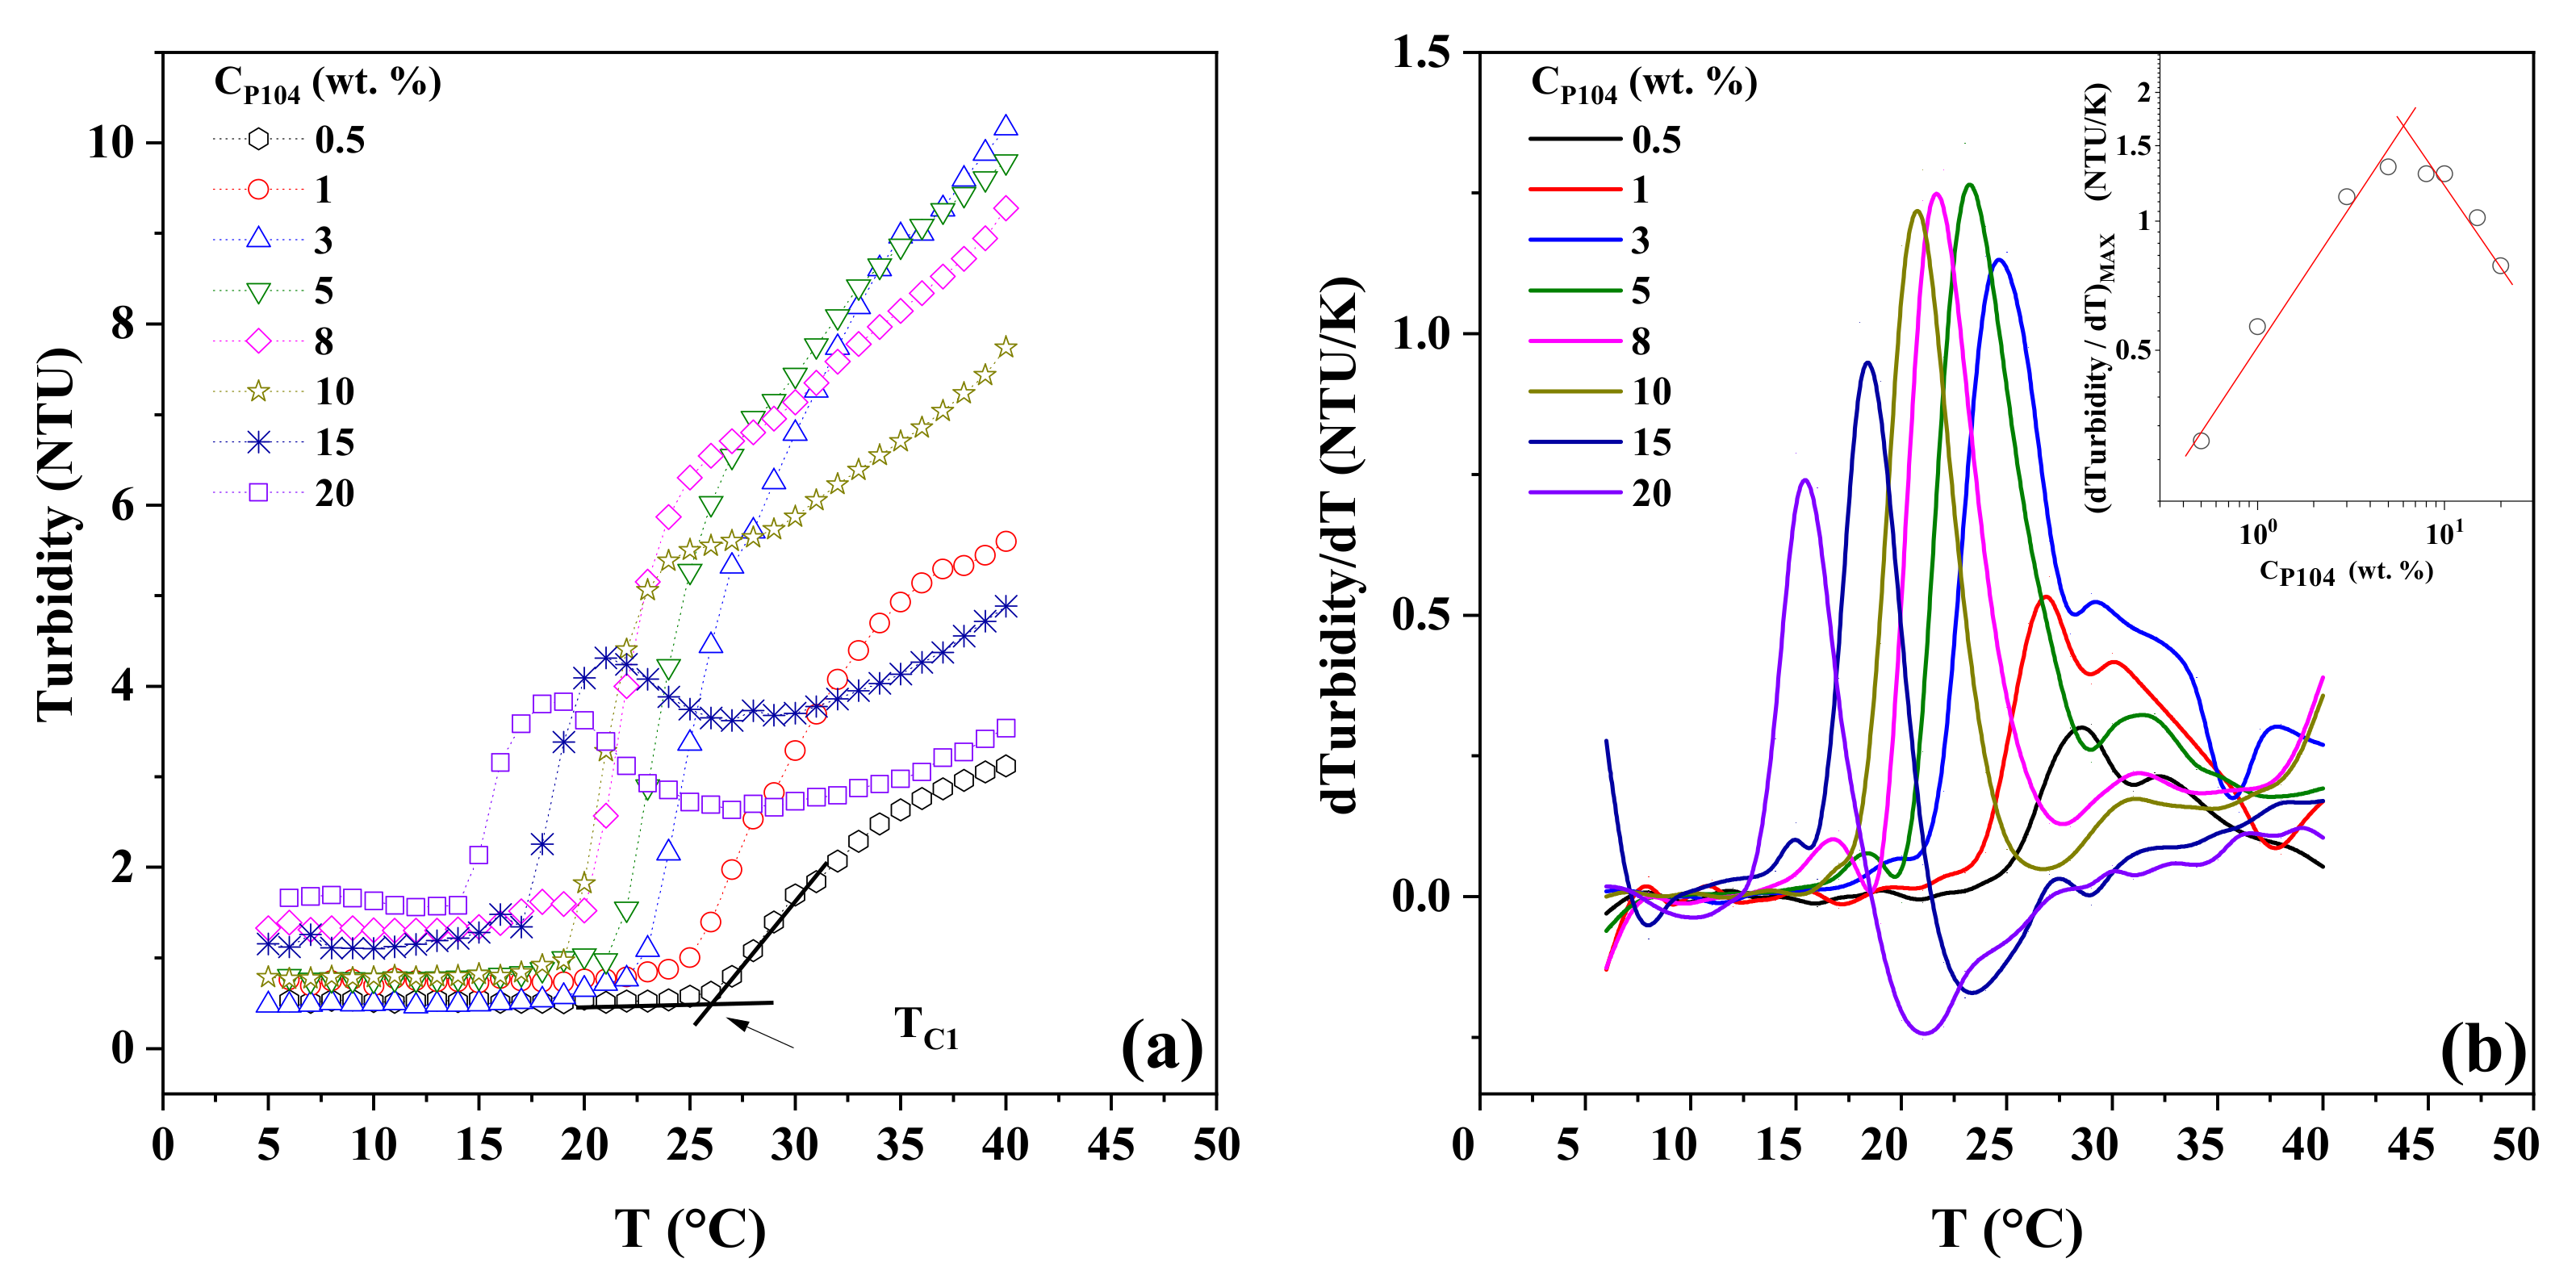
3.6. Turbidity Measurements

Turbidimetry is a powerful method that reveals the aggregation behavior in copolymer solutions that exhibit micellization temperatures [95] Figure 8a shows the dependence of turbidity with temperature and P104 concentration. All of the P104 solutions exhibit an initial slight variation of the turbidity between the temperatures of 10 to 20 °C. The higher the concentration of 10 wt.% P104 is, an increasing and then a decrease in turbidity is observed, while increasing temperature becomes more important. This behavior was also observed in methoxy-poly-(ethylene glycol)-block-poly(N-isopropylacrylamide) (MPEG53-b-P(NIPAAM)113 [95] diblock copolymers and was attributed to possible shrinking of the polymeric micelles before intermicellization occurred [95]. Then, a sharp rise of the turbidity observed in all P104/water solutions was attributed to the self-organization of amphiphilic block copolymer chains to form micellar structures, i.e., the boundary between unimers and unimers-spherical micelles, as mentioned before. At higher temperatures, the turbidity becomes a constant value, i.e., 40 °C for the 10 wt.% sample; this temperature coincides with the finishing of the transition of unimer to spherical micelle for this concentration. The obtained temperature values are in good agreement with the previously mentioned results from density, sound velocity, and viscosity measurements (see Table 2).
The first derivative of the turbidimetry with temperature allows also identifying the boundary between unimer and unimer–spherical micelle zones. Figure 8b shows the variation of d turbidity/dT with temperature for some P104 concentrations. A maximum is observed between 22 and 28 °C, depending on P104 concentration, and is related to the critical micellar transition (CMT). In Table 2 the critical temperatures measured are depicted. It can be seen that the values obtained are in agreement with those obtained with the other analytical methods used in this work [96]. The inset in Figure 8b shows the maximum of the derivative of the turbidity with temperature as a function of P104 concentration; a maximum is detected around 8 P104 wt.%. This value is similar to that detected by viscosimetry and hydration measurements.

3.7. Rheological Measurements

The ability of the hydrophobic core of PPO in amphiphilic triblock copolymers to delay the release of hydrophobic drugs is an important feature on Pluronics for drug delivery. Thermo-reversible and physical gels can be formed from some of these copolymer solutions at higher polymer concentrations and temperatures [27,97]. These gels consist of liquid crystals of packed spherical or rod-like micelles. Different properties of the materials can be studied through rheological measurements and are useful in many biomedical applications [98,99]. With this technique it is possible to measure the transitions at a temperature higher than the analytical methods discussed above.

3.7.1. Linear Viscoelastic Region

P104/water samples were characterized mechanically in the linear viscoelastic region (LVR), which is defined as the deformation range where the elastic modulus (G′) is independent of deformation (% γ) [100]. After a critical deformation (% γc), G′ exhibits a change in its slope, decreasing as deformation increases, which is due the breakdown of the sample microstructure. In order to identify the linear viscoelastic region, oscillatory strain deformation sweeps for P104/water solutions in a concentration range between 5 and 80 wt.% in the deformation interval from 0.01 to 100% were achieved at a frequency (ω) of 10 rad/s and at various temperatures. Figure 9a shows, as examples, the strain dependence of G′ and G″ for five P104 concentrations at the temperature of 20 °C. It is evident in this Figure that in the semi-dilute and dilute P104 concentrations (≤25 wt.%) the LVR reach deformation values up to around 100%. For more concentrated samples, the LVR decreases at deformations about 1%. It can be observed that for a P104 concentration of 5 wt.%, G′ and G″ are independent of γ at strains less than the 20%, however, for a P104 concentration of 35 wt.%, G′ and G″ are independent of γ at strains less than the 1%. This diminishing of the LVR with increasing concentration may be due the formation of a weaker structure. In Figure 9b the elastic modulus as a function of deformation for a sample of 30 wt.% at different temperatures is shown. For a temperature of 10 °C; which is below the CMT, the LVZ reaches at levels of deformation of 100%. When the deformation sweep is performed at temperatures of 30 and 60 °C that is higher than the CMT, sample becomes structured, the modulus increases in 7 and 6 magnitude orders, and the critical deformation shift at 1 and 7% respectively. Therefore, it was found that the linear viscoelastic region is highly dependent in both P104 concentration and temperature.

3.7.2. Temperature Sweeps

Figure 10 presents a set of plots showing the temperature dependence on the log (G′) and log (G″) at a frequency (ω) of 10 rad/s for different P104/water solutions having the following concentrations: 5, 10, 20, and 30 wt.%. For P104 concentration of 5 wt.% (Figure 10a), a slightly elastic behavior (G″ < G′) is firstly observed within the temperature range from 3 to 19 °C where a change in the slopes is detected, this change is associated with the onset of the CMT; then the elastic and loss moduli decreases with temperature until reaching the temperature of 60 °C, at which a large increase of two orders of magnitude is observed, changing from the liquid to the soft gel domain; this transition is due to the growth of the rods, which form wormlike micelles. G′ increases with temperature up to around 75 °C becomes a maximum and then diminishes with temperature; this temperature transition is due to the cloud point temperature of the P104/water system detected by visual measurements. For P104 concentration of 10 wt.% (Figure 10b), a viscous behavior (G″ > G′) is firstly observed within the temperature range from 3 to 20 °C. A first crossover of G′ and G″ is then observed around the temperature 20 °C. The elastic modulus is then independent of the temperature until reaching the temperature of 58 °C, at which a large increase of two orders of magnitude is observed, changing from the dilute to the soft gel domain. A drop of both G′ and G″ values is then observed at the temperature of 81 °C, at which the soft gel condition returns to a liquid condition. A small pick is detected around 17 °C before the G′ and G″ crossover, this temperature is related to the onset of the formation of spheric micelles. In the other hand the large increment of both G′ and G″ is due to the growth of length of the rodlike to form wormlike micelles (GMT). The maximum detected at 75 °C is due to the onset of the cloud point temperature (CPT). Figure 10c shows the temperature dependence of G′ and G″ for the P104 concentration of 20 wt.%. A similar behavior to the one obtained for P104 concentration of 10 wt.% is observed. Here, the loss and the storage modulus decrease with temperature until reaching the temperature of 11 °C, at which a change in G′ slope is observed; at higher temperatures around 60 °C, a large increase of also two orders of magnitude is observed, changing from the liquid to the soft gel domain; which indicates the onset of GMT. The drop of both G′ and G″ values is slightly shifted to higher values of temperature, i.e., 83 °C. Finally, a new behavior of P104 solutions is presented in Figure 10d for a sample of 30 wt.%, in which the material reaches the hard gel domain between a temperature range of around 21 and 52 °C. In this manner, an increase of around four orders of magnitude is reached from this P104 concentration in a ΔT of around 30 °C. Therefore, it is possible to conclude that P104/water solutions form thermo-reversible gels depending on P104 concentrations and on temperature, which could be used for different applications at physiological temperatures [27,32,101]. Dashed horizontal lines in Figure 10 represent the liquid-like behavior (sol, with G′ < G″ and G′ < 10 Pa), the soft gel behavior (with G′ > G″ and 10 < G′ < 1000 Pa), and hard gel behavior (with G′ > G″ and G′ > 1000 Pa); these rheological behaviors and the G′ values limits were adopted from Hvidt et al.’s notation [27].

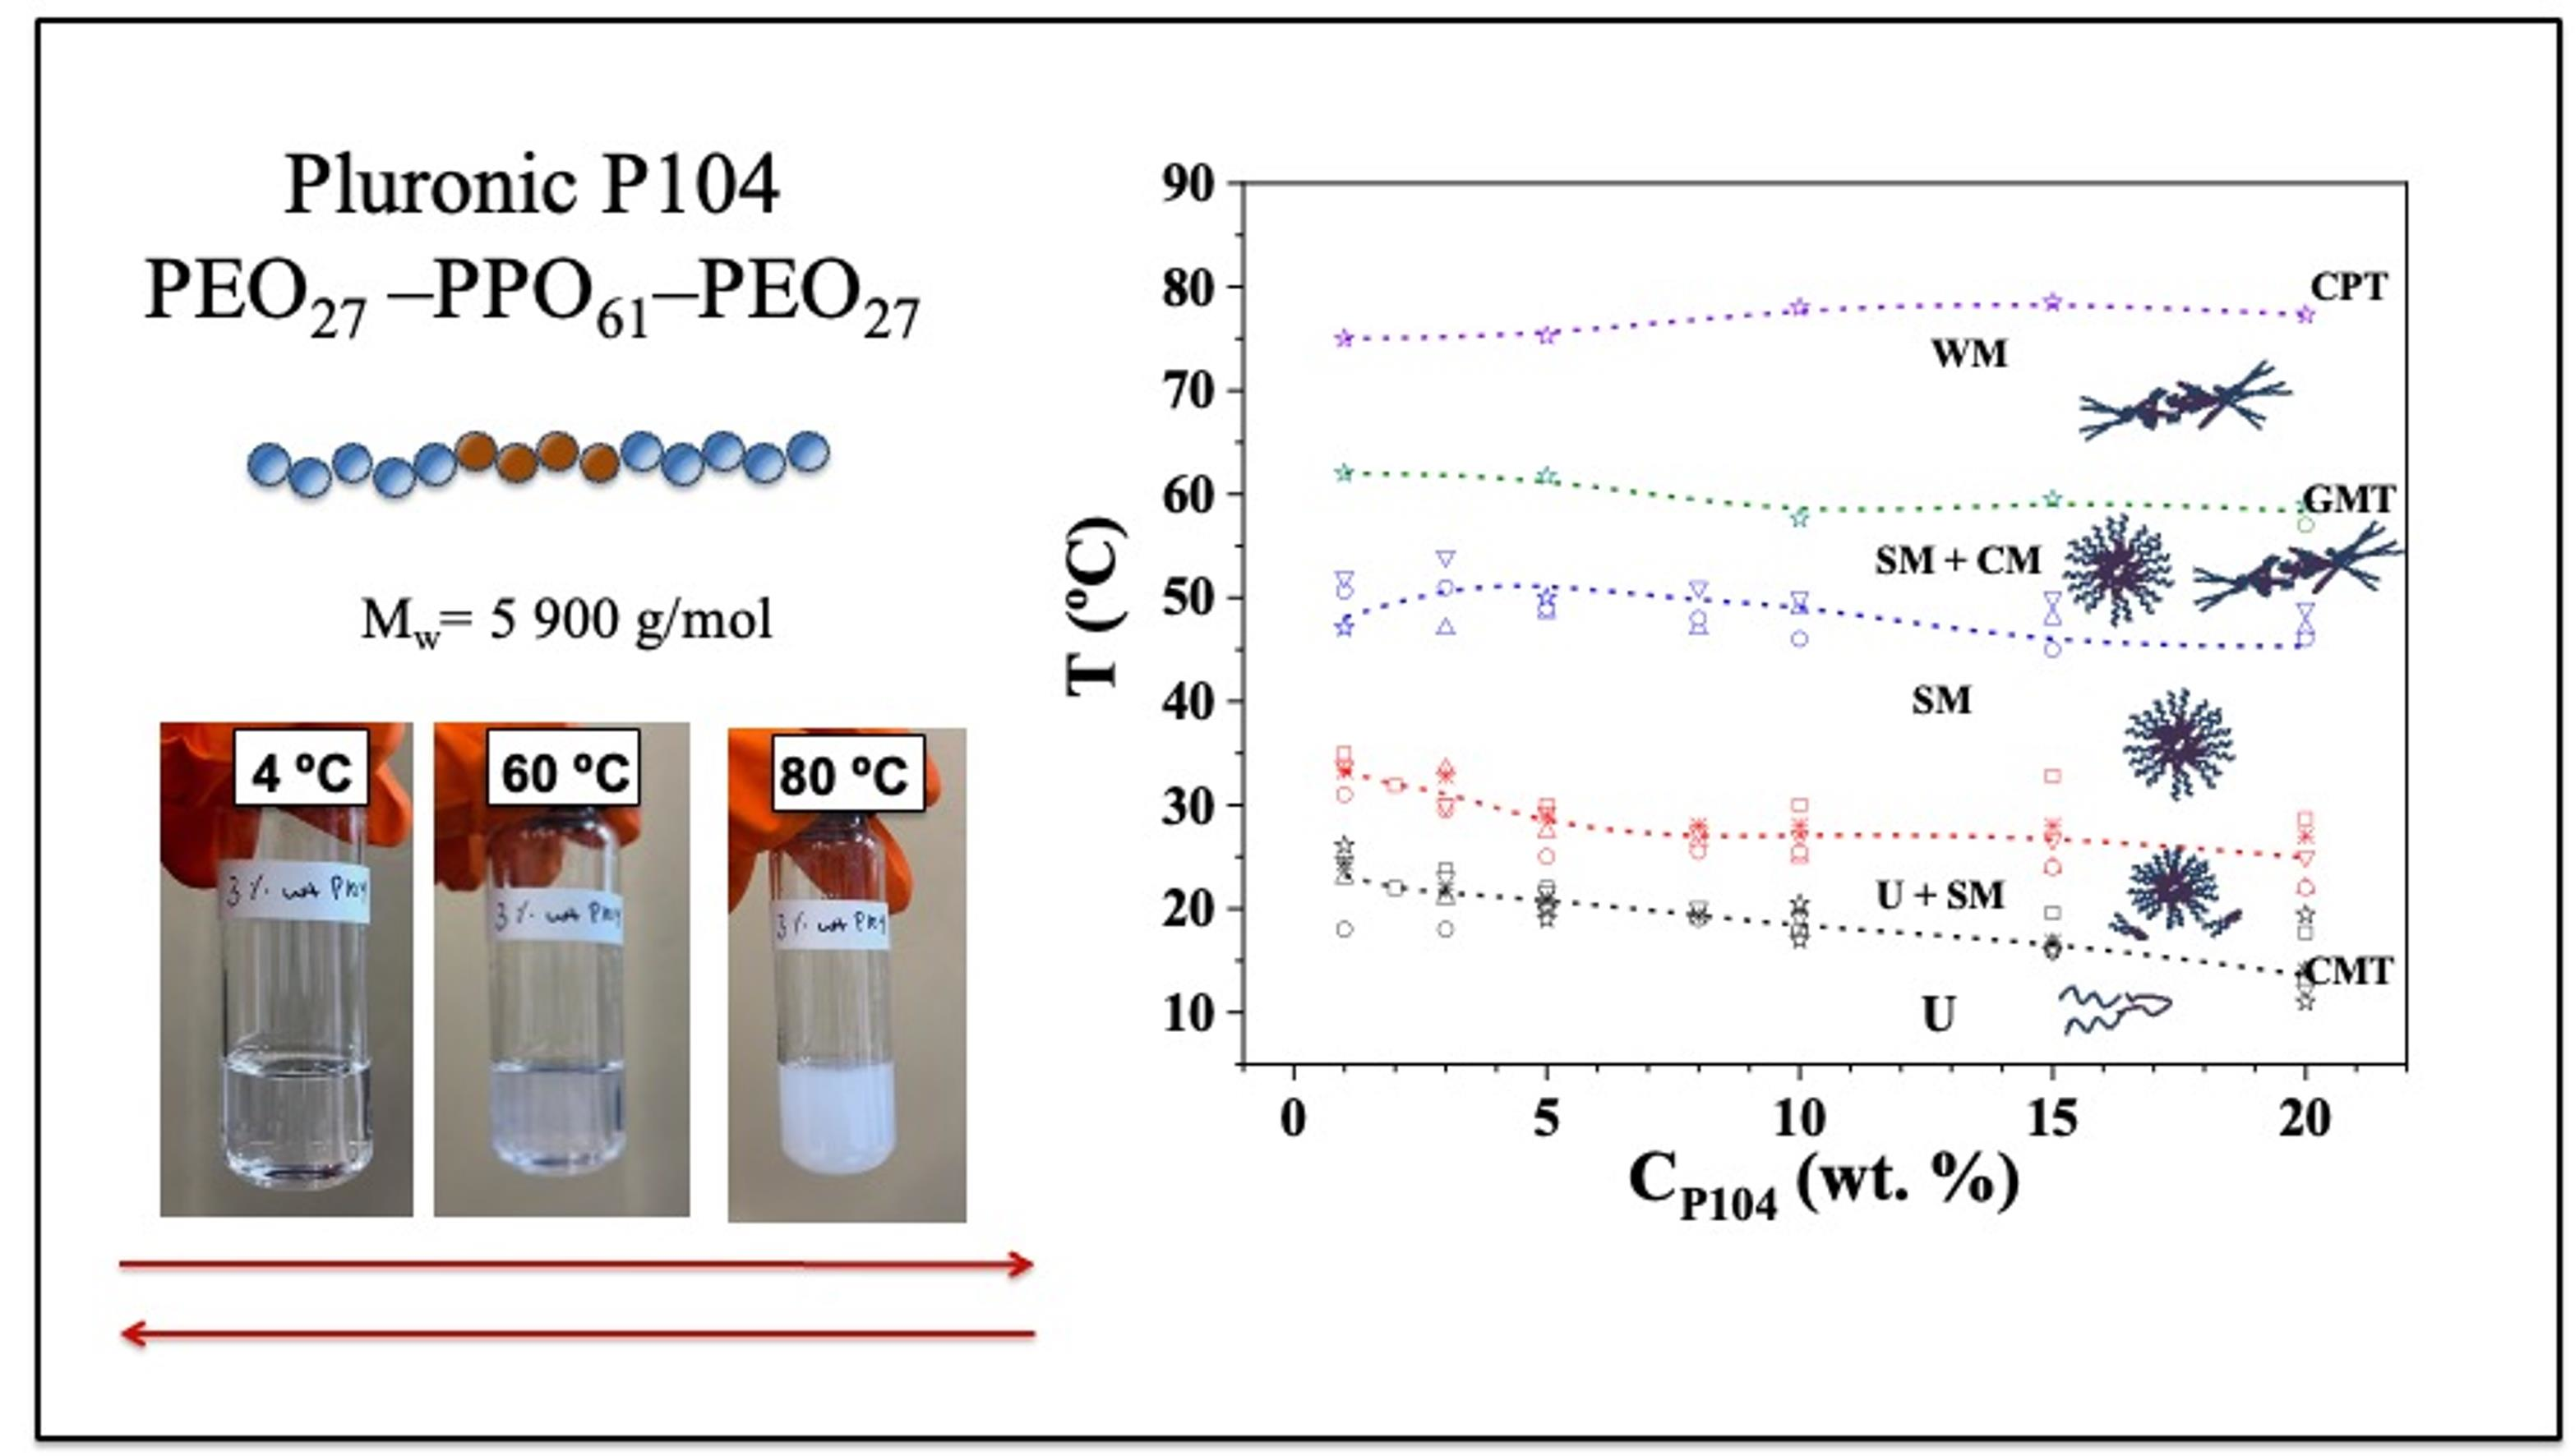
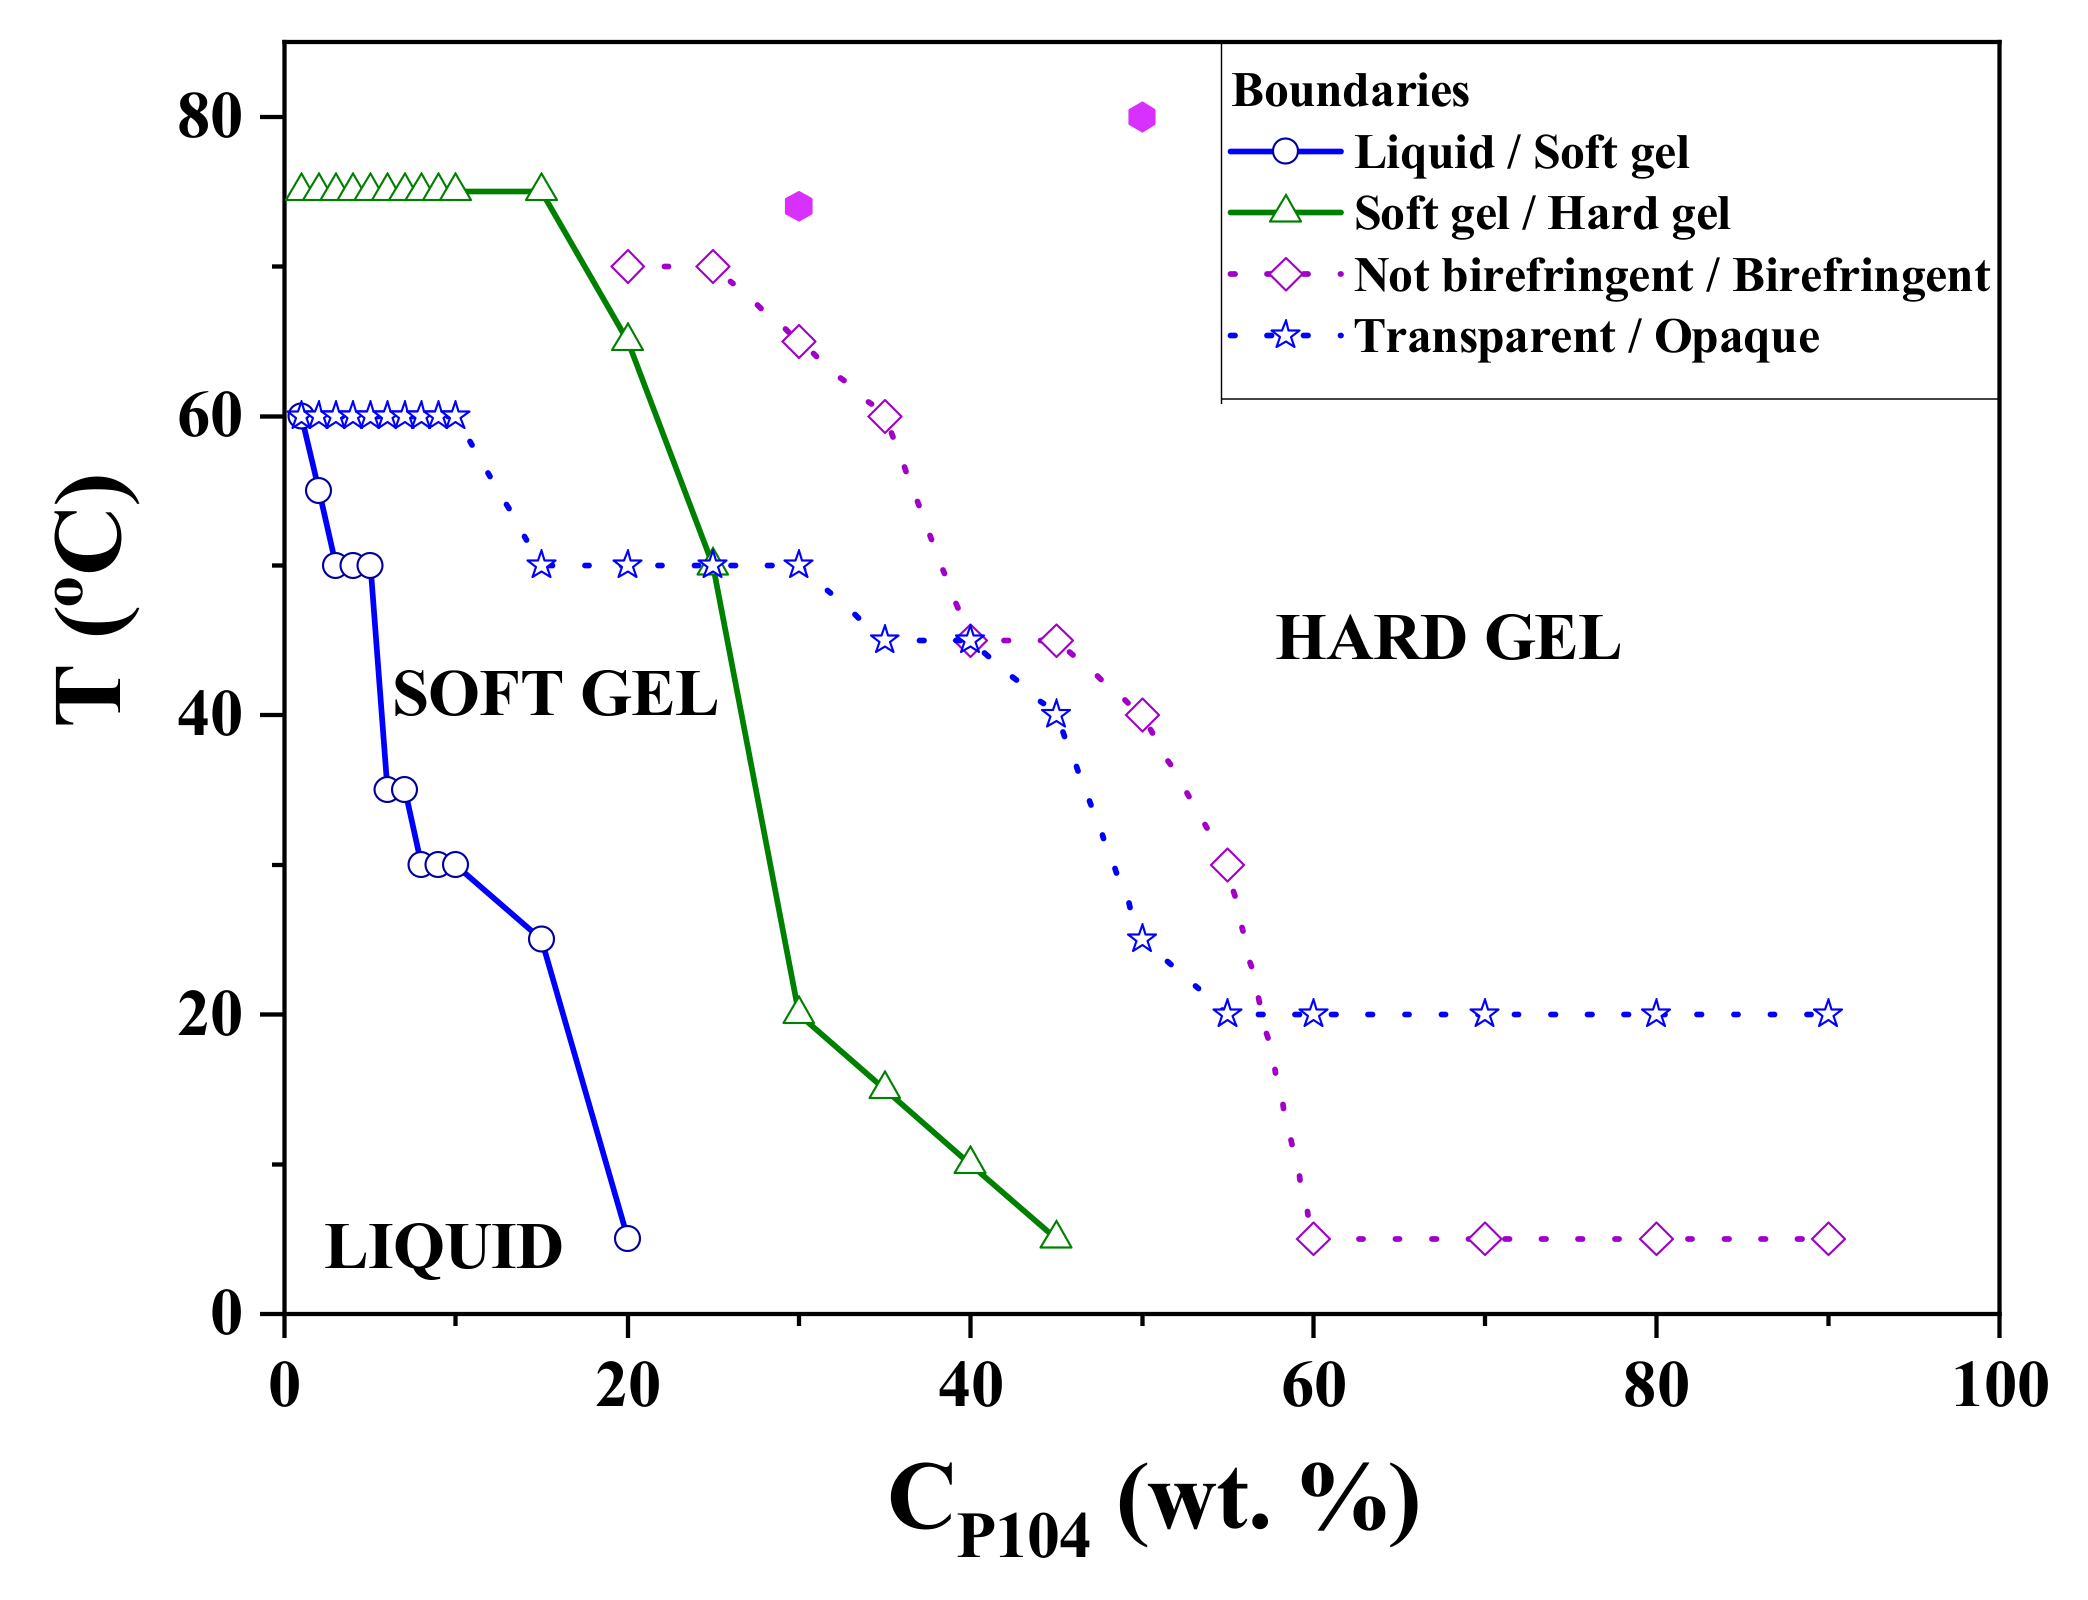
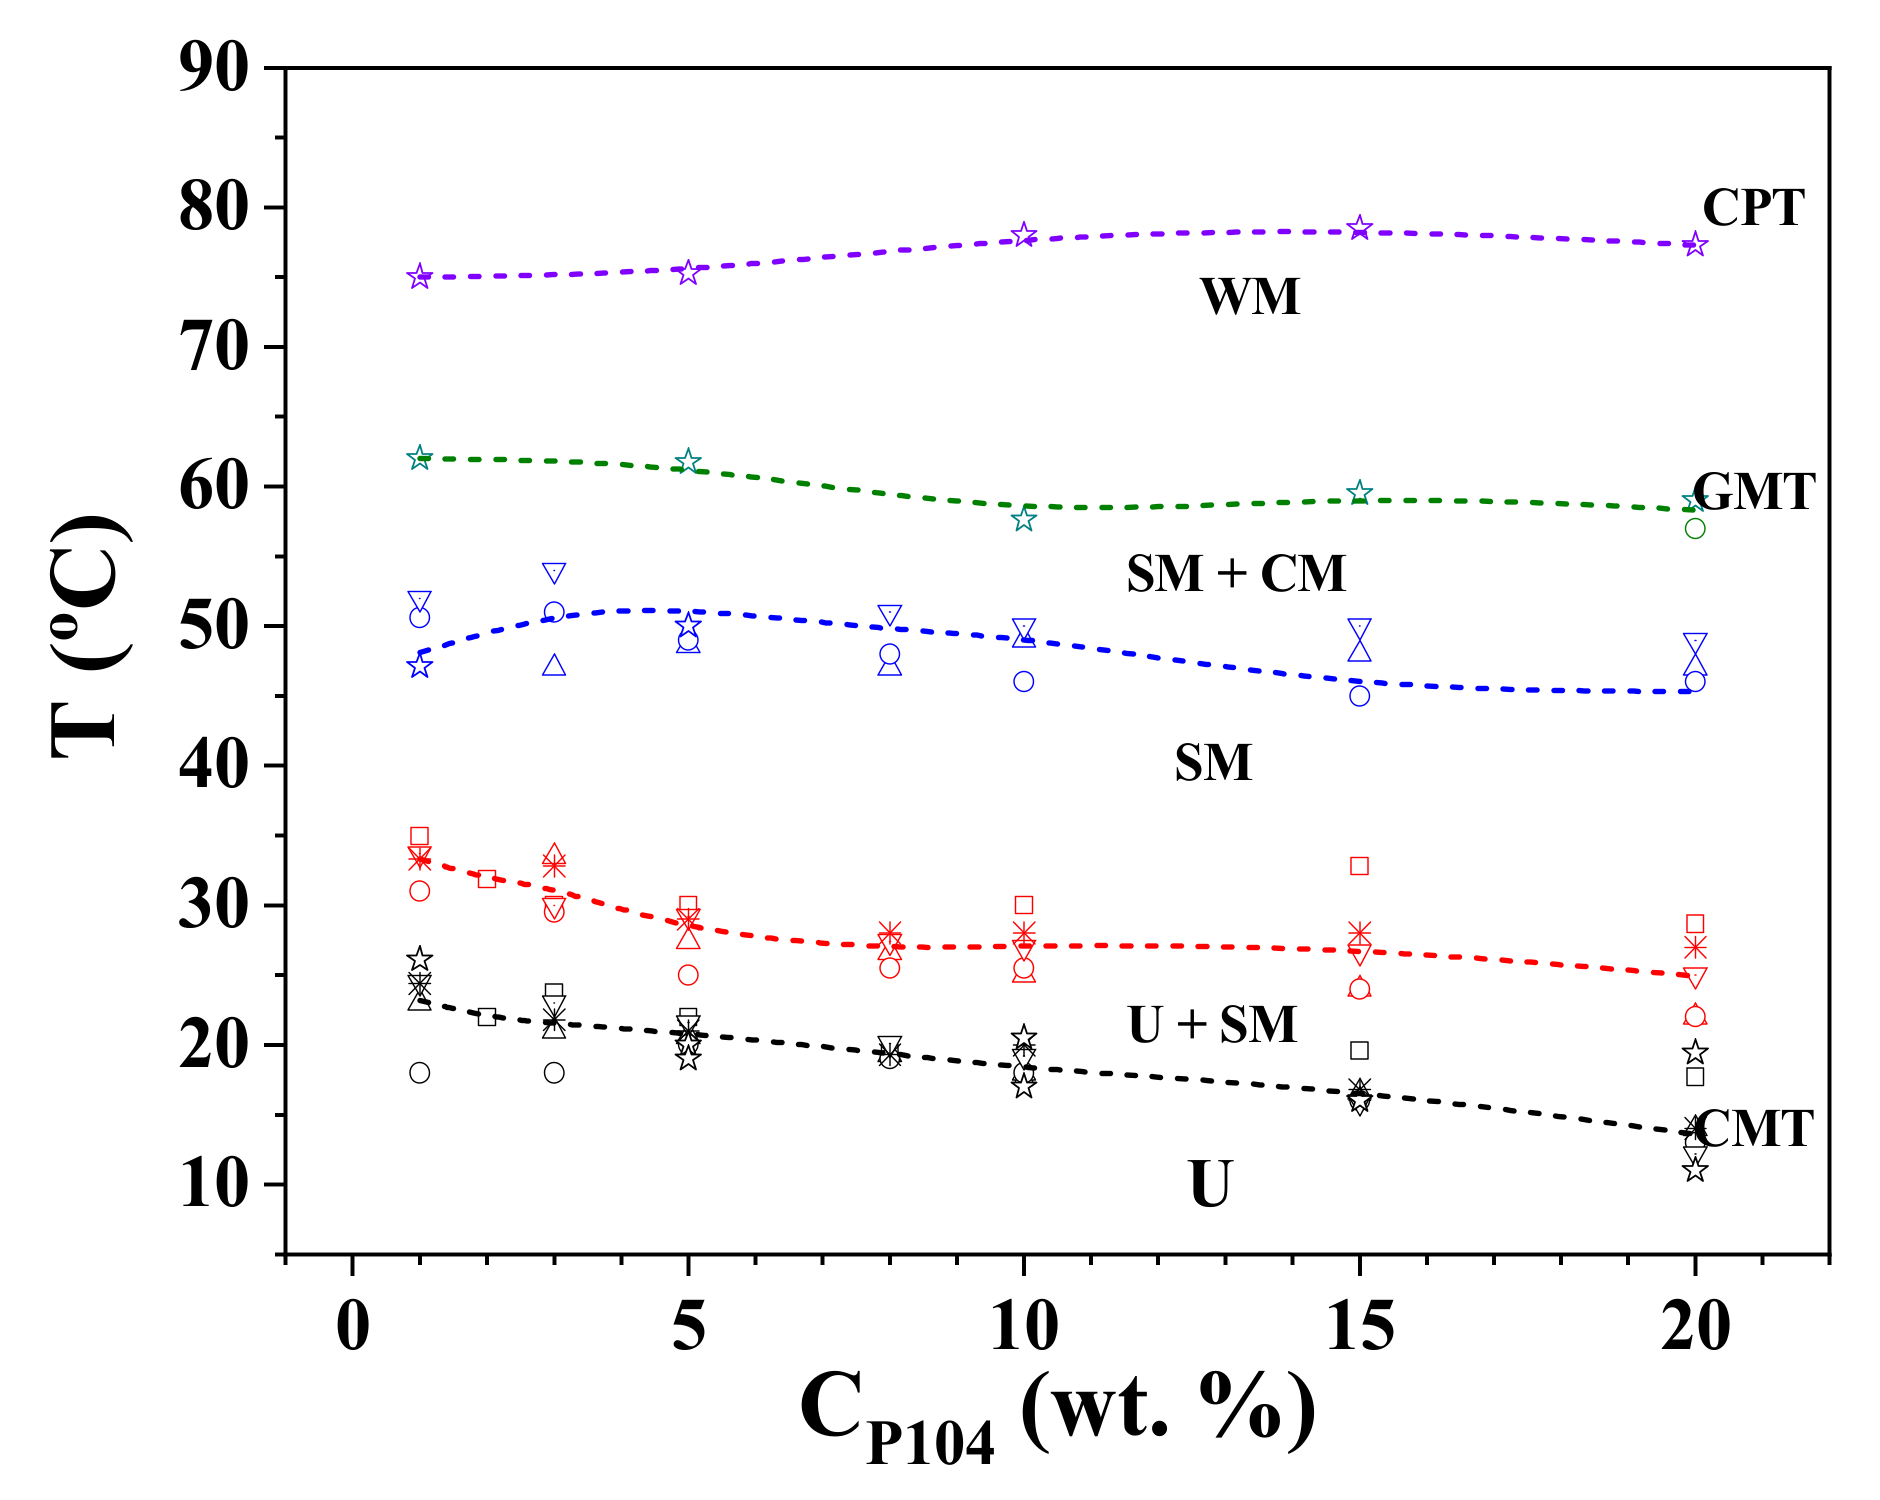
3.8. Temperature-Composition Phase Diagram of P104/Water in the Dilute and Semi-Dilute Regimes

Figure 11 shows a phase diagram for P104/water system. P104/water solutions having concentrations from 1 × 10⁻⁴ to 90 wt.% were inspected as a function of temperature (from 5 to 80 °C) to determine the following boundaries: (i) liquid-soft gel, (ii) soft gel-hard gel, (iii) not birefringent/birefringent and (iv) transparent/opaque. Rheological measurements, previously described, allowed determining P104/water solutions having concentrations that behave like liquid, soft gel, or hard gel materials [102,103,104]. Furthermore, samples that exhibited dynamical and static birefringence (observed through crossed polarizers) were examined using a crossed-light polarized microscope. Figure S6a,b (see in Supplementary Materials) show the optical micrographs of P104/water samples having concentrations of 50 and 30 wt.%, analyzed at the temperatures of at 80 and 74 °C, respectively. The observed textures are characteristic of hexagonal liquid crystals [75,76].
Figure 12 presents the phase diagram for P104/water system in the CP104 range from 0 to 20 wt.%. Here it can be observed that the CMT slightly decreases with the increase of P104 concentration, as previously reported for P104 concentrations from 0.01 to 10 wt.% [2]. Density, sound velocity, dynamic light scattering, and viscosity measurements allowed detecting the existence of micelles and unimers in a wide range of temperatures. The start and the end of the peak of the derivative of the apparent molar adiabatic compressibility (represented by the dashed line) were used to identify the CMT and the temperature at which the micellization is finished. After the GMT (micellar growth temperature), spherical micelles grow into rod-like micelles (prolates), according to the first approximation determined by using Perrin’s model. At higher temperatures, a reversible phase separation takes place and the clouding point is reached, at which a great storage modulus (G′) is detected.

4. Conclusions

In this article, a detailed study of amphiphilic block copolymer P104 was carried out through rheometry and density, sound velocity, viscosity, and DLS measurements in the dilute and semi-dilute regimes between 5 and 90 °C. The hydration number of P104/water system was determined with the resulting data of density and sound velocity measurements, for a set of P104 concentrations, from 1 to 15 wt.%, as a function of temperature. An inflection point in the hydration number curve as a function of temperature was attributed to the CMT, which decreases as P104 concentration increases. The dehydration around the hydrophobic PPO segments forming the core and the hydration of hydrophilic PEO segments forming the corona are responsible of amphiphilic block copolymer micelle formation.
The obtained results from viscosity, density, sound velocity, hydration, DLS, and rheometry allowed analyzing the structural behavior of P104/water system. The critical micellar temperature (CMT) and the micellar growth temperature (MGT) were determined as a function of CP104. It was found that the temperature domains at which P104 spherical micelles and P104 elongated micelles exist are greater than for other triblock copolymers, allowing their applications in a wider field.
The scattered intensity (ISCA) and the hydrodynamic radius (Rh) were obtained through DLS measurements at six different temperatures from the spherical micelle domain to the elongated micelles domain. The dependence of ISCA/ISCA0 with Rh was compared to the Perrin model of prolate ellipsoids, oblate ellipsoids, and spheres, and was found to be close to the predicted behavior for prolate ellipsoids, suggesting that P104 micelles grow as prolate rods. The obtained micellar structure for P104 in water in the temperature range between 25 and 55 °C is suitable to be used as a micellar nanocarrier for drug-controlled release. Their nanoscale size (Rh of 11.4 ± 1 nm) makes them a suitable option for targeted drug delivery applications, including storage, controlled release [105,106,107], and protection of the hydrophobic drugs [108,109,110], as shown in our last study of exchange dynamics with lipidic membranes through hydrophobic pyrene probe transfer [11].
Rheological properties were studied in a P104 concentration range from 5 to 60 wt.% and were found to be greatly dependent on temperature and concentration, since the storage modulus increases between two and three orders of magnitude.
We also report a temperature-composition phase diagram of P104/water system, obtained through visual, optical microscopy and rheological measurements, by using the Hvidt et al. notation, for CP104 from 1 × 10⁻⁴ up to 90 wt.% in the temperature range from 5 to 80 °C. The following boundaries: liquid–soft gel, soft gel–hard gel, not birefringent/birefringent and transparent/opaque, were clearly identified. Finally, we propose a partial phase diagram temperature-composition of the system in the CP104 range from 0 to 20 wt.%, in which the appearance of the different morphologies was identified: unimers (U), spherical micelles (SM), cylindrical micelles (CM), and worm-like micelles (WM).

Supplementary Materials

The following supporting information can be downloaded at: https://www.mdpi.com/article/10.3390/polym15112551/s1, Figure S1: Photographs of P104/water samples having the following concentrations: (a) 3, (b) 20 and (c) 50 wt.%, taken at different temperatures (from 4 to 90 °C), Figure S2: Optical micrographs obtained between crossed polarizers of P104/water solution with a concentration of 50 wt.% at 80 °C, Figure S3: Dynamic viscosity of P104 solutions as a function of the temperature at the following CP104: 1 (), 2 (⬠), 3 (), 5 (), 8 (), 10 (), 15 () and 20 () wt.% Measurements performed at three different angles 30°, 50° and 70°, Figure S4: (a) Apparent molar adiabatic compressibility (Kφ) as a function of temperature for several P104 concentrations: 1, 3, 5, 8, 10, 15 and 20 wt.%. (b) Temperature dependence of apparent molar adiabatic compressibility derivative (dKφ/dT) for different P104 concentrations: 1, 3, 5, 8, 10, 15 and 20 wt.%, Figure S5: Intrinsic asymmetry [Z] = I45° /I135° as a function of temperature P104 concentration of 1 wt.%. I45° and I135° are the scattering intensity measured at 45° and 135° respectively, Figure S6: Optical micrographs obtained between crossed polarizers of P104/water solutions with the following concentrations: (a) 50 wt.% at 80 °C and (b) 30 wt.% at 74 °C.

Author Contributions

Conceptualization, J.F.A.S.-M.; methodology and experiments, E.B.F.-O., L.M.B.-A., R.V.-L., G.L.-G., F.C., L.C.R.-R. and T.D.-V.; software, E.B.F.-O. and E.R.M.-B.; validation, J.F.A.S.-M. and Y.R.; formal analysis, E.R.M.-B., E.B.F.-O. and L.M.B.-A.; investigation, L.M.B.-A.; resources, J.F.A.S.-M., L.M.B.-A. and Y.R.; data curation, E.R.M.-B. and E.B.F.-O.; writing—original draft preparation, L.M.B.-A., E.R.M.-B.; writing—review and editing, L.M.B.-A., J.F.A.S.-M. and E.R.M.-B.; supervision, J.F.A.S.-M.; project administration, J.F.A.S.-M.; funding acquisition, J.F.A.S.-M. and Y.R. All authors have read and agreed to the published version of the manuscript.

Funding

This research was funded by CONACYT, CVU number 350759 and Bourse d’Excellence Eiffel, grant number 812741G.

Institutional Review Board Statement

Not applicable.

Informed Consent Statement

Not applicable.

Data Availability Statement

Data can be found in the figures from the manuscript.

Acknowledgments

L.M.B.-A. acknowledges the scholarship granted by CONACYT from México and the “Bourse d’Excellence Eiffel” granted by the French Government. We acknowledge the Laboratoire de Rhéologie et Procédés, Hélène Galliard, Eric Faivre and all the technical team for their help valuable help and support.

Conflicts of Interest

The authors declare no conflict of interest. The funders had no role in the design of the study; in the collection, analyses, or interpretation of data; in the writing of the manuscript; or in the decision to publish the results.

References

  1. Alexandridis, P.; Lindman, B. Amphiphilic Block Copolymers: Self-Assembly and Applications; Elsevier Science: Amsterdam, The Netherlands, 2000. [Google Scholar] [CrossRef]
  2. Alexandridis, P.; Alan Hatton, T. Poly(Ethylene Oxide)-poly(Propylene Oxide)-poly(Ethylene Oxide) Block Copolymer Surfactants in Aqueous Solutions and at Interfaces: Thermodynamics, Structure, Dynamics, and Modeling. Colloids Surf. A Physicochem. Eng. Asp. 1995, 96, 1–46. [Google Scholar] [CrossRef]
  3. Karayianni, M.; Pispas, S. Self-Assembly of Amphiphilic Block Copolymers in Selective Solvents. In Fluorescence Studies of Polymer Containing Systems; Procházka, K., Ed.; Springer Series on Fluorescence; Springer International Publishing: Cham, Switzerland, 2016; pp. 27–63. [Google Scholar] [CrossRef]
  4. Alexandridis, P. Thermodynamics and Dynamics of Micellization and Micelle-Solute Interactions in Block-Copolymer and Reverse Micellar Systems. Ph.D. Thesis, Massachusetts Institute of Technology, Cambridge, MA, USA, 1994. [Google Scholar]
  5. Riess, G. Micellization of Block Copolymers. Prog. Polym. Sci. 2003, 28, 1107–1170. [Google Scholar] [CrossRef]
  6. Ma, J.W.; Li, X.; Tang, P.; Yang, Y. Self-Assembly of Amphiphilic ABC Star Triblock Copolymers and Their Blends with AB Diblock Copolymers in Solution: Self-Consistent Field Theory Simulations. J. Phys. Chem. B 2007, 111, 1552–1558. [Google Scholar] [CrossRef]
  7. Adams, M.L.; Lavasanifar, A.; Kwon, G.S. Amphiphilic Block Copolymers for Drug Delivery. J. Pharm. Sci. 2003, 92, 1343–1355. [Google Scholar] [CrossRef]
  8. Oh, K.T.; Bronich, T.K.; Kabanov, A.V. Micellar Formulations for Drug Delivery Based on Mixtures of Hydrophobic and Hydrophilic Pluronic® Block Copolymers. J. Control Release 2004, 94, 411–422. [Google Scholar] [CrossRef] [PubMed]
  9. Kabanov, A.V.; Batrakova, E.V.; Alakhov, V.Y. Pluronic® Block Copolymers as Novel Polymer Therapeutics for Drug and Gene Delivery. J. Control Release 2002, 82, 189–212. [Google Scholar] [CrossRef] [PubMed]
  10. Bodratti, A.M.; Alexandridis, P. Formulation of Poloxamers for Drug Delivery. J. Funct. Biomater. 2018, 9, 11. [Google Scholar] [CrossRef]
  11. Bravo-Anaya, L.M.; Landazuri Gómez, G.; Figueroa-Ochoa, E.; Carvajal Ramos, F.; Martínez, J.F.A.S.; Rharbi, Y. Exchange Dynamics between Amphiphilic Block Copolymers and Lipidic Membranes through Hydrophobic Pyrene Probe Transfer. RSC Adv. 2018, 8, 39444–39454. [Google Scholar] [CrossRef]
  12. Kulthe, S.S.; Choudhari, Y.M.; Inamdar, N.N.; Mourya, V. Polymeric Micelles: Authoritative Aspects for Drug Delivery. Des. Monomers Polym. 2012, 15, 465–521. [Google Scholar] [CrossRef]
  13. Schacher, F.; Walther, A.; Müller, A.H.E. Dynamic Multicompartment-Core Micelles in Aqueous Media. Langmuir 2009, 25, 10962–10969. [Google Scholar] [CrossRef]
  14. Xiong, X.-B.; Lavasanifar, A. Amphiphilic Block Copolymer Based Nanocarriers for Drug and Gene Delivery. In Intracellular Delivery: Fundamentals and Applications; Prokop, A., Ed.; Fundamental Biomedical Technologies; Springer: Dordrecht, The Netherlands, 2011; pp. 251–289. [Google Scholar] [CrossRef]
  15. Kim, T.; Seo, H.J.; Choi, J.S.; Jang, H.-S.; Baek, J.; Kim, K.; Park, J.-S. PAMAM-PEG-PAMAM: Novel Triblock Copolymer as a Biocompatible and Efficient Gene Delivery Carrier. Biomacromolecules 2004, 5, 2487–2492. [Google Scholar] [CrossRef] [PubMed]
  16. Yasen, W.; Dong, R.; Zhou, L.; Wu, J.; Cao, C.; Aini, A.; Zhu, X. Synthesis of a Cationic Supramolecular Block Copolymer with Covalent and Noncovalent Polymer Blocks for Gene Delivery. ACS Appl. Mater. Interfaces 2017, 9, 9006–9014. [Google Scholar] [CrossRef] [PubMed]
  17. Yasen, W.; Dong, R.; Zhou, L.; Huang, Y.; Guo, D.; Chen, D.; Li, C.; Aini, A.; Zhu, X. Supramolecular Block Copolymers for Gene Delivery: Enhancement of Transfection Efficiency by Charge Regulation. Chem. Commun. 2017, 53, 12782–12785. [Google Scholar] [CrossRef] [PubMed]
  18. Alakhov, V.; Klinski, E.; Li, S.; Pietrzynski, G.; Venne, A.; Batrakova, E.; Bronitch, T.; Kabanov, A. Block Copolymer-Based Formulation of Doxorubicin. From Cell Screen to Clinical Trials. Colloids Surf. B Biointerfaces 1999, 16, 113–134. [Google Scholar] [CrossRef]
  19. Alakhova, D.Y.; Kabanov, A.V. Pluronics and MDR Reversal: An Update. Mol. Pharm. 2014, 11, 2566–2578. [Google Scholar] [CrossRef]
  20. Waton, G.; Michels, B.; Zana, R. Dynamics of Block Copolymer Micelles in Aqueous Solution. Macromolecules 2001, 34, 907–910. [Google Scholar] [CrossRef]
  21. Michels, B.; Waton, G.; Zana, R. Evidence of Micelle Growth in Aqueous Solutions of the Amphiphilic Poly(Ethylene Oxide)–Poly(Propylene Oxide)–Poly(Ethylene Oxide) Triblock Copolymers from Differential Scanning Microcalorimetry. Colloids Surf. A Physicochem. Eng. Asp. 2001, 183, 55–65. [Google Scholar] [CrossRef]
  22. Wanka, G.; Hoffmann, H.; Ulbricht, W. The Aggregation Behavior of Poly-(Oxyethylene)-Poly-(Oxypropylene)-Poly-(Oxyethylene)-Block-Copolymers in Aqueous Solution. Colloid Polym. Sci. 1990, 268, 101–117. [Google Scholar] [CrossRef]
  23. Mortensen, K.; Brown, W.Y.N. Poly (Ethylene Oxide)-Poly (Propylene Oxide)-Poly (Ethylene Oxide) Triblock Copolymers in Aqueous Solution. The Influence of Relative Block Size. Macromolecules 1993, 26, 4128–4135. [Google Scholar] [CrossRef]
  24. Pedersen, J.S.; Svaneborg, C. Scattering from Block Copolymer Micelles. Curr. Opin. Colloid Interface Sci. 2002, 7, 158–166. [Google Scholar] [CrossRef]
  25. Beaton, L.; Zhang, S.; Kruk, M. Formation of Double-Helical Structures by Silica Nanotubes Templated by Mixtures of Common Nonionic Surfactants in Aqueous Solutions. ACS Nano 2021, 15, 1016–1029. [Google Scholar] [CrossRef] [PubMed]
  26. Awoke, Y.; Chebude, Y.; Díaz, I. Controlling Particle Morphology and Pore Size in the Synthesis of Ordered Mesoporous Materials. Molecules 2020, 25, 4909. [Google Scholar] [CrossRef] [PubMed]
  27. Hvidt, S.; Keiding, K. Rheology and Structures of EO-PO-EO Block Copolymers in Aqueous Solutions. Ann. Trans. Nordic Rheol. Soc. 2009, 17, 103–107. [Google Scholar]
  28. Flodström, K.; Alfredsson, V. Influence of the Block Length of Triblock Copolymers on the Formation of Mesoporous Silica. Microporous Mesoporous Mater. 2003, 59, 167–176. [Google Scholar] [CrossRef]
  29. Kipkemboi, P.; Fogden, A.; Alfredsson, V.; Flodström, K. Triblock Copolymers as Templates in Mesoporous Silica Formation:  Structural Dependence on Polymer Chain Length and Synthesis Temperature. Langmuir 2001, 17, 5398–5402. [Google Scholar] [CrossRef]
  30. Sakai, T.; Alexandridis, P. Single-Step Synthesis and Stabilization of Metal Nanoparticles in Aqueous Pluronic Block Copolymer Solutions at Ambient Temperature. Langmuir 2004, 20, 8426–8430. [Google Scholar] [CrossRef]
  31. Linton, P.; Wennerström, H.; Alfredsson, V. Controlling Particle Morphology and Size in the Synthesis of Mesoporous SBA-15 Materials. Phys. Chem. Chem. Phys. 2010, 12, 3852–3858. [Google Scholar] [CrossRef]
  32. Garripelli, V.K.; Kim, J.-K.; Namgung, R.; Kim, W.J.; Repka, M.A.; Jo, S. A Novel Thermosensitive Polymer with pH-Dependent Degradation for Drug Delivery. Acta Biomater. 2010, 6, 477–485. [Google Scholar] [CrossRef]
  33. Garripelli, V.K.; Kim, J.-K.; Son, S.; Kim, W.J.; Repka, M.A.; Jo, S. Matrix Metalloproteinase-Sensitive Thermogelling Polymer for Bioresponsive Local Drug Delivery. Acta Biomater. 2011, 7, 1984–1992. [Google Scholar] [CrossRef]
  34. Whang, C.-H.; Lee, H.K.; Kundu, S.; Murthy, S.N.; Jo, S. Pluronic-Based Dual-Stimuli Sensitive Polymers Capable of Thermal Gelation and pH-Dependent Degradation for in Situ Biomedical Application. J. Appl. Polym. Sci. 2018, 135, 46552. [Google Scholar] [CrossRef]
  35. Ganguly, R.; Kuperkar, K.; Parekh, P.; Aswal, V.K.; Bahadur, P. Phenol Solubilization in Aqueous Pluronic® Solutions: Investigating the Micellar Growth and Interaction as a Function of Pluronic® Composition. J. Colloid Interface Sci. 2012, 378, 118–124. [Google Scholar] [CrossRef]
  36. Causse, J.; Lagerge, S.; de Menorval, L.C.; Faure, S. Micellar Solubilization of Tributylphosphate in Aqueous Solutions of Pluronic Block Copolymers: Part I. Effect of the Copolymer Structure and Temperature on the Phase Behavior. J. Colloid Interface Sci. 2006, 300, 713–723. [Google Scholar] [CrossRef]
  37. Parmar, A.; Singh, K.; Bahadur, A.; Marangoni, G.; Bahadur, P. Interaction and Solubilization of Some Phenolic Antioxidants in Pluronic® Micelles. Colloids Surf. B 2011, 86, 319–326. [Google Scholar] [CrossRef]
  38. Khimani, M.; Ganguly, R.; Aswal, V.K.; Nath, S.; Bahadur, P. Solubilization of Parabens in Aqueous Pluronic Solutions: Investigating the Micellar Growth and Interaction as a Function of Paraben Composition. J. Phys. Chem. B 2012, 116, 14943–14950. [Google Scholar] [CrossRef] [PubMed]
  39. Linley, S.; Thomson, N.R.; McVey, K.; Sra, K.; Gu, F.X. Influence of Pluronic Coating Formulation on Iron Oxide Nanoparticle Transport in Natural and Oil-Impacted Sandy Aquifer Media. Can. J. Chem. Eng. 2020, 98, 642–649. [Google Scholar] [CrossRef]
  40. Brüsewitz, C.; Schendler, A.; Funke, A.; Wagner, T.; Lipp, R. Novel Poloxamer-Based Nanoemulsions to Enhance the Intestinal Absorption of Active Compounds. Int. J. Pharm. 2007, 329, 173–181. [Google Scholar] [CrossRef]
  41. Kaizu, K.; Alexandridis, P. Effect of Surfactant Phase Behavior on Emulsification. J. Colloid Interface Sci. 2016, 466, 138–149. [Google Scholar] [CrossRef]
  42. Varshney, M.; Morey, T.E.; Shah, D.O.; Flint, J.A.; Moudgil, B.M.; Seubert, C.N.; Dennis, D.M. Pluronic Microemulsions as Nanoreservoirs for Extraction of Bupivacaine from Normal Saline. J. Am. Chem. Soc. 2004, 126, 5108–5112. [Google Scholar] [CrossRef] [PubMed]
  43. Zhang, Y.; Wang, X.; Wu, D. Microencapsulation of N-Dodecane into Zirconia Shell Doped with Rare Earth: Design and Synthesis of Bifunctional Microcapsules for Photoluminescence Enhancement and Thermal Energy Storage. Energy 2016, 97, 113–126. [Google Scholar] [CrossRef]
  44. Heerema, L.; Cakali, D.; Roelands, M.; Goetheer, E.; Verdoes, D.; Keurentjes, J. Micellar Solutions of PEO–PPO–PEO Block Copolymers for in Situ Phenol Removal from Fermentation Broth. Sep. Purif. Technol. 2010, 73, 319–326. [Google Scholar] [CrossRef]
  45. Mandal, M.; Farid, G.; Kruk, M. Swollen Mixed Pluronic Surfactant Micelles as Templates for Mesoporous Nanotubes with Diverse Bridged-Organosilica Frameworks. J. Colloid Interface Sci. 2018, 524, 445–455. [Google Scholar] [CrossRef] [PubMed]
  46. Farid, G.; Kruk, M. Silica Nanotubes with Widely Adjustable Inner Diameter and Ordered Silicas with Ultralarge Cylindrical Mesopores Templated by Swollen Micelles of Mixed Pluronic Triblock Copolymers. Chem. Mater. 2017, 29, 4675–4681. [Google Scholar] [CrossRef]
  47. Svensson, B.; Alexandridis, P.; Olsson, U. Self-Assembly of a Poly(Ethylene Oxide)/Poly(Propylene Oxide) Block Copolymer (Pluronic P104, (EO)27(PO)61(EO)27) in the Presence of Water and Xylene. J. Phys. Chem. B 1998, 102, 7541–7548. [Google Scholar] [CrossRef]
  48. Guo, C.; Wang, J.; Liu, H.; Chen, J. Hydration and Conformation of Temperature-Dependent Micellization of PEO−PPO−PEO Block Copolymers in Aqueous Solutions by FT-Raman. Langmuir 1999, 15, 2703–2708. [Google Scholar] [CrossRef]
  49. Alexandridis, P.; Holzwarth, J.F.; Hatton, T.A. Micellization of Poly(ethylene oxide)-Poly(propylene oxide)-Poly(ethylene oxide) Triblock Copolymers in Aqueous Solutions: Thermodynamics of Copolymer Association. Macromolecules 1994, 27, 2414–2425. [Google Scholar] [CrossRef]
  50. Liang, X.; Guo, C.; Ma, J.; Wang, J.; Chen, S.; Liu, H. Temperature-Dependent Aggregation and Disaggregation of Poly(Ethylene Oxide)-Poly(Propylene Oxide)-Poly(Ethylene Oxide) Block Copolymer in Aqueous Solution. J. Phys. Chem. B 2007, 111, 13217–13220. [Google Scholar] [CrossRef]
  51. Waton, G.; Michels, B.; Zana, R. Dynamics of Micelles of Polyethyleneoxide-Polypropyleneoxide-Polyethyleneoxide Block Copolymers in Aqueous Solutions. J. Colloid Interface Sci. 1999, 212, 593–596. [Google Scholar] [CrossRef]
  52. Kositza, M.J.; Bohne, C.; Alexandridis, P.; Hatton, T.A.; Holzwarth, J.F. Dynamics of Micro- and Macrophase Separation of Amphiphilic Block-Copolymers in Aqueous Solution. Macromolecules 1999, 32, 5539–5551. [Google Scholar] [CrossRef]
  53. Zhao, Y.; Chen, X.; Zhang, G. Mesoscopic Simulation on Phase Behavior of Pluronic P104 Aqueous Solution at Moderate Concentrations. J. Dispers. Sci. Technol. 2008, 29, 1331–1337. [Google Scholar] [CrossRef]
  54. Wen, X.G.; Verrall, R.E. Temperature Study of Sound Velocity and Volume-Related Specific Thermodynamic Properties of Aqueous Solutions of Poly(Ethylene Oxide)–Poly(Propylene Oxide)–Poly (Ethylene Oxide) Triblock Copolymers. J. Colloid Interface Sci. 1997, 196, 215–223. [Google Scholar] [CrossRef]
  55. Alexandridis, P.; Nivaggioli, T.; Hatton, T.A. Temperature Effects on Structural Properties of Pluroncc P104 and F108 PEO-PPO-PEO Block Copolymer Solutions. Langmuir 1995, 11, 1468–1476. [Google Scholar] [CrossRef]
  56. Zhang, X.; Yuan, S.; Xu, G.; Liu, C. Mesoscopic Simulation of the Phase Separation on Triblock Copolymer in Aqueous Solution. Acta Phys.-Chim. Sin. 2007, 23, 139–144. [Google Scholar] [CrossRef]
  57. Luo, H.; Jiang, K.; Liang, X.; Liu, H.; Li, Y. Small Molecule-Mediated Self-Assembly Behaviors of Pluronic Block Copolymers in Aqueous Solution: Impact of Hydrogen Bonding on the Morphological Transition of Pluronic Micelles. Soft Matter. 2020, 16, 142–151. [Google Scholar] [CrossRef] [PubMed]
  58. Nagarajan, R. Solubilization of Hydrocarbons and Resulting Aggregate Shape Transitions in Aqueous Solutions of Pluronic® (PEO–PPO–PEO) Block Copolymers. Colloids Surf. B 1999, 16, 55–72. [Google Scholar] [CrossRef]
  59. Polat, H.; Kutluay, G.; Polat, M. Analysis of Dilution Induced Disintegration of Micellar Drug Carriers in the Presence of Inter and Intra Micellar Species. Colloids Surf. A Physicochem. Eng. Asp. 2020, 601, 124989. [Google Scholar] [CrossRef]
  60. Liu, Y.; Chen, S.-H.; Huang, J.S. Light-Scattering Studies of Concentrated Copolymer Micellar Solutions. Macromolecules 1998, 31, 6226–6233. [Google Scholar] [CrossRef]
  61. Liu, Y.C.; Chen, S.H.; Huang, J.S. Small-Angle Neutron Scattering Studies of the Structure and Interaction of Tri-Block Co-Polymer Micelles in Aqueous Solution. Phys. B Condens. Matter. 1997, 241, 1019–1021. [Google Scholar] [CrossRef]
  62. Liu, Y.; Chen, S.-H.; Huang, J.S. Small-Angle Neutron Scattering Analysis of the Structure and Interaction of Triblock Copolymer Micelles in Aqueous Solution. Macromolecules 1998, 31, 2236–2244. [Google Scholar] [CrossRef]
  63. Jia, L.; Guo, C.; Yang, L.; Xiang, J.; Tang, Y.; Liu, C.; Liu, H. Mechanism of PEO–PPO–PEO Micellization in Aqueous Solutions Studied by Two-Dimensional Correlation FTIR Spectroscopy. J. Colloid Interface Sci. 2010, 345, 332–337. [Google Scholar] [CrossRef]
  64. Su, Y.; Wang, J.; Liu, H. Melt, Hydration, and Micellization of the PEO–PPO–PEO Block Copolymer Studied by FTIR Spectroscopy. J. Colloid Interface Sci. 2002, 251, 417–423. [Google Scholar] [CrossRef]
  65. Guo, C.; Liu, H.; Wang, J.; Chen, J. Conformational Structure of Triblock Copolymers by FT-Raman and FTIR Spectroscopy. J. Colloid Interface Sci. 1999, 209, 368–373. [Google Scholar] [CrossRef] [PubMed]
  66. Nivaggioli, T.; Alexandridis, P.; Hatton, T.A.; Yekta, A.; Winnik, M.A. Fluorescence Probe Studies of Pluronic Copolymer Solutions as a Function of Temperature. Langmuir 1995, 11, 730–737. [Google Scholar] [CrossRef]
  67. Holland, R.J.; Parker, E.J.; Guiney, K.; Zeld, F.R. Fluorescence Probe Studies of Ethylene Oxide/Propylene Oxide Block Copolymers in Aqueous Solution. J. Phys. Chem. 1995, 99, 11981–11988. [Google Scholar] [CrossRef]
  68. Hosseini Nejad, H. Mobility of Small Molecules in PEO-PPO-PEO Triblock Copolymer (F127 and P104) Hydrogels. Ph.D. Thesis, University of Victoria, Victoria, BC, Canada, 2021. [Google Scholar]
  69. Thompson, A.L.; Love, B.J. Thermodynamic Properties of Aqueous PEO–PPO–PEO Micelles of Varying Hydrophilicity with Added Cisplatin Determined by Differential Scanning Calorimetry. J. Therm. Anal. Calorim. 2017, 127, 1583–1592. [Google Scholar] [CrossRef]
  70. Khimani, M.; Verma, G.; Kumar, S.; Hassan, P.A.; Aswal, V.K.; Bahadur, P. PH Induced Tuning of Size, Charge and Viscoelastic Behavior of Aqueous Micellar Solution of Pluronic® P104–Anthranilic Acid Mixtures: A Scattering, Rheology and NMR Study. Colloids Surf. A Physicochem. Eng. Asp. 2015, 470, 202–210. [Google Scholar] [CrossRef]
  71. Stickler, M.; Panke, D.; Wunderlich, W. Solution Properties of Poly(Methyl Methacrylate) in Methyl Methacrylate, 1. Viscosities from the Dilute to the Concentrated Solution Regime. Die Makromol. Chem. 1987, 188, 2651–2664. [Google Scholar] [CrossRef]
  72. Álvarez-Ramírez, J.G.; Fernández, V.V.A.; Macías, E.R.; Rharbi, Y.; Taboada, P.; Gámez-Corrales, R.; Puig, J.E.; Soltero, J.F.A. Phase Behavior of the Pluronic P103/Water System in the Dilute and Semi-Dilute Regimes. J. Colloid Interface Sci. 2009, 333, 655–662. [Google Scholar] [CrossRef]
  73. Aeberhardt, K.; de Laumer, J.-Y.S.; Bouquerand, P.-E.; Normand, V. Ultrasonic Wave Spectroscopy Study of Sugar Oligomers and Polysaccharides in Aqueous Solutions: The Hydration Length Concept. Int. J. Biol. Macromol. 2005, 36, 275–282. [Google Scholar] [CrossRef]
  74. Bravo-Anaya, L.M.; Fierro-Castro, C.; Rharbi, Y.; Martínez, J.F.A.S. Triblock Copolymer P104 Detailed Behavior through a Density, Sound Velocity and DLS Study. AIP Conf. Proc. 2014, 1599, 481–484. [Google Scholar] [CrossRef]
  75. Alexandridis, P.; Olsson, U.; Lindman, B. A Record Nine Different Phases (Four Cubic, Two Hexagonal, and One Lamellar Lyotropic Liquid Crystalline and Two Micellar Solutions) in a Ternary Isothermal System of an Amphiphilic Block Copolymer and Selective Solvents (Water and Oil). Langmuir 1998, 14, 2627–2638. [Google Scholar] [CrossRef]
  76. Muzzalupo, R.; Tavano, L.; Nicoletta, F.P.; Trombino, S.; Cassano, R.; Picci, N. Liquid Crystalline Pluronic 105 Pharmacogels as Drug Delivery Systems: Preparation, Characterization, and in Vitro Transdermal Release. J. Drug Target. 2010, 18, 404–411. [Google Scholar] [CrossRef] [PubMed]
  77. Nolan, S.L.; Phillips, R.J.; Cotts, P.M.; Dungan, S.R. Light Scattering Study on the Effect of Polymer Composition on the Structural Properties of PEO–PPO–PEO Micelles. J. Colloid Interface Sci. 1997, 191, 291–302. [Google Scholar] [CrossRef] [PubMed]
  78. Iqbal, M.; Verrall, R.E. Apparent Molar Volume and Adiabatic Compressibility Studies of Aqueous Solutions of Some Drug Compounds at 25 °C. Can. J. Chem. 1989, 67, 727–735. [Google Scholar] [CrossRef]
  79. Chi, Y.; Xu, S.; Xu, X.; Cao, Y.; Dong, J. Studies of Relationship between Polymer Structure and Hydration Environment in Amphiphilic Polytartaramides. J. Polym. Sci. B Polym. Phys. 2017, 55, 138–145. [Google Scholar] [CrossRef]
  80. Mata, J.P.; Majhi, P.R.; Guo, C.; Liu, H.Z.; Bahadur, P. Concentration, Temperature, and Salt-Induced Micellization of a Triblock Copolymer Pluronic L64 in Aqueous Media. J. Colloid Interface Sci. 2005, 292, 548–556. [Google Scholar] [CrossRef] [PubMed]
  81. Su, Y.; Wang, J.; Liu, H. FTIR Spectroscopic Investigation of Effects of Temperature and Concentration on PEO−PPO−PEO Block Copolymer Properties in Aqueous Solutions. Macromolecules 2002, 35, 6426–6431. [Google Scholar] [CrossRef]
  82. Su, Y.; Liu, H.; Wang, J.; Chen, J. Study of Salt Effects on the Micellization of PEO−PPO−PEO Block Copolymer in Aqueous Solution by FTIR Spectroscopy. Langmuir 2002, 18, 865–871. [Google Scholar] [CrossRef]
  83. Sandler, S.I. Chemical, Biochemical, and Engineering Thermodynamics; John Wiley & Sons: Hoboken, NJ, USA, 2017. [Google Scholar]
  84. Desai, P.R.; Jain, N.J.; Sharma, R.K.; Bahadur, P. Effect of Additives on the Micellization of PEO/PPO/PEO Block Copolymer F127 in Aqueous Solution. Colloids Surf. A Physicochem. Eng. Asp. 2001, 178, 57–69. [Google Scholar] [CrossRef]
  85. Bharatiya, B.; Ghosh, G.; Bahadur, P.; Mata, J. The Effects of Salts and Ionic Surfactants on the Micellar Structure of Tri-Block Copolymer PEO-PPO-PEO in Aqueous Solution. J. Dispers. Sci. Technol. 2008, 29, 696–701. [Google Scholar] [CrossRef]
  86. Khimani, M.; Rao, U.; Bahadur, P.; Bahadur, P. Calorimetric and Scattering Studies on Micellization of Pluronics in Aqueous Solutions: Effect of the Size of Hydrophilic PEO End Blocks, Temperature, and Added Salt. J. Dispers. Sci. Technol. 2014, 35, 1599–1610. [Google Scholar] [CrossRef]
  87. Mazer, N.A.; Benedek, G.B.; Carey, M.C. An Investigation of the Micellar Phase of Sodium Dodecyl Sulfate in Aqueous Sodium Chloride Solutions Using Quasielastic Light Scattering Spectroscopy. J. Phys. Chem. C 1976, 80, 1075–1085. [Google Scholar] [CrossRef]
  88. Sakai, T.; Alexandridis, P. Size- and Shape-Controlled Synthesis of Colloidal Gold through Autoreduction of the Auric Cation by Poly(Ethylene Oxide)–Poly(Propylene Oxide) Block Copolymers in Aqueous Solutions at Ambient Conditions. Nanotechnology 2005, 16, S344–S353. [Google Scholar] [CrossRef] [PubMed]
  89. Bokov, N.A. Experimental Investigation of the Influence of a Temperature Gradient on the Intensity of Light Scattering in Borate Melts. Glass Phys. Chem. 2010, 36, 158–165. [Google Scholar] [CrossRef]
  90. Landazuri, G.; Fernandez, V.V.A.; Soltero, J.F.A.; Rharbi, Y. Kinetics of the Sphere-to-Rod like Micelle Transition in a Pluronic Triblock Copolymer. J. Phys. Chem. B 2012, 116, 11720–11727. [Google Scholar] [CrossRef]
  91. Perrin, F. Mouvement Brownien d’un ellipsoide (II). Rotation libre et dépolarisation des fluorescences. Translation et diffusion de molecules ellipsoidales. J. Phys. Radium 1936, 7, 1–11. [Google Scholar] [CrossRef]
  92. Willis, S.A.; Dennis, G.R.; Zheng, G.; Price, W.S. Hydrodynamic Size and Scaling Relations for Linear and 4 Arm Star PVAc Studied Using PGSE NMR. J. Mol. Liq. 2010, 156, 45–51. [Google Scholar] [CrossRef]
  93. Thomas, H.G.; Lomakin, A.; Blankschtein, D.; Benedek, G.B. Growth of Mixed Nonionic Micelles. Langmuir 1997, 13, 209–218. [Google Scholar] [CrossRef]
  94. Doll, T.A.P.F.; Raman, S.; Dey, R.; Burkhard, P. Nanoscale Assemblies and Their Biomedical Applications. J. R. Soc. Interface 2013, 10, 20120740. [Google Scholar] [CrossRef]
  95. Kjøniksen, A.-L.; Zhu, K.; Pamies, R.; Nyström, B. Temperature-Induced Formation and Contraction of Micelle-Like Aggregates in Aqueous Solutions of Thermoresponsive Short-Chain Copolymers. J. Phys. Chem. B 2008, 112, 3294–3299. [Google Scholar] [CrossRef]
  96. Zhu, K.; Pamies, R.; Kjøniksen, A.-L.; Nyström, B. Temperature-Induced Intermicellization of “Hairy” and “Crew-Cut” Micelles in an Aqueous Solution of a Thermoresponsive Copolymer. Langmuir 2008, 24, 14227–14233. [Google Scholar] [CrossRef]
  97. Guo, L.; Luijten, E. Reversible gel formation of triblock copolymers studied by molecular dynamics simulation. J. Polym. Sci. B Polym. Phys. 2005, 43, 959–969. [Google Scholar] [CrossRef]
  98. Chamradová, I.; Vojtová, L.; Michlovská, L.; Poláček, P.; Jančář, J. Rheological Properties of Functionalised Thermosensitive Copolymers for Injectable Applications in Medicine. Chem. Pap. 2012, 66, 977–980. [Google Scholar] [CrossRef]
  99. Vermonden, T.; Besseling, N.A.M.; van Steenbergen, M.J.; Hennink, W.E. Rheological Studies of Thermosensitive Triblock Copolymer Hydrogels. Langmuir 2006, 22, 10180–10184. [Google Scholar] [CrossRef] [PubMed]
  100. Ferry, J.D. Viscoelastic Properties of Polymers; John Wiley & Sons: Hoboken, NJ, USA, 1980. [Google Scholar]
  101. Klouda, L.; Mikos, A.G. Thermoresponsive Hydrogels in Biomedical Applications. Eur. J. Pharm. Biopharm. 2008, 68, 34–45. [Google Scholar] [CrossRef] [PubMed]
  102. Castelletto, V.; Hamley, I.W.; English, R.J.; Mingvanish, W. SANS and Rheology Study of Aqueous Solutions and Gels Containing Highly Swollen Diblock Copolymer Micelles. Langmuir 2003, 19, 3229–3235. [Google Scholar] [CrossRef]
  103. Kelarakis, A.; Castelletto, V.; Chaibundit, C.; Fundin, J.; Havredaki, V.; Hamley, I.W.; Booth, C. Rheology and Structures of Aqueous Gels of Triblock(Oxyethylene/Oxybutylene/Oxyethylene) Copolymers with Lengthy Oxyethylene Blocks. Langmuir 2001, 17, 4232–4239. [Google Scholar] [CrossRef]
  104. Wang, C.; Hashimoto, K.; Tamate, R.; Kokubo, H.; Morishima, K.; Li, X.; Shibayama, M.; Lu, F.; Nakanishi, T.; Watanabe, M. Viscoelastic Change of Block Copolymer Ion Gels in a Photo-Switchable Azobenzene Ionic Liquid Triggered by Light. Chem. Commun. 2019, 55, 1710–1713. [Google Scholar] [CrossRef]
  105. Yu, J.; Qiu, H.; Yin, S.; Wang, H.; Li, Y. Polymeric Drug Delivery System Based on Pluronics for Cancer Treatment. Molecules 2021, 26, 3610. [Google Scholar] [CrossRef]
  106. Rahdar, A.; Kazemi, S.; Askari, F. Pluronic as nano-carier platform for drug delivery systems. Nanomed. Res. J. 2018, 3, 174–179. [Google Scholar] [CrossRef]
  107. Naharros-Molinero, A.; Caballo-González, M.Á.; de la Mata, F.J.; García-Gallego, S. Direct and Reverse Pluronic Micelles: Design and Characterization of Promising Drug Delivery Nanosystems. Pharmaceutics 2022, 14, 2628. [Google Scholar] [CrossRef]
  108. Basak, R.; Bandyopadhyay, R. Encapsulation of Hydrophobic Drugs in Pluronic F127 Micelles: Effects of Drug Hydrophobicity, Solution Temperature, and pH. Langmuir 2013, 29, 4350–4356. [Google Scholar] [CrossRef] [PubMed]
  109. Prasanthan, P.; Kishore, N. Self-assemblies of pluronic micelles in partitioning of anticancer drugs and effectiveness of this system towards target protein. RSC Adv. 2021, 11, 22057–22069. [Google Scholar] [CrossRef] [PubMed]
  110. Popovici, C.; Popa, M.; Sunel, V.; Atanase, L.I.; Ichim, D.L. Drug Delivery Systems Based on Pluronic Micelles with Antimicrobial Activity. Polymers 2022, 14, 3007. [Google Scholar] [CrossRef] [PubMed]
Figure 1. Dependence of the dynamic viscosity (log η) with reciprocal of absolute temperature (1/T) for P104 concentrations of 1 (), 2 (⬠), 3 (), 5 (), 8 (), 10 (), 15 () and 20 () wt.%. Measurements performed at three different angles 30°, 50° and 70°. Inset: Parameter B as a function of CP104 for zone I (BI) (☐) and zone II (BII) ().
Polymers 15 02551 g001
Figure 2. (a) Density (ρs) as a function of temperature for different P104 concentrations: 0 (-), 0.0001 (☐), of 1 (), 2 (⬠), 3 (), 5 (), 8 (), 10 (), 15 () and 20 () wt.% (b) Sound velocity (Us) as a function of temperature for the same P104 concentrations.
Polymers 15 02551 g002
Figure 3. (a) Derivative of density (s/dT) as a function of temperature for different P104 concentrations: 0, 1, 3, 5, 8, 10, 15, and 20 wt.%. (b) Derivative of sound velocity (dUs/dT) as a function of temperature for the same P104 concentrations.
Polymers 15 02551 g003
Figure 4. (a) Hydration number (nH) as a function of temperature for different P104 concentrations: 1, 3, 5, 8, 10, 15 y 20 wt.%. (b) Derivative of hydration number as a function of temperature for different P104 concentrations.
Polymers 15 02551 g004
Figure 5. (a) Hydration number (nH) as a function of P104 concentration in mol/kg for different temperatures (from 5 to 60 °C). The lines correspond to no linear fit of nH = ae−(b × MP104) + c (average R2 = 0.94 ± 0.02). (b) Arrhenius-type dependence of the hydration number at zero P104 concentration with the reciprocal of the absolute temperature 1/T (K−1).
Polymers 15 02551 g005
Figure 6. Temperature dependence of the hydrodynamic radius (Rh) and the scattered light intensity (ISCA) for 1 wt.% P104 solution in water measured at 90°. The sample was equilibrated at the initial temperature during 24 h before each measurement.
Polymers 15 02551 g006
Figure 7. Normalized scattered intensity ISCA/ISCA0 plotted as a function of the hydrodynamic radius Rh for a P104 solution in water with a concentration of a 1 wt.%. ISCA and Rh were measured at different temperatures. ISCA0 corresponds to the scattering intensity at 38 °C. The plot ISCA/ISCA0 is compared to the Perrin model of prolate ellipsoids, oblate ellipsoids, and spheres.
Polymers 15 02551 g007
Figure 8. (a) Temperature dependences of the turbidity during heating for P104/water system as a function of P104 concentration. (b) Dependence of the first derivative of turbidity (dturbidity/dT) with temperature for different P104 concentrations.
Polymers 15 02551 g008
Figure 9. Strain dependence of G′ and G″ for (a) P104 concentrations of 10, 25, 40, 60, and 80 wt.% at the temperature of 20 °C at a frequency of 10 rad/s and for (b) P104 concentration of 30 wt.% at 10 rad/s at temperatures of 10, 30, and 60 °C.
Polymers 15 02551 g009
Figure 10. Temperature sweeps of P104/water solutions at the following P104 concentrations: (a) 5, (b) 10, (c) 20, and (d) 30 wt.%. Green circles correspond to G′ and blue circles correspond to G″.
Polymers 15 02551 g010
Figure 11. Temperature-composition phase diagram of P104/water system, obtained by visual, optical microscopy, and rheological measurements (using the Hvidt et al. notation [27]).
Polymers 15 02551 g011
Figure 12. Temperature–composition partial phase diagram of P104/water system in the P104 concentration range from 0 to 20 wt.%, obtained by various analytical methods: viscosimetry (☐), density (◯), sound velocity (△), hydration number (▽), turbidity (✳), rheometry (☆), (----- statistical average), unimers (U), spherical micelles (SM), cylindrical micelles (CM), worm-like micelles (WM).
Polymers 15 02551 g012
Table 1. Parameters A and B of Equation (1) obtained by fitting dynamic viscosity experimental data. A and B correspond to the empirical constants in Equation (1). B value represents the energy (kJ/mol) necessary for the fluid to start to flow.
CP104
(wt.%)
AI × 104
(mPa·s)
BI
(kJ/mol)
AIII × 104
(mPa·s)
BIII
(kJ/mol)
16.20 ± 0.42213 ± 2447.80 ± 4.21443 ± 240
24.60 ± 0.22309 ± 1219.90 ± 0.81852 ± 12
32.30 ± 0.22718 ± 18023.30 ± 8.81864 ± 144
52.60 ± 0.42610 ± 6013.90 ± 1.92092 ± 96
80.51 ± 0.143187 ± 6025.80 ± 4.32104 ± 132
100.79 ± 0.013079 ± 841.60 ± 0.82730 ± 276
150.46 ± 0.013199 ± 2650.12 ± 0.064017 ± 120
200.62 ± 0.053512 ± 240.08 ± 1 × 10−44438 ± 12
Table 2. CMT, MGT, and CPT obtained for P104/water system as a function of P104 concentration using different analytical techniques: viscosity, density, sound velocity and rheometry.
CMT (°C)MGT (°C)CPT (°C)
CP104
(wt.%)
ηs/dTdUs/dTdnH/dtTurb.Rheometrys/dTdUs/dTdnH/dtRheometry
12424222524.524--516275
3212221.523.522.5---50--
520202019.521.419 6075
7-191919--
81918.518.52020-53 5151----
101817.617.51919175651.5515875
151615.315.216.516.7165151.5505976
20151312.81414.3115152505975
Table 3. Intercept (A), dehydration energy (ΔEDH) and R2.
Regionexp (A)ΔEDH
(KJ/mol)
R2
I5.4500 ± 0.8610.8 ± 0.40.9741
II1.6700 × 10−7 ± 8 × 10−853.9 ± 1.20.9944
III0.055 ± 0.01420.9 ± 0.70.9862
Disclaimer/Publisher’s Note: The statements, opinions and data contained in all publications are solely those of the individual author(s) and contributor(s) and not of MDPI and/or the editor(s). MDPI and/or the editor(s) disclaim responsibility for any injury to people or property resulting from any ideas, methods, instructions or products referred to in the content.

