Article

Static Permittivity and Electro-Optical Properties of Bi-Component Orthoconic Antiferroelectric Liquid Crystalline Mixtures Targeted for Polymer Stabilized Sensing Systems

1
Department of Physics, Siliguri Institute of Technology, Siliguri 734009, India
2
Department of Physics, University of North Bengal, Siliguri 734013, India
3
Department of Microelectronics and VLSI Technology, Maulana Abul Kalam Azad University of Technology, WB, Kolkata 741249, India
4
Faculty of Advanced Technologies and Chemistry, Military University of Technology, 00-908 Warsaw, Poland
*
Authors to whom correspondence should be addressed.
Polymers 2022, 14(5), 956; https://doi.org/10.3390/polym14050956
Submission received: 1 February 2022 / Revised: 24 February 2022 / Accepted: 24 February 2022 / Published: 27 February 2022
(This article belongs to the Special Issue Polymer-Based Sensors)

Abstract

:
The behavior of two newly formulated bi-component orthoconic antiferroelectric liquid crystalline (OAFLC) systems, i.e., the Compound A + Compound B mixture system and Compound C + Compound B mixture system has been discussed in light of temperature and concentration dependencies of helical pitch length, spontaneous polarization, relaxation time, bulk viscosity, and the anchoring energy strength coefficient, together with static dielectric permittivity (ε) and dielectric anisotropy. Compound A + Compound B mixtures possess spontaneous polarization between 190–340 nC.cm−2 and fast relaxation times between 190–320 µs in the smectic antiferroelectric SmCA* phase at room temperature. Compound C + Compound B mixtures also have a spontaneous polarization in the range of 190–280 nC.cm−2 and relaxation times in the range of 190–230 µs at room temperature. Most of the mixtures have a helical pitch below one micrometer in the SmCA* phase. These advanced mixtures show a broad temperature range of the antiferroelectric SmCA* phase, fast switching of molecules under an applied electric field, negative dielectric anisotropy and a short helical pitch, confirming the advantage of designing new polymer-stabilized OAFLC that is targeted for novel application in sensing devices, utilizing the fast responsive electro-optical modulation elements.

Graphical Abstract

1. Introduction

The liquid crystalline (LC) state is an intermediate state of matter between the solid and isotropic liquid, which was discovered by an Austrian chemist, Friedrich Reinitzer, in 1888 [1]. Since then, extensive research has been performed in the field of liquid crystals. The potential area of the applicability of LC materials is very broad [2]. For the practical application of LC in electro-optic devices, it is necessary to have a reasonable response time of LC in the order of micro-seconds. Meyer et al. [3] discovered micro-second switching behavior in the ferroelectric SmC* phase of liquid crystal, i.e., the synclinic state, which was experimentally demonstrated by Clark and Lagerwall [4]. However, ferroelectric liquid crystalline materials suffer from reduced brightness due to DC compensation with only one bright state. Later, Chandani et al. [5,6] reported the existence of the antiferroelectric (AF) phase, i.e., the anticlinic state of liquid crystal, formed by chiral rod-like molecules. The chiral ferroelectric (FLC) and antiferroelectric (AFLC) materials reveal definite and very attractive properties: the electro-clinic effect is observed in the orthogonal paraelectric SmA* phase [7,8,9,10], thickness independent memory effect is observed in de Vries’ electro-clinic liquid crystals [11,12,13]. Bistable [14,15,16,17,18,19] and thresholdless [9,20,21,22,23] switching is observed in the synclinic-ferroelectric smectic SmC* phase and electroclinic, bistable, thresholdless and tri-stable switching [24] are observed in the smectic antiferroelectric SmCA* phase. In the last few years, the demand for high-switching speed devices has risen tremendously, especially for 3D vision and field-sequential-color (FSC) generation displays [25]. The polymer stabilized blue-phase LCD technology [26] with sub-millisecond switching has also generated huge interest, and there are ongoing activities and development, both in the ferroelectric and antiferroelectric LC areas [27].
AFLC’s possess tri-stable switching behavior, which gives sharp thresholds, easy DC compensation and micro-second responses, and has intrinsic analog gray scale capability, with no ghost effect and the possibility of passive driving [5,6,28]. However, it has experienced a poor contrast due to a strong influence from poor homogeneity of AFLC bookshelf alignment and the so-called pre-transitional effect [29,30,31,32]. Orthoconic AFLC materials (OAFLCs) [33,34,35,36] were proposed as an alternative, as they possess high-speed switching, high-contrast and a dark state, which is ideally perfect [28]. Although OAFLCs are proper materials for achieving lossless phase modulation in three-level phase-only modulator [37] and in beam-steering applications [38], it is necessary to mention that there is a large asymmetry between switching times (τon and τoff), which is even much larger than that for nematic materials or other non-orthoconic smectic materials. This effect is closely related to a delicate balance between the synclinic-ferroelectric (F) and anticlinic-antiferroelectric (AF) state, which in turn strongly depends on the molecular structure of the LC materials, as well as the polarity and surface structure of the cell. This delays the relaxation process, rendering the F-state metastable [39]. The problem of the metastable F-state in AFLCs is solved by a polymer stabilization of the orthoconic state. A small amount, typically <5% weight, of reactive LC monomer and dimmer, and a suitable photo-initiator are mixed into the OAFLC before filling the cell. The orthoconic state is then illuminated by ultraviolet light to cross-link the reactive monomer. After polymer stabilization, the F-state is not metastable any longer, and a rapid relaxation from the bright to dark state is ensured by switching off the field [39,40,41]. Furthermore, V-shaped electro-optic switching [42,43,44] is also a promising effect for fast switching device applications. The polymer-stabilized OAFLC materials possessing a short helical pitch are also particularly appealing due to their potential application in effects based on the deformation of the helical structure [45]; they have attracted increasing interest, mainly due to their potential applications for flow, pressure, gas and electric smart sensing systems used in many significant fields [46,47,48,49,50,51], and therefore, the development of a liquid crystal base mixture is crucial. For all the above-mentioned sensing applications, one of the key points is to develop suitable bi-component OAFLC mixtures to further polymerize them by using suitable monomers and dimers to produce materials with appropriate features. In this work, two binary systems have been prepared to achieve the targeted liquid crystalline properties [52,53,54,55,56,57,58] by tuning the parameters, such as mesomorphic behavior, and electro-optic, structural, dielectric and helical properties according to the specific application requirements. A limited number of antiferroelectric mixtures [59,60,61,62], with either a very long or very short helical pitch, as well as the continuous development of principally new applications of liquid crystalline materials, makes the formulation of new antiferroelectric mixtures with desired helical parameters a significant step in this direction. Therefore, the aim of this work is to prepare and investigate the main properties of the two bi-component OAFLC mixture systems. The sequence of mesophases, the temperature and concentration dependences of the helical pitch, spontaneous polarization, switching time, as well as the viscosity anchoring energy coefficient and static permittivity have been studied to identify those mixtures with suitable and optimal electro-optic properties for further doping with reactive mesogens and a subsequent forming of a polymer network to stabilize and symmetrise the targeted antiferroelectric phase.

2. Materials and Methods

Bi-component mixtures were formulated from three pure antiferroelectric compounds. Sequence of mesophases and the transition temperature of the three pure compounds are as follows: (a) Crystal < 30 °C SmCA* 81.5 °C Iso for Compound A, (b) Crystal < 30 °C SmCA* 93 °C SmC* 108 °C SmA* 110 °C Iso for Compound B and (c) Crystal < 30 °C SmCA* 93 °C SmC* 109 °C SmA* 111 °C Iso for Compound C taken during the cooling cycle. The details on the design and synthesis of these pure compounds are presented in Refs. [63,64,65].
Polymers 14 00956 i001 (S)-4′-(1-methyloctyloxycarbonyl)biphenyl-4-yl4-[3-(2,2,3,3,4,4,4-heptafluorobutoxy)prop-1-oxy]-2-fluorobenzoate (Compound A) [63]
Polymers 14 00956 i002(S)-4′-(1-methylpentyloxycarbonyl)biphenyl-4-yl4-[5-(2,2,3,3,4,4,4-heptafluorobutoxy) pentyl-1-oxy]-2-fluorobenzoate (Compound B) [63]
Polymers 14 00956 i003(S)-4′-(1-methylcyclohexyloxycarbonyl)biphenyl-4-yl4-[7-(2,2,3,3,4,4,4-heptafluorobutoxy)heptyl-1-oxy]benzoate (Compound C) [63]
Two binary mixtures were prepared: (i) the Compound A + Compound B mixture system with mole fraction: x = 0.1, 0.2, 0.3, 0.4, 0.5, 0.6, 0.7, 0.8, 0.9 (x is the concentration of Compound A in the mixture) and (ii) the Compound C + Compound B mixture system with mole fraction: x = 0.1, 0.2, 0.4, 0.6, 0.8 (x is the concentration of Compound C in the mixture). The pure LC compounds were taken in a vial with a fixed proportion (mole fraction) after weighting the liquid crystal material using a high precision digital balance (Mettler Toledo AB-265-S). The compounds were mixed thoroughly by placing the vial in an ultra-sonicator (SONAPROS PR 250-MP) for several hours at a fixed temperature above their clearing temperatures. These mixtures were filled in homogeneously aligned (HG) commercially available LC cells (AWAT Poland) made up of indium tin oxide (ITO) coated glass plates with a cell gap of ~5 µm thickness and an active area of 0.25 cm2, using capillary force and the mixtures were allowed to slowly cool down to room temperature.
Phase transitions temperatures were determined by a polarizing optical microscope (POM) (Motic BA300, 5MP resolutions). The uncertainty in the measurement of phase transition temperatures from thermal scanning is 0.1 °C. The helical pitch length was measured by the selective light reflection method where the intensity of the transmitted light was measured by a Shimadzu UV-VIS-NIR spectrometer in the range of 360–3000 nm. The AML WU7 temperature controller with a Peltier element was used with an accuracy of 0.1 °C, the details of this procedure are given in Ref. [66]. Electro-optical measurements have been performed by applying the square wave of voltage Vpp = 36 V, f = 20 Hz to the sample filled cells by the Picotest (G5100A) arbitrary waveform generator and FLC voltage amplifier (F20A). The applied field inverts the polarization of the polar LC molecules and a current response was observed. The current response was recorded by a digital storage oscilloscope (1052A), suitably interfaced with a computer, the detailed method of which is given in Ref. [67]. The relaxation time, τ, rotational viscosity, η, and the anchoring coefficients Wp and Wd were evaluated for all the mixtures, by a method, the description of which has been given by us in our earlier publications [67]. Static dielectric measurement was performed using a digital LCR-bridge (Agilent E4980A); the permittivity parallel and perpendicular to the molecular long axis, ε|| and ε, respectively, and hence the dielectric anisotropy (Δε = ε|| − ε) were estimated by measuring the capacitance of a liquid crystal cell. The perpendicular component of the electric permittivity (ε) was measured in the planar configuration (homogeneous, HG cell) with 0.5 V external voltage. The parallel component of the permittivity (ε||) was measured by applying an external voltage of 20 V in the HG cell to align the samples to homeotropic configuration. Both parallel and perpendicular components of the dielectric permittivity were measured at a constant frequency of 1 kHz. Further details of the determination of the static permittivity are given in Refs. [68,69].

3. Results

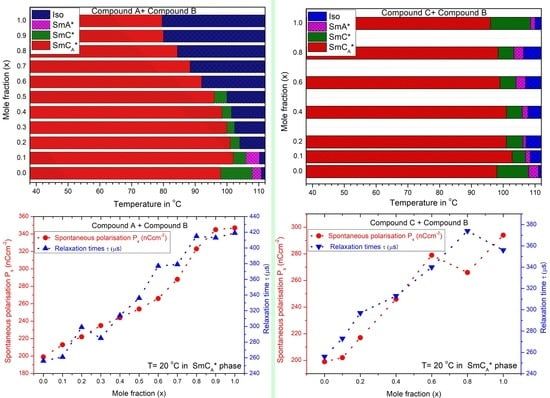
3.1. Mesomorphic Behavior

Phase transition temperatures and sequence of mesophases for the mixtures were obtained by carefully observing the characteristic textures and their changes in POM; this was cross-verified by the optical transmission method. Three types of phase sequences were detected: (i) Cr-SmCA*-SmC*-SmA*-Iso; (ii) Cr-SmCA*-SmC*-Iso; (iii) Cr-SmCA*-Iso. The mixtures possess chiral anticlinic SmCA* phase in a wide temperature range, the ferroelectric tilted SmC* phase in a much smaller range, and the paraelectric orthogonal SmA* phase but only in a quite short temperature range at high temperatures just before the isotropic (Iso) phase transition. Figure 1 presents the phase transition temperatures of the Compound A + Compound B mixture system with mole fraction: x = 0.0, 0.1, 0.2, 0.3, 0.4, 0.5, 0.6, 0.7, 0.8, 0.9, 1.0 (x is the molar concentration of Compound A in the mixture).
Compound A (x = 1.0) possesses the direct SmCA*-Iso phase transition at 81.5 °C. With the decrease in molar concentration of Compound A in the mixture, the temperature of the direct SmCA*-Iso phase transition increases by about ~11.5 °C to reach 92 °C (at x = 0.6). On further decrease in the mole fraction of Compound A, the SmC* phase starts to be more favorable. Mixtures with a direct SmCA*-Iso phase transition may be used as a component of mixtures in OAFLC materials to resolve the occurrence of chevron defects usually present in conventional materials possessing the Cr-SmCA*-SmC*-SmA*-Iso phase transitions; thus, these mixtures may be utilized as potential smart materials for high-contrast, 3D displays applications.
The sequence of mesophases and the phase transition temperatures for the Compound C + Compound B mixture system is shown in Figure 2 (Mole fraction x = 0.0, 0.1, 0.2, 0.4, 0.6, 0.8, 1.0 corresponds to the concentration of Compound C in the mixture). It is clearly observed that it is possible to effectively tune and increase the temperature range of the SmCA* phase in the resulting mixture system.
Figure 3a–e shows characteristic textures in the SmCA*, SmC* and SmA* phases exhibited by Compound A + Compound B system for molar concentration x = 0.4 and Compound C + Compound B system for molar concentration for x = 0.4.

3.2. Static Permittivity and Dielectric Anisotropy

The temperature dependence of the parallel and perpendicular permittivity’s (ε|| and ε) and their average value εavg = (2ε + ε||)/3 for the (Compound A + Compound B) system is shown in Figure 4a–c, respectively. Figure 4b shows that ε values peak in the SmC* phase (~19–28); this enhanced value is due to the temperature-dependent fluctuations of molecules in the direction of the phase angle of the helical structure [69,70,71,72,73,74,75]. The increment of ε is greater than ε|| in the SmC* phase. The values of ε|| and ε are small and almost constant in the SmCA* phase, it increases sharply at the SmCA* − SmC* phase transition temperature for all mixtures. The static permittivity’s contribution in the SmA* phase is weak and is mostly due to the amplitude fluctuation of the polarization vector [76]. Moreover, the absence of the SmC* phase in Compound A leads to its low permittivity value.
The temperature dependence of the dielectric anisotropy (Δε) for Compound A + Compound B mixture system is shown in Figure 5. This system exhibits negative dielectric anisotropy in the SmC* phase as the increment of ε is more pronounced than that of ε|| near the vicinity of the SmA*-SmC* phase transition. The transverse dipole moment of the polar linking ester groups present in all the pure compounds considerably enhances ε with respect to the permittivity values ε||, along the molecular long axis. The dielectric anisotropy values however cross over to small positive values in the SmCA* phase. Additionally, as mentioned earlier, the dielectric anisotropy in the SmA* phase is very small for all the mixtures.
The parallel and perpendicular (ε|| and ε) static permittivity, and the average dielectric permittivity εavg, respectively for Compound C + Compound B mixture system are shown in Figure 6a–c. The results show similar trends with respect to the Compound A + compound B system. It is observed that ε|| and ε increase in the SmC* phase following the Curie–Weiss law.
As observed from Figure 7 for the Compound C + Compound B mixture system, Δε increases abruptly in the SmC* phase and becomes more and more negative with the SmC* phase stabilization (broader temperature range) on changing the concentration.

3.3. Helical Pitch

The results of the helical pitch measurements obtained for the Compound A + Compound B mixture system and Compound C + Compound B mixture system at different temperatures are presented in Figure 8 and Figure 9, respectively.
The sense of the helical twist (+ = right-handed helix, = left-handed helix) and the temperature of the helix twist inversion (fully unwound helix) are also indicated in Figure 8. The parameters of the helix for chosen compositions of mixtures and pure compounds are compared. In the case of the Compound A + Compound B mixture system (for mixtures with x = 0.4 and x = 0.6), the right-handed helix at low temperatures and left-handed helix at high temperatures in the SmCA* phase is observed. For these mixtures, the helical twist sense inversion in the SmCA* phase is clearly present. In general, this behavior is typical for the system in which the compounds with different temperature characteristics and helix handedness are mixed [66]. Mixtures of the Compound C + Compound B mixture system form right-handed helix in the SmC* phase and left-handed helix in the SmCA* phase. As both compounds from this mixture system possess the same helix handedness in the SmC* as well as the SmCA* phases, the temperature characteristics of the helical pitch in binary mixtures are changed stepwise from one pure compound to the other. The helical pitch length measured in the SmC* phase is quite lower than that in the SmCA* phase.
Figure 10 shows the dependence of the helical pitch length upon the concentration of compounds for Compound A + Compound B mixture system at two selected temperatures: (a) 86 °C and (b) 29 °C. Arrows indicate concentration in which the helical pitch is above the measuring range of the spectrophotometer. The sense of the helical twist is indicated. The results show that for the appropriate mixture compositions, both at low and high temperatures, AFLC material with a very long helical pitch can be obtained.
Figure 11 shows the dependence of the helical pitch upon the concentration of the Compound C + Compound B mixture system at (a) 86 °C and (b) 29 °C. The mixtures exhibit a very short helical change in pitch in the SmCA* phase, regardless of the concentration and the temperature.

3.4. Spontaneous Polarization

Figure 12 displays the reduced temperature (T/TC) from Curie point TC (SmA*-SmC* phase transition temperature) versus spontaneous polarization (Ps) for the Compound A + Compound B mixture system at different concentrations. The continuity of the Ps curve implies that the nature of the SmC*-SmA* phase transition is of second order.
The value of Ps decreases with an increase in the temperature and attains their lowest values at the SmC*-SmA* transition temperature. Spontaneous polarization reaches ~340 nC.cm−2 in the SmCA* phase (30 °C); this high value of Ps is due to the contribution from the bulky nature of the chiral unit of the compounds, large dipole moment of the ester linkage and the high (43° to 45°) tilt angle of molecules with respect to the smectic layer normal, which increases the rotational hindrance barrier [67,69,77]. On comparing the variation of molar concentration with Ps of the Compound A + Compound B mixture system, Ps of Compound B is ~190 nC.cm−2 (mole concentration, x = 0.0) and it increases with the increase in molar concentration of Compound A in the mixture. Compound A has a propoxy-(CH2)3O- spacer group in the non-chiral part—the maximum values of Ps of Compound A is due to the volume effect, i.e., a propyl spacer occupies a greater volume than a pentyl spacer (Compound B) and by definition, Ps is proportional to the volume of that compound [77]. The Compound A + Compound B mixture system with mole fraction x = 0.1, 0.2, 0.3, 0.4, 0.5 possesses a comparatively low Ps.
The Compound C + Compound B mixture system possesses the Ps values in the range of 190–285 nC.cm−2 in the SmCA* phase, as shown in Figure 13. The Ps values are the minimum for Compound B, and they start to increase with the increase of the molar concentration of Compound C in the mixture. Maximum Ps of Compound C is caused by the non-fluorinated molecular core, whereas the low Ps of Compound B is due to the presence of one fluorine atom in the molecular core. This analysis is supported by the evidence that in laterally mono and di-fluorinated LC compounds, the orientation of the dipole moment of highly polar lateral fluorine atoms points in an opposite direction with respect to the orientation of the core and the chiral carbon atom. This fluorine atom in the molecular core of chiral molecules traps the π electrons and pulls them away from the conjugation along the main molecular axis. Therefore, lateral substitution by fluorine atoms has a considerable impact on the molecular dipoles related to the generation of the polarization in the ferroelectric and antiferroelectric LCs [67].

3.5. Relaxation Time

Reduced temperature dependence of the relaxation time (τ) for the Compound A + Compound B mixture system is presented in Figure 14, where Tc is the SmA*-SmC phase transition temperature. The values of the relaxation time are below 340 μs in the measured range of the antiferroelectric phase of the mixtures. The relaxation time of the mixture is proportional to its viscosity.
The relaxation time of the mixture is proportional to its viscosity. With temperature increase, the viscosity of liquid crystal diminishes; therefore, the relaxation time also decreases. Relaxation time is maximum in the SmCA* phase due to the high tilt angle of molecules in this phase and is found comparatively less in the SmC* phase. Moreover, for this mixture system, mole fraction x = 0.1 has a lower relaxation time than x = 0.2, which denotes the rise in viscosity with an increase in the concentration of the mixture. Thus, the relaxation time increases with the increase in the concentration of Compound A in this mixture system.
The Compound C + Compound B mixture system has a relaxation time in the range of 185–275 μs in the SmCA* phase, as shown in Figure 15. Similar to the Compound A + Compound B system, the relaxation time decreases with the increase in the concentration of Compound B in the mixtures. Low relaxation times, along with a broad range of the chiral smectic phase, are reported for this mixture system.

3.6. Effective Torsional Bulk Viscosity

To study the dynamic behavior of the FLC and AFLC liquid crystal system, it is important to investigate its effective torsional bulk viscosity (η) [67]. It signifies the speed of the molecular rotation for the SmC* cone upon switching under an applied electric field. Figure 16 shows η as a function of reduced temperature (T/Tc) for the Compound A + Compound B mixture system. The η values are higher in the SmCA* phase than that in the SmC* phase and they follow almost similar trends, as it was observed for τ; η decreases with an increase in temperature. For this mixture system, η is minimum for pure Compound B (reaches ~2200 mPa.s in the SmCA* phase) and increases with the increase in molar concentration of Compound A in the mixture, reaching up to ~8000 mPa.s at 30 °C.
Similar behavior is also observed for the Compound C + Compound B mixture system, as shown in Figure 17. As can be seen from Figure 17, η values are higher in the SmCA* phase as compared to that in the SmC* phase; η values decrease with the increase in molar concentration of Compound B in the mixture. In fact, LC materials with a low viscosity are suitable for the design of high-speed applications, such as virtual reality 3D video generations and sensing devices; therefore, mixtures with a molar concentration of up to x = 0.4 are potentially very promising candidates from a high-speed device application point of view.

3.7. Anchoring Energy Coefficients

The properties of molecular alignment, as well as the memory effect, have been greatly influenced by the anchoring strength of the molecules. This coefficient measures the deviation of the FLC molecule orientation from the anchoring direction. Two main anchoring strengths, that play an important role in ferroelectric and antiferroelectric liquid crystals, are the polarization and dispersion anchoring energy coefficients. FLCs phases have permanent dipole moments at the molecular level; the electrostatic force between the dipole moment of the surface and the liquid crystal molecules gives polarization anchoring strength (Wp). On the contrary, dispersion anchoring strength (Wd) may arise due to dispersion or van der Waals forces, i.e., the non-electrostatic interaction between the surface and the liquid crystal molecules [77,78,79,80].

3.7.1. Dispersion Anchoring Energy Coefficient

Figure 18 shows the dispersion anchoring energy coefficient as a function of reduced temperature (T/TC) for the Compound A + Compound B mixture system. On increasing the temperature, the Wd values decrease and attain a minimum at the SmC*-SmA* phase transition temperature (Curie temperature). This pattern suggests that the enthalpy of the molecule continuously increased with temperature and thus broke their interaction barrier. The maximum value of Wd obtained in the Compound A + Compound B mixture is ~0.032 J.m−2 for Compound A and decreases with an increase in concentration of Compound B. For these binary mixtures, quite a small Wd value indicates the requirement of lower threshold voltage for the operation; therefore, the mixture with lower molecular concentration requires a low electric field to switch the molecules between the OFF and ON states.
The dispersion anchoring energy coefficient for the Compound C + Compound B mixture system also increases stepwise with the increase in molar concentration; however, its very high values are not preferable for practical applications. The maximum value of Wd in the Compound C + Compound B binary mixtures is ~0.025 J.m−2 for Compound C in the SmCA* phase, and similar to the Compound A + Compound B system, it decreases with an increase in mole fraction of Compound B (Figure 19).

3.7.2. Polarization Anchoring Energy Coefficient

The polarization anchoring energy coefficient (Wp) for the Compound A + Compound B and Compound C + Compound B mixture system is shown in Figure 20 and Figure 21, respectively. Characteristic decreasing of Wp with increasing temperature on approaching the SmC*-SmA* phase transition is found for both the mixture systems. The low value of Wp and Wd for the binary mixtures holds under the condition that Ps and viscosity are low.
A comparative result of a study of the electro-optical properties for the Compound A + Compound B mixture system and Compound C + Compound B mixture system extrapolated to 20 °C, are shown in Table 1 and Table 2, respectively. Mixtures with mole fraction, x = 0.2, 0.3, 0.4, 0.5 and 0.6 of the Compound A + Compound B system shows promising material properties due to their relatively high Ps values, fast switching times and moderate values of rotational viscosity along with a wide-ranged SmCA* phase. Similarly, for the Compound C + Compound B mixtures, the appropriate mole fractions for advanced exploration are x = 0.2, 0.4 and 0.6. Such materials, therefore, may be used as starting materials to dope with monomers and dimers to investigate the changes in their physical parameters.

4. Conclusions

Two newly formulated bi-component orthoconic antiferroelectric liquid crystalline mixture systems were designed and their basic parameters were investigated. The temperature and the mole fraction dependence of helical pitch, static dielectric permittivity, dielectric anisotropy and electro-optical properties of the Compound A + Compound B and Compound C + Compound B mixture system have been studied.
Depending on the concentration of the components, the investigated mixture exhibit paraelectric (SmA*), ferroelectric (SmC*) and antiferroelectric (SmCA*) phases over a reasonably broad temperature range down to room temperatures. In the Compound A + Compound B system, a gradual enhancement of the SmCA* phase is observed. However, within this system, for mixtures having a direct phase transition from the isotropic phase to the SmCA* phase, the range of the SmCA* phase increases up to 12.5 °C at x = 0.6, which can potentially be utilized in OAFLC mixtures due to their inherent chevron defect elimination properties. An enhancement in the temperature range of the SmCA* phase is also noticed in the Compound C + Compound B system.
Both designed mixture systems exhibit sufficiently large values of spontaneous polarization (Ps above 200 nC.cm−2), negative dielectric anisotropy, fast switching speed (τ below 350 µs), and low viscosity (below 8 Pa.s) at room temperature. These mixtures can be further polymer-stabilized and used as an attractive candidate for mixtures in high-speed sensing applications.
The dispersion anchoring energy coefficients values range from 0.013 to 0.035 Jm−2; such a lower value indicates the requirement of lower threshold voltage to switch the molecule between the OFF and ON state, which is an important property for the design of effective switching devices.
Mixtures with optimal electro-optic properties from both the binary systems under investigation have been identified. They are x = 0.2, 0.3, 0.4, 0.5 and 0.6 of the Compound A + Compound B mixture system, and x = 0.2, 0.4 and 0.6 for the Compound C + Compound B mixture system. It is proposed that these mixtures will be further polymer-stabilized by adding suitable reactive monomers and dimers to stabilize the structure and properties of the antiferroelectric state in order to symmetrise the performance of surface-stabilized and deformed-helix effects. Further studies in this direction are in progress and will be published separately elsewhere.

Author Contributions

Conceptualization, B.D. and M.C.; validation, M.K.D. and M.D.S.; measurements, S.N. and M.C.; formal analysis, S.N.; writing—original draft preparation, S.N.; sample preparation, M.U. and M.C. All authors have read and agreed to the published version of the manuscript.

Funding

This research was funded by the Department of Science and Technology, New Delhi grant number EMR/2016/005001, the Department of Science and Technology, New Delhi grant number EEQ/2017/000829 and the National Science Centre of Poland, grant number UMO-2015/19/D/ST5/02730.

Institutional Review Board Statement

Not required.

Informed Consent Statement

Not required.

Data Availability Statement

Excluded.

Conflicts of Interest

The authors declare no conflict of interest.

References

  1. Reinitzer, F. Contributions to the knowledge of cholesterol. Liq. Cryst. 1989, 5, 7–18. [Google Scholar] [CrossRef]
  2. Lagerwall, J.P.F.; Scalia, G. A new era for liquid crystal research: Applications of liquid crystals in soft matter nano-, bio- and microtechnology. Curr. Appl. Phys. 2012, 12, 1387–1412. [Google Scholar] [CrossRef]
  3. Meyer, R.B.; Liebert, L.; Strzelecki, L.; Keller, P. Ferroelectric liquid crystals. J. Phys. Lett. 1975, 36, 69–71. [Google Scholar] [CrossRef]
  4. Clark, N.A.; Lagerwall, S.T. Submicrosecond bistable electro-optic switching in liquid crystals. Appl. Phys. Lett. 1980, 36, 899–901. [Google Scholar] [CrossRef]
  5. Chandani, A.D.L.; Hagiwara, T.; Suzuki, Y.; Ouchi, Y.; Takezoe, H.; Fukuda, A. Tristable Switching in Surface Stabilized Ferroelectric Liquid Crystals with a Large Spontaneous Polarization. Jpn. J. Appl. Phys. 1988, 27, L729–L732. [Google Scholar] [CrossRef]
  6. Chandani, A.D.L.; Gorecka, E.; Ouchi, Y.; Takezoe, H.; Fukuda, A. Antiferroelectric Chiral Smectic Phases Responsible for the Trislable Switching in {MHPOBC}. Jpn. J. Appl. Phys. 1989, 28, L1265–L1268. [Google Scholar] [CrossRef]
  7. Garoff, S.; Meyer, R.B. Electroclinic Effect at the AC Phase Change in a Chiral Smectic Liquid Crystal. Phys. Rev. Lett. 1977, 38, 848–851. [Google Scholar] [CrossRef]
  8. Nishiyama, S.; Ouchi, Y.; Takezoe, H.; Fukuda, A. Giant Electroclinic Effect in Chiral Smectic a Phase of Ferroelectric Liquid Crystals. Jpn. J. Appl. Phys. 1987, 26, L1787–L1789. [Google Scholar] [CrossRef]
  9. Davey, A.B.; Crossland, W.A. Potential and limitations of the electroclinic effect in device applications. Ferroelectrics 1991, 114, 101–112. [Google Scholar] [CrossRef]
  10. Malik, A.; Choudhary, A.; Silotia, P.; Biradar, A.M.; Singh, V.K.; Kumar, N. Effect of graphene oxide nanomaterial in electroclinic liquid crystals. J. Appl. Phys. 2010, 108, 124110–124116. [Google Scholar] [CrossRef] [Green Version]
  11. Singh, G.; Choudhary, A.; Kaur, S.; Biradar, A.; Haase, W. Reminiscence Shown by de Vries Electroclinic Liquid Crystal Material. Jpn. J. Appl. Phys. 2007, 46, L559. [Google Scholar] [CrossRef]
  12. Singh, G.; Prakash, G.V.; Choudhary, A.; Biradar, A.M. Electro-optic studies in conventional and pure/ethanol mixed de Vries ferroelectric liquid crystals. Liq. Cryst. 2012, 39, 185–190. [Google Scholar] [CrossRef]
  13. Choudhary, A.; Kaur, S.; Singh, G.; Prakash, J.; Thakur, A.K.; Biradar, A.M. Memory effect in Sm C* phase of electroclinic liquid crystals. J. Appl. Phys. 2007, 101, 74112. [Google Scholar] [CrossRef]
  14. Glogarová, M.; Pavel, J.; Bawa, S.S.; Demus, D.; Diele, S.; Pelzl, G. Macroscopic properties of mixed chiral smectic liquid crystals. Liq. Cryst. 1988, 3, 353–361. [Google Scholar] [CrossRef]
  15. Dozov, I. 26.1: Invited Paper: Bistable Liquid Crystal Technologies. SID Symp. Dig. Tech. Pap. 2003, 34, 946–949. [Google Scholar] [CrossRef]
  16. Pozhidaev, E.P.; Chigrinov, V.G. Bistable and multistable states in ferroelectric liquid crystals. Crystallogr. Rep. 2006, 51, 1030–1040. [Google Scholar] [CrossRef]
  17. Talarico, M.; Golemme, A. Bistable Switching in Photorefractive Surface Stabilized Ferroelectric Liquid Crystals. Mol. Cryst. Liq. Cryst. 2007, 465, 341–358. [Google Scholar] [CrossRef]
  18. Sutkowski, M.; Grudniewski, T.; Piecek, W.; Morawiak, P.; Parka, J.; Nowinowski-Kruszelnicki, E.; Raszewski, Z. Holographic Recordings Using Bistable SmC * Structures. Mol. Cryst. Liq. Cryst. 2009, 502, 195–206. [Google Scholar] [CrossRef]
  19. Sutkowski, M.; Piecek, W.; Grudniewski, T.; Parka, J.; Nowinowski-Kruszelnicki, E. Light driven optical switching of the surface stabilized antiferroelectric liquid crystals. Opt. Lasers Eng. 2011, 49, 1330–1334. [Google Scholar] [CrossRef]
  20. O’Callaghan, M.J.; Wand, M.; Walker, C.; Thurmes, W.; More, K. High-Tilt, High-PS, de Vries FLCs for Analog Electro-Optic Phase Modulation. Ferroelectrics 2006, 343, 201–207. [Google Scholar] [CrossRef]
  21. Petrenko, A.; Goodby, J.W. V-Shaped switching and interlayer interactions in ferroelectric liquid crystals. J. Mater. Chem. 2007, 17, 766–782. [Google Scholar] [CrossRef]
  22. Hammarquist, A.; D’Havé, K.; Matuszczyk, M.; Clark, N.A.; MacLennan, J.E.; Rudquist, P. V-shaped switching ferroelectric liquid crystal structure stabilized by dielectric surface layers. Phys. Rev. E-Stat. Nonlinear Soft Matter Phys. 2008, 77, 031707. [Google Scholar] [CrossRef] [PubMed] [Green Version]
  23. Urruchi, V.; Gaona, N.; Sánchez-Pena, J.M. Evaluation of the Phase Modulation During V-Shaped Switching in a Smectic Liquid Crystal Device. Mol. Cryst. Liq. Cryst. 2008, 494, 272–281. [Google Scholar] [CrossRef]
  24. Lagerwall, S.T. Ferroelectric and antiferroelectric liquid crystals. Ferroelectrics 2004, 301, 15–45. [Google Scholar] [CrossRef]
  25. Bos, P.; Bhowmik, A. Liquid-Crystal Technology Advances toward Future True 3-D Flat-Panel Displays. Inf. Disp. 2011, 27, 6–10. [Google Scholar] [CrossRef]
  26. Kikuchi, H.; Yokota, M.; Hisakado, Y.; Yang, H.; Kajiyama, T. Polymer-stabilized liquid crystal blue phases. Nat. Mater. 2002, 1, 64–68. [Google Scholar] [CrossRef]
  27. Rudquist, P. Orthoconic antiferroelectric liquid crystals. Liq. Cryst. 2013, 40, 1678–1697. [Google Scholar] [CrossRef]
  28. D’havé, K.; Rudquist, P.; Lagerwall, S.T.; Pauwels, H.; Drzewinski, W.; Dabrowski, R. Solution of the dark state problem in antiferroelectric liquid crystal displays. Appl. Phys. Lett. 2000, 76, 3528–3530. [Google Scholar] [CrossRef]
  29. Johno, M.; Itoh, K.; Lee, J.; Ouchi, Y.; Takezoe, H.; Fukuda, A.; Kitazume, T. Temporal and Spatial Behavior of the Field-Induced Transition between Antiferroelectric and Ferroelectric Phases in Chiral Smectics. Jpn. J. Appl. Phys. 1990, 29, L107–L110. [Google Scholar] [CrossRef]
  30. Beccherelli, R.; Elston, S.J. Evaluation of optical anisotropy in the pretransitional regime in antiferroelectric liquid crystals. Liq. Cryst. 1998, 25, 573–577. [Google Scholar] [CrossRef]
  31. Pandey, M.; Verma, R.; Dhar, R. Dielectric and Electro-Optical Properties of Antiferroelectric Liquid Crystalline Materials. Isr. J. Chem. 2012, 52, 895. [Google Scholar] [CrossRef]
  32. Piecek, W.; Dbrowski, R.; Morawiak, P.; Urowska, M.; Jaroszewicz, L. The orthoconic antiferroelectric smectic liquid crystals and their engineering by doping with homo- and heterostructural compounds. Phase Transit. 2012, 85, 910–929. [Google Scholar] [CrossRef]
  33. D’Havé, K.; Dahlgren, A.; Rudquist, P.; Lagerwall, J.P.F.; Andersson, G.; Matuszczyk, M.; Lagerwall, S.T.; Dabrowski, R.; Drzewinski, W. Antiferroelectric liquid crystals with 45° tilt—A new class of promising electro-optic materials. Ferroelectrics 2000, 244, 115–128. [Google Scholar] [CrossRef]
  34. Lagerwall, S.T.; Dahlgren, A.; Jägemalm, P.; Rudquist, P.; D’havé, K.; Pauwels, H.; Dabrowski, R.; Drzewinski, W. Unique Electro-Optical Properties of Liquid Crystals Designed for Molecular Optics. Adv. Funct. Mater. 2001, 11, 87–94. [Google Scholar] [CrossRef]
  35. Piecek, W.; Perkowski, P.; Raszewski, Z.; Morawiak, P.; Żurowska, M.; Dąbrowski, R.; Czupryński, K. Long Pitch Orthoconic Antiferroelectric Binary Mixture for Display Applications. Mol. Cryst. Liq. Cryst. 2010, 525, 140–152. [Google Scholar] [CrossRef]
  36. Pandey, M.B.; Dabrowski, R.; Dhar, R. Investigation of relaxation processes in anticlinic smectic C* (Sm CA*) phase of Liquid Crystals by dielectric spectroscopy. Phys. B Condens. Matter 2007, 387, 25–31. [Google Scholar] [CrossRef]
  37. Engström, D.; Rudquist, P.; Bengtsson, J.; D’havé, K.; Galt, S. Three-level phase modulator based on orthoconic antiferroelectric liquid crystals. Opt. Lett. 2006, 31, 3158–3160. [Google Scholar] [CrossRef]
  38. Engström, D.; O’Callaghan, M.J.; Walker, C.; Handschy, M.A. Fast beam steering with a ferroelectric-liquid-crystal optical phased array. Appl. Opt. 2009, 48, 1721–1726. [Google Scholar] [CrossRef]
  39. Rudquist, P.; Elfström, D.; Lagerwall, S.T.; Dabrowski, R. Polymer-Stabilized Orthoconic Antiferroelectric Liquid Crystals. Ferroelectrics 2006, 344, 177–188. [Google Scholar] [CrossRef]
  40. Czerwiński, M.; Urbańska, M.; Bennis, N.; Rudquist, P. Influence of the type of phase sequence and polymer-stabilization on the physicochemical and electro-optical properties of novel high-tilt antiferroelectric liquid crystalline materials. J. Mol. Liq. 2019, 288, 111057. [Google Scholar] [CrossRef]
  41. Czerwiński, M.; Blas, M.; Bennis, N.; Herman, J.; Dmochowska, E.; Otón, J. Polymer stabilized highly tilted antiferroelectric liquid crystals—The influence of monomer structure and phase sequence of base mixtures. J. Mol. Liq. 2020, 327, 114869. [Google Scholar] [CrossRef]
  42. Engström, D.; Rudquist, P.; Bengtsson, J.; D’havé, K.; Galt, S. Near-lossless continuous phase modulation using the analog switching mode (V-shaped switching) in ferroelectric liquid crystals. Appl. Opt. 2006, 45, 5258–5269. [Google Scholar] [CrossRef]
  43. Seomun, S.S.; Takanishi, Y.; Ishikawa, K.; Takezoe, H.; Fukuda, A. Evolution of switching characteristics from tristable to V-shaped in an apparently antiferroelectric liquid crystal. Jpn. J. Appl. Phys. Part 1 Regul. Pap. Short Notes Rev. Pap. 1997, 36, 3586–3590. [Google Scholar] [CrossRef]
  44. Seomun, S. Bulk optical properties in binary mixtures of antiferroelectric liquid crystal compounds showing V-shaped switching. Liq. Cryst. 1999, 26, 151–161. [Google Scholar] [CrossRef]
  45. Pozhidaev, E.P.; Vashchenko, V.V.; Mikhailenko, V.V.; Krivoshey, A.I.; Barbashov, V.A.; Shi, L.; Srivastava, A.K.; Chigrinov, V.G.; Kwok, H.S. Ultrashort helix pitch antiferroelectric liquid crystals based on chiral esters of terphenyldicarboxylic acid. J. Mater. Chem. C 2016, 4, 10339–10346. [Google Scholar] [CrossRef]
  46. Brodzeli, Z.; Silvestri, L.; Michie, A.; Guo, Q.; Pozhidaev, E.; Chigrinov, V.G.; Ladouceur, F. Sensors at Your Fibre Tips: A Novel Liquid Crystal-Based Photonic Transducer for Sensing Systems. J. Light. Technol. 2013, 31, 2940–2946. [Google Scholar] [CrossRef]
  47. Brodzeli, Z.; Silvestri, L.; Michie, A.; Guo, Q.; Pozhidaev, E.P.; Chigrinov, V.; Ladouceur, F. Reflective mode of deformed-helix ferroelectric liquid crystal cells for sensing applications. Liq. Cryst. 2013, 40, 1427–1435. [Google Scholar] [CrossRef]
  48. Firth, J.; Ladouceur, F.; Brodzeli, Z.; Wyres, M.; Silvestri, L. A novel optical telemetry system applied to flowmeter networks. Flow Meas. Instrum. 2016, 48, 15–19. [Google Scholar] [CrossRef]
  49. Firth, J.; Ladouceur, F.; Brodzeli, Z.; Bruin, C.; Wang, H.; Silvestri, L. Liquid Crystal based optical telemetry applied to 4–20mA current loop networks. Sens. Actuators A Phys. 2017, 260, 124–130. [Google Scholar] [CrossRef]
  50. Firth, J.; Brodzeli, Z.; Ciobotaru, M.; Phung, T.; Brodzeli, Z.; Silvestri, L. Accurate optical measurement of high voltage waveform using novel optical liquid crystal based sensor. Sens. Actuators A Phys. 2017, 268. [Google Scholar] [CrossRef]
  51. Al Abed, A.; Srinivas, H.; Firth, J.; Ladouceur, F.; Lovell, N.H.; Silvestri, L. A biopotential optrode array: Operation principles and simulations. Sci. Rep. 2018, 8, 2690. [Google Scholar] [CrossRef] [PubMed]
  52. Chełstowska, A.; Czerwiński, M.; Tykarska, M.; Bennis, N. The influence of antiferroelectric compounds on helical pitch of orthoconic W-1000 mixture. Liq. Cryst. 2014, 41, 812–820. [Google Scholar] [CrossRef] [Green Version]
  53. Inui, S.; Iimura, N.; Suzuki, T.; Iwane, H.; Miyachi, K.; Takanishi, Y.; Fukuda, A. Thresholdless antiferroelectricity in liquid crystals and its application to displays. J. Mater. Chem. 1996, 6, 671–673. [Google Scholar] [CrossRef]
  54. Tykarska, M.; Skrzypek, K.; Ścibior, E.; Samsel, A. Helical Pitch in Bicomponent Mixtures with Induced Antiferroelectric Phase. Mol. Cryst. Liq. Cryst. 2006, 449, 71–77. [Google Scholar] [CrossRef]
  55. Fitas, J.; Marzec, M.; Kurp, K.; Żurowska, M.; Tykarska, M.; Bubnov, A. Electro-optic and dielectric properties of new binary ferroelectric and antiferroelectric liquid crystalline mixtures. Liq. Cryst. 2017, 44, 1468–1476. [Google Scholar] [CrossRef]
  56. Bubnov, A.; Vacek, C.; Czerwiński, M.; Vojtylová, T.; Piecek, W.; Hamplová, V. Design of polar self-assembling lactic acid derivatives possessing submicrometre helical pitch. Beilstein J. Nanotechnol. 2018, 9, 333–341. [Google Scholar] [CrossRef] [Green Version]
  57. Kurp, K.; Czerwiński, M.; Tykarska, M.; Salamon, P.; Bubnov, A. Design of functional multicomponent liquid crystalline mixtures with nano-scale pitch fulfilling deformed helix ferroelectric mode demands. J. Mol. Liq. 2019, 290, 111329. [Google Scholar] [CrossRef]
  58. Piecek, W.; Bubnov, A.; Perkowski, P.; Morawiak, P.; Ogrodnik, K.; Rejmer, W.; Żurowska, M.; Hamplová, V.; Kašpar, M. An effect of structurally non-compatible additive on the properties of a long-pitch orthoconic antiferroelectric mixture. Phase Transit. 2010, 83, 551–563. [Google Scholar] [CrossRef]
  59. Żurowska, M.; Dziaduszek, J.; Szala, M.; Morawiak, P.; Bubnov, A. Effect of lateral fluorine substitution far from the chiral center on mesomorphic behaviour of highly titled antiferroelectric (S) and (R) enantiomers. J. Mol. Liq. 2017, 267, 504–510. [Google Scholar] [CrossRef]
  60. Novotná, V.; Hamplová, V.; Kašpar, M.; Glogarová, M.; Bubnov, A.; Lhotáková, Y. Phase Diagrams of Binary Mixtures of Antiferroelectric and Ferroelectric Compounds with Lactate Units in the Mesogenic Core. Ferroelectrics 2004, 309, 103–109. [Google Scholar] [CrossRef]
  61. Fitas, J.; Marzec, M.; Szymkowiak, M.; Jaworska-Gołąb, T.; Deptuch, A.; Tykarska, M.; Kurp, K.; Żurowska, M.; Bubnov, A. Mesomorphic, electro-optic and structural properties of binary liquid crystalline mixtures with ferroelectric and antiferroelectric liquid crystalline behaviour. Phase Transit. 2018, 91, 1017–1026. [Google Scholar] [CrossRef]
  62. Vojtylová-Jurkovičová, T.; Vaňkátová, P.; Urbańska, M.; Hamplová, V.; Sýkora, D.; Bubnov, A. Effective control of optical purity by chiral HPLC separation for ester-based liquid crystalline materials forming anticlinic smectic phases. Liq. Cryst. 2021, 48, 43–53. [Google Scholar] [CrossRef]
  63. Milewska, K.; DrzewiDski, W.; CzerwiDski, M.; Dabrowski, R. Design, synthesis and mesomorphic properties of chiral benzoates and fluorobenzoates with direct SmCA*-Iso phase transition. Liq. Cryst. 2015, 42, 1601–1611. [Google Scholar] [CrossRef]
  64. Milewska, K.; Drzewiński, W.; Czerwiński, M.; Dąbrowski, R.; Piecek, W. Highly tilted liquid crystalline materials possessing a direct phase transition from antiferroelectric to isotropic phase. Mater. Chem. Phys. 2016, 171, 33–38. [Google Scholar] [CrossRef]
  65. Żurowska, M.; Dąbrowski, R.; Dziaduszek, J.; Garbat, K.; Filipowicz, M.; Tykarska, M.; Rejmer, W.; Czupryński, K.; Spadło, A.; Bennis, N.; et al. Influence of alkoxy chain length and fluorosubstitution on mesogenic and spectral properties of high tilted antiferroelectric esters. J. Mater. Chem. 2011, 21, 2144–2153. [Google Scholar] [CrossRef]
  66. Tykarska, M.; Czerwiński, M.; Żurowska, M.; Czerwí, M.; Urbańska, M. The temperature and concentration dependence of helical pitch in the mixtures of antiferroelectric compounds with the opposite helical twist sense. Liq. Cryst. 2011, 38, 561–566. [Google Scholar] [CrossRef]
  67. Pramanik, A.; Das, M.K.; Das, B.; Żurowska, M.; Dąbrowski, R. Electro-optical properties of a new series of fluorinated antiferroelectric orthoconic liquid crystalline esters. Liq. Cryst. 2015, 42, 412–421. [Google Scholar] [CrossRef]
  68. Barman, B.; Das, B.; Das, M.K.; Hamplová, V.; Bubnov, A. Effect of molecular structure on dielectric and electro-optic properties of chiral liquid crystals based on lactic acid derivatives. J. Mol. Liq. 2019, 283, 472–481. [Google Scholar] [CrossRef]
  69. Nepal, S.; Mondal, S.; Sinha, A.; Das, B.; Das, M.K.; Dmochowska, E.; Herman, J.; Czerwiński, M. Fast switching behaviour and dielectric parameters of two chiral ferroelectric mesogens. Liq. Cryst. 2020, 47, 1464–1472. [Google Scholar] [CrossRef]
  70. Chakraborty, S.; Das, M.K.; Bubnov, A.; Weissflog, W.; Węgłowska, D.; Dabrowski, R. Induced frustrated twist grain boundary liquid crystalline phases in binary mixtures of achiral hockey stick-shaped and chiral rod-like materials. J. Mater. Chem. C 2019, 7, 10530–10543. [Google Scholar] [CrossRef]
  71. Nepal, S.; Das, B.; Das, M.K.; Sarkar, M.D.; Dabrowski, R. Dielectric spectroscopy and electrical conductivity measurements of a series of orthoconic antiferroelectric liquid crystalline esters. Ferroelectrics 2021, 570, 100–114. [Google Scholar] [CrossRef]
  72. Nepal, S.; Das, B.; Das, M.K.; Strójwąs, K.; Urbańska, M. Dielectric spectroscopy and electrical conductivity measurements on high-tilted antiferroelectric materials. Phase Transit. 2020, 93, 909–923. [Google Scholar] [CrossRef]
  73. Malik, P.; Raina, K.; Bubnov, A.; Chaudhary, A.; Singh, R. Electro-optic switching and dielectric spectroscopy studies of ferroelectric liquid crystals with low and high spontaneous polarization. Thin Solid Films 2010, 519, 1052–1055. [Google Scholar] [CrossRef]
  74. Malik, P.; Raina, K.K.; Bubnov, A.; Prakash, C. Dielectric spectroscopy of a high-polarization ferroelectric liquid crystal. Phase Transit. 2006, 79, 889–898. [Google Scholar] [CrossRef]
  75. Rychetský, I.; Glogarová, M.; Bubnov, A.M. Dynamic dielectric response of SmC* thin layer in planar geometry-thickness mode relaxation. Ferroelectrics 1998, 212, 21–28. [Google Scholar] [CrossRef]
  76. Gouda, F.; Skarp, K.; Lagerwall, S.T. Dielectric studies of the soft mode and Goldstone mode in ferroelectric liquid crystals. Ferroelectrics 1991, 113, 165–206. [Google Scholar] [CrossRef]
  77. Pramanik, A.; Das, M.K.; Das, B.; Dąbrowski, R. Preparation and Study of the Electro-optical Properties of Binary Mixtures of Orthoconic Anti-ferroelectric Esters and Achiral Phenyl Pyrimidine Liquid Crystal. Soft Mater. 2015, 13, 201–209. [Google Scholar] [CrossRef]
  78. Allagulov, A.I.; Pikin, S.A.; Chigrinov, V.G. Bistable and monostable polarized states of a liquid-crystalline ferroelectric in an electric field. Liq. Cryst. 1989, 5, 1099–1105. [Google Scholar] [CrossRef]
  79. Misra, A.K.; Srivastava, A.K.; Shukla, J.P.; Manohar, R. Dielectric and electro-optical parameters of two ferroelectric liquid crystals: A comparative study. Phys. Scr. 2008, 78, 065602. [Google Scholar]
  80. Manohar, R.; Yadav, S.P.; Pandey, K.K.; Srivastava, A.K.; Misra, A.K. Comparative study of dielectric and electro-optical properties of pure and polymer ferroelectric liquid crystal composites. J. Polym. Res. 2011, 18, 435–441. [Google Scholar] [CrossRef]
Figure 1. Sequence of mesophases and phase transition temperatures of the Compound A + Compound B mixture system with mole fraction: x = 0.0, 0.1, 0.2, 0.3, 0.4, 0.5, 0.6, 0.7, 0.8, 0.9, 1.0 (x is the molar concentration of Compound A in the mixture) recording using POM during cooling.
Polymers 14 00956 g001
Figure 2. Sequence of mesophases and phase transition temperatures of the Compound C + Compound B mixture system with mole fraction: x = 0.0, 0.1, 0.2, 0.4, 0.6, 0.8, 1.0 (x is the concentration of Compound C in the mixture) recording using POM during cooling.
Polymers 14 00956 g002
Figure 3. Optical textures under crossed polarizers in (a) SmC* phase (100 °C) for the Compound A+ Compound B system (x = 0.4), (b) SmCA*phase (85°C) phase for the Compound A + Compound B system (x = 0.4), (c) SmA* phase (107 °C) for the Compound C + Compound B system (x = 0.4), (d) SmC* phase (105 °C) for the Compound C + Compound B system (x = 0.4), (e) SmCA*phase (85 °C) phase for the Compound C + Compound B system (x = 0.4).
Polymers 14 00956 g003aPolymers 14 00956 g003b
Figure 4. The (a) parallel, (b) perpendicular dielectric permittivity’s (ε|| and ε) and (c) their average value (εavg) of the Compound A + Compound B mixture system.
Polymers 14 00956 g004aPolymers 14 00956 g004b
Figure 5. Temperature dependence of dielectric anisotropy (Δε) for the Compound A + Compound B mixture system. Negative dielectric anisotropy is observed in the SmC* phase for definite concentrations of Compound A in this mixture system.
Polymers 14 00956 g005
Figure 6. The (a) parallel, (b) perpendicular dielectric permittivity’s (ε|| and ε) and (c) average value (εavg) of the Compound C + Compound B mixture system.
Polymers 14 00956 g006aPolymers 14 00956 g006b
Figure 7. Temperature dependence of dielectric anisotropy (Δε) for the Compound C + Compound B mixture system.
Polymers 14 00956 g007
Figure 8. Temperature dependence of the helical pitch length for the Compound A + Compound B mixture system. Arrows of the corresponding color indicate the temperatures at which the helix became fully unwounded. The sense of the helical twist is indicated by “+” for the right-handed helix and by “ “for the left-handed helix.
Polymers 14 00956 g008
Figure 9. Temperature dependence of the helical pitch length for the Compound C + Compound B mixture system. The sense of the helical twist is indicated by “+” for the right-handed helix and by “ “ for the left-handed helix.
Polymers 14 00956 g009
Figure 10. Dependence of helical pitch upon the concentration of compounds for the Compound A + Compound B mixture system at (a) 86 °C and (b) 29 °C. Arrows indicate concentration in which the helical pitch is above the measuring range of the spectrophotometer. The sense of the helical twist is indicated by “+”for the right-handed helix and by “ “for the left-handed helix.
Polymers 14 00956 g010
Figure 11. Dependence of helical pitch upon concentration of compounds for the Compound C + Compound B mixture system at (a) 86 °C and (b) 29 °C. Arrows indicate concentration in which the helical pitch is above the measuring range of the spectrophotometer. The sense of the helical twist is indicated by “ “for the left-handed helix.
Polymers 14 00956 g011
Figure 12. Experimental values of spontaneous polarization (Ps) as a function of reduced temperature (T/Tc) for the Compound A + Compound B mixture system.
Polymers 14 00956 g012
Figure 13. Experimental values of spontaneous polarization (Ps) as a function of reduced temperature (T/Tc) of the Compound C + Compound B mixture system.
Polymers 14 00956 g013
Figure 14. Relaxation time (τ) as a function of reduced temperature (T/Tc) for the Compound A + Compound B mixture system.
Polymers 14 00956 g014
Figure 15. Relaxation time (τ) as a function of reduced temperature (T/Tc) of the Compound C + Compound B mixture system.
Polymers 14 00956 g015
Figure 16. Effective torsional bulk viscosity (η) as a function of reduced temperature (T/Tc) of the Compound A + Compound B mixture system.
Polymers 14 00956 g016
Figure 17. Effective torsional bulk viscosity (η) as a function of reduced temperature (T/Tc) of the Compound C + Compound B mixture system.
Polymers 14 00956 g017
Figure 18. Dispersion anchoring energy coefficient (Wd) versus reduced temperature T/TC for the Compound A + Compound B mixture system.
Polymers 14 00956 g018
Figure 19. Dispersion anchoring energy coefficient (Wd) versus reduced temperature T/TC for the Compound C + Compound B mixture system.
Polymers 14 00956 g019
Figure 20. Polarization anchoring energy coefficient (Wp) versus reduced temperature T/TC for the Compound A + Compound B mixture system.
Polymers 14 00956 g020
Figure 21. Polarization anchoring energy coefficient (Wp) versus reduced temperature T/TC for the Compound C + Compound B mixture system.
Polymers 14 00956 g021
Table 1. Electro-optical properties of the Compound A + Compound B mixture system extrapolated to 20 °C.
Mole
Fraction (x)
Ps (nC·cm−2)τ (µs)ƞ (mPa.s)Wd (J·m−2)Wp (J·m−2)
0.019925626000.0200.016
0.121326135680.0210.017
0.222229935670.0220.017
0.323528545480.0240.019
0.424431454000.0240.020
0.525433655770.0250.020
0.626637771860.0250.021
0.728837980900.0280.024
0.832341589450.0310.026
0.9345413101020.0340.027
1.0347419105540.0340.028
Table 2. Electro-optical properties of the Compound C + Compound B mixture system extrapolated to 20 °C.
Mole
Fraction (x)
Ps (nC.cm−2)τ (µs)ƞ (mPa.s)Wd (J.m−2)Wp (J.m−2)
0.019925626000.0190.016
0.120227354700.0200.018
0.221729756530.0210.018
0.424631365730.0240.020
0.627934075290.0260.021
0.826637484000.0250.020
1.029435666390.0270.021
Publisher’s Note: MDPI stays neutral with regard to jurisdictional claims in published maps and institutional affiliations.

