
The Influence of the Process Parameters on the Mechanical Properties of PLA Specimens Produced by Fused Filament Fabrication—A Review


Abstract
:1. Introduction
- •
- Surface requirements: surface texture, appearance, color;
- •
- Geometric requirements: linear and angular dimensions, dimensional tolerances, geometrical tolerances (deviations in shape and relative position);
- •
- Mechanical requirements: hardness, tensile strength, impact strength, compressive strength, flexural strength, fatigue strength, creep, ageing, frictional coefficient, shear resistance and crack extension;
- •
- Build material requirements: density, physical properties and chemical properties.
- •
- Slicing parameters: layer thickness, printing speed/flow rate, nozzle diameter, raster parameters, number of wall lines, wall thickness, top layer thickness, bottom layer thickness;
- •
- Temperature parameters: printing head temperature, build plate temperature, build volume temperature (printer with/without closed space), cooling;
- •
- Infill parameters: infill density and infill pattern;
- •
- Build orientation parameters and the use of support material.
2. From Pre-Process Conditions to Mechanical Characterization of FFF PLA
2.1. The Manufacturing and Storage Conditions of the Filament
2.2. The Design of the Model and the Selection of the Infill Parameters
2.3. The Selection of the Process Parameters
2.4. The Type of the 3D-Printing Equipment
2.5. The Post-Process Treatments, Storage and Ageing
2.6. The Mechanical Tests Conditions
3. Layer Thickness
4. Printing Speed
5. Printing Head Temperature and Build Plate Temperature
6. Build Orientation of the Specimens
7. Raster Angle
- •
- Inter-layer failure, when the failure occurs at the interface between two adjacent layers [77] (ex. the breaking of tensile specimens with ZY or ZX orientations);
- •
- Inter-line failure (the breaking surface aligned with the raster angle—Figure 4);
- •
- In-layer failure or in-line failure (the breaking surface is not aligned with the raster angle or the interface between two adjacent layers).
8. Discussions and Conclusions
Author Contributions
Funding
Data Availability Statement
Conflicts of Interest
References
- Gordelier, T.J.; Thies, P.R.; Turner, L.; Johanning, L. Optimising the FDM additive manufacturing process to achieve maximum tensile strength: A state-of-the-art review. Rapid Prototyp. J. 2019, 25, 953–971. [Google Scholar] [CrossRef]
- International Organization for Standardization. ISO/ASTM 52900:2015; Additive Manufacturing—General Principles—Terminology. International Organization for Standardization: Geneva, Switzerland, 2015.
- Zhang, P.; Wang, Z.; Li, J.; Li, X.; Cheng, L. From materials to devices using fused deposition modeling: A state-of-art review. Nanotechnol. Rev. 2020, 9, 1594–1609. [Google Scholar] [CrossRef]
- International Organization for Standardization. ISO 17296-3:2014; Additive Manufacturing—General Principles—Part 3: Main Characteristics and Corresponding Test Methods. International Organization for Standardization: Geneva, Switzerland, 2014.
- Goh, G.D.; Yap, Y.L.; Tan, H.K.J.; Sing, S.L.; Goh, G.L.; Yeong, W.Y. Process-Structure-Properties in Polymer Additive Manufacturing via Material Extrusion: A Review. Crit. Rev. Solid State Mat. Sci. 2020, 45, 113–133. [Google Scholar] [CrossRef]
- Popescu, D.; Zapciu, A.; Amza, C.; Baciu, F.; Marinescu, R. FDM process parameters influence over the mechanical properties of polymer specimens: A review. Polym. Test. 2018, 69, 157–166. [Google Scholar] [CrossRef]
- Harris, M.; Potgieter, J.; Archer, R.; Arif, K.M. Effect of Material and Process Specific Factors on the Strength of Printed Parts in Fused Filament Fabrication: A Review of Recent Developments. Materials 2019, 12, 1664. [Google Scholar] [CrossRef] [PubMed] [Green Version]
- Vettori, M.; Bergonzi, L. A territorial round-robin experiment for the evaluation of mechanical properties of FDM PLA produced by distributed facilities. In Proceedings of the 49th Italian-Association-for-Stress-Analysis Conference (AIAS), Genova, Italy, 2–5 September 2020; Volume 1038. [Google Scholar] [CrossRef]
- Dey, A.; Yodo, N. A Systematic Survey of FDM Process Parameter Optimization and Their Influence on Part Characteristics. J. Manuf. Mater. Process. 2019, 3, 64. [Google Scholar] [CrossRef] [Green Version]
- Topcu, I. Mechanical properties of PLA and ABS parts produced with fused filament fabrication method. J. Ceram. Process. Res. 2021, 22, 143–148. [Google Scholar]
- Tymrak, B.M.; Kreiger, M.; Pearce, J. Mechanical Properties of Components Fabricated with Open- Source 3-D Printers Under Realistic Environmental Conditions. Mater. Des. 2014, 58, 242–246. [Google Scholar] [CrossRef] [Green Version]
- Ebel, E.; Sinnemann, T. Fabrication of FDM 3D objects with ABS and PLA determination of their mechanical properties. Rtejournal 2014, 2014, 1–12. Available online: https://rtejournal.de/paper (accessed on 14 December 2021).
- Algarni, M.; Ghazali, S. Comparative Study of the Sensitivity of PLA, ABS, PEEK, and PETG’s Mechanical Properties to FDM Printing Process Parameters. Crystals 2021, 11, 995. [Google Scholar] [CrossRef]
- Kristiawan, R.B.; Imaduddin, F.; Ariawan, D.; Arifin, Z. A review of the fused depostion modeling (FDM) 3D printing: Filament processing, materials, and printing parameters. Open Eng. 2021, 11, 639–649. [Google Scholar] [CrossRef]
- Nyiranzeyimana, G.; Mutua, J.M.; Mose, B.R.; Mbuya, T.O. Optimization of process parameters in fused deposition modelling of thermoplastics: A review. Materialwiss. Werkstofftech. 2021, 52, 682–694. [Google Scholar] [CrossRef]
- Cuan-Urquizo, E.; Barocio, E.; Tejada-Ortigoza, V.; Pipes, R.B.; Rodriguez, C.A.; Roman-Flores, A. Characterization of the Mechanical Properties of FFF Structures and Materials: A Review on the Experimental, Computational and Theoretical Approaches. Materials 2019, 12, 895. [Google Scholar] [CrossRef] [PubMed] [Green Version]
- International Organization for Standardization. ISO/ASTM 52921:2013; Standard Terminology for Additive Manufacturing—Coordinate Systems and Test Methodologies. International Organization for Standardization: Geneva, Switzerland, 2013.
- Hodzic, D.; Pandzic, A.; Hajro, I.; Tasic, P. Strength Comparison of FDM 3D Printed PLA Made by Different Manufacturers. TEM J. 2020, 9, 966–970. [Google Scholar] [CrossRef]
- Kuznetsov, V.E.; Solonin, A.N.; Urzhumtsev, O.D.; Schilling, R.; Tavitov, A.G. Strength of PLA Components Fabricated with Fused Deposition Technology Using a Desktop 3D Printer as a Function of Geometrical Parameters of the Process. Polymers 2018, 10, 313. [Google Scholar] [CrossRef] [Green Version]
- Wittbrodt, B.; Pearce, J.M. The effects of PLA color on material properties of 3-D printed components. Addit. Manuf. 2015, 8, 110–116. [Google Scholar] [CrossRef] [Green Version]
- Spina, R. Performance Analysis of Colored PLA Products with a Fused Filament Fabrication Process. Polymers 2019, 11, 1984. [Google Scholar] [CrossRef] [Green Version]
- Torres, J.; Cole, M.; Owji, A.; DeMastry, Z.; Gordon, A.P. An approach for mechanical property optimization of fused deposition modeling with polylactic acid via design of experiments. Rapid Prototyp. J. 2016, 22, 387–404. [Google Scholar] [CrossRef]
- Farazin, A.; Mohammadimehr, M. Effect of different parameters on the tensile properties of printed Polylactic acid samples by FDM: Experimental design tested with MDs simulation. Int. J. Adv. Manuf. Technol. 2022, 118, 103–118. [Google Scholar] [CrossRef]
- Samykano, M. Mechanical Property and Prediction Model for FDM-3D Printed Polylactic Acid (PLA). Arab. J. Sci. Eng. 2021, 46, 7875–7892. [Google Scholar] [CrossRef]
- Pratama, J.; Cahyono, S.I.; Suyitno, S.; Muflikhun, M.A.; Salim, U.A.; Mahardika, M.; Arifvianto, B. A Review on the Reinforcement Methods for Polymeric Materials Processed by Using Fused Filament Fabrication (FFF). Polymers 2021, 13, 4022. [Google Scholar] [CrossRef] [PubMed]
- Chacon, J.M.; Caminero, M.A.; Garcia-Plaza, E.; Nunez, P.J. Additive manufacturing of PLA structures using fused deposition modelling: Effect of process parameters on mechanical properties and their optimal selection. Mater. Des. 2017, 124, 143–157. [Google Scholar] [CrossRef]
- Hanon, M.M.; Marczis, R.; Zsidai, L. Influence of the 3D Printing Process Settings on Tensile Strength of PLA and HT-PLA. Period. Polytech-Mech. Eng. 2021, 65, 38–46. [Google Scholar] [CrossRef]
- Laureto, J.J.; Pearce, J.M. Anisotropic mechanical property variance between ASTM D638-14 type I and type IV fused filament fabricated specimens. Polym. Test 2018, 68, 294–301. [Google Scholar] [CrossRef] [Green Version]
- Khosravani, M.R.; Reinicke, T. Effects of raster layup and printing speed on strength of 3D-printed structural components. In Proceedings of the 1st European-Structural-Integrity-Society (ESIS) Virtual European Conference on Fracture (ECF), Virtual, 29 June–1 July 2020; pp. 720–725. [Google Scholar] [CrossRef]
- Kuznetsov, V.E.; Solonin, A.N.; Tavitov, A.; Urzhumtsev, O.; Vakulik, A. Increasing strength of FFF three-dimensional printed parts by influencing on temperature-related parameters of the process. Rapid Prototyp. J. 2020, 26, 107–121. [Google Scholar] [CrossRef]
- Lee, C.Y.; Liu, C.Y. The influence of forced-air cooling on a 3D printed PLA part manufactured by fused filament fabrication. Addit. Manuf. 2019, 25, 196–203. [Google Scholar] [CrossRef]
- Hasan, M.S.; Ivanov, T.; Vorkapic, M.; Simonovic, A.; Daou, D.; Kovacevic, A.; Milovanovic, A. Impact of Aging Effect and Heat Treatment on the Tensile Properties of PLA (Poly Lactic Acid) Printed Parts. Mater. Plast. 2020, 57, 147–159. [Google Scholar] [CrossRef]
- Benwood, C.; Anstey, A.; Andrzejewski, J.; Misra, M.; Mohanty, A.K. Improving the Impact Strength and Heat Resistance of 3D Printed Models: Structure, Property, and Processing Correlationships during Fused Deposition Modeling (FDM) of Poly(Lactic Acid). ACS Omega 2018, 3, 4400–4411. [Google Scholar] [CrossRef]
- Behzadnasab, M.; Yousefi, A.A.; Ebrahimibagha, D.; Nasiri, F. Effects of processing conditions on mechanical properties of PLA printed parts. Rapid Prototyp. J. 2020, 26, 381–389. [Google Scholar] [CrossRef]
- Liu, Z.G.; Wang, Y.Q.; Wu, B.C.; Cui, C.Z.; Guo, Y.; Yan, C. Critical review of fused deposition modeling 3D printing technology in manufacturing polylactic acid parts. Int. J. Adv. Manuf. Technol. 2019, 102, 2877–2889. [Google Scholar] [CrossRef]
- Valerga, A.P.; Batista, M.; Salguero, J.; Girot, F. Influence of PLA Filament Conditions on Characteristics of FDM Parts. Materials 2018, 11, 1322. [Google Scholar] [CrossRef] [Green Version]
- Algarni, M. The Influence of Raster Angle and Moisture Content on the Mechanical Properties of PLA Parts Produced by Fused Deposition Modeling. Polymers 2021, 13, 237. [Google Scholar] [CrossRef]
- Barrasa, J.O.; Ferrandez-Montero, A.; Ferrari, B.; Pastor, J.Y. Characterisation and Modelling of PLA Filaments and Evolution with Time. Polymers 2021, 13, 2899. [Google Scholar] [CrossRef]
- Ambrus, S.; Soporan, R.A.; Kazamer, N.; Pascal, D.T.; Muntean, R.; Dume, A.I.; Marginean, G.M.; Serban, V.A. Characterization and mechanical properties of fused deposited PLA material. Mater. Today-Proc. 2021, 45, 4356–4363. [Google Scholar] [CrossRef]
- Pastor-Artigues, M.M.; Roure-Fernandez, F.; Ayneto-Gubert, X.; Bonada-Bo, J.; Perez-Guindal, E.; Buj-Corral, I. Elastic Asymmetry of PLA Material in FDM-Printed Parts: Considerations Concerning Experimental Characterisation for Use in Numerical Simulations. Materials 2020, 13, 15. [Google Scholar] [CrossRef] [PubMed] [Green Version]
- ASTM International. ASTM D638-14; Standard Test Method for Tensile Properties of Plastics. ASTM International: West Conshohocken, PA, USA, 2014.
- International Organization for Standardization. ISO 527-2:2012; Plastics—Determination of Tensile Properties—Part 2: Test Conditions for Molding and Extrusion Plastics. International Organization for Standardization: Geneva, Switzerland, 2012.
- ASTM International. ASTM D790-10; Standard Test Methods for Flexural Properties of Unreinforced and Rein-forced Plastics and Electrical Insulating Materials. ASTM International: West Conshohocken, PA, USA, 2010.
- International Organization for Standardization. ISO 178:2019; Plastics—Determination of Flexural Properties. International Organization for Standardization: Geneva, Switzerland, 2019.
- Sierra, J.; Sanin, D.; Montoya, A.; Villaneda, W. Relation Between Mechanical Properties and 3D Printer Configurations Parameters Using PLA at Open-Source Prusa I3. Int. J. Integr. Eng. 2020, 12, 97–108. [Google Scholar] [CrossRef]
- International Organization for Standardization. ISO 527-5:2021; Plastics—Determination of Tensile Properties—Part 5: Test Conditions for Unidirectional Fibre-Reinforced Plastic Composites. International Organization for Standardization: Geneva, Switzerland, 2021.
- ASTM International. ASTM D3039/D3039M-08; Standard Test Method for Tensile Properties of Polymer Matrix Composite Materials. ASTM International: West Conshohocken, PA, USA, 2008.
- Valean, C.; Marsavina, L.; Marghitas, M.; Linul, E.; Razavi, J.; Berto, F. Effect of manufacturing parameters on tensile properties of FDM printed specimens. In Proceedings of the 1st Mediterranean Conference on Fracture and Structural Integrity (MedFract), Athens, Greece, 26–28 February 2020; pp. 313–320. [Google Scholar] [CrossRef]
- Verbeeten, W.M.H.; Lorenzo-Banuelos, M.; Arribas-Subinas, P.J. Anisotropic rate-dependent mechanical behavior of Poly(Lactic Acid) processed by Material Extrusion Additive Manufacturing. Addit. Manuf. 2020, 31, 100968. [Google Scholar] [CrossRef]
- Vidakis, N.; Petousis, M.; Velidakis, E.; Liebscher, M.; Mechtcherine, V.; Tzounis, L. On the Strain Rate Sensitivity of Fused Filament Fabrication (FFF) Processed PLA, ABS, PETG, PA6, and PP Thermoplastic Polymers. Polymers 2020, 12, 2924. [Google Scholar] [CrossRef]
- Bayraktar, O.; Uzun, G.; Cakiroglu, R.; Guldas, A. Experimental study on the 3D-printed plastic parts and predicting the mechanical properties using artificial neural networks. Polym. Adv. Technol. 2017, 28, 1044–1051. [Google Scholar] [CrossRef]
- Tezel, T.; Kovan, V. Determination of optimum production parameters for 3D printers based on nozzle diameter. Rapid Prototyp. J. 2021, 28, 185–194. [Google Scholar] [CrossRef]
- Triyono, J.; Sukanto, H.; Saputra, R.M.; Smaradhana, D.F. The effect of nozzle hole diameter of 3D printing on porosity and tensile strength parts using polylactic acid material. Open Eng. 2020, 10, 762–768. [Google Scholar] [CrossRef]
- Alafaghani, A.; Qattawi, A.; Alrawi, B.; Guzman, A. Experimental Optimization of Fused Deposition Modelling Processing Parameters: A Design-for-Manufacturing Approach. Procedia Manuf. 2017, 10, 791–803. [Google Scholar] [CrossRef]
- Alafaghani, A.; Qattawi, A. Investigating the effect of fused deposition modeling processing parameters using Taguchi design of experiment method. J. Manuf. Process. 2018, 36, 164–174. [Google Scholar] [CrossRef]
- Altan, M.; Eryildiz, M.; Gumus, B.; Kahraman, Y. Effects of process parameters on the quality of PLA products fabricated by fused deposition modeling (FDM): Surface roughness and tensile strength. Mater. Test. 2018, 60, 471–477. [Google Scholar] [CrossRef]
- Bardiya, S.; Jerald, J.; Satheeshkumar, V. The impact of process parameters on the tensile strength, flexural strength and the manufacturing time of fused filament fabricated (FFF) parts. Mater. Today-Proc. 2021, 39, 1362–1366. [Google Scholar] [CrossRef]
- Beniak, J.; Krizan, P.; Matus, M. Mechanical properties of biodegradable pla plastic parts produced by 3D printing. MM Sci. J. 2019, 2746–2750. [Google Scholar] [CrossRef]
- Cardoso, P.H.M.; Teixeira, B.N.; Calado, V.M.D.; de Oliveira, M.G.; Mendonca, T.D.; Mendonca, R.H.; de Almeida, H.R.O.; Cunha, M.S.; Thire, R. Mechanical and dimensional performance of poly(lactic acid) 3D-printed parts using thin plate spline interpolation. J. Appl. Polym. Sci. 2020, 137, 49171. [Google Scholar] [CrossRef]
- Giri, J.; Chiwande, A.; Gupta, Y.; Mahatme, C.; Giri, P. Effect of process parameters on mechanical properties of 3d printed samples using FDM process. Mater. Today-Proc. 2021, 47, 5856–5861. [Google Scholar] [CrossRef]
- Jaya Christiyan, K.G.; Chandrasekhar, U.; Venkateswarlu, K. Flexural Properties of PLA Components Under Various Test Condition Manufactured by 3D Printer. J. Inst. Eng. (India) Ser. C 2018, 99, 363–376. [Google Scholar] [CrossRef]
- Kuznetsov, V.E.; Tavitov, A.G.; Urzhumtsev, O.D.; Mikhalin, M.V.; Moiseev, A.I. Hardware Factors Influencing Strength of Parts Obtained by Fused Filament Fabrication. Polymers 2019, 11, 1870. [Google Scholar] [CrossRef] [Green Version]
- Lanzoti, A.; Grasso, M.; Staiano, G.; Martorelli, M. The impact of process parameters on mechanical properties of parts fabricated in PLA with an open-source 3-D printer. Rapid Prototyp. J. 2015, 21, 604–617. [Google Scholar] [CrossRef] [Green Version]
- Lokesh, N.; Praveena, B.; Sudheer Reddy, J.; Vikram Kedambadi, V.; Vijaykumar, S. Evaluation on effect of printing process parameter through Taguchi approach on mechanical properties of 3D printed PLA specimens using FDM at constant printing temperature. Mater. Today-Proc. 2021, in press. [Google Scholar] [CrossRef]
- Luzanin, O.; Movrin, D.; Stathopoulos, V.; Pandis, P.; Radusin, T.; Guduric, V. Impact of processing parameters on tensile strength, in-process crystallinity and mesostructure in FDM-fabricated PLA specimens. Rapid Prototyp. J. 2019, 25, 1398–1410. [Google Scholar] [CrossRef]
- Mazurchevici, S.N.; Pricop, B.; Istrate, B.; Mazurchevici, A.D.; Carlescu, V.; Carausu, C.; Nedelcu, D. Technological Parameters Effects on Mechanical Properties of Biodegradable Materials Using FDM. Mater. Plast. 2020, 57, 215–227. [Google Scholar] [CrossRef]
- Milovanovic, A.; Sedmak, A.; Grbovic, A.; Golubovic, Z.; Mladenovic, G.; Colic, K.; Milosevic, M. Comparative analysis of printing parameters effect on mechanical properties of natural PLA and advanced PLA-X material. In Proceedings of the 1st European-Structural-Integrity-Society (ESIS) Virtual European Conference on Fracture (ECF), Virtual, 29 June–1 July 2020; pp. 1963–1968. [Google Scholar] [CrossRef]
- Priya, M.S.; Naresh, K.; Jayaganthan, R.; Velmurugan, R. A comparative study between in-house 3D printed and injection molded ABS and PLA polymers for low-frequency applications. Mater. Res. Express 2019, 6, 8. [Google Scholar]
- Rajpurohit, S.R.; Dave, H.K. Flexural strength of fused filament fabricated (FFF) PLA parts on an open-source 3D printer. Adv. Manuf. 2018, 6, 430–441. [Google Scholar] [CrossRef]
- Rajpurohit, S.R.; Dave, H.K. Analysis of tensile strength of a fused filament fabricated PLA part using an open-source 3D printer. Int. J. Adv. Manuf. Technol. 2019, 101, 1525–1536. [Google Scholar] [CrossRef]
- Rajpurohit, S.R.; Dave, H.K. Impact strength of 3D printed PLA using open source FFF-based 3D printer. Prog. Addit. Manuf. 2021, 6, 119–131. [Google Scholar] [CrossRef]
- Rodriguez-Panes, A.; Claver, J.; Camacho, A.M. The Influence of Manufacturing Parameters on the Mechanical Behaviour of PLA and ABS Pieces Manufactured by FDM: A Comparative Analysis. Materials 2018, 11, 1333. [Google Scholar] [CrossRef] [Green Version]
- Vanaei, H.; Shirinbayan, M.; Deligant, M.; Raissi, K.; Fitoussi, J.; Khelladi, S.; Tcharkhtchi, A. Influence of process parameters on thermal and mechanical properties of polylactic acid fabricated by fused filament fabrication. Polym. Eng. Sci. 2020, 60, 1822–1831. [Google Scholar] [CrossRef]
- Wang, S.H.; Ma, Y.B.; Deng, Z.C.; Zhang, S.; Cai, J.X. Effects of fused deposition modeling process parameters on tensile, dynamic mechanical properties of 3D printed polylactic acid materials. Polym. Test 2020, 86, 106483. [Google Scholar] [CrossRef]
- Zisopol, D.G.; Nae, I.; Portoaca, A.I.; Ramadan, I.A. Theoretical and Experimental Research on the Influence of FDM Parameters on Tensile Strength and Hardness of Parts Made of Polylactic Acid. Eng. Technol. Appl. Sci. Res. 2021, 11, 7458–7463. [Google Scholar] [CrossRef]
- Yao, T.Y.; Deng, Z.C.; Zhang, K.; Li, S.M. A method to predict the ultimate tensile strength of 3D printing polylactic acid (PLA) materials with different printing orientations. Compos. Pt. B-Eng. 2019, 163, 393–402. [Google Scholar] [CrossRef]
- Yao, T.Y.; Ye, J.; Deng, Z.C.; Zhang, K.; Ma, Y.B.; Ouyang, H.J. Tensile failure strength and separation angle of FDM 3D printing PLA material: Experimental and theoretical analyses. Compos. Pt. B-Eng. 2020, 188, 107894. [Google Scholar] [CrossRef]
- Yao, T.Y.; Zhang, K.; Deng, Z.C.; Ye, J. A novel generalized stress invariant-based strength model for inter-layer failure of FFF 3D printing PLA material. Mater. Des. 2020, 193, 108799. [Google Scholar] [CrossRef]
- Zhao, Y.; Chen, Y.S.; Zhou, Y.J. Novel mechanical models of tensile strength and elastic property of FDM AM PLA materials: Experimental and theoretical analyses. Mater. Des. 2019, 181, 108089. [Google Scholar] [CrossRef]
- Ansari, A.A.; Kamil, M. Effect of print speed and extrusion temperature on properties of 3D printed PLA using fused deposition modeling process. Mater. Today-Proc. 2021, 45, 5462–5468. [Google Scholar] [CrossRef]
- Deshwal, S.; Kumar, A.; Chhabra, D. Exercising hybrid statistical tools GA-RSM, GA-ANN and GA-ANFIS to optimize FDM process parameters for tensile strength improvement. CIRP J. Manuf. Sci. Technol. 2020, 31, 189–199. [Google Scholar] [CrossRef]
- Durga Prasad Reddy, J.; Mishra, D.; Chetty, N. Strength and Hardness of 3D printed poly lactic acid and carbon fiber poly lactic acid thermoplastics. In Advances in Lightweight Materials and Structures; Kumar, A.P., Dirgantara, T., Krishna, P.V., Eds.; Springer: Singapore, 2020; Volume 8, pp. 625–634. [Google Scholar] [CrossRef]
- Hikmat, M.; Rostam, S.; Ahmed, Y.M. Investigation of tensile property-based Taguchi method of PLA parts fabricated by FDM 3D printing technology. Results Eng. 2021, 11, 100264. [Google Scholar] [CrossRef]
- Hou, T.; Huang, T.T.; Sun, F.Q.; Wang, S.G. Ultimate tensile strength in fused deposition modeling considering process parameters of flow rate and printing head speed. In Proceedings of the 12th International Conference on Reliability, Maintainability, and Safety (ICRMS), Shanghai, China, 17–19 October 2018; pp. 111–116. [Google Scholar] [CrossRef]
- Hsueh, M.H.; Lai, C.J.; Wang, S.H.; Zeng, Y.S.; Hsieh, C.H.; Pan, C.Y.; Huang, W.C. Effect of Printing Parameters on the Thermal and Mechanical Properties of 3D-Printed PLA and PETG Using Fused Deposition Modeling. Polymers 2021, 13, 1758. [Google Scholar] [CrossRef]
- Naveed, N. Investigating the Material Properties and Microstructural Changes of Fused Filament Fabricated PLA and Tough-PLA Parts. Polymers 2021, 13, 1487. [Google Scholar] [CrossRef] [PubMed]
- Tajarernmuang, T.; Sawangrat, C.; Jomjunyong, S. Effect of process parameters to flexural strength of 3D printed anatomical bone part. In Proceedings of the 10th International Conference on Mechatronics and Manufacturing (ICMM), Bangkok, Thailand, 21–23 January 2019; Chulalongkorn University: Bangkok, Thailand, 2019; Volume 635. [Google Scholar] [CrossRef]
- Zakaria, H.; Khan, S.F.; Fee, M.F.C.; Ibrahim, M. Printing temperature, printing speed and raster angle variation effect in fused filament fabrication. In Proceedings of the 6th International Conference on Applications and Design in Mechanical Engineering (ICADME), Penang, Malaysia, 26–27 August 2019; Volume 670. [Google Scholar] [CrossRef] [Green Version]
- Zekavat, A.R.; Jansson, A.; Larsson, J.; Pejryd, L. Investigating the effect of fabrication temperature on mechanical properties of fused deposition modeling parts using X-ray computed tomography. Int. J. Adv. Manuf. Technol. 2019, 100, 287–296. [Google Scholar] [CrossRef] [Green Version]
- Attolico, M.A.; Casavola, C.; Cazzato, A.; Moramarco, V.; Renna, G. Effect of extrusion temperature on fused filament fabrication parts orthotropic behaviour. Rapid Prototyp. J. 2020, 26, 639–647. [Google Scholar] [CrossRef]
- Butt, J.; Bhaskar, R.; Mohaghegh, V. Investigating the effects of extrusion temperatures and material extrusion rates on FFF-printed thermoplastics. Int. J. Adv. Manuf. Technol. 2021, 117, 2679–2699. [Google Scholar] [CrossRef]
- Harris, M.; Potgieter, J.; Archer, R.; Arif, K.M. In-process thermal treatment of polylactic acid in fused deposition modelling. Mater. Manuf. Process. 2019, 34, 701–713. [Google Scholar] [CrossRef]
- Wach, R.A.; Wolszczak, P.; Adamus-Wlodarczyk, A. Enhancement of Mechanical Properties of FDM-PLA Parts via Thermal Annealing. Macromol. Mater. Eng. 2018, 303, 9. [Google Scholar] [CrossRef]
- Liparoti, S.; Sofia, D.; Romano, A.; Marra, F.; Pantani, R. Fused Filament Deposition of PLA: The Role of Interlayer Adhesion in the Mechanical Performances. Polymers 2021, 13, 399. [Google Scholar] [CrossRef]
- Vanaei, H.R.; Shirinbayan, M.; Vanaei, S.; Fitoussi, J.; Khelladi, S.; Tcharkhtchi, A. Multi-scale damage analysis and fatigue behavior of PLA manufactured by fused deposition modeling (FDM). Rapid Prototyp. J. 2021, 27, 371–378. [Google Scholar] [CrossRef]
- Vanaei, H.R.; Shirinbayan, M.; Deligant, M.; Khelladi, S.; Tcharkhtchi, A. In-Process Monitoring of Temperature Evolution during Fused Filament Fabrication: A Journey from Numerical to Experimental Approaches. Thermo 2021, 1, 332–360. [Google Scholar] [CrossRef]
- Bin Ishak, I.; Fleming, D.; Larochelle, P. Multiplane fused deposition modeling: A study of tensile strength. Mech. Based Des. Struct. Mech. 2019, 47, 583–598. [Google Scholar] [CrossRef]
- Corapi, D.; Morettini, G.; Pascoletti, G.; Zitelli, C. Characterization of a Polylactic acid (PLA) produced by Fused Deposition Modeling (FDM) technology. Procedia Struct. Integr. 2019, 24, 289–295. [Google Scholar] [CrossRef]
- Doungkom, P.; Jiamjiroch, K. Analysis of Printing Pattern and Infiltration Percent over the Tensile Properties of PLA Printed Parts by a Fused Deposition Modelling Printer. In Proceedings of the 9th Thai-Society-of-Mechanical-Engineers International Conference on Mechanical Engineering (TSME-ICoME), Phuket, Thailand, 11–14 December 2018; Volume 501. [Google Scholar] [CrossRef]
- Stoica, C.R.; Maier, R.; Istrate, A.; Mandoc, A.C. Assessment of Static Mechanical Properties of Additively Manufactured Polylactic Acid (PLA) on Entry-Level FDM 3D Printer. Mater. Plast. 2021, 58, 176–184. [Google Scholar] [CrossRef]
- Dai, S.; Deng, Z.C.; Yu, Y.J.; Zhang, K.; Wang, S.H.; Ye, J. Orthotropic elastic behaviors and yield strength of fused deposition modeling materials: Theory and experiments. Polym. Test 2020, 87, 106520. [Google Scholar] [CrossRef]
- Gabor, C.; Pop, M.A.; Magli, D.; Bedo, T.; Munteanu, S.I.; Munteanu, D. The optimization of the production procedure in relation to the mechanical properties of additively manufactured parts. Mater. Today-Proc. 2019, 19, 1008–1013. [Google Scholar] [CrossRef]
- Gonabadi, H.; Yadav, A.; Bull, S.J. The effect of processing parameters on the mechanical characteristics of PLA produced by a 3D FFF printer. Int. J. Adv. Manuf. Technol. 2020, 111, 695–709. [Google Scholar] [CrossRef]
- Hsueh, M.H.; Lai, C.J.; Chung, C.F.; Wang, S.H.; Huang, W.C.; Pan, C.Y.; Zeng, Y.S.; Hsieh, C.H. Effect of Printing Parameters on the Tensile Properties of 3D-Printed Polylactic Acid (PLA) Based on Fused Deposition Modeling. Polymers 2021, 13, 2387. [Google Scholar] [CrossRef]
- Song, Y.; Li, Y.; Song, W.; Yee, K.; Lee, K.Y.; Tagarielli, V.L. Measurements of the mechanical response of unidirectional 3D-printed PLA. Mater. Des. 2017, 123, 154–164. [Google Scholar] [CrossRef]
- Tronvoll, S.A.; Welo, T.; Elverum, C.W. The effects of voids on structural properties of fused deposition modelled parts: A probabilistic approach. Int. J. Adv. Manuf. Technol. 2018, 97, 3607–3618. [Google Scholar] [CrossRef] [Green Version]
- Kiendl, J.; Gao, C. Controlling toughness and strength of FDM 3D-printed PLA components through the raster layup. Compos. Pt. B-Eng. 2020, 180, 107562. [Google Scholar] [CrossRef]
- Naveed, N. Investigate the effects of process parameters on material properties and microstructural changes of 3D-printed specimens using fused deposition modelling (FDM). Mater. Technol. 2021, 36, 317–330. [Google Scholar] [CrossRef]
- Ayatollahi, M.R.; Nabavi-Kivi, A.; Bahrami, B.; Yahya, M.Y.; Khosravani, M.R. The influence of in-plane raster angle on tensile and fracture strengths of 3D-printed PLA specimens. Eng. Fract. Mech. 2020, 237, 106905. [Google Scholar] [CrossRef]
- Cakan, B.G. Effects of raster angle on tensile and surface roughness properties of various FDM filaments. J. Mech. Sci. Technol. 2021, 35, 3347–3353. [Google Scholar] [CrossRef]
- Andrzejewska, A.; Pejkowski, L.; Topolinski, T. Tensile and Fatigue Behavior of Additive Manufactured Polylactide. 3D Print. Addit. Manuf. 2019, 6, 272–280. [Google Scholar]
- Fayazbakhsh, K.; Movahedi, M.; Kalman, J. The impact of defects on tensile properties of 3D printed parts manufactured by fused filament fabrication. Mater. Today Commun. 2019, 18, 140–148. [Google Scholar] [CrossRef]
- Mohan, R.G.; Santhosh, K.; Iyer, R.V.; John, L.K.; Ramu, M. Comparitive analysis of mechanical properties of FDM printed parts based on raster angles. Mater. Today-Proc. 2021, 47, 4730–4734. [Google Scholar] [CrossRef]
- Oviedo, A.M.; Puente, A.H.; Bernal, C.; Perez, E. Mechanical evaluation of polymeric filaments and their corresponding 3D printed samples. Polym. Test. 2020, 88, 106561. [Google Scholar] [CrossRef]


| Process Parameter | Notation | Units |
|---|---|---|
| Layer thickness (layer height) | t | (mm) |
| Printing speed | sp | (mm/s) |
| Printing head (nozzle) temperature | TH | (°C) |
| Build plate temperature | TB | (°C) |
| Nozzle diameter | dn | (mm) |
| Filament diameter | df | (mm) |
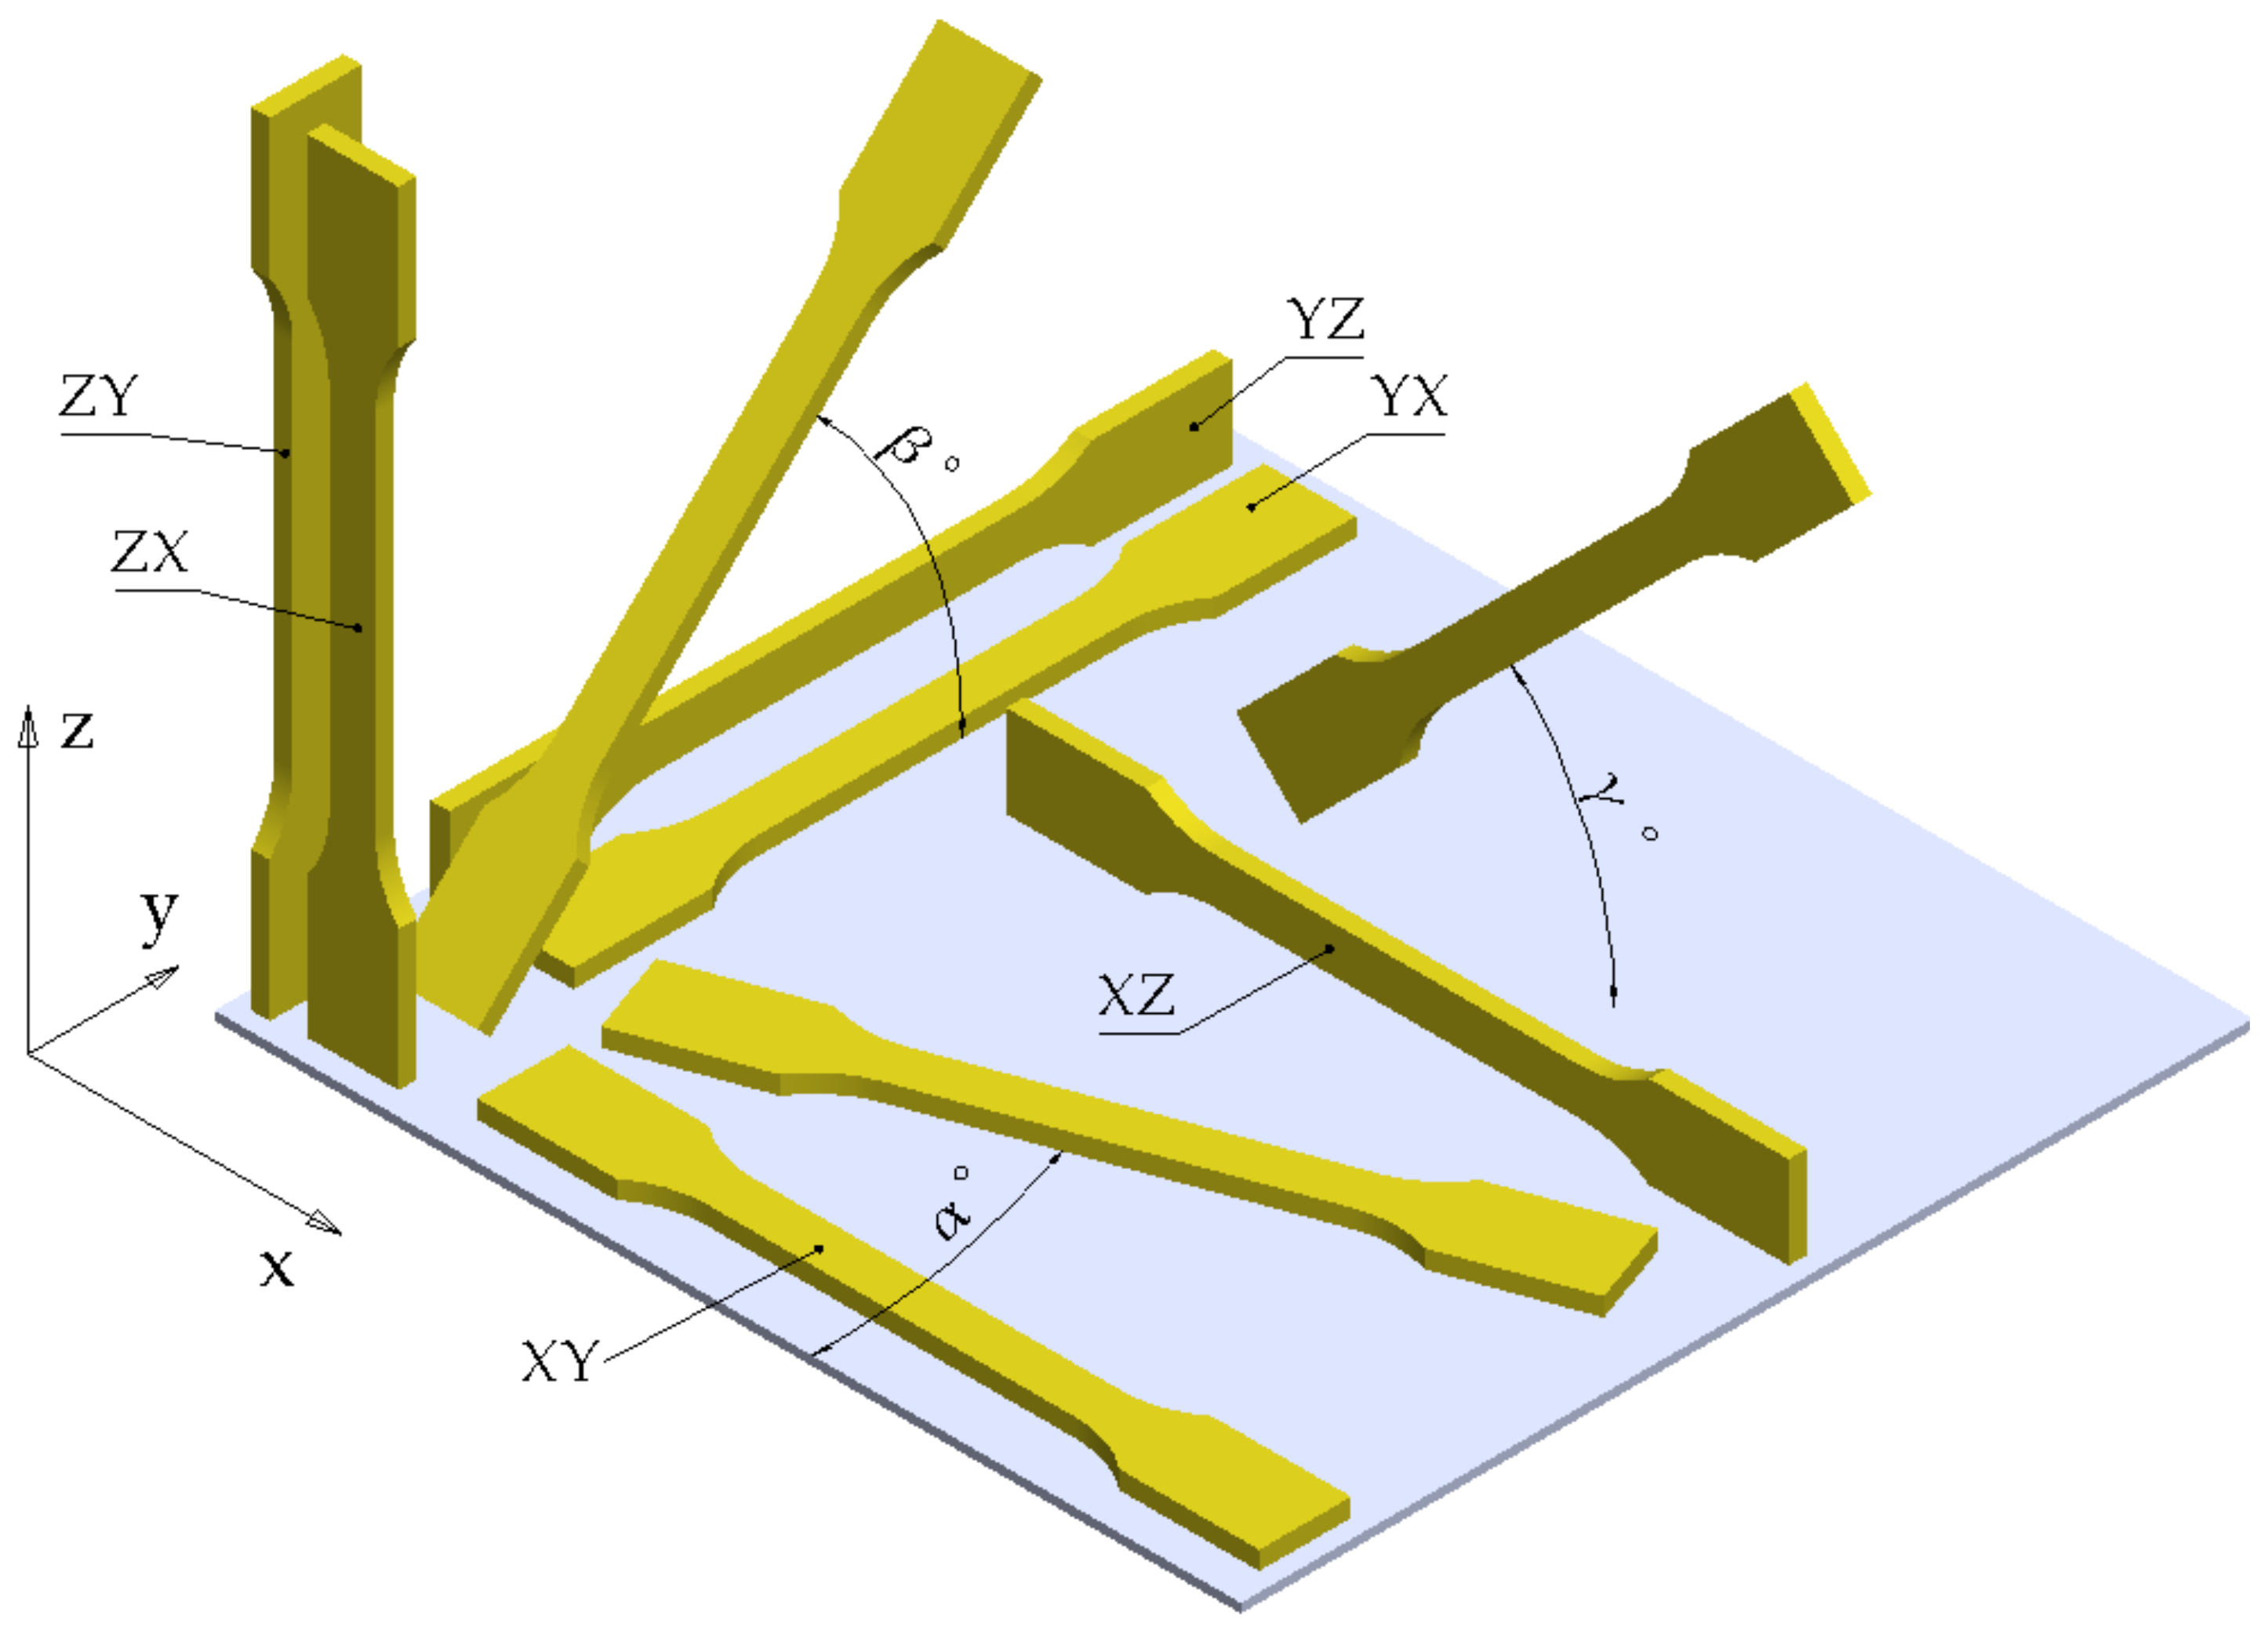
| Build orientation (acc. to ISO/ASTM 52921:2013 [17]) first letter—axis parallel to the longest dimension of part; second letter—axis parallel to second longest dimension of part | XY, XZ, YX, YZ, ZX, ZY | (-) |
| Build orientation angle in the xy plane (around the z-axis) Indexes represent the reference build orientation from which angle is measured (αZX = 0° correspond to ZX build orientation); | αYX, αXY, αXZ | (°) |
| Build orientation angle in the yz plane (around the x-axis) | βXY, βYX, βXZ | (°) |
| Build orientation angle in the xz plane (around the y-axis) | γZX, γXY, γXZ | (°) |
| Raster angle | θ | (°) |
| Number of wall lines | WL | (-) |
| Tensile/bending test speed | st | (mm/min) |
| Ultimate tensile strength | UTS | (MPa) |
| Ultimate flexural strength | UFS | (MPa) |
| Modulus of elasticity (Young’s modulus) | E | (MPa) |
| Ref. | FFF Process Parameters | Mechanical Test Settings | Results and Conclusions | ||||||
|---|---|---|---|---|---|---|---|---|---|
| t (mm) | sp (mm/s) | TH (°C) | TB (°C) | B.O. (-) | θ (°) | Other Parameters | |||
| t—layer thickness (layer height); sp—printing speed; TH—printing head (nozzle) temperature; TB—build plate temperature; B.O.—build orientation; θ—raster angle; df—filament diameter; dn—nozzle diameter; WL—number of wall lines. | |||||||||
| [19] | 0.06–0.60 | 25 | - | - | Vertical | - | df = 2.85 mm; dn = 0.4–0.8 mm | Bending, rectangular hollow cross-section; st = 10 mm/min | UFS increases with the increase in the dn/t ratio. UFS for t = 0.06, dn = 0.40 about 3.9× higher than UFS for t = 0.4, dn = 0.40. |
| [23] | 0.10–0.20 | 20–40 | 210 | - | XY | 45°/−45° | df = 1.75 mm; dn = 0.4 mm; 20–80% infill | Tensile—ASTM D638 | Low increase in UTS with the decrease in layer thickness. |
| [24] | 0.10–0.30 | 30 | 195 | 110 | Horizontal | 40°–80° | df = 1.75 mm; dn = 0.3 mm; 20–80% infill | Tensile—ASTM D638 | The variation of UTS vs. layer thickness is influenced by the raster angle. |
| [26] | 0.06–0.24 | 20–80 | 210 | - | YX; YZ; ZY | 0° | df = 1.75 mm; dn = 0.4 mm; 100% infill | Tensile—ASTM D638; Bending—ASTM D790 | Highest UTS (89.1 MPa) for t = 0.06, sp = 50 mm/s, YX specimens. Highest UFS (65 MPa) for t = 0.06, sp = 80 mm/s, YZ specimens. |
| [28] | 0.06–0.50 | 30–200 | 175–230 | - | XY; ZX | - | df = 1.75 mm; dn = 0.5 mm; 100% infill | Tensile—ASTM D638, Type I vs. Type IV | UTS decreases with the increase in the layer thickness. |
| [32] | 0.10–0.30 | 60 | 215 | 60 | Horizontal | 45°/−45°; 0°/90°; 0°/−30°/ 30°/−60°/ 60°/90°/ | df = 1.75 mm; 100% infill; ageing; heat treatment | Tensile—ASTM D638 | Higher UTS for specimens with t = 0.1 mm. The decrease in UTS for t = 0.3 mm vs. t = 0.1 mm is higher for aged specimens, with and without heat treatment. |
| [51] | 0.06–0.35 | 60 | 190–220 | 60 | XY | 0°; 90°; 45°/−45° | df = 1.75 mm; dn = 0.4 mm; 100% infill; WL = 2 | Tensile—ASTM D638, Type I specimens; st = 5 mm/min | The variation of UTS with layer thickness is influenced by θ. For θ = 0° the highest UTS is obtained for t = 0.06 mm. High variation of UTS vs. t for θ = 90°. |
| [54] | 0.10–0.40 | 90 | 185 | - | Z | - | df = 1.75 mm; 100% infill | Tensile—ASTM D638 IV; st = 5 mm/min | Highest UTS and E for t = 0.4 mm. |
| [55] | 0.20–0.40 | 50 | 190–210 | - | Horizontal | - | df = 2.85 mm; 20–100% infill; WL = 2 | Tensile—ASTM D638; increased specimen thickness; st = 5 mm/min | Highest UTS (61.66 MPa) and E (3815.50 MPa) for t = 0.3 mm. |
| [56] | 0.10–0.40 | 50–150 | 190–205 | - | Horizontal | - | df = 1.75 mm; dn = 0.4 mm; cooling fan | Tensile; st = 5 mm/min | Highest UTS (60.26 MPa) for t = 0.10 mm; layer thickness was the dominant factor for UTS. |
| [57] | 0.10–0.30 | 50 | 210 | 60 | αXY = 0°–60° | - | df = 1.75 mm; dn = 0.4 mm; 20–80% infill; WL = 2 | Tensile—ASTM D638; Bending—ASTM D790; st = 1 mm/min | Highest UTS obtained for t = 0.2 mm and αXY = 30° at 80% infill density; Highest UFS obtained for t = 0.3 mm and αXY = 0° at 80% infill density. |
| [58] | 0.125–0.25 | - | - | - | αXY = 0°; αXY = 45° | - | 50–90% infill | Tensile—ISO 527 | Higher UTS for t = 0.25 mm. |
| [59] | 0.10–0.35 | 40–80 | 220 | 25 | αXY = 0°–90° | - | df = 1.75 mm; 100% infill | Tensile—ASTM D638, Type V specimens | Higher E and UTS for low values of the layer thickness. |
| [60] | 0.05–0.40 | 60 | 200 | - | Horizontal; Vertical | - | df = 1.75 mm; 60% infill; variable cooling | Tensile | Highest UTS (53.62 MPa) at t = 0.2 mm, for horizontal printed specimens. |
| [61] | 0.20–0.30 | 38–52 | 190 | 40 | - | 0°; 90° | dn = 0.40 mm; 40% infill | Bending—ASTM D790; st = 12 mm/min | Higher flexural strength for t = 0.2 mm. |
| [62] | 0.10–0.30 | 25–75 | 210 | 60 | Vertical | - | dn = 0.40 mm; four FFF printers (P1-P4) | Bending, rectangular hollow cross-section; st = 10 mm/min | P1-P2: UFS and sample mass decrease with thickness. P3-P4: maximum UFS for t = 0.15 mm and t = 0.20 mm. |
| [63] | 0.10–0.20 | 60 | 205 | 60 | Horizontal | 0°; 18°; 45°; 72°; 90° | 100 infill; WL = 2–6 | Tensile—ASTM D638 modified specimens | Low variation of UTS and E with t. Highest UTS (49.29 MPa) and E (3497 MPa) for t = 0.10 mm. |
| [64] | 0.10–0.30 | - | 210 | 80 | γXY = 0°–90° | 30°; 45°; 60° | df = 1.75 mm; 50% infill | Tensile—ASTM D638 | UTS decreases with the increase in the layer thickness. |
| [65] | 0.10–0.30 | 30–90 | 210–230 | 50–80 | XY | 0°/90° | df = 1.75 mm; dn = 0.4 mm; 100% infill; WL = 2 | Tensile—ISO 527–2; st = 50 mm/min | Higher UTS for t = 0.2 mm. |
| [66] | 0.10–0.20 | 40–80 | 220 | 60 | XY; XZ | - | dn = 0.4 mm; 100% infill; WL = 3 | Tensile—ISO 527; st = 5 mm/min | Higher UTS (46.22 MPa) for XZ specimens with t = 0.1 mm, sp = 80 mm/s. |
| [67] | 0.10–0.20 | 60 | 200 | 60 | Horizontal | - | df = 1.75 mm; dn = 0.4 mm; 50–100% infill | Tensile—ISO 527–2 | Low variation of UTS and E with the layer thickness. Higher UTS for t = 0.1 mm. |
| [68] | 0.10–0.40 | 60 | 230 | 80 | Horizontal | - | df = 1.75 mm; 100% infill | Tensile—ASTM D638; Bending—ASTM D790; Impact—ISO 180 | UTS, UFS and Izod impact strength decrease with the increase in layer thickness for all raster patterns. |
| [69,70,71] | 0.10–0.30 | 50 | 210 | 70 | - | 0°; 45°; 90° | df = 1.75 mm; dn = 0.4 mm; 100% infill; WL = 1 | Tensile—ASTM D638; Bending—ASTM D790; Impact—ASTM D256 | UTS and UFS decrease with the increase in the layer thickness. Izod impact strength increases with the layer thickness. |
| [72] | 0.10–0.20 | 30 | 200 | 50 | XY; XZ; ZX | 45°/−45° | df = 1.75 mm; dn = 0.4 mm; 20–50% infill | Tensile—ASTM D638; st = 5 mm/min | Approx. 10.6% higher UTS for t = 0.10 mm compared to t = 0.20 mm. |
| [73] | 0.10–0.30 | 20 | 210 | 50 | - | - | df = 1.75 mm | Tensile, st = 1 mm/min | Higher UTS (61.5 MPa) for t = 0.30 mm. |
| [74] | 0.05–0.20 | 60 | 195–230 | 60 | βYZ = 0°–90° | - | df = 1.75 mm; dn = 0.4 mm | Tensile—ISO 527–2; st = 2 mm/min | Low decrease in UTS with the increase in the layer thickness. |
| [75] | 0.10–0.20 | 80 | 200 | 60 | XY | 45° | df = 1.75 mm; 25–100% infill; variable flow rate | Tensile—ASTM D638, Type IV | Highest UTS (40.07 MPa) for t = 0.15 mm. |
| [76,77] | 0.10–0.30 | 60 | 215 | - | γXZ = 0°–90° | - | df = 1.75 mm | Tensile—ISO 527–2; st = 0.1 mm/min | Highest UTS for t = 0.10 m. Low variation of UTS and E with layer thickness. |
| [78] | 0.10–0.60 | - | - | - | γXZ = 0°–90° | - | df = 1.75 mm; dn = 0.4 mm | Tensile—ISO 527–2; st = 0.1 mm/min | Low variation of UTS with layer thickness. |
| [79] | 0.10–0.30 | - | 220 | 60 | γXZ = 0°–90° | - | df = 1.75 mm | Tensile—ISO 527–2 | Highest UTS for t = 0.10 mm and t = 0.20 mm. Low variation of UTS vs. t. |
| Ref. | FFF Process Parameters | Mechanical Test Settings | Results and Conclusions | ||||||
|---|---|---|---|---|---|---|---|---|---|
| sp (mm/s) | t (mm) | TH (°C) | TB (°C) | B.O. (-) | θ (°) | Other Parameters | |||
| sp—printing speed; t—layer thickness (layer height); TH—printing head (nozzle) temperature; TB—build plate temperature; B.O.—build orientation; θ—raster angle; df—filament diameter; dn—nozzle diameter; WL—number of wall lines. | |||||||||
| [23] | 20–40 | 0.10–0.20 | 210 | - | XY | 45/−45° | df = 1.75 mm; dn = 0.4 mm; 20–80% infill | Tensile—ASTM D638 | Low increase in UTS with the decrease in printing speed. |
| [26] | 20–80 | 0.06–0.24 | 210 | - | YX; YZ; ZY | 0° | df = 1.75 mm; dn = 0.4 mm; 100% infill | Tensile—ASTM D638; Bending—ASTM D790 | The variation of UTS vs. sp is influenced by the build orientation and the layer thickness. |
| [29] | 20–80 | 0.40 | 215 | 55 | Horizontal | 0°; 30°; 45°; 60°; 90° | 100% infill; WL = 2 | Tensile—ASTM D638; st = 5 mm/min | Higher E and UTS values for sp = 20 mm/s. |
| [30] | 12.5–50 | 0.30 | 190–250 | 60 | Vertical | - | df = 2.85 mm; dn = 0.6 mm; variable cooling | Bending, rectangular hollow cross-section; st = 10 mm/min | For TH = 210 °C highest UFS (56.3 MPa) at sp = 25 mm/s; high influence of sp on the specimen mass. |
| [54] | 70–170 | 0.30 | 185 | - | Z | - | df = 1.75 mm; 100% infill | Tensile—ASTM D638 IV; st = 5 mm/min | Low variations of UTS and E with printing speed. |
| [56] | 50–150 | 0.10–0.40 | 190–205 | - | - | - | df = 1.75 mm; dn = 0.4 mm | Tensile; st = 5 mm/min | Higher UTS for sp = 80mm/s and sp = 100 mm/s. |
| [59] | 40–80 | 0.10–0.35 | 220 | 25 | αXY = 0°–90° | - | df = 1.75 mm; 100% infill | Tensile—ASTM D638 Type V specimens | Higher E and UTS values for low printing speed. |
| [61] | 38–52 | 0.20–0.30 | 190 | 40 | - | 0°; 90° | dn = 0.40 mm; 40% infill | Bending—ASTM D790; st = 12 mm/min | Higher flexural strength for sp = 38 mm/s. |
| [62] | 25–75 | 0.10–0.30 | 210 | 60 | Vertical | - | dn = 0.40 mm; 4 FFF printers | Bending, rectangular hollow cross-section | Higher UFS for sp = 25 mm/s. |
| [65] | 30–90 | 0.10–0.30 | 210–230 | 50–80 | XY | 0°/90° | df = 1.75 mm; dn = 0.4 mm; WL = 2 | Tensile—ISO 527–2; st = 50 mm/min | Low decrease in UTS with the increase in the printing speed. |
| [73] | 20–60 | 0.20 | 210 | 50 | - | - | df = 1.75 mm | Tensile; st = 1 mm/min | Higher UTS for sp = 20 mm/s. |
| [80] | 40–50 | 0.20 | 190–230 | 50 | XY | 45° | df = 1.75 mm; dn = 0.4 mm; 100% infill | Tensile—ASTM D638 Type IV specimens | Higher UTS values for sp = 50 mm/s (except the TH = 230 °C specimens). |
| [81] | 50–150 | - | 190–210 | - | Horizontal | - | 20–100% infill | Tensile—ASTM D638 Type V specimens | Highest UTS (45.27 MPa) obtained for sp = 100 mm/s and TH = 210 °C. |
| [82] | 60–100 | 0.10–0.30 | - | - | Horizontal | - | 60–100% infill | Tensile—ASTM D638; Bending—ASTM D790 | Infill density and printing speed have the highest influence on UFS and UTS. |
| [83] | 20–60 | 0.08–0.28 | 210–220 | - | XY; XZ | 0°/90°; 30°/−60°; 45°/−45° | dn = 0.3–0.5 mm; 80–100 % infill; WL = 2–4 | Tensile—ASTM D638-I; st = 5 mm/min | Higher UTS for sp = 20 mm/s. The optimum parameters for UTS: sp = 20 mm/s, TH = 220 °C, XZ orientation, 30°/−60° raster. |
| [84] | 40–140 | 0.10 | 210 | 50 | - | - | 100% infill; WL = 2; variable flow rate | Tensile—GB/T 11997 type-A specimens; st = 5 mm/min | Low influence of the printing speed. High influence of the flow rate. |
| [85] | 35–45 | 0.20 | 180–220 | 25 | XY | 45°/−45° | df = 1.75 mm; dn = 0.4 mm; 20% infill | Tensile—ASTM D638; Bending—ASTM D790; Compression—ASTM D3410; st = 5 mm/min | Tensile: higher UTS for sp = 45 mm/s and sp = 40 mm/s at TB = 200–220 °C. Bending: higher UFS for sp = 45 mm/s. Compression: higher strength for sp = 45 mm/s; |
| [86] | 35–65 | 0.10 | 200 | 60 | XY | 45°/−45°; 0°/90° | df = 2.85 mm; 100% infill | Tensile—ASTM D638 | Decrease in UTS with the increase in the printing speed. |
| [87] | 50–100 | 0.10–0.20 | 210 | 60 | Vertical | - | 40–80% infill | Bending, circular hollow cross-section specimens | Higher UFS for low printing speed and low layer thickness. |
| [88] | 30–40 | - | 180–195 | - | - | 45°/−45°; 30°/−60°; 0°/90° | - | Tensile—ASTM D638; st = 5 mm/min; Bending—ASTM D790; st = 2 mm/min | The optimum parameters for tensile test: sp = 40 mm/s, TH = 180°, θ = 30°/−60°. The optimum parameters for bending test: sp = 30 mm/s, TH = 185°, θ = 30°/−60°. |
| Ref. | FFF Process Parameters | Mechanical Test Settings | Results and Conclusions | ||||||
|---|---|---|---|---|---|---|---|---|---|
|
TH (°C) |
TB (°C) |
t (mm) |
sp (mm/s) |
B.O. (-) |
θ (°) | Other Parameters | |||
| TH—printing head (nozzle) temperature; TB—build plate temperature; t—layer thickness (layer height); sp—printing speed; B.O.—build orientation; θ—raster angle; df—filament diameter; dn—nozzle diameter; WL—number of wall lines. | |||||||||
| [30] | 190–250 | 60 | 0.30 | 12.5–50 | Vertical | - | df = 2.85 mm; dn = 0.6 mm; variable cooling | Bending, rectangular hollow cross-section; st = 10 mm/min | Increase in ultimate flexural strength and specimen mass with the printing head temperature. |
| [33] | 190–230 | 45–105 | - | 50 | - | 0°/90°; 15°/75°; 30°/60°; 45°/45° | df = 2.85 mm; 100% infill | Tensile—ASTM D638; st = 5 mm/min Bending—ASTM D790; Impact—ASTM D256 | Mechanical parameters increase with TB. The influence of TH is lower compared to the influence TB. |
| [34] | 180–240 | - | 0.10 | 60 | Horizontal | - | df = 1.75 mm; annealing | Tensile—ISO527; st = 5 mm/min | Increase in UTS and E with TH for specimens without annealing. |
| [51] | 190–220 | 60 | 0.06–0.35 | 60 | XY | 0°; 90°; 45/−45° | df = 1.75 mm; dn = 0.4 mm; WL = 2 | Tensile—ASTM D638-I specimens; st = 5 mm/min | Highest UTS values for TH = 220 °C and TH = 205 °C. High variation of UTS vs. TH for θ = 90°. |
| [54] | 175–205 | - | 0.30 | 90 | Z | - | df = 1.75 mm; 100% infill | Tensile—ASTM D638 Type IV; st = 5 mm/min | Highest UTS (43.79 MPa) at TH = 205 °C. Approx. 35% increase in UTS for TH = 205 °C, compared to TH = 175 °C. |
| [55] | 190–210 | - | 0.20–0.40 | 50 | Horizontal | - | df = 2.85 mm; 20–100% infill; WL = 2 | Tensile—ASTM D638; increased specimen thickness; st = 5 mm/min | Highest UTS for TH = 210 °C and TH = 200 °C. |
| [56] | 190–205 | - | 0.10–0.40 | 50–150 | Horizontal | - | df = 1.75 mm; dn = 0.4 mm; cooling fan | Tensile test; st = 5 mm/min | Higher UTS obtained for TH = 210 °C and active cooling fan; higher TH recommended for high layer thickness. |
| [65] | 210–230 | 50–80 | 0.10–0.30 | 30–90 | XY | 0°/90° | dn = 0.4 mm; df = 1.75 mm; 100% infill; WL = 2 | Tensile—ISO 527–2; st = 50 mm/min | Low increase in UTS with the increase in TH and decrease in TB. |
| [73] | 200–230 | 50–70 | 0.20 | 20 | - | - | df = 1.75 mm | Tensile; st = 1 mm/min | Highest UTS (62 MPa) for TH = 220 °C; Low variation of UTS vs. TB. |
| [74] | 195–230 | 60 | 0.05–0.20 | 60 | βYZ = 0°–90° | - | df = 1.75 mm; dn = 0.4 mm | Tensile—ISO 527–2; st = 2 mm/min | Higher UTS for TB = 210–215°C. |
| [80] | 190–230 | 50 | 0.20 | 40–50 | XY | 45° | df = 1.75 mm; dn = 0.4 mm; 100% infill; WL = 3 | Tensile—ASTM D638 Type IV specimens | Approx. 20% increase in UTS for TH = 210 °C, compared to TH = 190 °C. |
| [81] | 190–210 | - | - | 50–150 | Horizontal | - | 20–100% infill | Tensile—ASTM D638 Type V specimens | Highest UTS (45.27 MPa) obtained for sp = 100 mm/s and TH = 210 °C. |
| [83] | 210–220 | - | 0.08–0.28 | 20–60 | XY; XZ | 0°/90°; 30°/−60°; 45°/−45° | df = 1.75 mm; dn = 0.3–0.5 mm; 80–100% infill; WL = 2–4 | Tensile—ASTM D638-I; st = 5 mm/min | Higher UTS for TH = 220 °C. |
| [85] | 180–220 | 25 | 0.20 | 35–45 | XY | 45°/−45° | df = 1.75 mm; dn = 0.4 mm; 20% infill | Tensile—ASTM D638; Bending—ASTM D790; Compression—ASTM D3410 | Higher UTS for TH = 220 °C; Higher compressive strength for TH = 190–220 °C; Higher bending strength for TH = 190–210°C. |
| [90] | 190–210 | 55 | 0.35 | 40 | Horizontal | 0°; 45°; 90° | df = 2.85 mm; dn = 0.4 mm; WL = 2 | Tensile—ASTM D638–10-I; st = 5 mm/min | Higher UTS and E for TH = 210 °C (for all raster). Highest UTS (56.2 MPa) for specimens with TH = 210 °C and θ = 0°. |
| [91] | 180–210 | 60 | 0.20 | 50 | XY | 45/−45° | dn = 0.4 mm; 100% infill; 70–160% flow | Tensile—ISO 527–2 | The variation of tensile load vs. temperature is influenced by the flow rate. |
| [92] | 210 | 40–80 | 0.20 | - | Horizontal | 45/−45° | df = 1.75 mm; dn = 0.4 mm | Tensile—ASTM D638 Type IV specimens | Higher strength for specimens printed inside of a heated chamber. |
| [93] | 195–255 | 55 | 0.30 | 45 | XY | 0° | df = 1.75 mm; dn = 0.5 mm; 100% infill; annealing | Tensile—ISO 527; Bending—EN ISO 178:2011 | Higher UTS and UFS for TH = 235–255°C. |
| [94] | 180–230 | 70–110 | 0.30 | 40 | YZ | 0°/90° | df = 1.75 mm; dn = 0.4 mm; 99% infill | Tensile—ASTM D368 Type V specimens | Highest UTS (76.5 MPa) for TH = 200 °C and TB = 70 °C. Lowest UTS (69 MPa) for TH = 180 °C and TB = 110 °C. |
| [95] | 210–230 | 70 | 0.20 | 40 | XY | 45°/−45° | df = 1.75 mm; 100% infill | Tensile—ASTM D368 Type IV specimens; st = 1 mm/min | Highest UTS (53 MPa) and E (2.5 GPa) for TH = 220°C. Lowest UTS (47 MPa) and E (2.2 GPa) for TH = 230 °C. |
| Ref. | FFF Process Parameters | Mechanical Test Settings | Results and Conclusions | ||||||
|---|---|---|---|---|---|---|---|---|---|
| B.O. (-) | t (mm) | sp (mm/s) | TH (°C) | TB (°C) | θ (°) | Other Parameters | |||
| B.O.—build orientation; t—layer thickness (layer height); sp—printing speed; TH—printing head (nozzle) temperature; TB—build plate temperature; θ—raster angle; df—filament diameter; dn—nozzle diameter; WL—number of wall lines. | |||||||||
| [26] | YX; YZ; ZY | 0.06–0.24 | 20–80 | 210 | - | 0° | df = 1.75 mm; dn = 0.4 mm; 100% infill | Tensile—ASTM D638; Bending—ASTM D790 | High variation of UTS and UFS. Highest values for YX and YZ specimens. |
| [27] | XY; XZ; ZX | 0.20 | - | - | - | 45°/−45° | 50–100% infill | Tensile—ISO 527–2; st = 10 mm/min | Highest UTS (56.5 MPa) for flat XY specimens at 100% infill. 13% and 37% decrease in UTS for XZ and ZX specimens. |
| [28] | XY; ZX | 0.06–0.50 | 30–200 | 175–230 | - | - | df = 1.75 mm; dn = 0.5 mm; 100% infill; variable flow | Tensile—ASTM D638 Type I vs. Type IV | UTS for ZX specimens is 47.9% lower compared to UTS for XY specimens. |
| [54] | X; Y; Z | 0.30 | 90 | 185 | - | - | df = 1.75 mm; 100% infill | Tensile—ASTM D638 IV; st = 5 mm/min | Low variation of UTS with build orientation. |
| [60] | Horizontal; vertical | 0.05–0.40 | 60 | 200 | - | - | df = 1.75 mm; 60% infill | Tensile | UTS for vertical specimens 50% lower than UTS for horizontal specimens. |
| [72] | XY; XZ; ZX | 0.10 | 30 | 200 | 50 | 45°/−45° | df = 1.75 mm; dn = 0.4 mm; 20% infill | Tensile—ASTM D638; st = 5 mm/min | Higher UTS (38.47 MPa) for XY specimens compared to XZ (30.10 MPa) and ZX (27.63 MPa) specimens. |
| [83] | XY; XZ | 0.08–0.28 | 20–60 | 210–220 | - | 0°/90°; 30°/−60°; 45°/−45° | dn = 0.3–0.5 mm; 80–100 % infill; WL = 2–4 | Tensile—ASTM D638-I; st = 5 mm/min | Higher UTS for XZ specimens. |
| [97] | XY; XZ; ZX | 0.40 | 3 | 220 | - | - | dn = 0.4 mm; 100 % infill | Tensile—ASTM D638 | Highest values of E and UTS for XZ specimens. |
| [98] | XY; XZ; ZX | 0.20 | 60 | 210 | 45 | 45°/−45° | df = 1.75 mm; dn = 0.4 mm; WL = 2 | Tensile—ASTM D638 Type I specimens | Highest values of UTS (57.58 MPa) and E (2571 MPa) for XY specimens. Low value of UTS (23.75 MPa) for ZX specimens. |
| [99] | XY; XZ; ZX | 0.18 | 80 | - | - | - | df = 1.75 mm; 20–100% infill | Tensile—ASTM D638; st = 5 mm/min | Yield stress for 100% infill: XY specimens—41.66 MPa, XZ specimens—48.53 MPa, ZX specimens—24.20 MPa. Similar variation for lower infill density. |
| [100] | XY; XZ; ZX | 0.20 | 50 | 215 | 60 | 0°; 45°; 90° | df = 1.75 mm; dn = 0.4 mm; 100% infill; WL = 2 | Tensile—ASTM D638; st = 5 mm/min | Higher UTS (34.45–35.47 MPa) for XZ specimens. Low UTS for XY and ZX specimens. The variations are influenced by the raster. |
| [57] | αXY = 0°- 60° | 0.10–0.30 | 50 | 210 | 60 | - | df = 1.75 mm; dn = 0.4 mm; 20–80% infill; WL = 2 | Bending—ASTM D790; Tensile—ASTM D790; st = 1 mm/min | Low variation of the flexural strength and the tensile strength with αXY. |
| [58] | αXY = 0°–45° | 0.125–0.25 | - | - | - | - | 50–90% infill | Tensile—ISO 527–1,2 | Low variation of UTS vs. the αXY angle. |
| [59] | αXY = 0°–90° | 0.10–0.35 | 40–80 | 220 | 25 | - | df = 1.75 mm; 100% infill | Tensile—ASTM D638, Type V specimens | Higher E and UTS for αXY = 0° and αXY = 45°. |
| [64] | γXY = 0°–90° | 0.10–0.30 | - | 210 | 80 | 30°; 45°; 60° | df = 1.75 mm; 50% infill | Tensile—ASTM D638 | Highest UTS for γXY = 0° and γXY = 45° specimens. |
| [74] | βYZ = 0°–90° | 0.05–0.20 | 60 | 195–230 | 60 | - | df = 1.75 mm; dn = 0.4 mm | Tensile—ISO 527–2; st = 2 mm/min | High decrease in UTS with the increase in βYZ. |
| [76] | γXZ = 0°–90° | 0.10–0.30 | - | 215 | - | - | df = 1.75 mm | Tensile—ISO 527–2 | High variation of UTS with the γXZ angle, from 55.86 MPa (XZ specimens, γXZ = 0°) to 26.65 MPa (ZX specimens, γXZ = 90°). |
| [78] | γXZ = 0°—90° | 0.10–0.60 | - | - | - | - | df = 1.75 mm; dn = 0.4 mm | Tensile—ISO 527–2; st = 0.1 mm/min | High variation of UTS with the γXZ angle, from 51.33 MPa (XZ specimens, γXZ = 0°) to 34.56 MPa (ZX specimens, γXZ = 90°). |
| [79] | γXZ = 0°–90° | 0.10–0.30 | - | 220 | 60 | - | df = 1.75 mm | Tensile—ISO 527–2 | High variation of UTS with the γXZ angle, from 49.66 MPa (XZ specimens, γXZ = 0°) to 23.40 MPa (ZX specimens, γXZ = 90°). |
| [101] | αXY = 0°–90°; βYZ = 0°–90°; γXZ = 0°–90° | 0.10 | - | - | - | - | dn = 0.4 mm; 99% infill | Tensile—ISO 527–2 | Highest UTS (55.68 MPa) for XZ (γXZ = 0°); Low UTS (12.68–15.5 MPa) for YX, YZ, βYZ = 45° and αXY = 45° specimens. |
| [102] | γXY = 0°–90°; γXZ = 0°–90° | 0.2 | 50 | 225 | 60 | - | df = 2.75 mm; dn = 0.6 mm | Tensile—ISO 527; Bending—ISO 178; Compression—ISO 604 | Highest UTS (49.8 MPa) for XZ (γXZ = 0°). Lowest UTS (21.5 MPa) for ZY and ZX. UTS decreases with the increase in γXY and γXZ. Low variation of the compressive strength. |
| [103] | γXY = 0°–90°; γXZ = 0°–90° | 0.15 | 60 | 220 | 60 | - | df = 1.75 mm; dn = 0.4 mm; 25–100% infill | Tensile—ASTM D638; Shear—ASTM D5379 | High decrease in UTS with the increase in γXZ. UTS = 55 MPa for XZ (γXZ = 0°). Highest shear strength (36 MPa) for γXY = 45°. |
| [104] | βYX = 0°–90°; βXY = 0°–90°; βYZ = 0°–90° | 0.20 | 35 | 205 | 60 | 0°/90°; 30°/−60°; 45°/−45°; 60°/−30°; 90°/0° | df = 1.75 mm; dn = 0.4 mm; 10% infill | Tensile—ASTM D638 | Low influence of βXY. High influence of βYX and βYZ. Highest UTS (27.6 MPa–30.9 MPa) for βXY = 0°–90°, βYX = 0° and βYZ = 0° specimens. |
| Ref. | FFF Process Parameters | Mechanical Test Settings | Results and Conclusions | ||||||
|---|---|---|---|---|---|---|---|---|---|
| θ (°) | t (mm) | sp (mm/s) | TH (°C) | TB (°C) | B.O. (-) | Other Parameters | |||
| θ—raster angle; t—layer thickness (layer height); sp—printing speed; TH—printing head (nozzle) temperature; TB—build plate temperature; B.O.—build orientation; df—filament diameter; dn—nozzle diameter; WL—number of wall lines. | |||||||||
| [24] | 40°; 60°; 80° | 0.10–0.30 | 30 | 195 | 110 | Horizontal | df = 1.75 mm; dn = 0.3 mm; 20–80% infill | Tensile—ASTM D638 | The variation of UTS vs. θ is influenced by the layer thickness. |
| [27] | 0°; 45°; 90° | 0.20 | - | - | - | XY; XZ; ZX | 50–100% infill | Tensile—ISO 527-2; st = 10 mm/min | A decrease of 16.7 % of the UTS for θ = 90° compared to θ = 0° and θ = 45° specimens. |
| [29] | 0°; 30°; 45°; 60°; 90° | 0.40 | 20–80 | 215 | 55 | Horizontal | 100% infill; WL = 2 | Tensile—ASTM D638; st = 5 mm/min | For t = 0.40 mm all specimens fractured in the direction of the raster. Highest UTS for θ = 0° specimens; UTS decreases by approx. 40% for θ = 90° specimens. |
| [37] | 0°; 45°; 90° | 0.10 | 30 | 240 | 60 | Horizontal | df = 2.85 mm; dn = 0.4 mm; 100% infill; 1–10% moisture | Tensile—ASTM D638; st = 5 mm/min | The raster angle has a high significance on UTS. Maximum UTS (50.3 MPa) and E (1890 MPa) obtained at θ = 0° and 10% moisture content. |
| [61] | 0°; 90° | 0.20–0.30 | 38–52 | 190 | 40 | - | dn = 0.40 mm; 40% infill | Bending—ASTM D790; st = 12 mm/min | A higher flexural strength for θ = 0° specimens. |
| [63] | 0°; 18°; 45°; 72°; 90° | 0.10–0.20 | 60 | 205 | 60 | Horizontal | 100% infill; WL = 2–6 | Tensile—ASTM D638 modified specimens | Highest UTS (53.59 MPa) and E (3388.57 MPa) for θ = 0°; Lowest UTS (43.39 MPa) and E (2799.43 MPa) for θ = 90°. |
| [64] | 30°; 45°; 60° | 0.10–0.30 | - | 210 | 80 | γXY = 0°–90° | df = 1.75 mm; 50% infill | Tensile—ASTM D638 | UTS decreases with the increase in θ. |
| [69,70,71] | 0°; 45°; 90° | 0.10–0.30 | 50 | 210 | 70 | - | df = 1.75 mm; dn = 0.4 mm; 100% infill; WL = 1 | Tensile—ASTM D638; Bending—ASTM D790; Impact—ASTM D256 | High influence of the raster angle on the mechanical properties. Highest UTS, UFS and Izod impact strength for θ = 0° specimens. |
| [90] | 0°; 45°; 90° | 0.35 | 40 | 190–210 | 55 | Horizontal | df = 2.85 mm; dn = 0.4 mm; WL = 2 | Tensile—ASTM D638-10-I; st = 5 mm/min | Highest UTS and E for θ = 0° specimens. Lowest UTS and E for θ = 90° specimens. |
| [107] | 0°; 30°; 45°; 60°; 90° | 0.20 | 30 | 200 | 60 | Horizontal | 100% infill | Tensile—ISO 527-2, Type 1B specimens | Breaking surface aligned with the raster. Highest UTS and E for θ = 0°; UTS decreases by approx. 70% for θ = 90°. |
| [108] | 0°; 30°; 45°; 60°; 90° | - | 70 | 200 | 60 | XY | df = 2.85 mm; 100% infill | Tensile—ASTM D638 | High influence of the raster angle on UTS. Highest UTS for θ = 45°. |
| [27] | 0°/45°; 45°/−45°; 0°/90° | 0.20 | - | - | - | XY; XZ; ZX | 50–100% infill | Tensile—ISO 527-2; st = 10 mm/min | Highest UTS (58.4 MPa) for θ = 0°/45°. |
| [32] | 45°/−45°; 0°/90°; 0°/−30°/30°/ −60°/60°/90° | 0.10–0.30 | 60 | 215 | 60 | Horizontal | df = 1.75 mm; 100% infill; ageing; heat treatment | Tensile—ASTM D638 | Higher UTS for θ = −45°/45°. The variation of UTS vs. raster angle is influenced by heat treatment and ageing. |
| [33] | 0°/90°; 15°/75°; 30/60°; 45/45° | - | 50 | 190–230 | 45–105 | - | df = 2.85 mm; 100% infill | Tensile—ASTM D638; st = 5 mm/min Bending—ASTM D790; Impact—ASTM D256 | Highest values of tensile strength, flexural strength and Izod impact strength obtained for θ = 45/45°. |
| [51] | 0°; 90°; 45°/−45° | 0.06–0.35 | 60 | 190–220 | 60 | XY | df = 1.75 mm; dn = 0.4 mm; 100% infill; WL = 2 | Tensile—ASTM D638-I specimens; st = 5 mm/min | Highest UTS for θ = 45/−45°. Low values of UTS for specimens with θ = 90° and t = 0.06 mm. |
| [83] | 0°/90°; 30°/−60°; 45°/−45° | 0.08–0.28 | 20–60 | 210–220 | - | XY; XZ | df = 1.75 mm; dn = 0.3–0.5 mm; 80–100% infill; WL = 2–4 | Tensile test, ASTM D638-I; st = 5 mm/min | Higher UTS for specimens with θ = 30°/−60° and θ = 45°/−45°. |
| [86] | 45°/−45°; 0°/90° | 0.10 | 35–65 | 200 | 60 | XY | df = 2.85 mm; 100% infill | Tensile—ASTM D638 | Higher UTS for θ = 45°/−45°. |
| [104] | 0°/90°; 30°/−60°; 45°/−45°; 60°/−30°; 90°/0° | 0.20 | 35 | 205 | 60 | βYX = 0°–90°; βXY = 0°–90°; βYZ = 0°–90° | df = 1.75 mm; dn = 0.4 mm; 10% infill | Tensile—ASTM D638 | Low influence (2 MPa) of the raster angle on UTS, at 10% infill. |
| [107] | 0°/90°; 30°/−60°; 45°/−45° | 0.20 | 30 | 200 | 60 | Horizontal | 100% infill | Tensile—ISO 527-2, Type 1B specimens | Low influence of the alternating raster angle on the elastic modulus and the ultimate tensile strength. |
| [109] | 0°/90°; 15°/-75°; 30°/−60°; 45°/−45° | 0.20 | 55 | 210 | 60 | Horizontal | - | Tensile—ASTM D638; st = 0.5 mm/min; fracture test | Highest E (1942 MPa) and yield stress (27.1 MPa) for θ = 0/90°; Highest fracture load (865.1 N) in fracture test of specimens with θ = 45/−45°. |
| [110] | 0°; 90°; 45/−45° | 0.30 | 50 | 190 | 55 | XY | dn = 0.4 mm | Tensile—ASTM D638; st = 5 mm/min | Highest UTS for θ = 0°; Low influence of the raster angle on the elastic modulus for PLA. |
| [111] | 0°/90°; 45°/−45° | 0.2 | 120 | 200 | 50 | Horizontal | df = 1.75 mm; dn = 0.4 mm; 3090 % infill; WL = 2 | Tensile—ISO 527 | A higher strength of specimens for θ = 45°/−45°. Low influence of raster angle on elastic modulus. |
| [112] | 0°; 90°; 45°/0°/90°/ 135° | 0.14 | 40 | 215 | 60 | XY | df = 1.75 mm; dn = 0.4 mm; 100% infill | Tensile—ASTM D638 | Highest UTS (57.7 MPa) for θ = 0°; Lowest UTS (30.8 MPa) for θ = 90°. |
| [113] | 45°/−45°; 0°/90° | 0.15 | 40 | 210 | 50 | - | df = 1.75 mm; dn = 0.5 mm; 100% infill | Bending—ASTM D790; Compression—ASTM S695; Impact test—ASTM D256 | Higher UFS (+14.31%) and impact strength (+41.20%) for θ = 45°/−45°. Low influence of raster angle on the compressive strength. |
| [114] | 45°/−45°; 0°/90° | 0.25 | 50 | 210 | 60 | XY | df = 1.75 mm; dn = 0.4 mm; 100% infill | Tensile—ASTM D638; Bending—ASTM D790; Impact—ASTM D256 | Higher UTS and Izod impact strength for θ = 45°/−45°; Higher UFS for θ = 0°/90°. |
Publisher’s Note: MDPI stays neutral with regard to jurisdictional claims in published maps and institutional affiliations. |
© 2022 by the authors. Licensee MDPI, Basel, Switzerland. This article is an open access article distributed under the terms and conditions of the Creative Commons Attribution (CC BY) license (https://creativecommons.org/licenses/by/4.0/).
Share and Cite
Cojocaru, V.; Frunzaverde, D.; Miclosina, C.-O.; Marginean, G. The Influence of the Process Parameters on the Mechanical Properties of PLA Specimens Produced by Fused Filament Fabrication—A Review. Polymers 2022, 14, 886. https://doi.org/10.3390/polym14050886
Cojocaru V, Frunzaverde D, Miclosina C-O, Marginean G. The Influence of the Process Parameters on the Mechanical Properties of PLA Specimens Produced by Fused Filament Fabrication—A Review. Polymers. 2022; 14(5):886. https://doi.org/10.3390/polym14050886
Chicago/Turabian StyleCojocaru, Vasile, Doina Frunzaverde, Calin-Octavian Miclosina, and Gabriela Marginean. 2022. "The Influence of the Process Parameters on the Mechanical Properties of PLA Specimens Produced by Fused Filament Fabrication—A Review" Polymers 14, no. 5: 886. https://doi.org/10.3390/polym14050886