
Visual, Non-Destructive, and Destructive Investigations of Polyethylene Pipes with Inhomogeneous Carbon Black Distribution for Assessing Degradation of Structural Integrity


Abstract
:
1. Introduction
2. Materials and Methods
2.1. Pipe Specimens
2.2. Visual Observation of Windows in Whole Pipe Cross Section
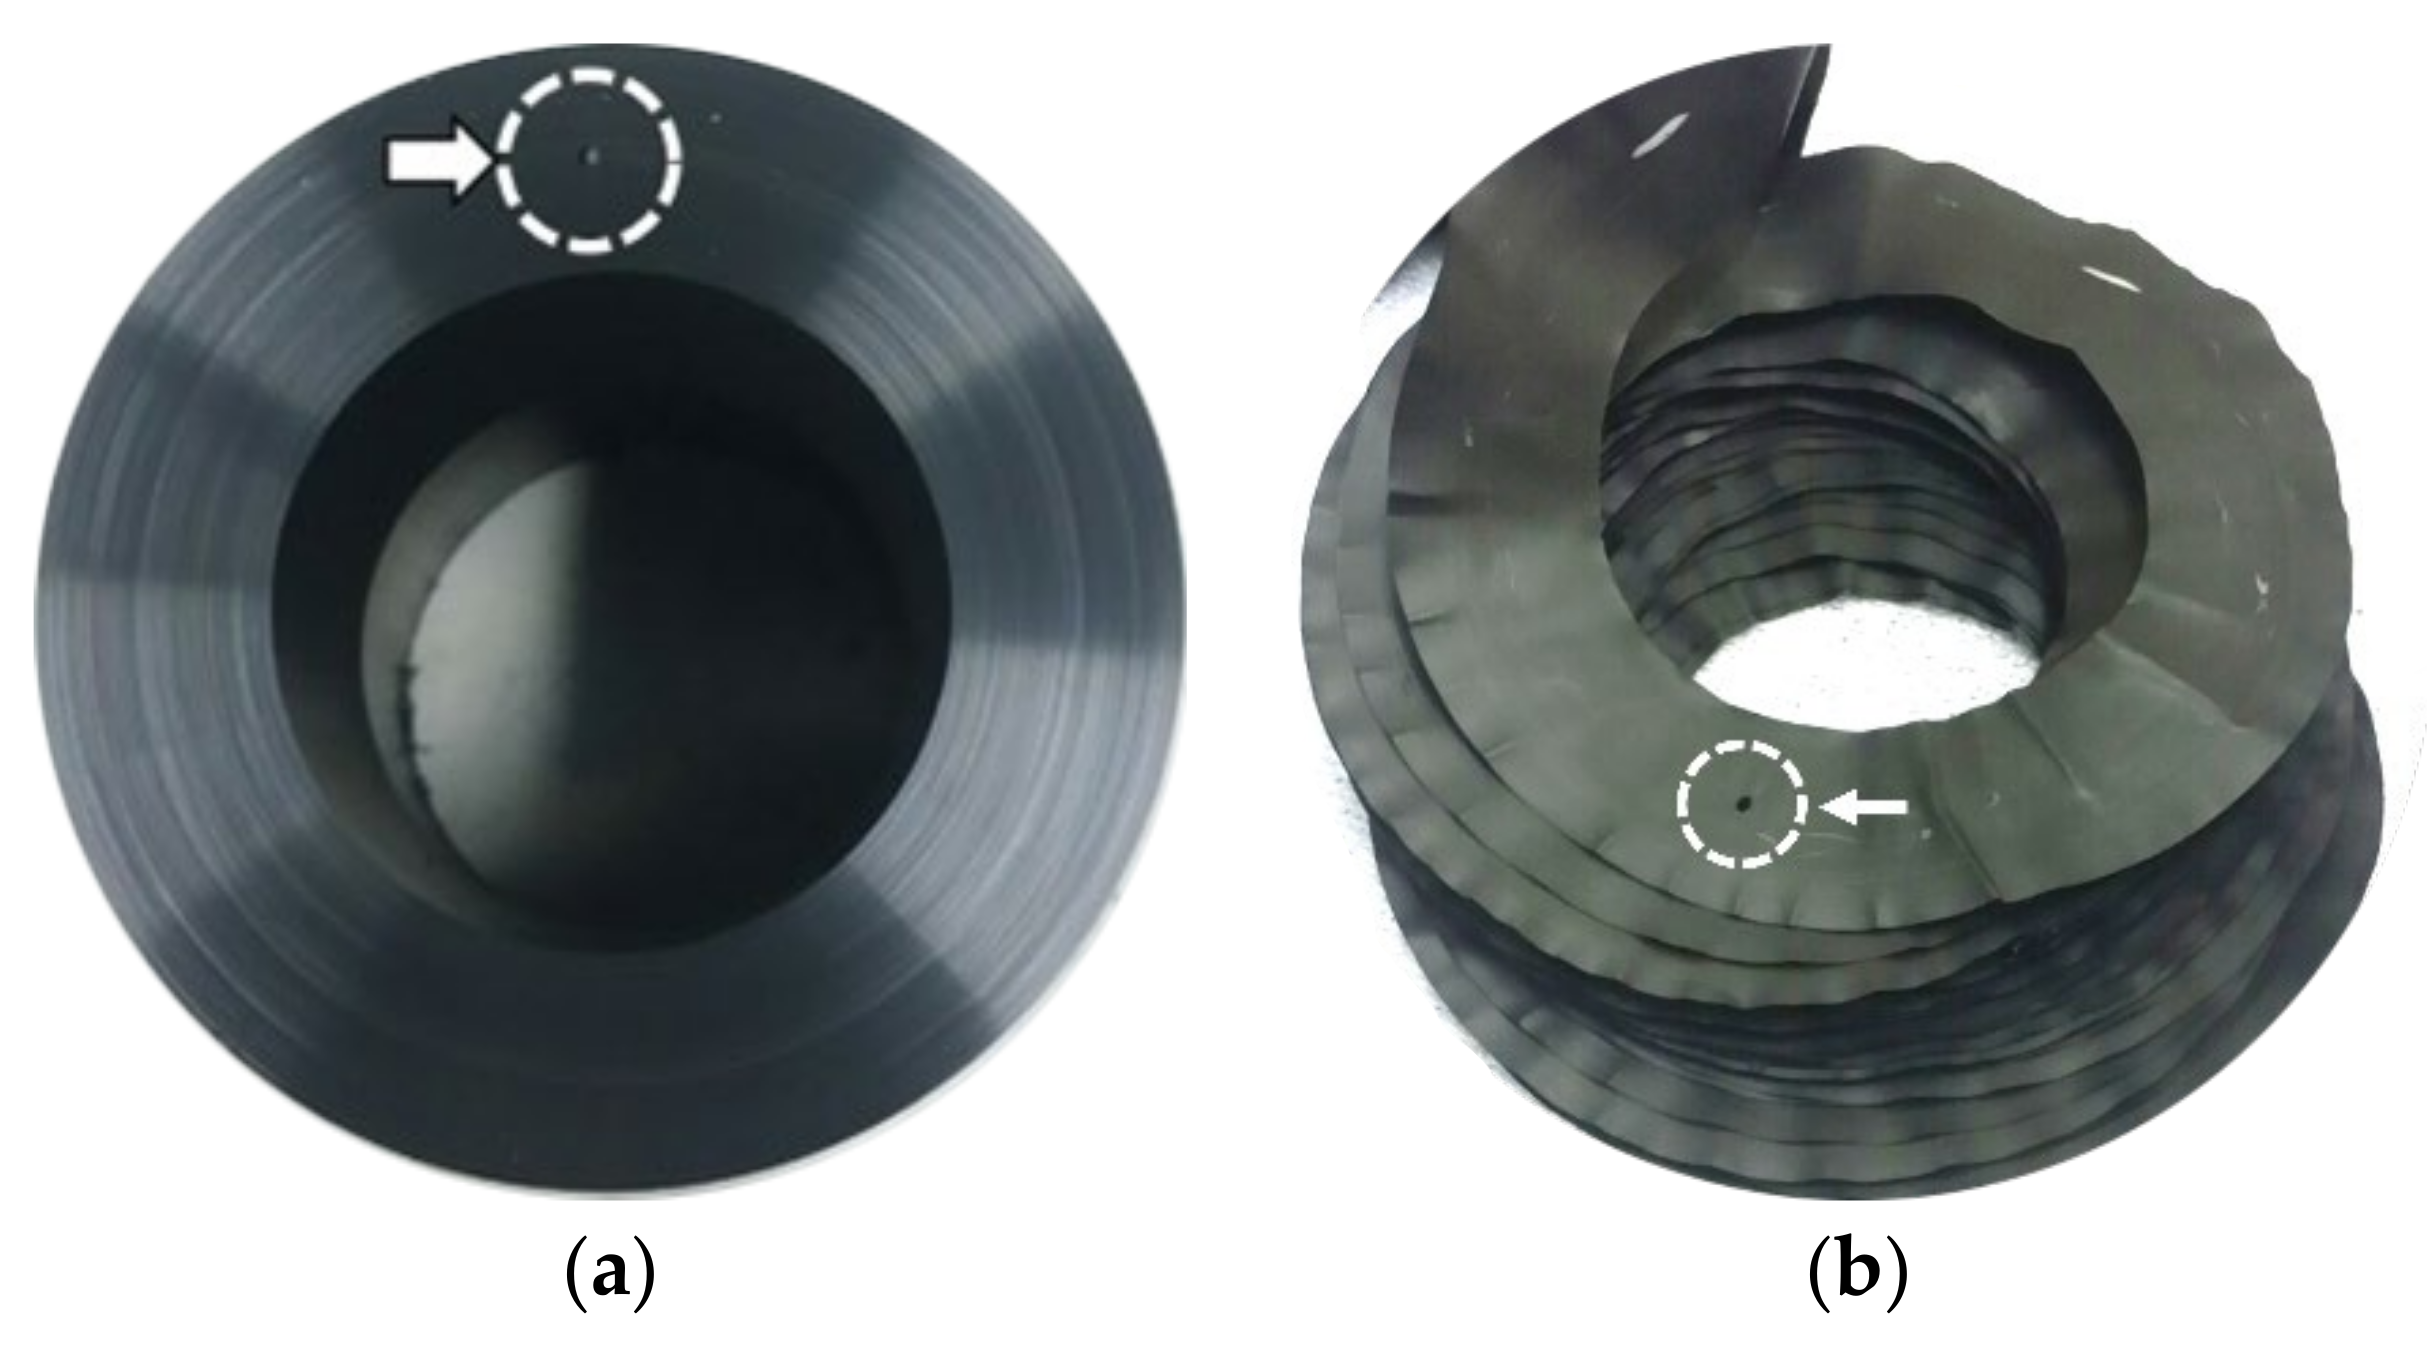
2.2.1. Preparation of Whole Pipe Cross Section Shavings
2.2.2. Visual Observation of Windows in Whole Pipe Cross Section
2.2.3. Measurement of Relative Window Concentrations in the Shavings
2.3. Observation of Windows by the Non-Destructive Tests
2.3.1. PAUT
2.3.2. MWI
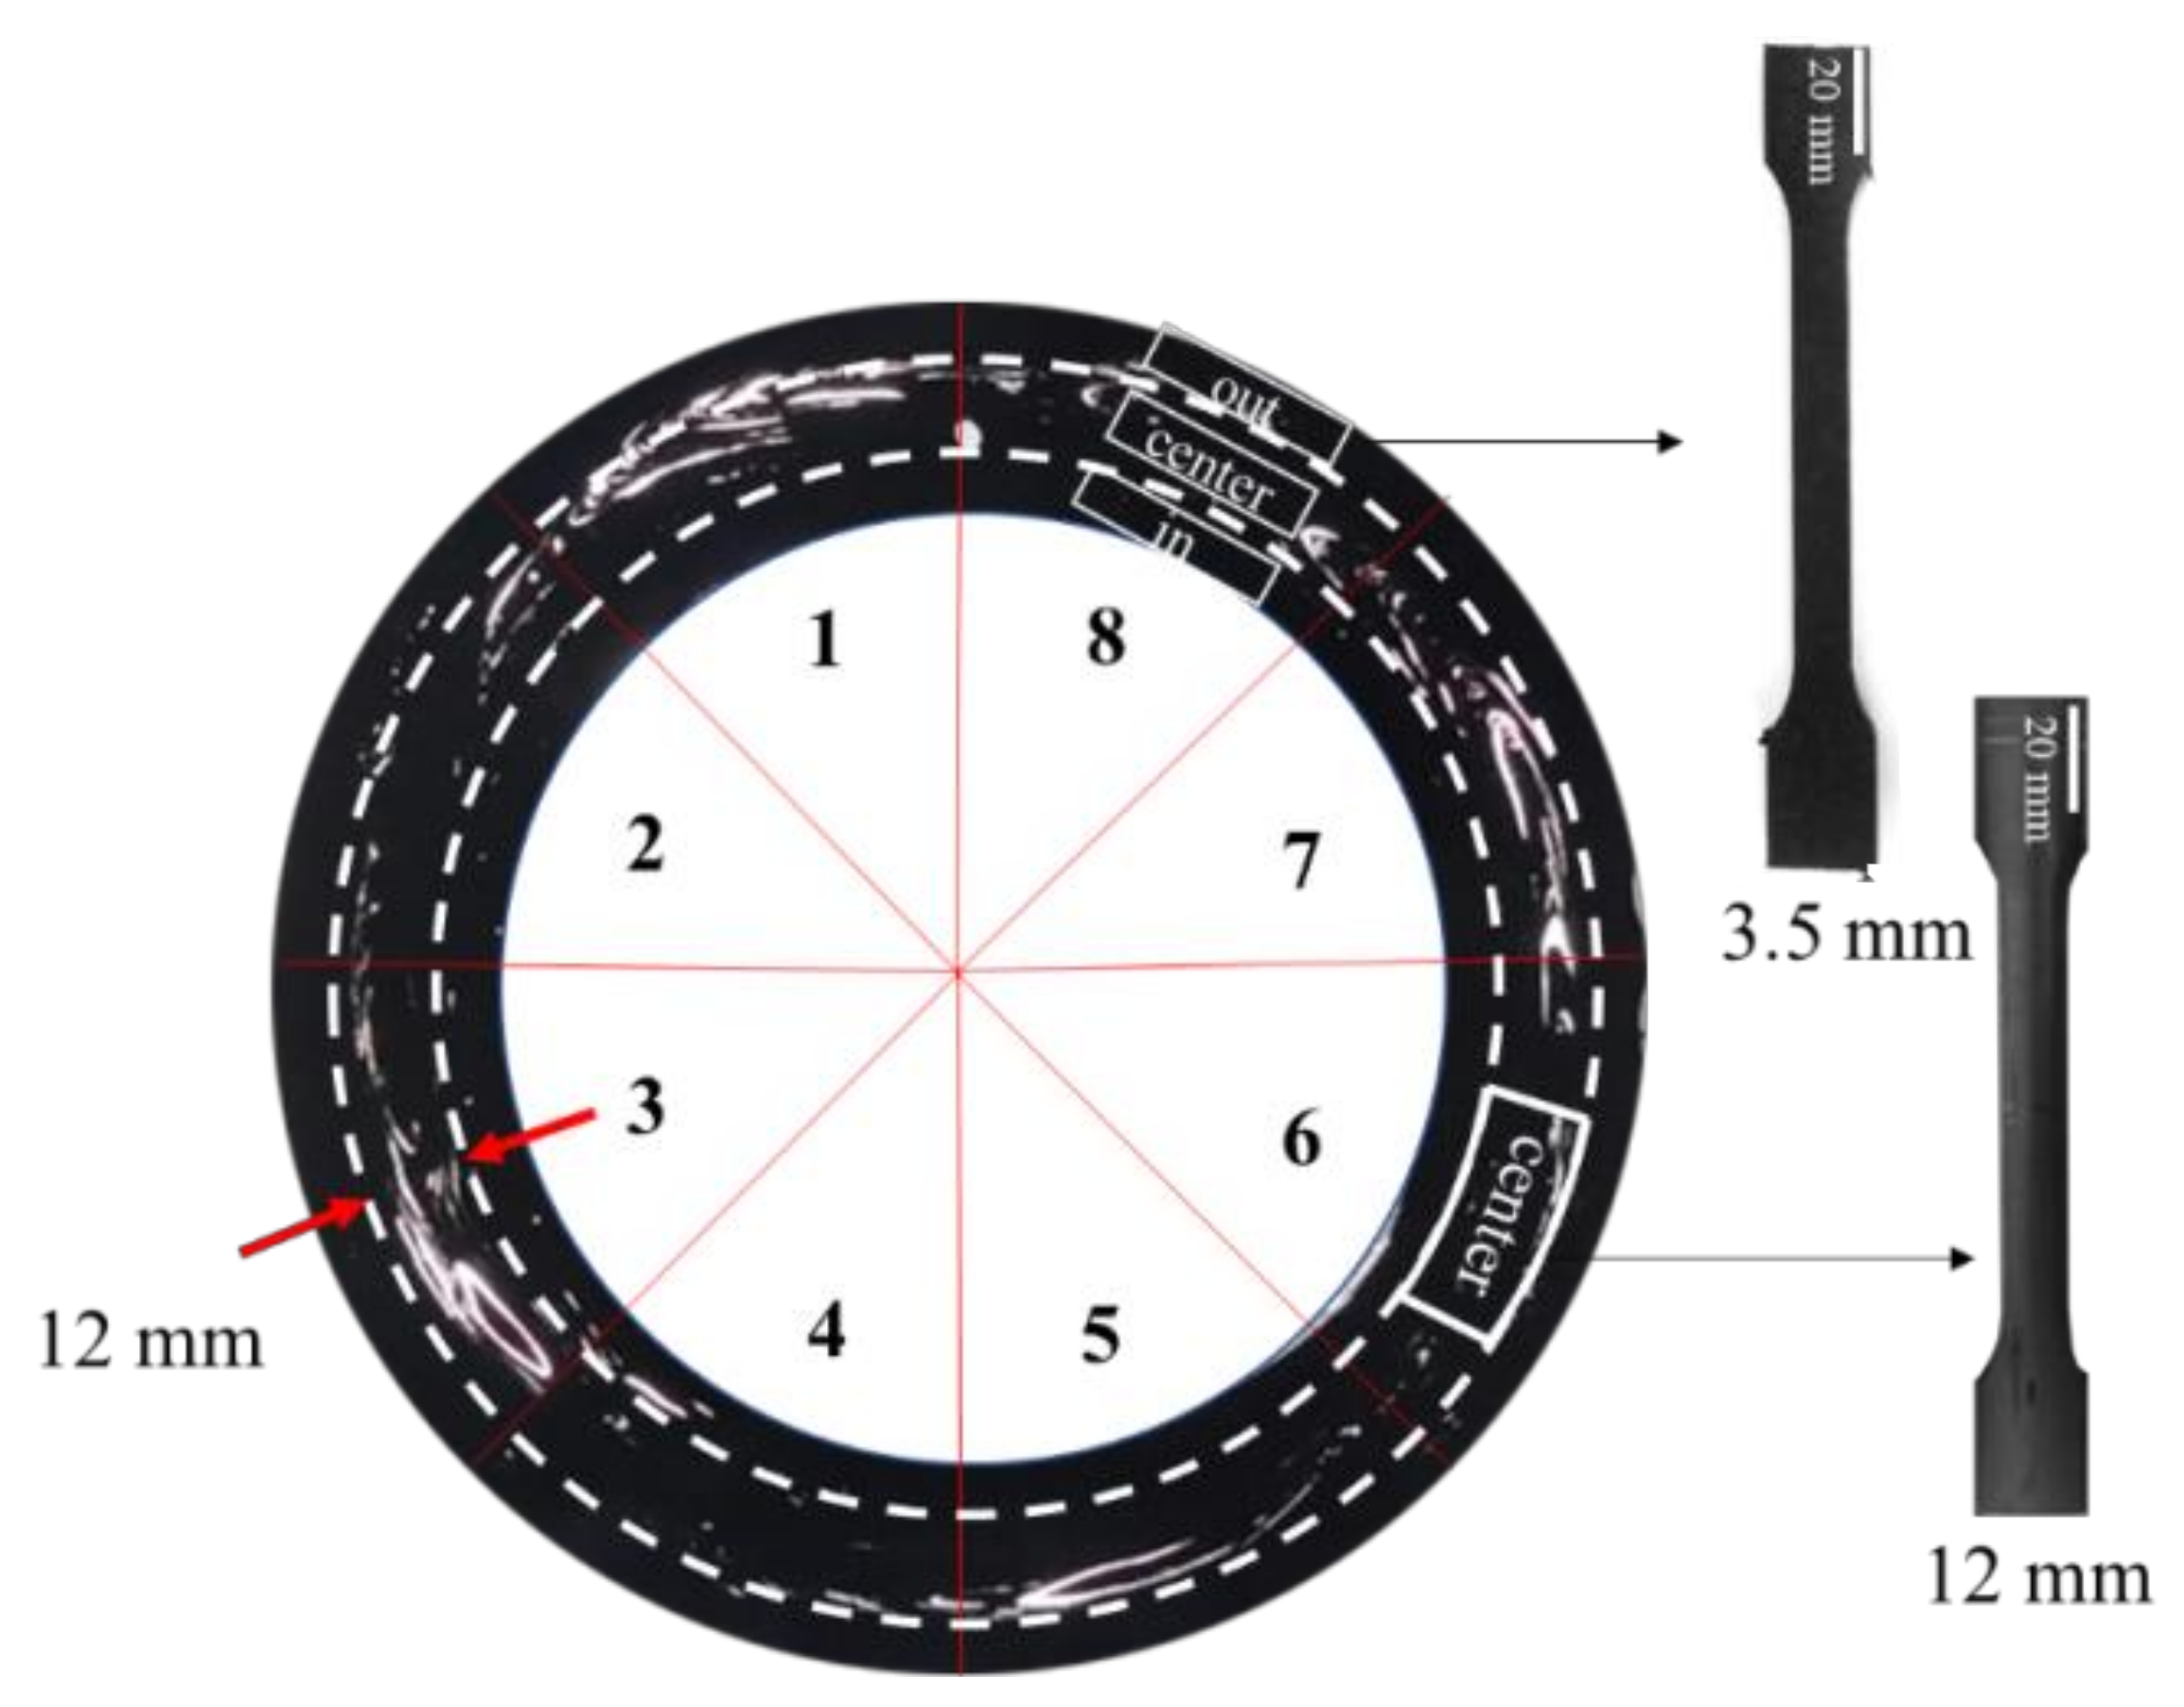
2.4. Tensile Test
2.4.1. Pipes
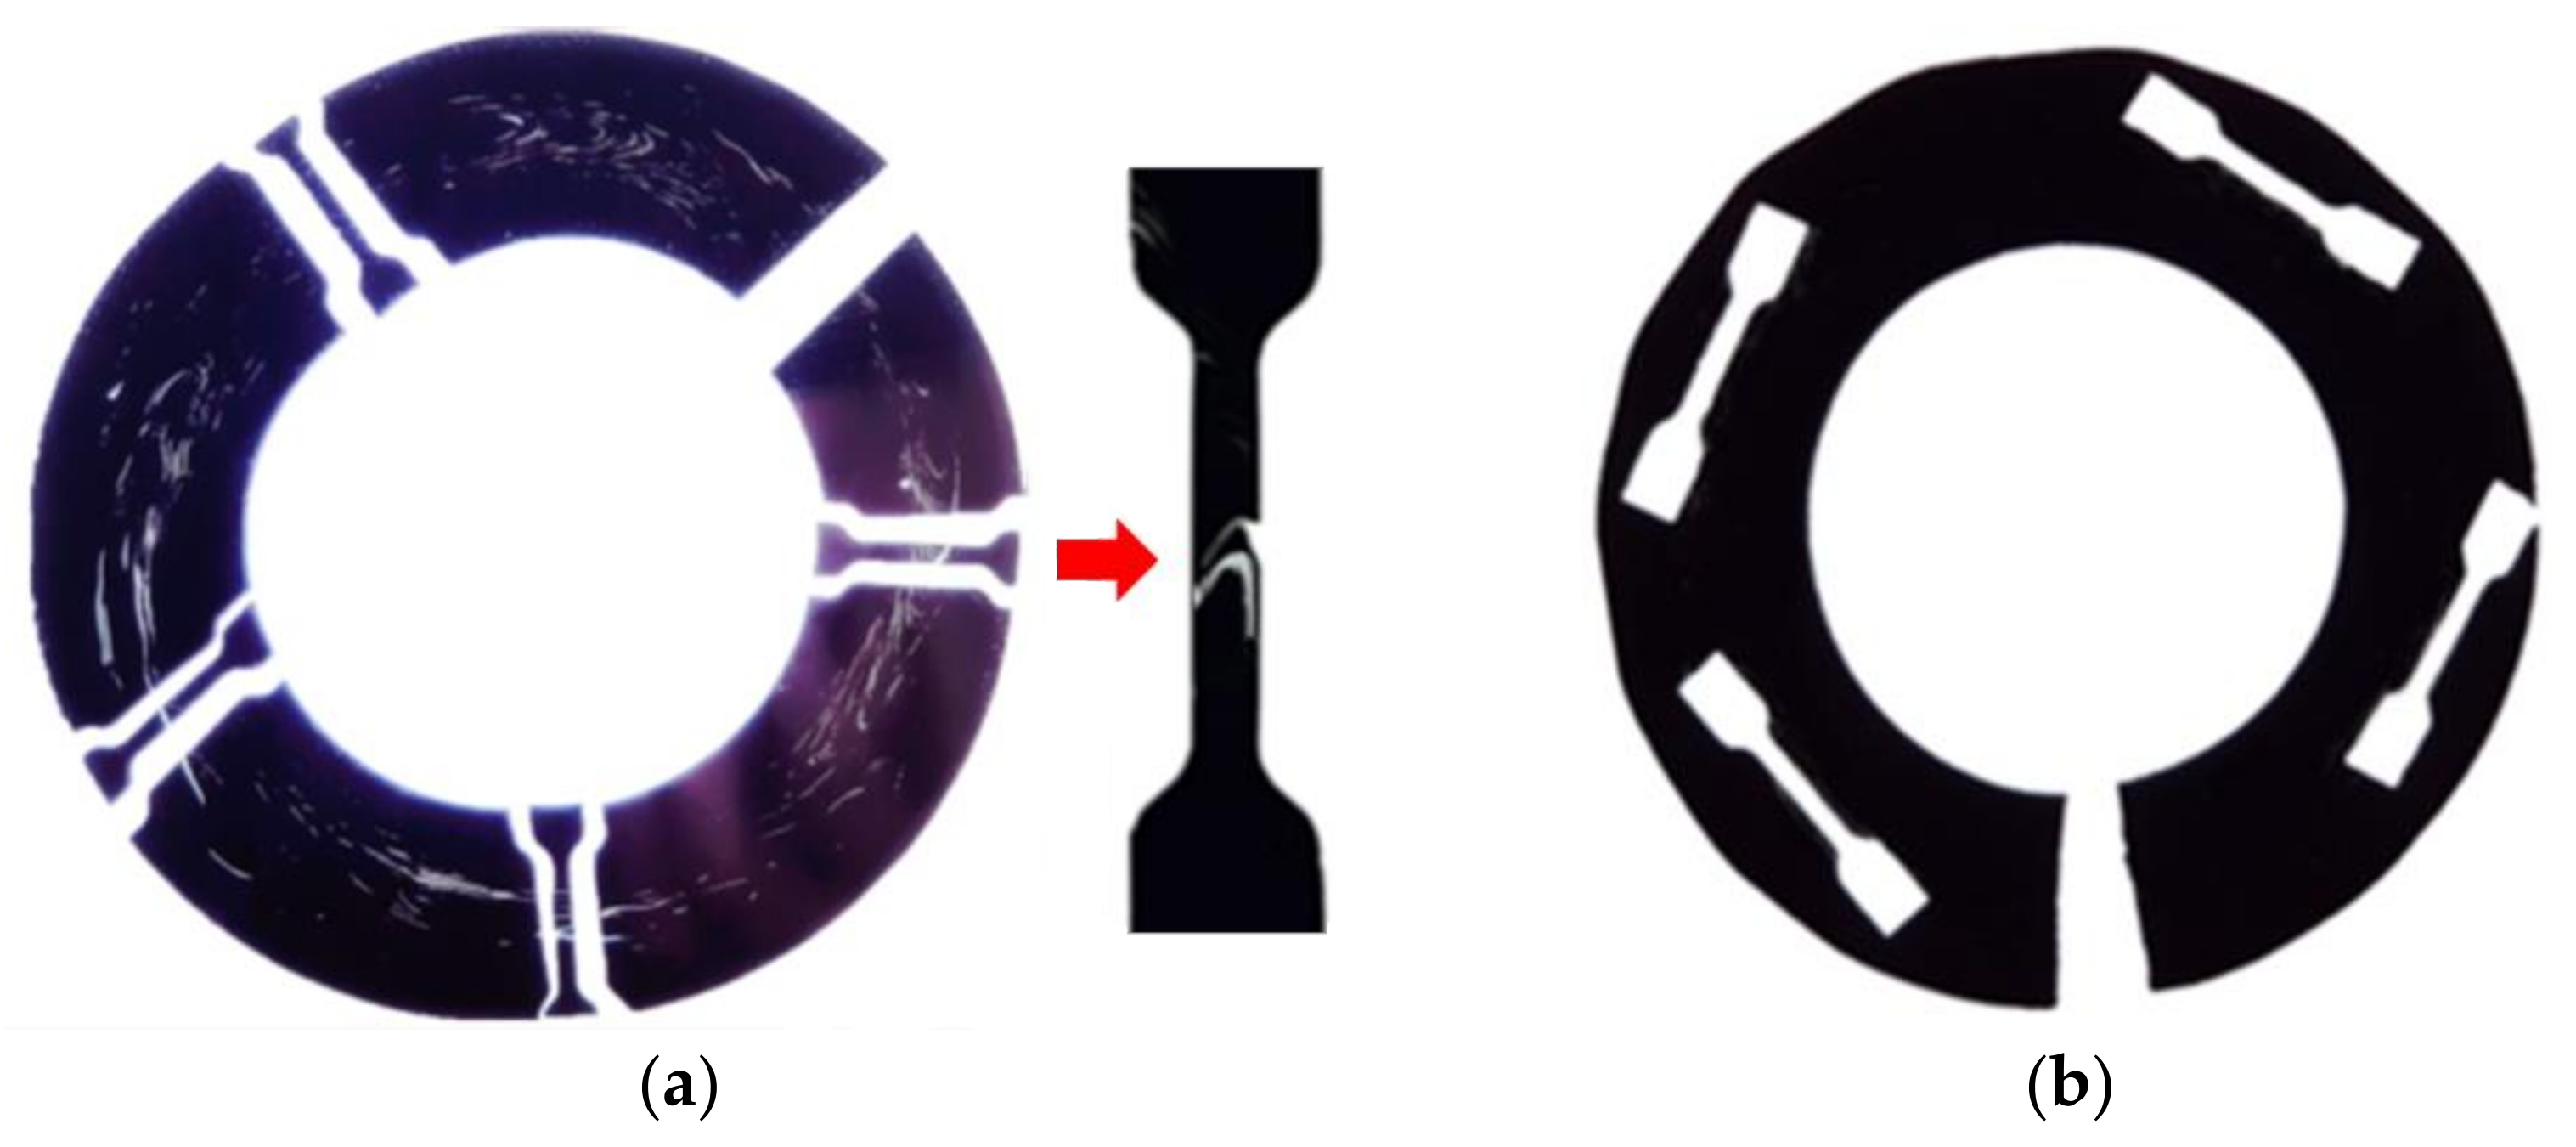
2.4.2. Shavings
2.5. Scanning Electron Microscope (SEM)
2.6. Micro-Indentation
3. Results and Discussion
4. Conclusions
- (1)
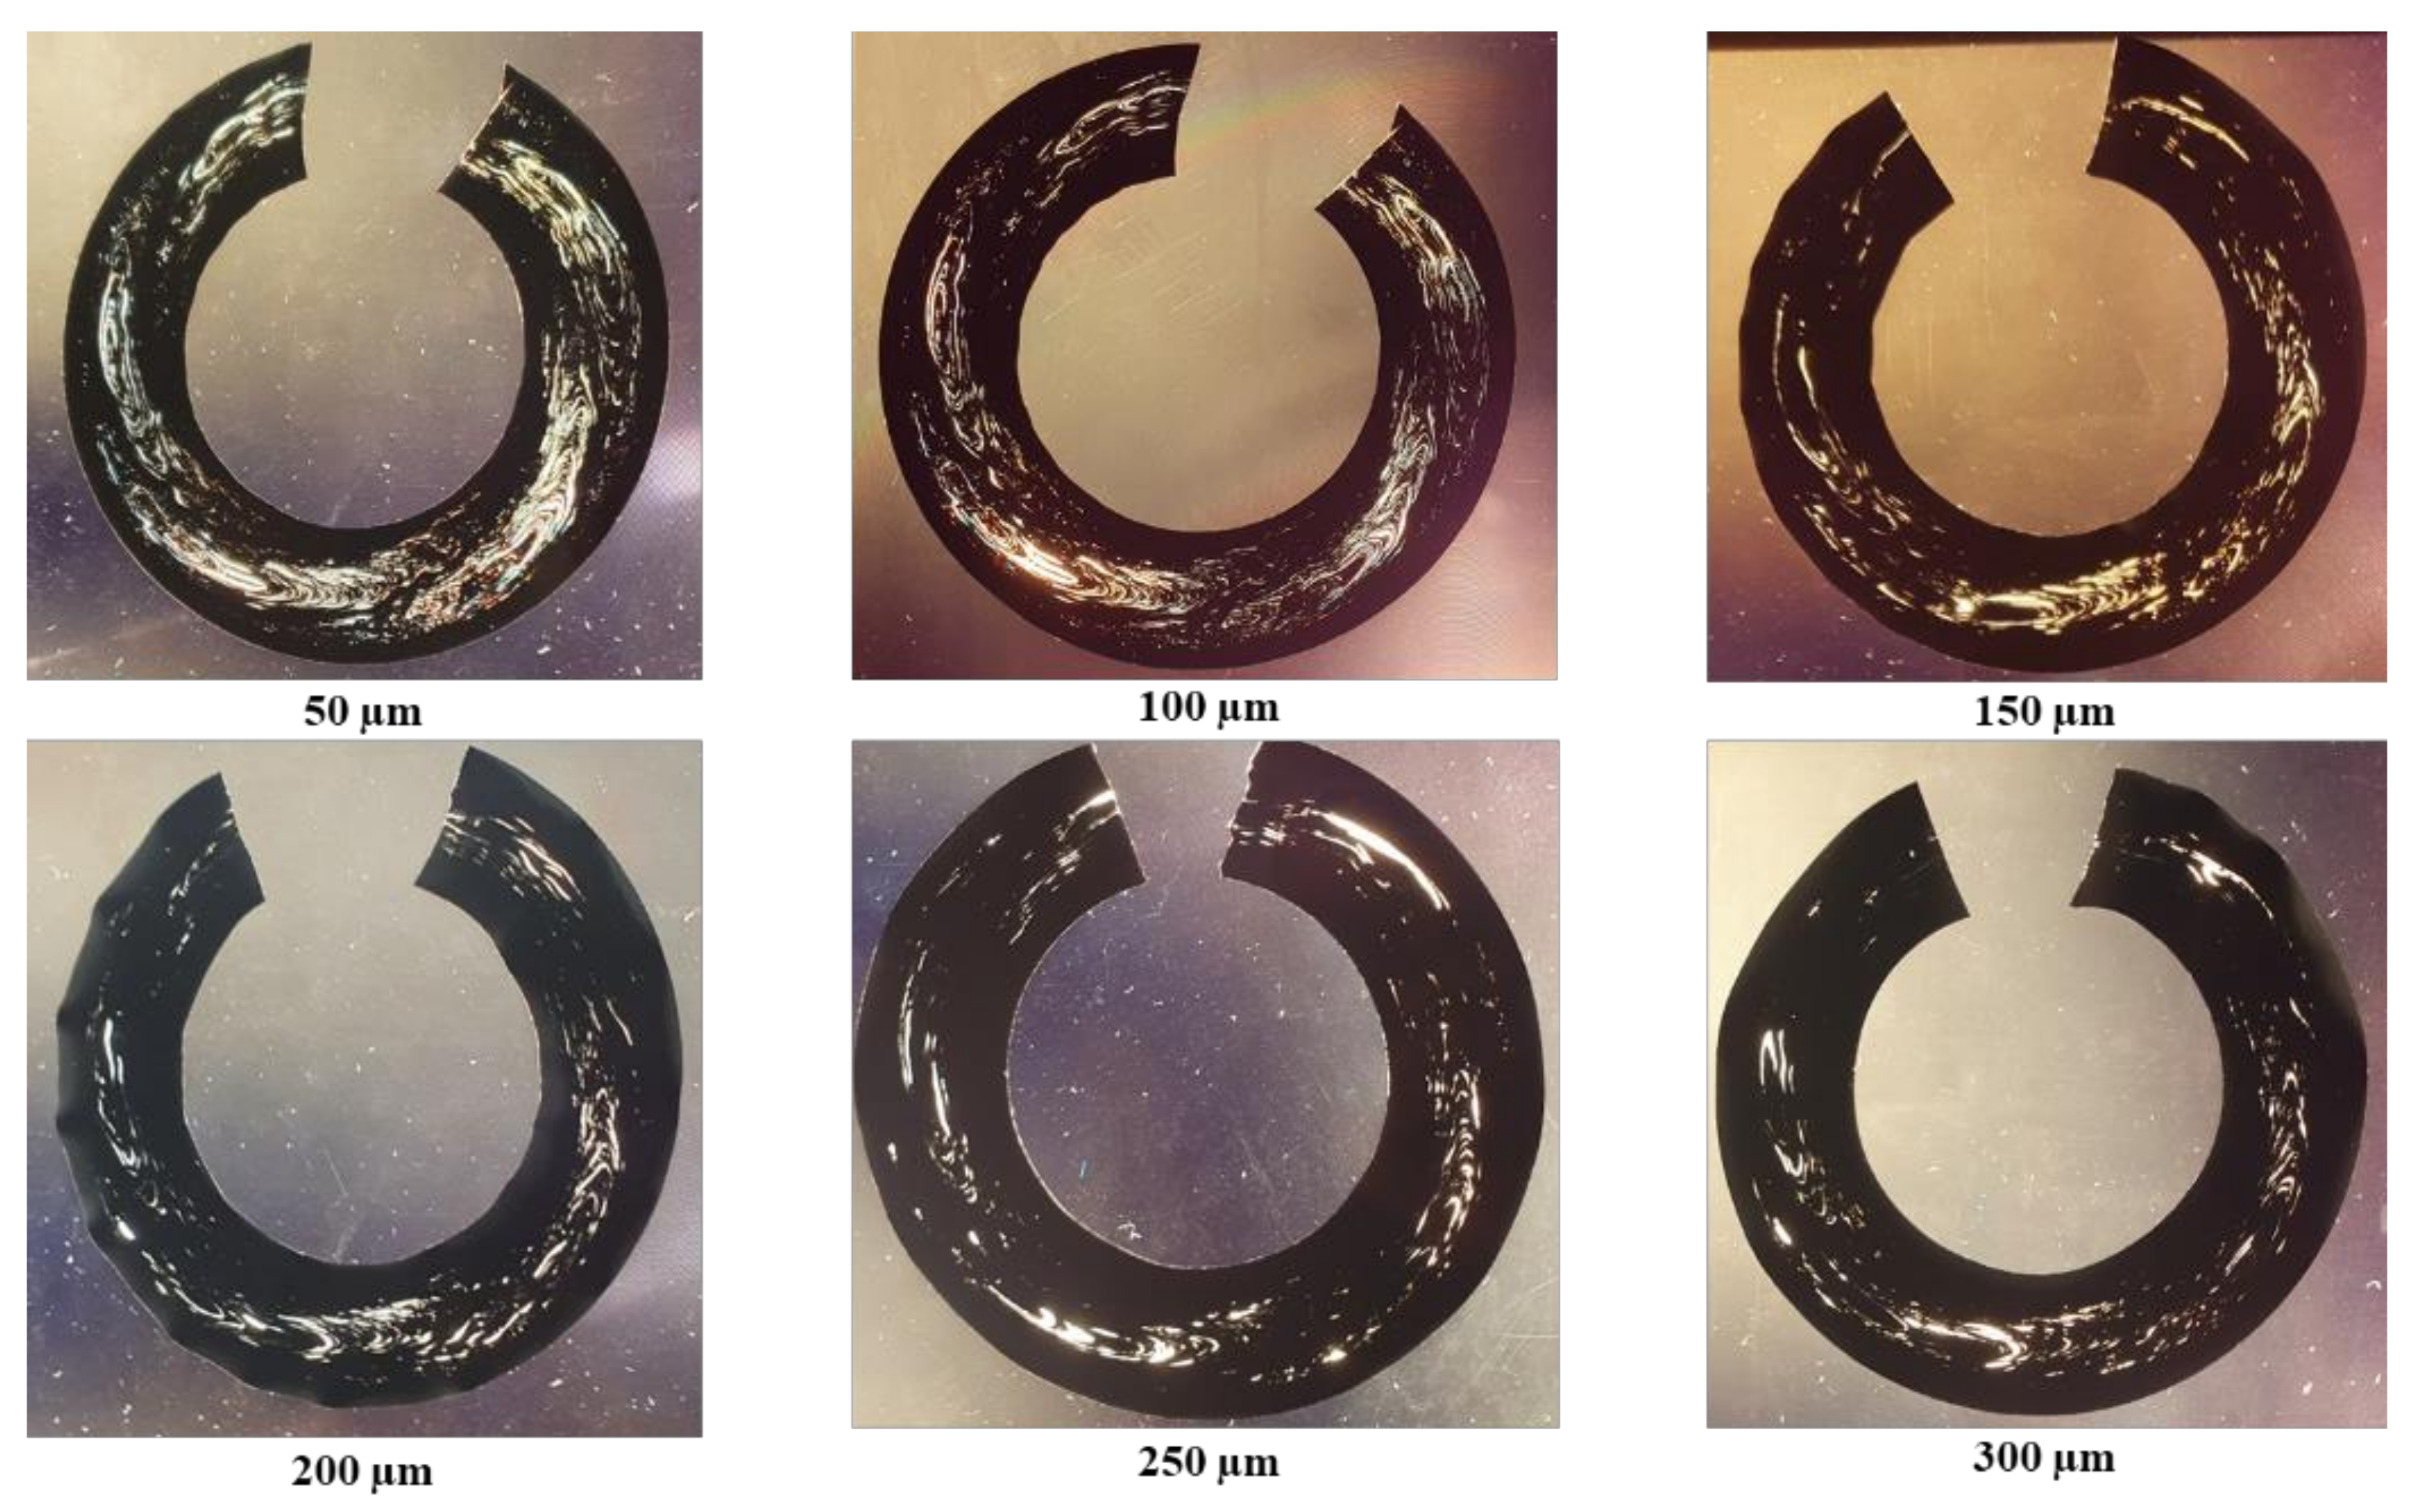
- A turning method of producing 110 SDR 5 whole PE pipe cross-section shavings of thickness as small as 30 μm was developed, and we demonstrated that a 100 μm thick shaving is best for performing visual observation and micro-tensile tests.
- (2)
- Visual observation of the windows and their swirl patterns in a whole pipe cross section was determined to be best offered by using a cross-polarized monochromatic light. In addition, the windows’ locations and swirl patterns provided CB mixing details in a single screw extrusion.
- (3)
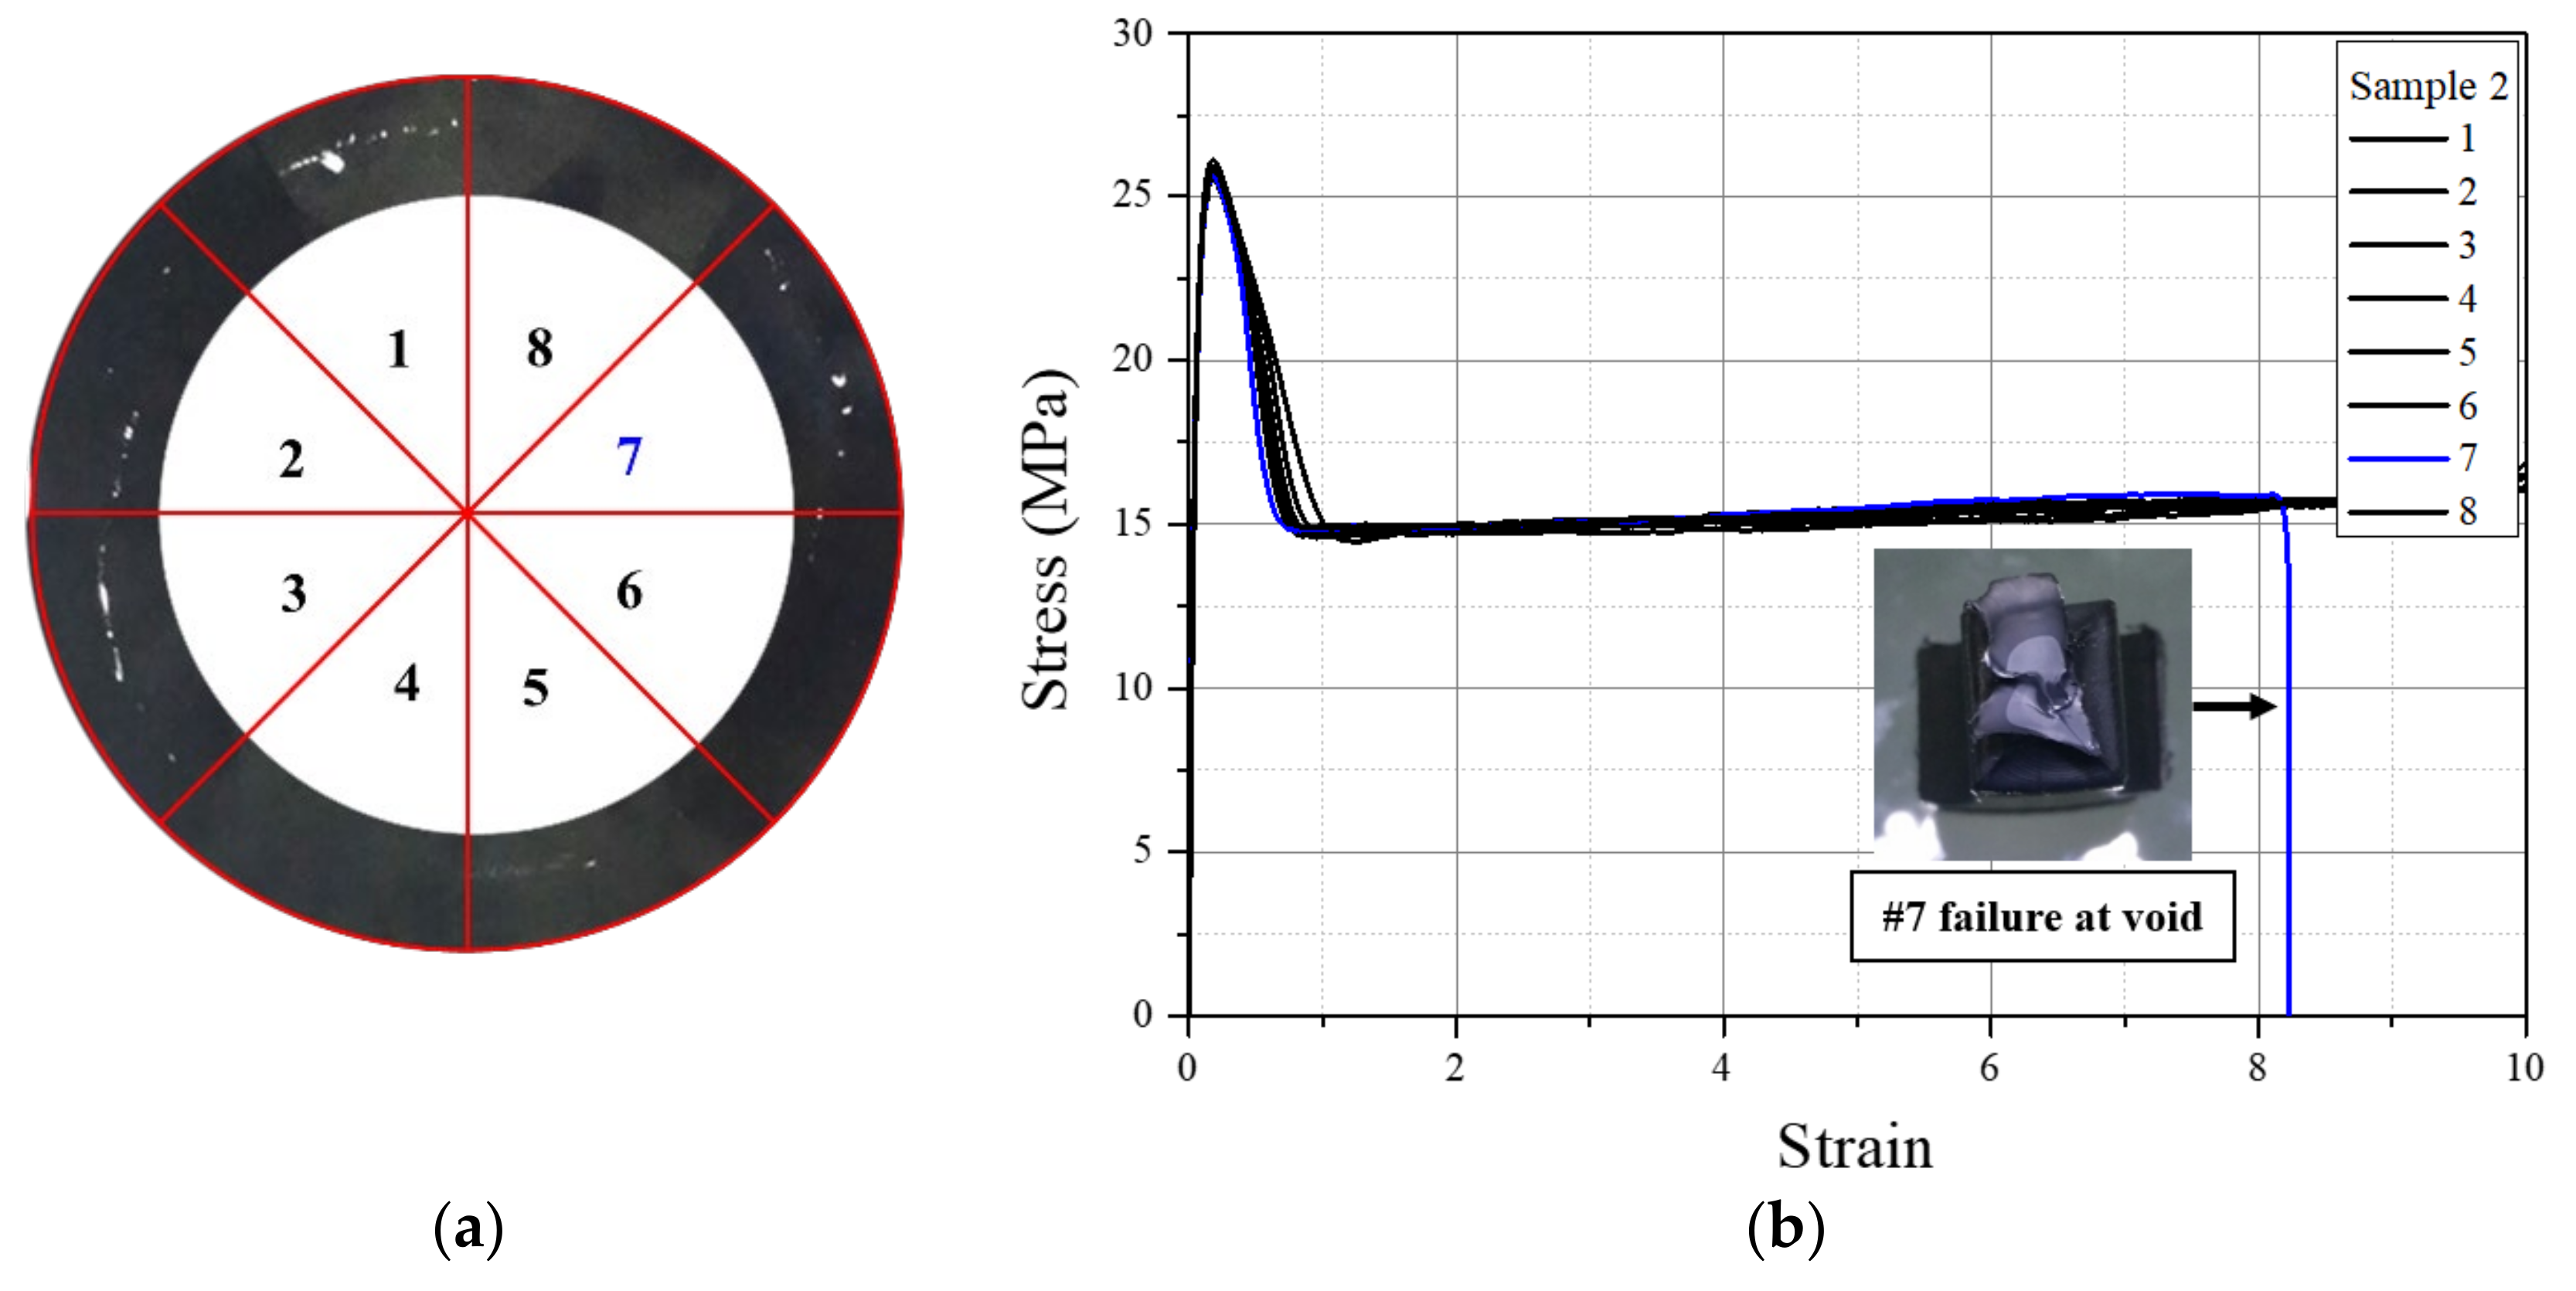
- The % windows in a whole pipe cross section and sectorial sections using images from the visual windows’ observations were measured, and 0%, 1.5%, 7.5%, and 16.5% were determined for windows free (sample 1), low (sample 2), medium (sample 3), and high (sample 4) levels of window-containing pipes, respectively.
- (4)
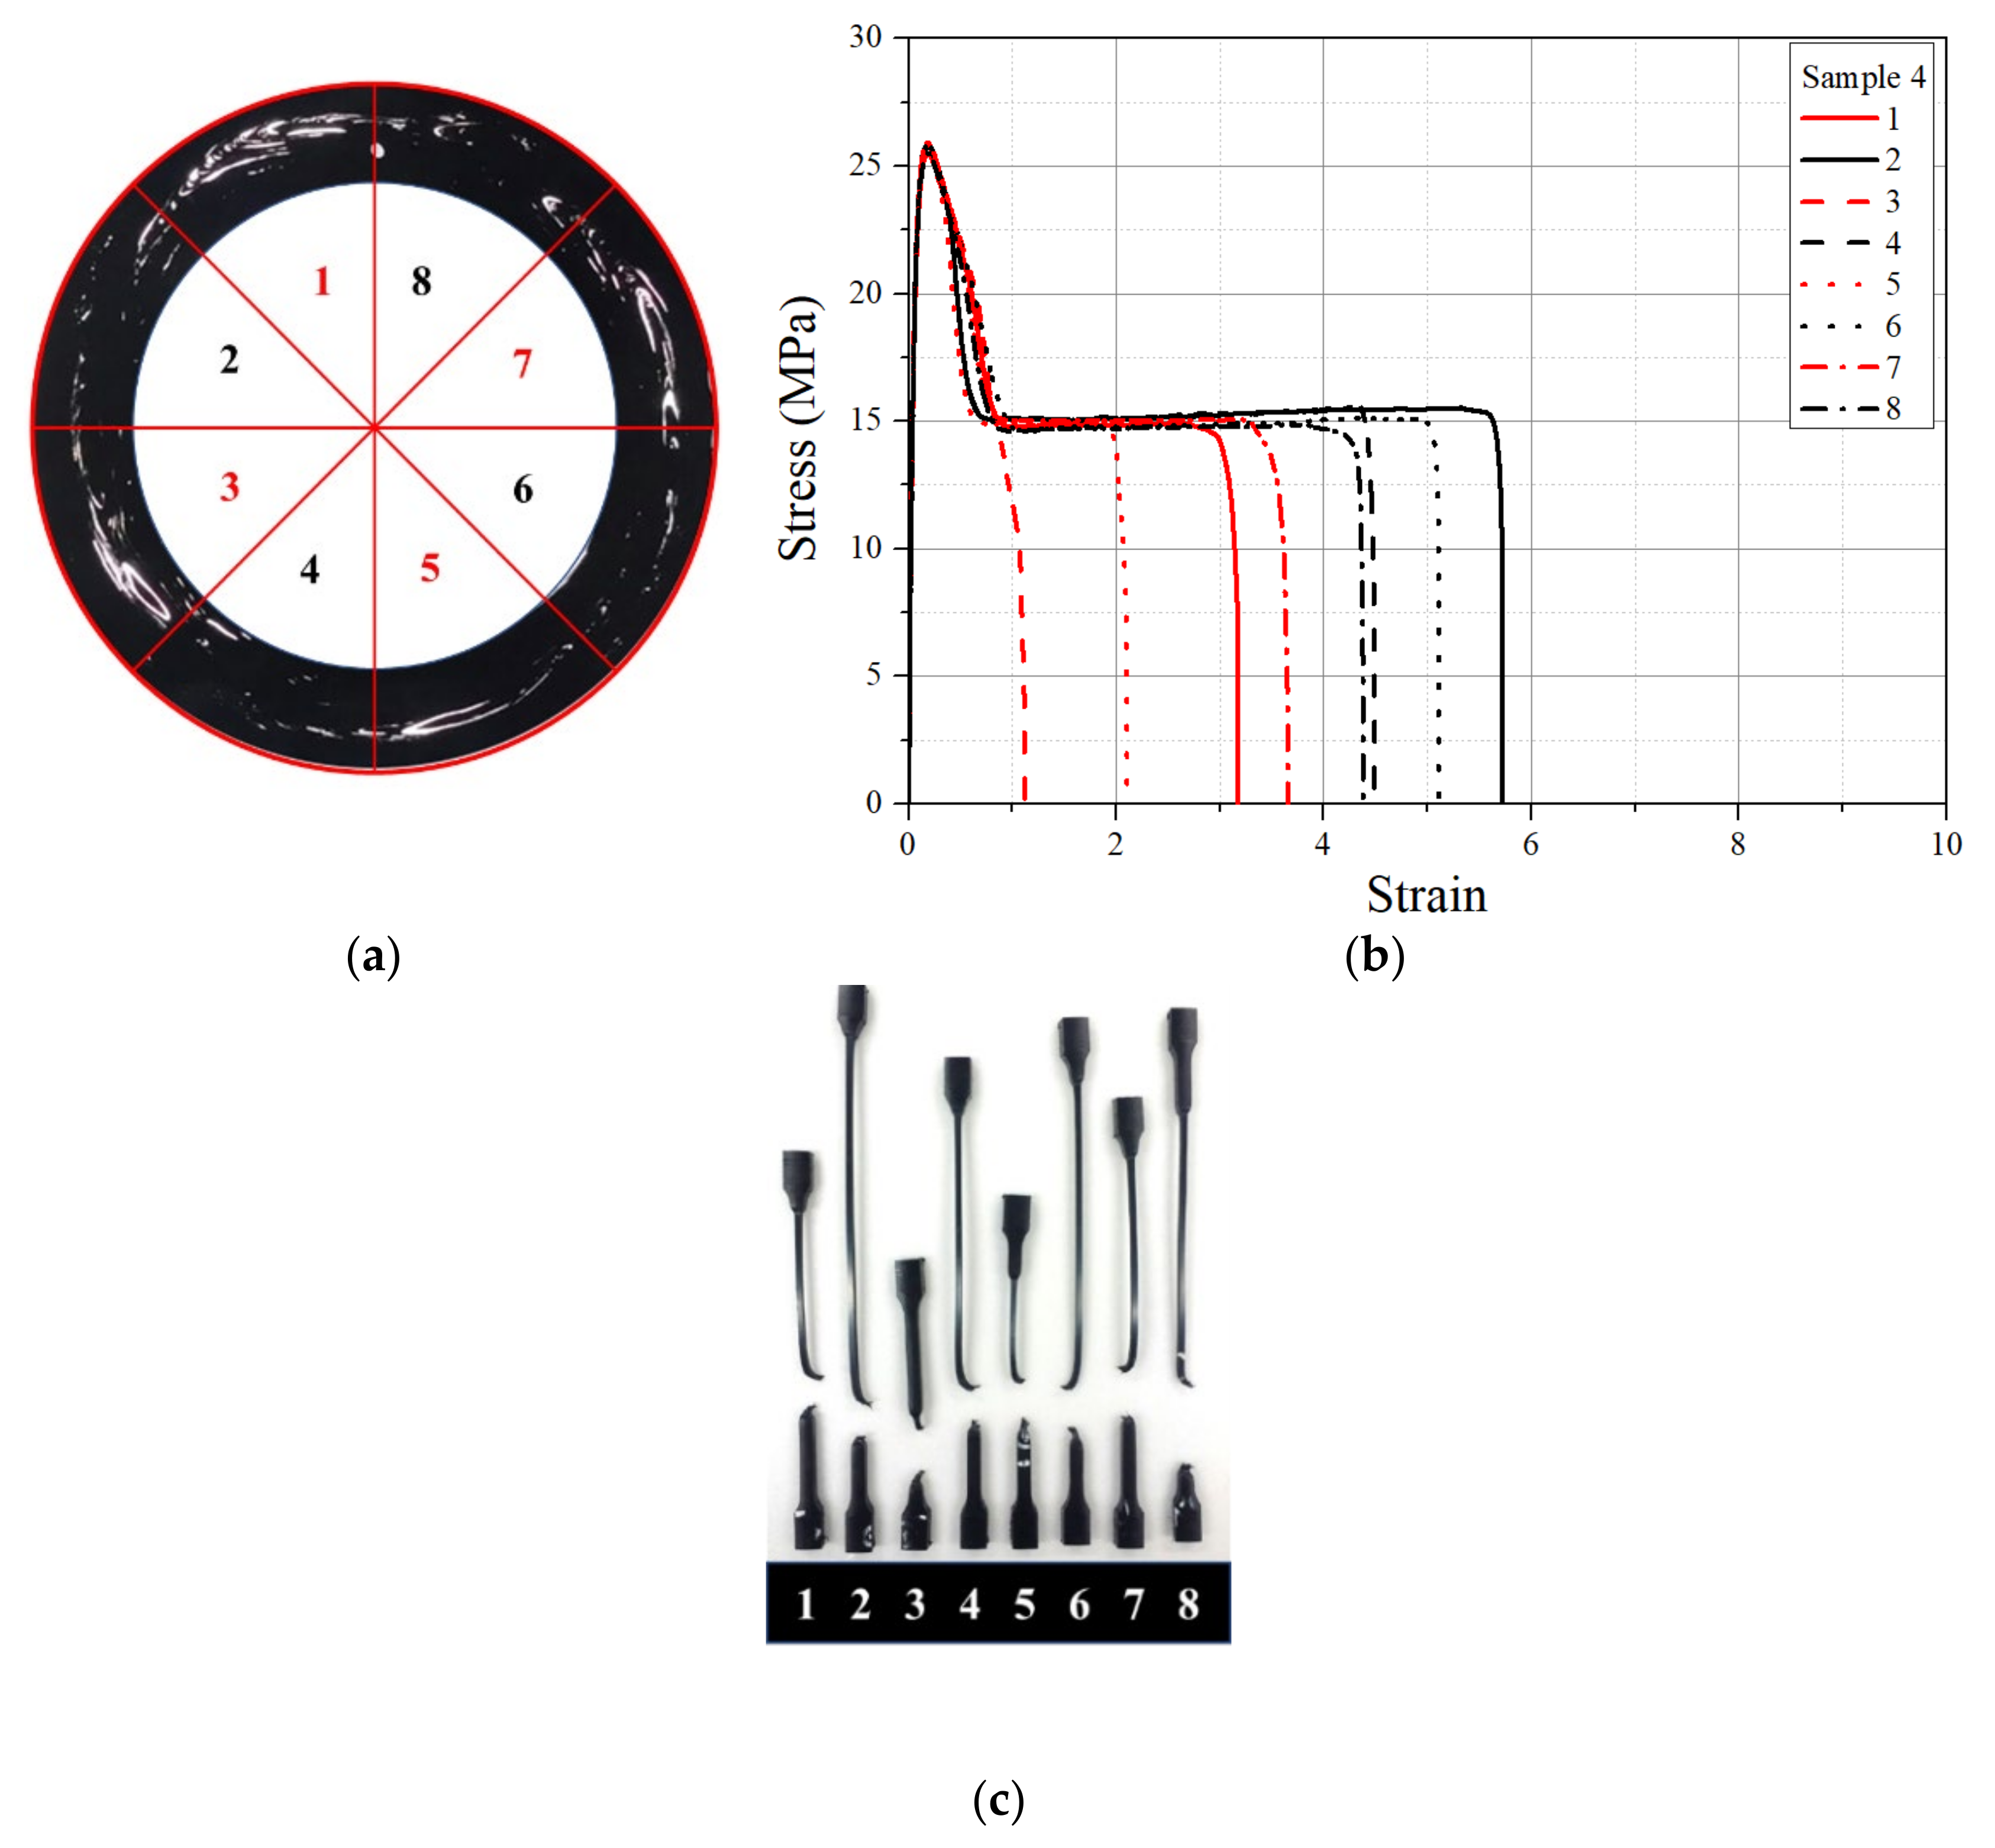
- Tensile test performed on specimens from pipes containing various % windows showed a limiting % windows value of 4.0% (cross-polarized monochromatic light), above which caused a rapid decrease in fracture strain as much as four times the window free specimen. A lower % windows value of 2.5% was determined using cross-polarized white light, thus indicating the % window determination is dependent on the lighting and shaving thickness employed.
- (5)
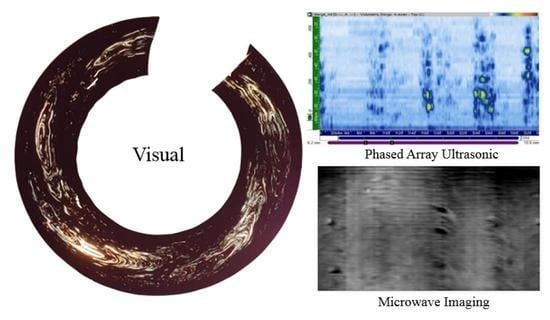
- Windows indications and similar patterns were also observed with the phased array ultrasonic (PAUT) and microwave imaging (MWI) non-destructive examination methods. They are both confirmed to be viable methods for detecting windows directly on pipes.
- (6)
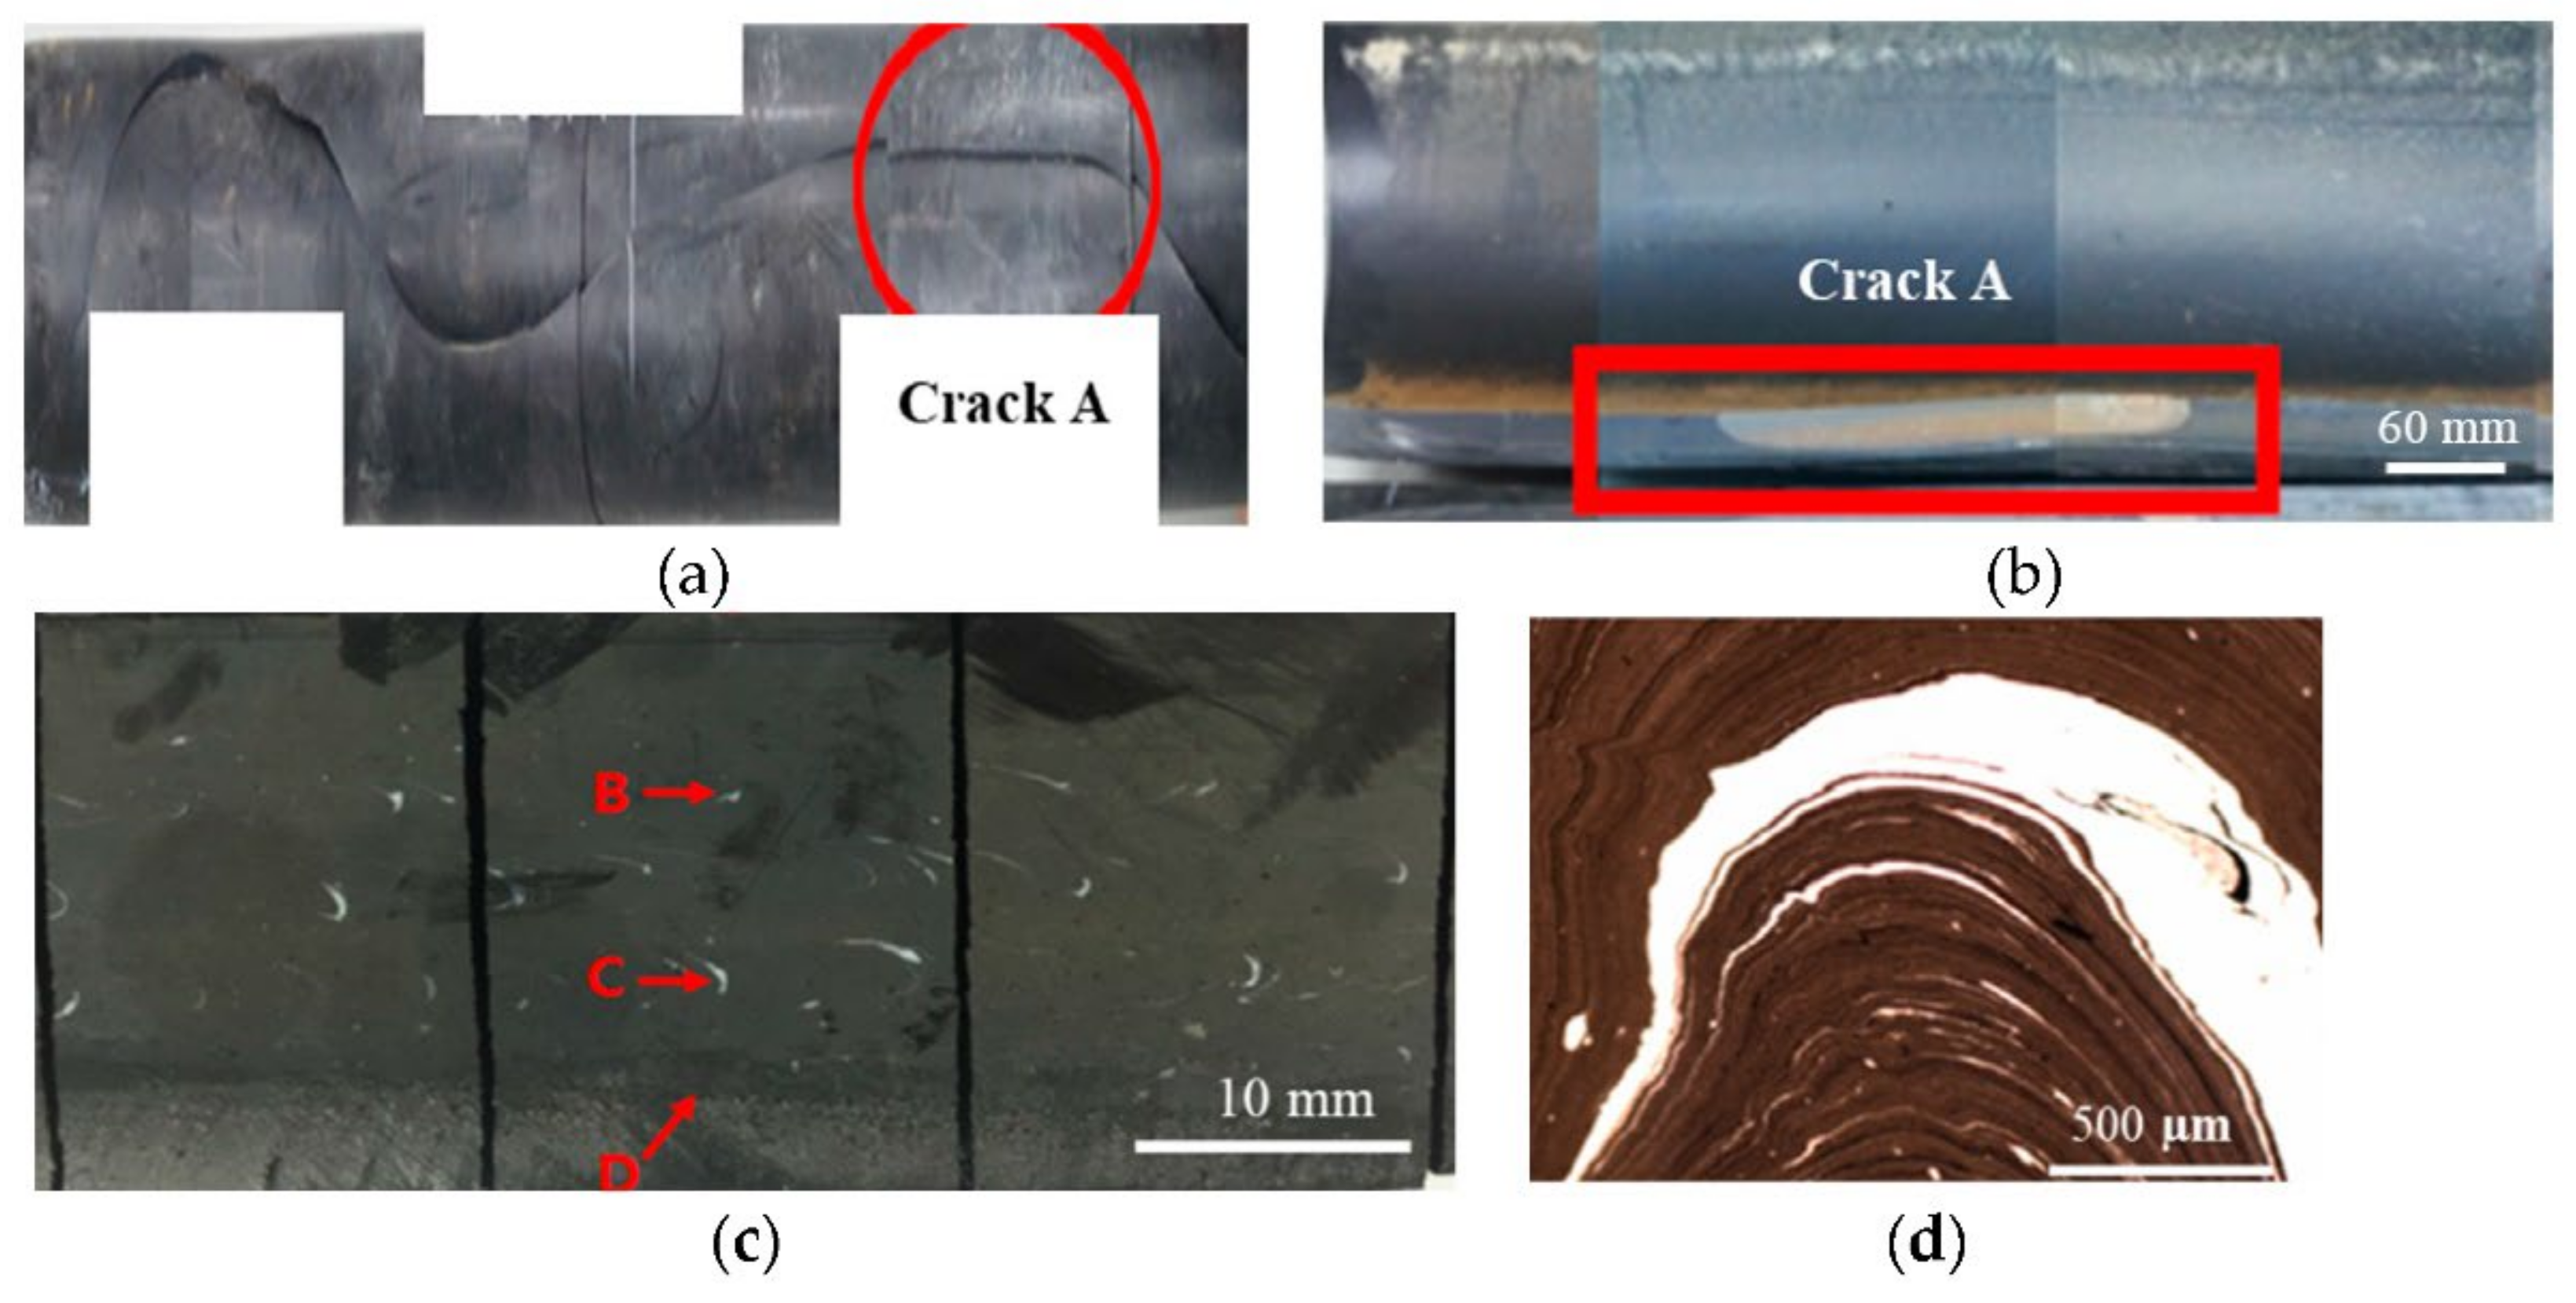
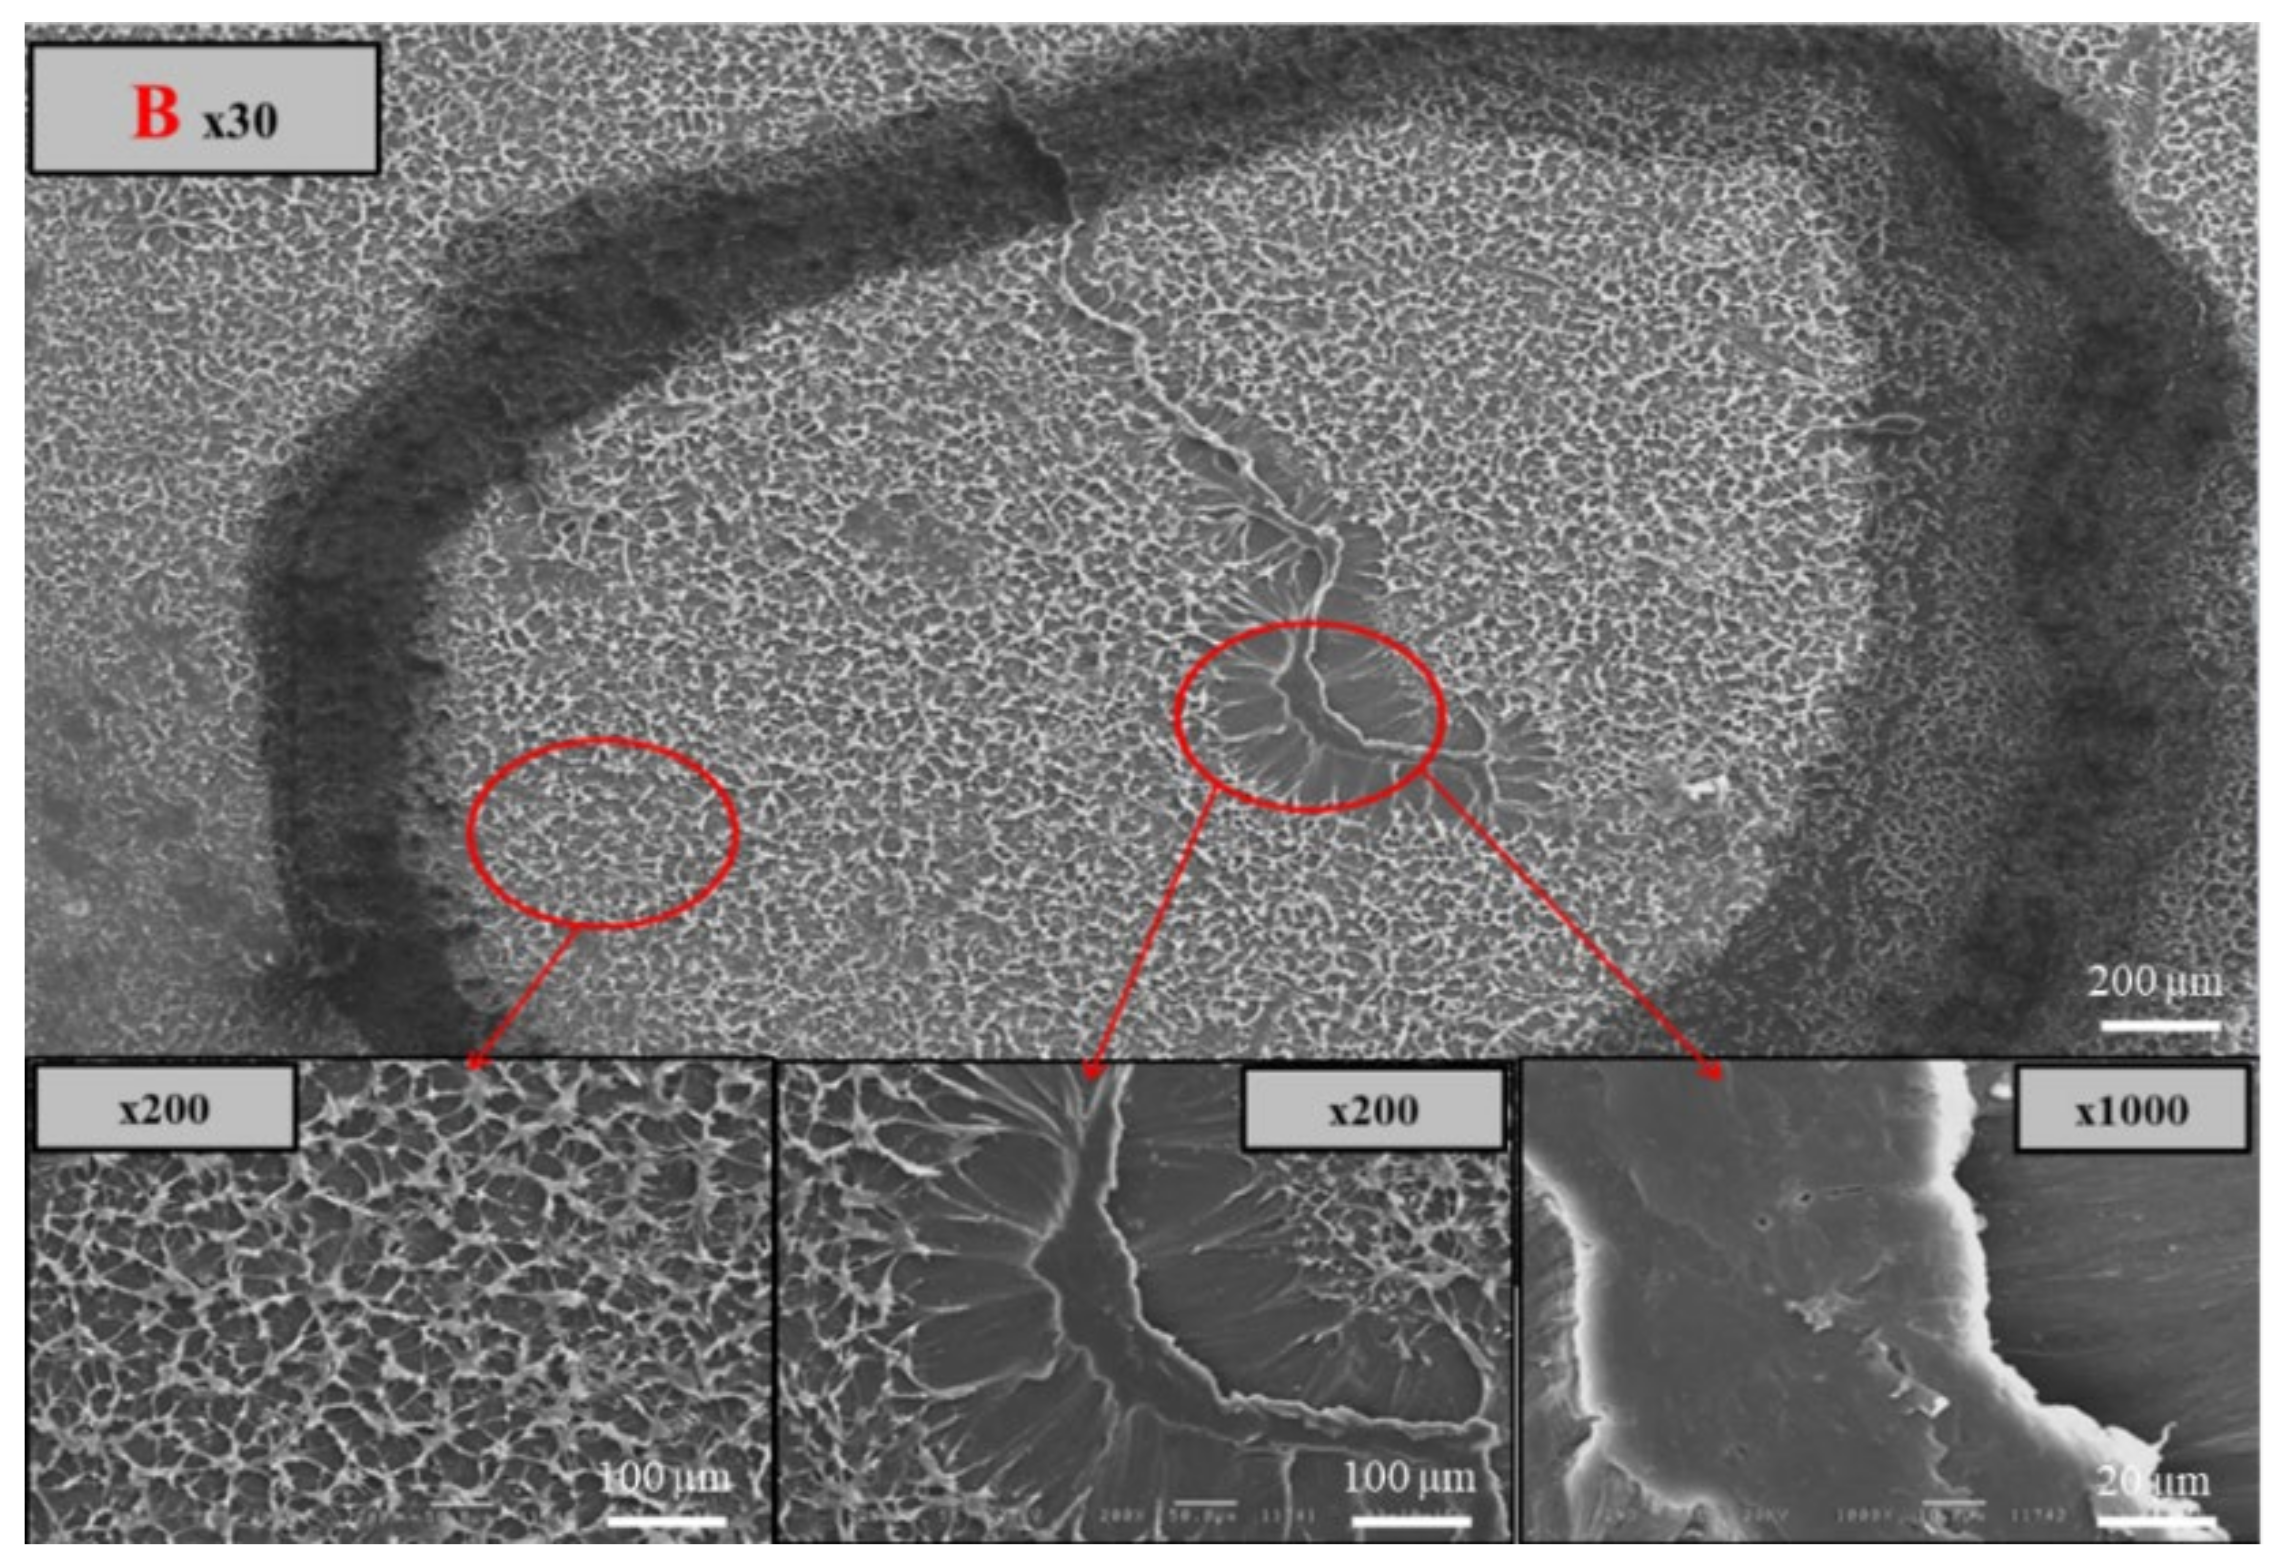
- The fracture surface morphology of the tensile specimens showed that the micro-ductility fibrils were characteristic of the windows’ fracture, while the black compound exhibited a yielding failure, confirming that windows are a degrading factor in the structural integrity of the PE pipe.
- (7)
- The micro-tensile test showed failure initiation at the windows–black PE compound boundary at the post-necking strain. However, since the micro-indentation modulus increased only about 7% in the black compound compared to the windows, a definite conclusion cannot be drawn regarding the cause for the boundary area fracture initiation.
Author Contributions
Funding
Institutional Review Board Statement
Informed Consent Statement
Data Availability Statement
Conflicts of Interest
References
- Hammadi, A.A.; Schuessler, S.R.; Jaber, M.A.A. High-density polyethylene (HDPE): An overview of the first ever ASME BPVC Section iii, class 3 nuclear piping installation. In Proceedings of the 19th Plastic Pipes Conference PPXIX, Las Vegas, VA, USA, 24–26 September 2018. [Google Scholar]
- Summe, A.; Munson, D. Material Properties Affecting the Butt Fusion of HDPE Pipe; Report No: 3002003133; Electric Power Research Institute: Palo Alto, CA, USA, 2014. [Google Scholar]
- Howard, J.B.; Gilroy, H.M. Natural and artificial weathering of polyethylene plastics. Polym. Eng. Sci. 1969, 9, 286–294. [Google Scholar] [CrossRef]
- Jakab, E.; Omastová, M. Thermal decomposition of polyolefin/carbon black composites. J. Anal. Appl. Pyrolysis. 2005, 74, 204–214. [Google Scholar] [CrossRef]
- Peña, J.M.; Allen, N.S.; Edge, M.; Liauw, C.; Valange, B. Studies of synergism between carbon black and stabilisers in LDPE photodegradation. Polym. Degrad. Stab. 2001, 72, 259–270. [Google Scholar] [CrossRef]
- Sahu, A.K.; Sudhakar, K.; Sarviya, R.M. Influence of U.V light on the thermal properties of HDPE/Carbon black composites. Case Stud. Therm. Eng. 2019, 15, 100534. [Google Scholar] [CrossRef]
- Chodak, I.; Krupa, I. “Percolation effect” and mechanical behavior of carbon black filled polyethylene. J. Mater. Sci. Lett. 1999, 18, 1457–1459. [Google Scholar] [CrossRef]
- ISO 4427-1:2019; Plastics Piping Systems for Water Supply and for Drainage and Sewerage under Pressure-Polyethylene (PE)–Part 1: General. ISO: Geneva, Switzerland, 2019.
- Rwei, S.-P.; Manas-Zloczower, I.; Feke, D.L. Analysis of dispersion of carbon black in polymeric melts and its effect on compound properties. Polym. Eng. Sci. 1992, 32, 130–135. [Google Scholar] [CrossRef]
- Pircheraghi, G.; Sarafpour, A.; Rashedi, R.; Afzali, K.; Adibfar, M. Correlation between rheological and mechanical properties of black PE100 compounds-Effect of carbon black masterbatch. Express Polym. Lett. 2017, 11, 622–634. [Google Scholar] [CrossRef]
- Kovács, E.; Wolkober, Z. The effect of the chemical and physical properties of carbon black on the thermal and photooxidation of polyethylene. J. Polym. Sci. Polym. Symp. 1976, 57, 171–180. [Google Scholar] [CrossRef]
- Wang, M.-J.; Gray, C.A.; Reznek, S.R.; Mahmud, K.; Kutsovsky, Y. Carbon Black. 2003, pp. 52–91. Available online: https://onlinelibrary.wiley.com (accessed on 27 January 2022).
- Liu, M.; Horrocks, A.R. Effect of Carbon Black on UV stability of LLDPE films under artificial weathering conditions. Polym. Degrad. Stab. 2002, 75, 485–499. [Google Scholar] [CrossRef]
- Phease, T.L.; Billingham, N.C.; Bigger, S.W. The effect of carbon black on the oxidative induction time of medium-density polyethylene. Polym. Degrad. Stab. 2000, 41, 9123–9130. [Google Scholar] [CrossRef]
- Allen, N.S.; Peña, J.M.; Edge, M.; Liauw, C.M. Behaviour of carbon black pigments as excited state quenchers in LDPE. Polym. Degrad. Stab. 2000, 67, 563–566. [Google Scholar] [CrossRef]
- Williams, F.R.; Jordan, M.E.; Dannenberg, E.M. Effect of the chemical and physical properties of carbon black on its performance in polyethylene. J. Appl. Polym. Sci. 1965, 9, 861–886. [Google Scholar] [CrossRef]
- Liang, J.Z.; Yang, Q.Q. Mechanical properties of carbon black-filled high-density polyethylene antistatic composites. J. Reinf. Plast. Compos. 2009, 28, 295–304. [Google Scholar] [CrossRef]
- Fouad, H.; Elleithy, R.; Al-Zahrani, S.M.; Ali, M.A.-H. Characterization and processing of High Density Polyethylene/carbon nano-composites. Mater. Des. 2011, 32, 1974–1980. [Google Scholar] [CrossRef]
- Accorsi, J.V. The impact of carbon black morphology and dispersion on the weatherability of polyethylene. In Proceedings of the International Wire & Cable Symposium, Atlantic City, NJ, USA, 15–18 November 1999. [Google Scholar]
- Rohatgi, V.; Meager, P.; Sukhadia, A. Comparison of in-line compounding vs. Pre-compounded resin on polyethylene pipe performance. In Proceedings of the Plastic Pipes XVIII, Berlin, Germany, 12–14 September 2016. [Google Scholar]
- Ahn, J.S.; Choi, S.W. Failure Analysis of Underground Fire Main HDPE Pipe; Report to Korea Hydro & Nuclear Power; Korea Hydro & Nuclear Power: Daejeon, Korea, 2015. [Google Scholar]
- Choi, S.W. Windows on the Performance of Butt Fusions and Pipes; ASME Code Week HDPE, Stakeholders: Anchorage, AK, USA, 2017. [Google Scholar]
- Deveci, S.; Antony, N.; Eryigit, B. Effect of carbon black distribution on the properties of polyethylene pipes-Part 1: Degradation of post yield mechanical properties and fracture surface analyses. Polym. Degrad. Stab. 2018, 148, 75–85. [Google Scholar] [CrossRef]
- Keller, D. Comparison of readymade and in-line compounded HDPE pipe to ISO 4427. In Proceedings of the Plastic Pipes XVIII, Berlin, Germany, 12–14 September 2016. [Google Scholar]
- Patterson, S. Pipe shavings procedure. In Proceedings of the ISO/TC138/SC4/WG10 Meeting, Berlin, Germany, 15 September 2016. [Google Scholar]
- Velasquez, A.; Chang, D.; Athreya, S. Effect of carbon black, compounding and pipe extrusion on the slow crack growth PENT test result. In Proceedings of the Plastic Pipes XIX, Las Vegas, VA, USA, 24–26 September 2018. [Google Scholar]
- Rohatgi, V.; Weddige, R.; Maeger, P.L.; Sukhadia, A.M.; Koganti, N. Investigation of grooved feed screw designs for polyethylene pipe extrusion. In Proceedings of the SPE ANTEC, Orlando, FL, USA, 23–25 March 2015. [Google Scholar]
- Keller, D. Comparative testing of Pre-pigmented and natural compound plus black coloring masterbatch HDPE pipes for potable water applications. In Proceedings of the SPE ANTEC, Indianapolis, IN, USA, 23–25 May 2016. [Google Scholar]
- Munson, D. Pennsylvania Edge Notched Tensile Resistance of High-Density Polyethylene Butt Fusion Joints; Report No: 3002003089; Electric Power Research Institute: Palo Alto, CA, USA, 2016. [Google Scholar]
- Choi, S.W. Further on windows. In Proceedings of the ISO/TC138/SC4/WG10_N2084 Meeting, Solothurn, Switzerland, 9–13 October 2017. [Google Scholar]
- Deveci, S.; Antony, N.; Nugroho, S.; Eryigit, B. Effect of carbon black distribution on the properties of polyethylene pipes part 2: Degradation of butt fusion joint integrity. Polym. Degrad. Stab. 2019, 162, 138–147. [Google Scholar] [CrossRef]
- Wee, J.-W.; Kim, I.; Choi, M.-S.; Park, S.-K.; Choi, B.-H. Characterization and modeling of slow crack growth behaviors of defective high-density polyethylene pipes using stiff-constant K specimen. Polym. Test. 2020, 86, 106499. [Google Scholar] [CrossRef]
- Song, J.W. The Study of “Windows” in HDPE Pipes. Master’s Thesis, Hannam University, Daejeon, Korea, 2019. [Google Scholar]
- Choi, S.W. PAUT Microtome Yellow Pipe. In Proceedings of the ISO/TC138/SC4/WG10_N2085 Meeting, Solothurn, Switzerland, 9–13 October 2017. [Google Scholar]
- Yu, C.; Troughton, M.; Khamsehnezhad, A.; Zhang, X. Effect of insufficient homogenization during the extrusion of polyethylene pipes on butt fusion joint integrity. Weld. World. 2020, 64, 1703–1713. [Google Scholar] [CrossRef]
- ISO 527-2:2012; Plastics-Determination of Tensile Properties-Part 2: Test Conditions for Moulding and Extrusion Plastics. ISO: Geneva, Switzerland, 2012.
- ISO 13953:2001; Polyethylene (PE) Pipes and Fittings—Determination of the Tensile Strength and Failure Mode of Test Pieces from a Butt-Fused Joint. ISO: Geneva, Switzerland, 2001.
- ISO 18553:2002; Method for the Assessment of the Degree of Pigment or Carbon Black Dispersion in Polyolefin Pipes, Fittings, and Compounds. ISO: Geneva, Switzerland, 2002.
- ImageJ. Available online: https://imagej.nih.gov/ij/ (accessed on 1 December 2021).
- ISO 14577-2:2015; Metallic Materials–Instrumented Indentation Test for Hardness and Materials Parameters–Part 2: Verification and Calibration of Testing Machines. ISO: Geneva, Switzerland, 2015.
- ISO 14577-1:2015; Metallic Materials–Instrumented Indentation Test for Hardness and Materials Parameters–Part 1: Test Method. ISO: Geneva, Switzerland, 2015.


| Materials | Level of Window | Extrusion Throughput | CB Content | MFR5 | MFR21 | Density |
|---|---|---|---|---|---|---|
| kg/h | wt% | (g/10 min) | (g/10 min) | (g/cm3) | ||
| Pre-compound | 2.11 | 0.27 | 8.76 | 0.96 | ||
| NPC | NA | 0.27 | 8.77 | 0.95 | ||
| Sample 1 | Windows free | 115 | 2.11 | 0.25 | 8.07 | 0.9603 |
| Sample 2 | Low | 70 | 2.37 | 0.28 | 8.26 | 0.9609 |
| Sample 3 | Medium | 95 | 2.40 | 0.26 | 7.99 | 0.9606 |
| Sample 4 | High | 115 | 2.26 | 0.27 | 8.09 | 0.9607 |
Publisher’s Note: MDPI stays neutral with regard to jurisdictional claims in published maps and institutional affiliations. |
© 2022 by the authors. Licensee MDPI, Basel, Switzerland. This article is an open access article distributed under the terms and conditions of the Creative Commons Attribution (CC BY) license (https://creativecommons.org/licenses/by/4.0/).
Share and Cite
Kim, T.; Deveci, S.; Yang, I.; Stakenborghs, B.; Choi, S. Visual, Non-Destructive, and Destructive Investigations of Polyethylene Pipes with Inhomogeneous Carbon Black Distribution for Assessing Degradation of Structural Integrity. Polymers 2022, 14, 1067. https://doi.org/10.3390/polym14051067
Kim T, Deveci S, Yang I, Stakenborghs B, Choi S. Visual, Non-Destructive, and Destructive Investigations of Polyethylene Pipes with Inhomogeneous Carbon Black Distribution for Assessing Degradation of Structural Integrity. Polymers. 2022; 14(5):1067. https://doi.org/10.3390/polym14051067
Chicago/Turabian StyleKim, Taesik, Suleyman Deveci, Inmo Yang, Bob Stakenborghs, and Sunwoong Choi. 2022. "Visual, Non-Destructive, and Destructive Investigations of Polyethylene Pipes with Inhomogeneous Carbon Black Distribution for Assessing Degradation of Structural Integrity" Polymers 14, no. 5: 1067. https://doi.org/10.3390/polym14051067