
Stiffness Enhancement, Anti-Aging, and Self-Forming Holes in Polycarbonate/Acrylonitrile-Styrene-Acrylic by the Core-Shell Structure of Acrylic Resin


Abstract
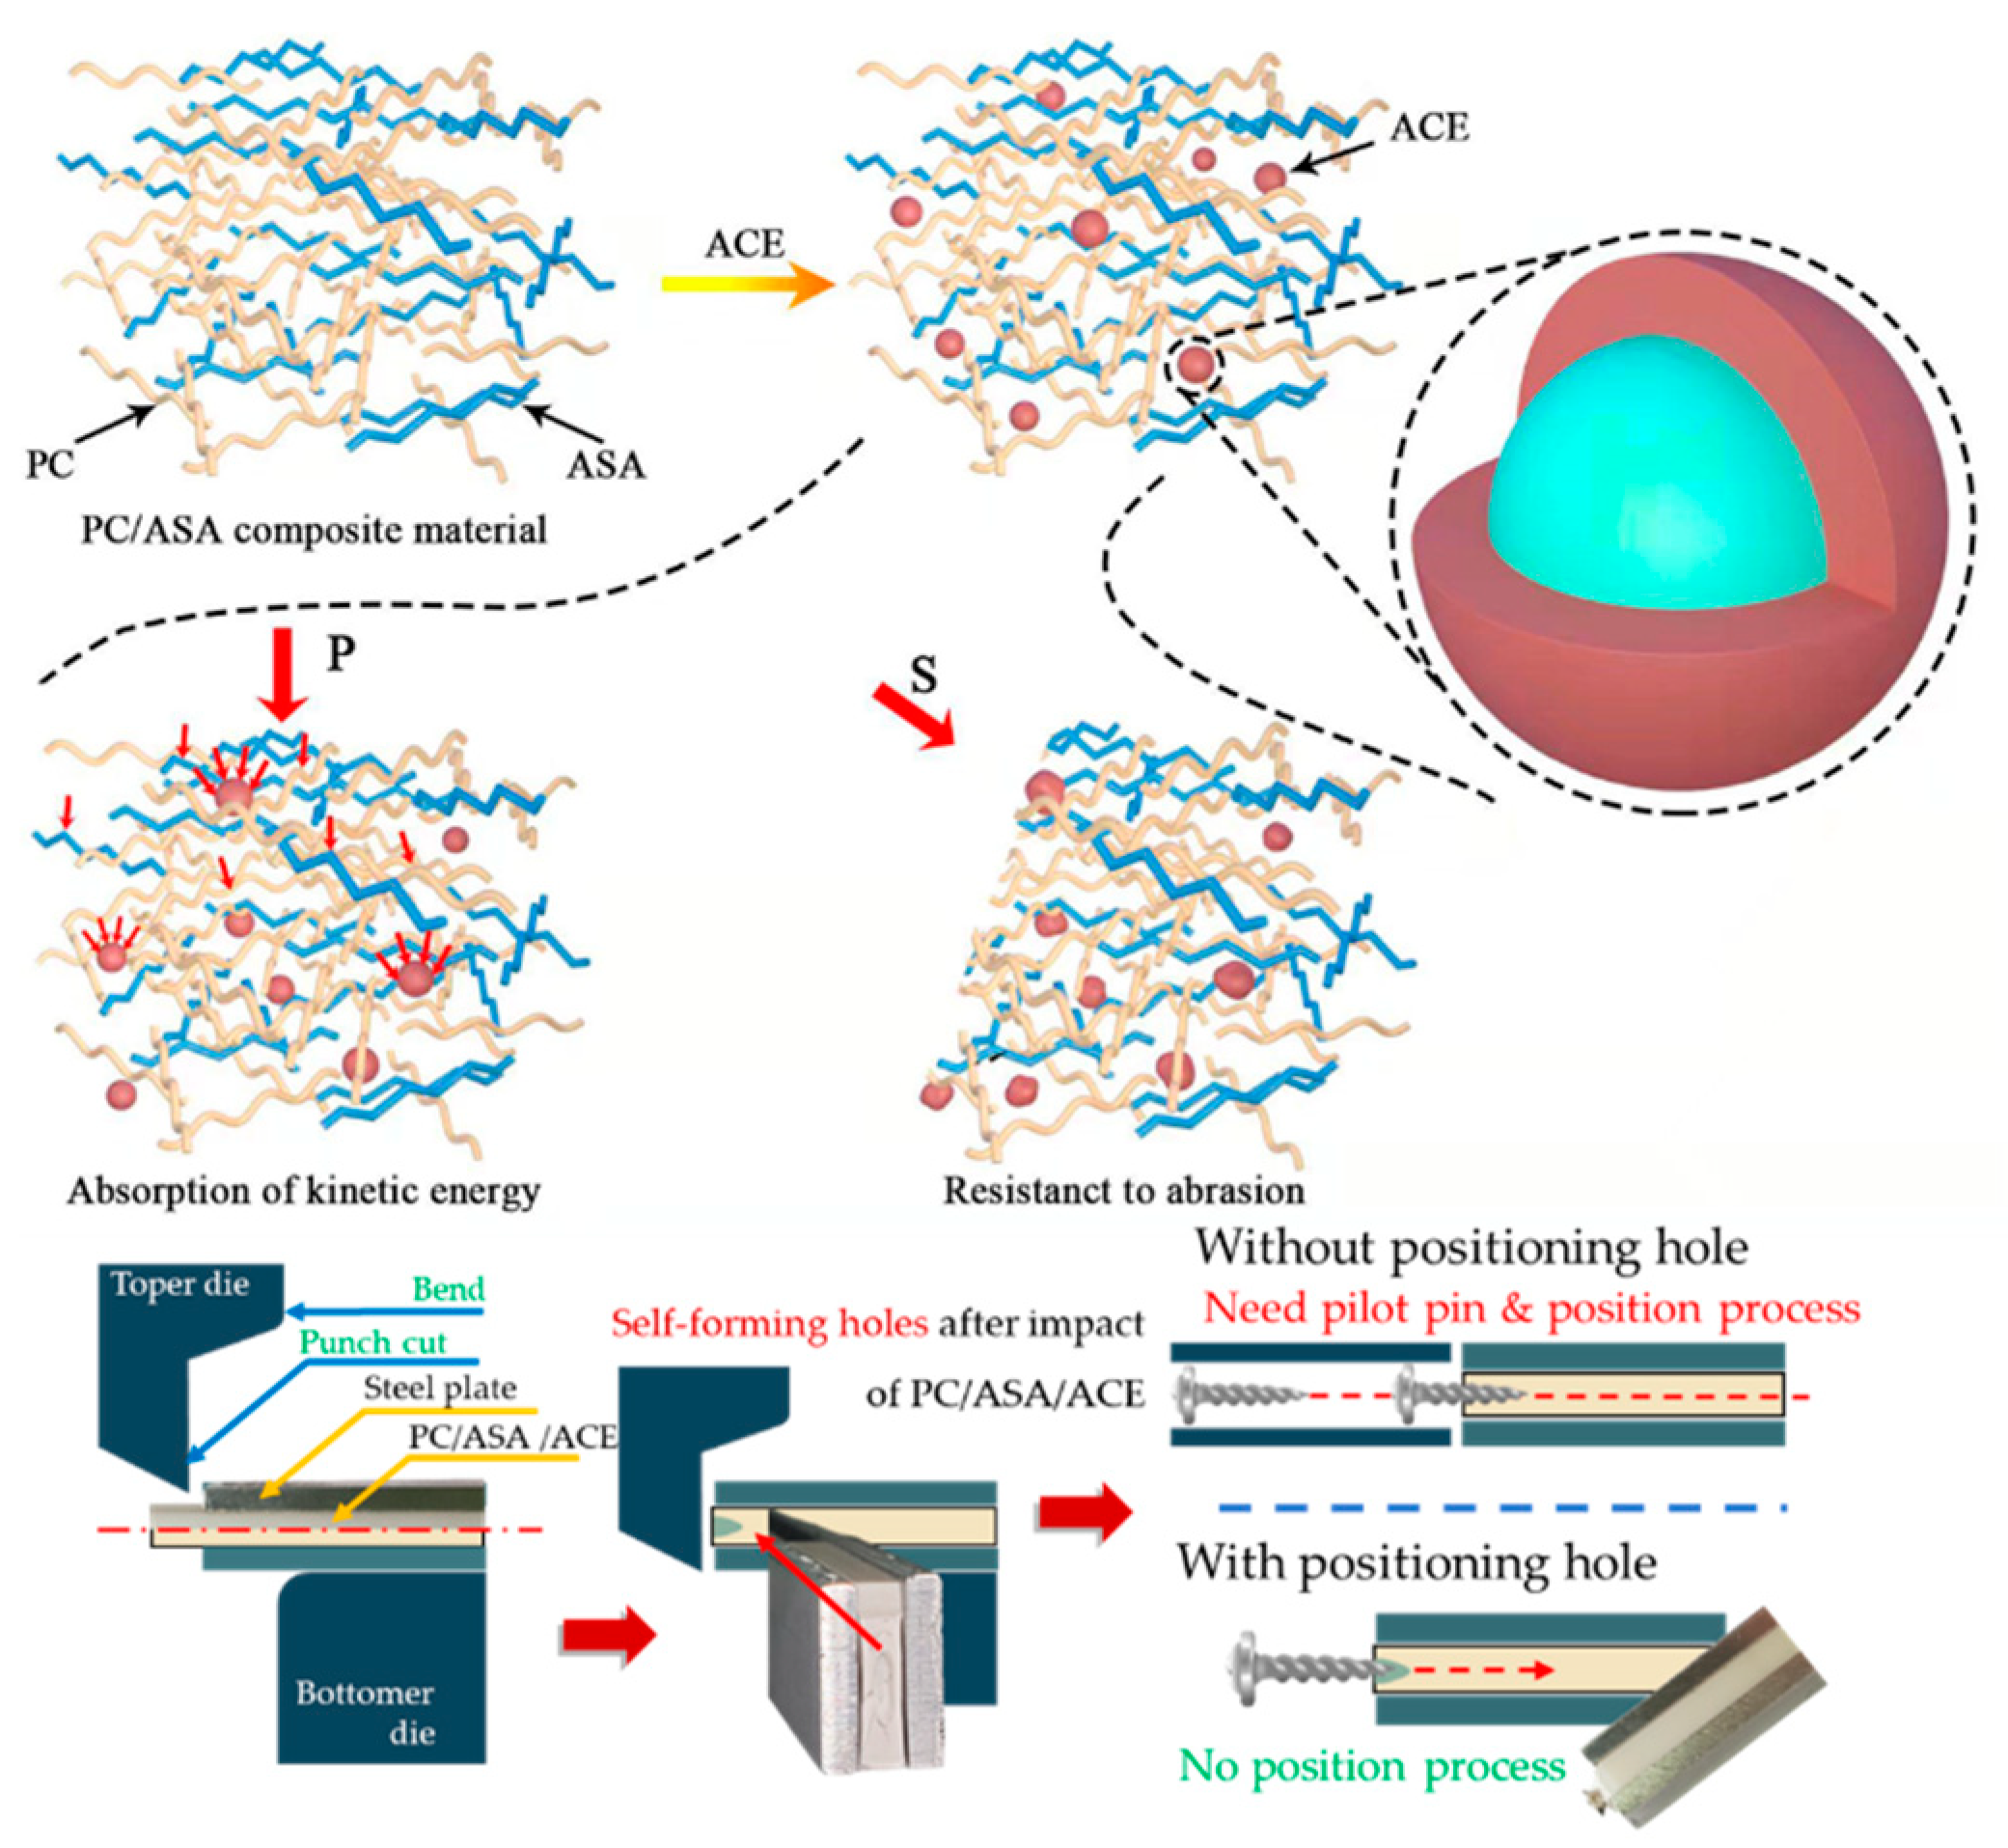
:1. Introduction
2. Materials and Methods
2.1. Materials
2.2. Sample Preparation
2.3. Material Measurement
3. Results
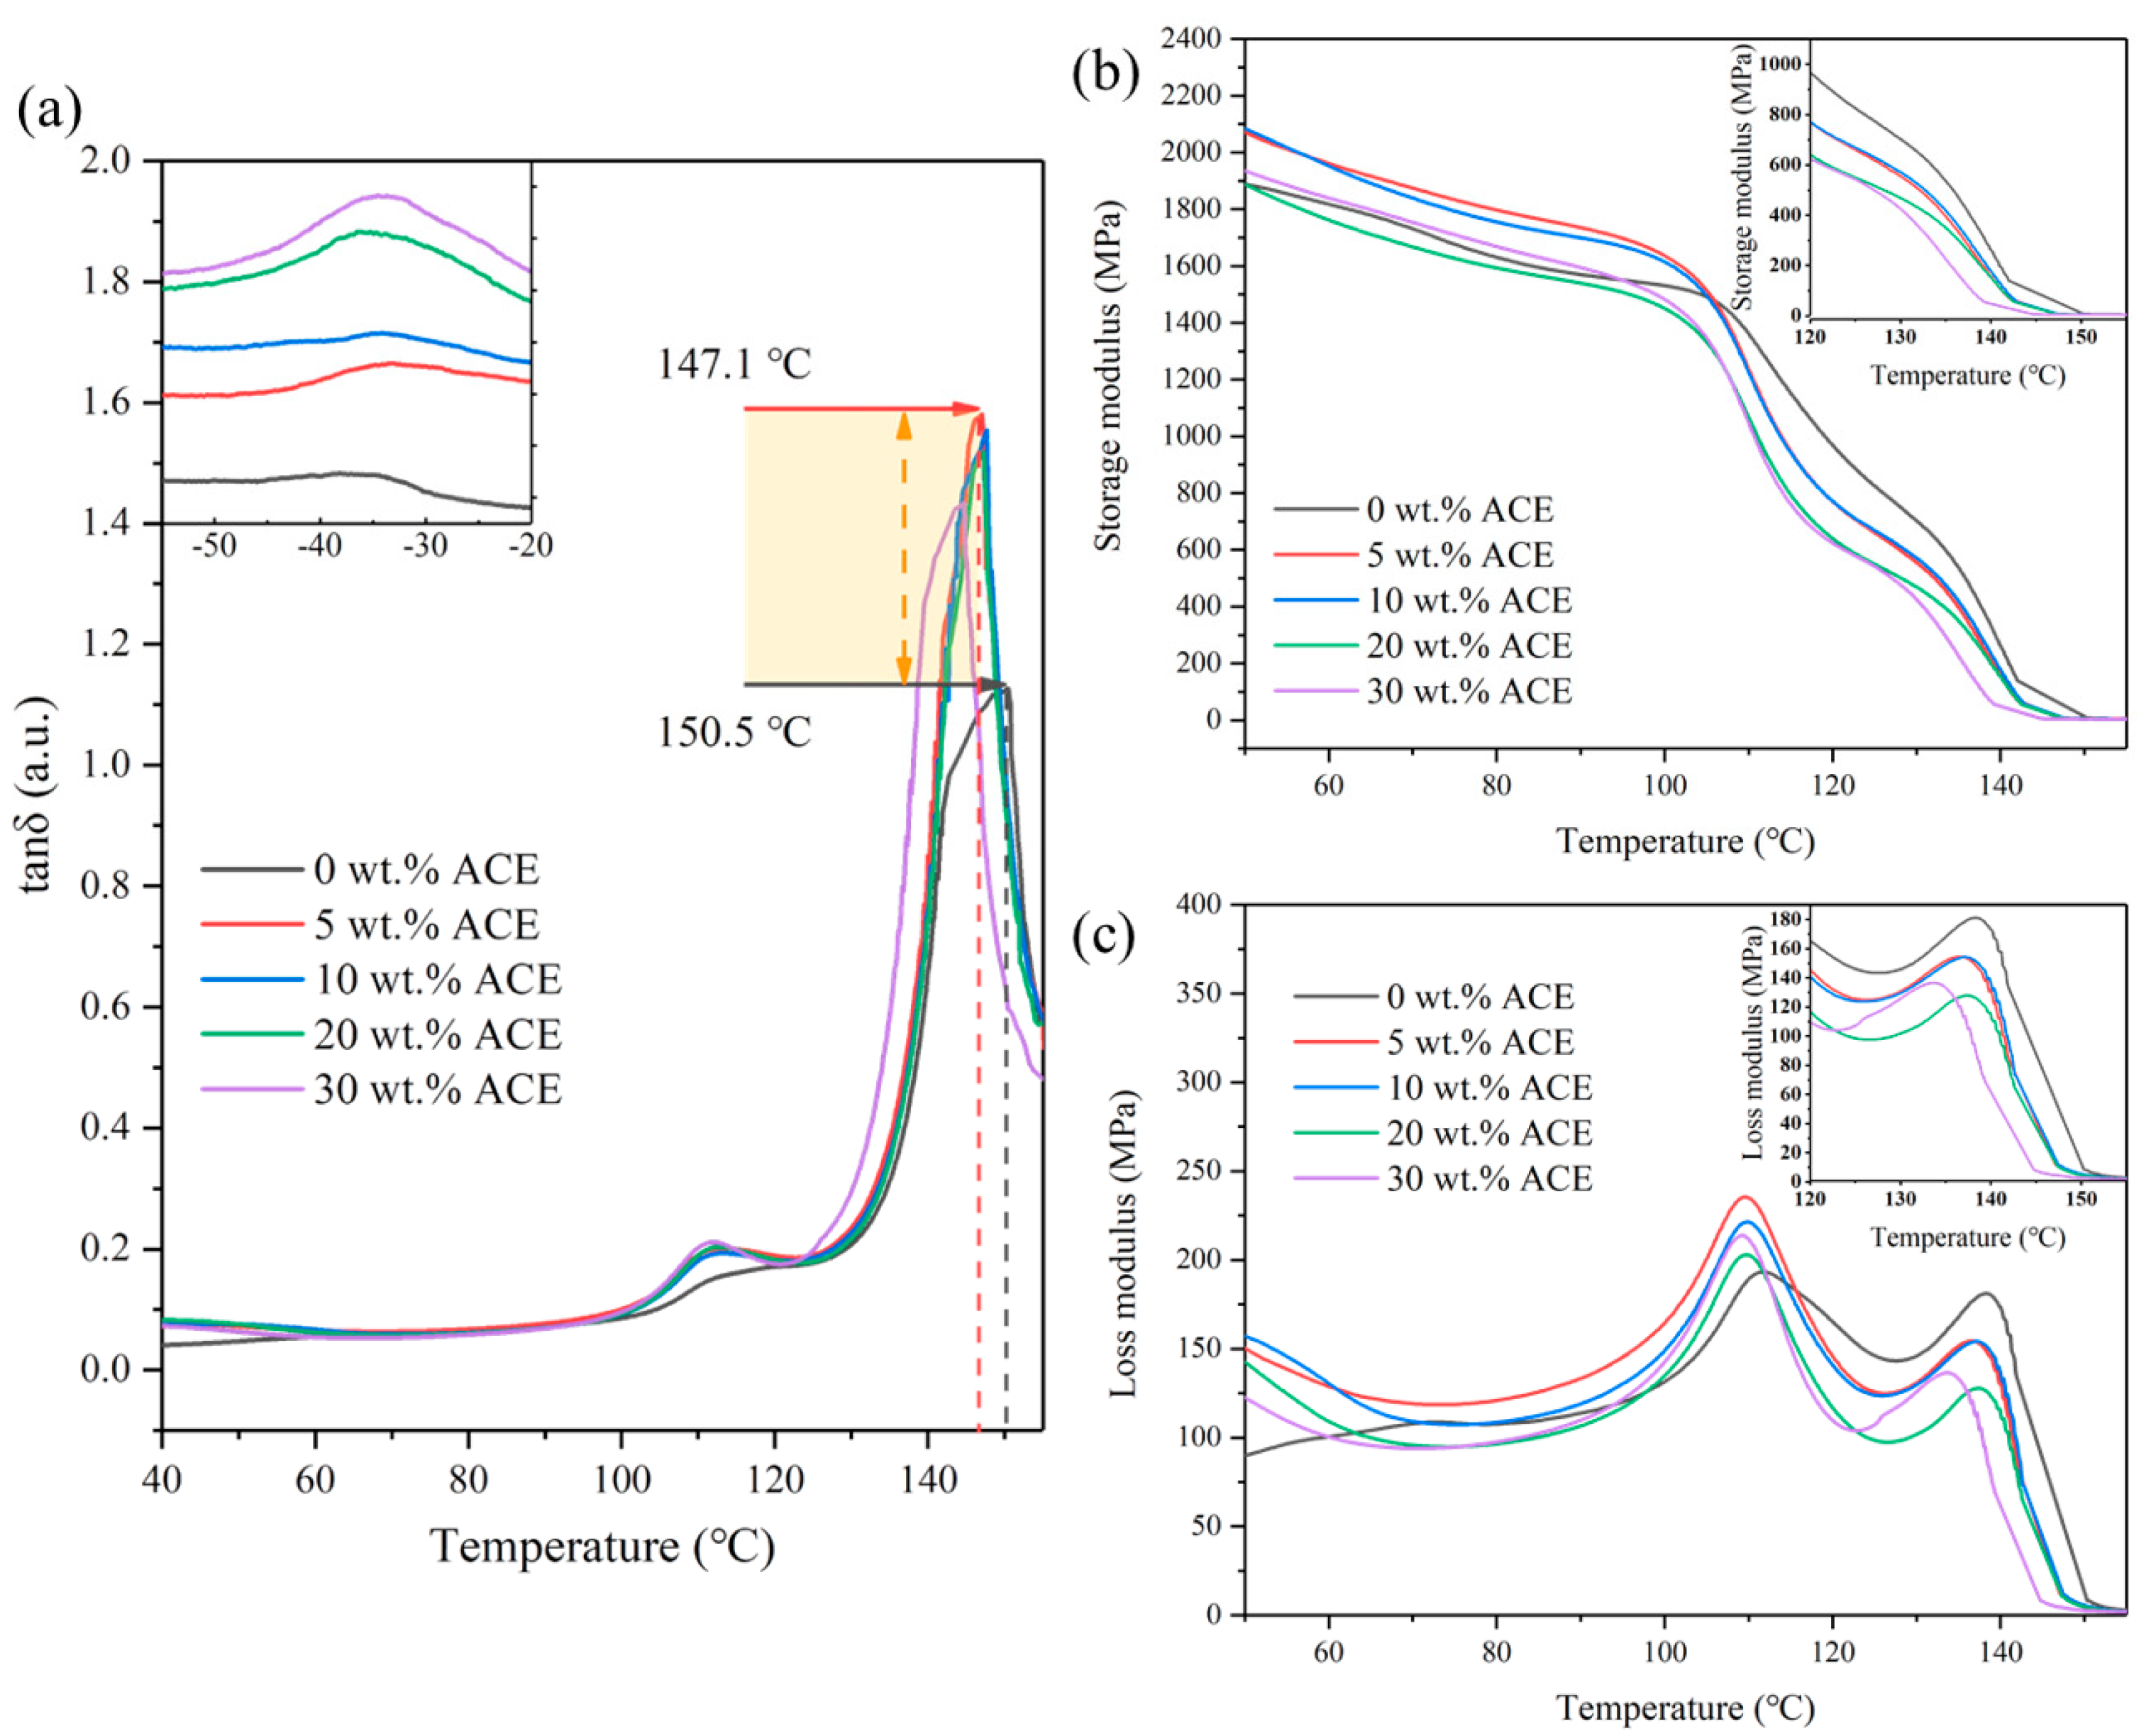
3.1. Material Compatibility
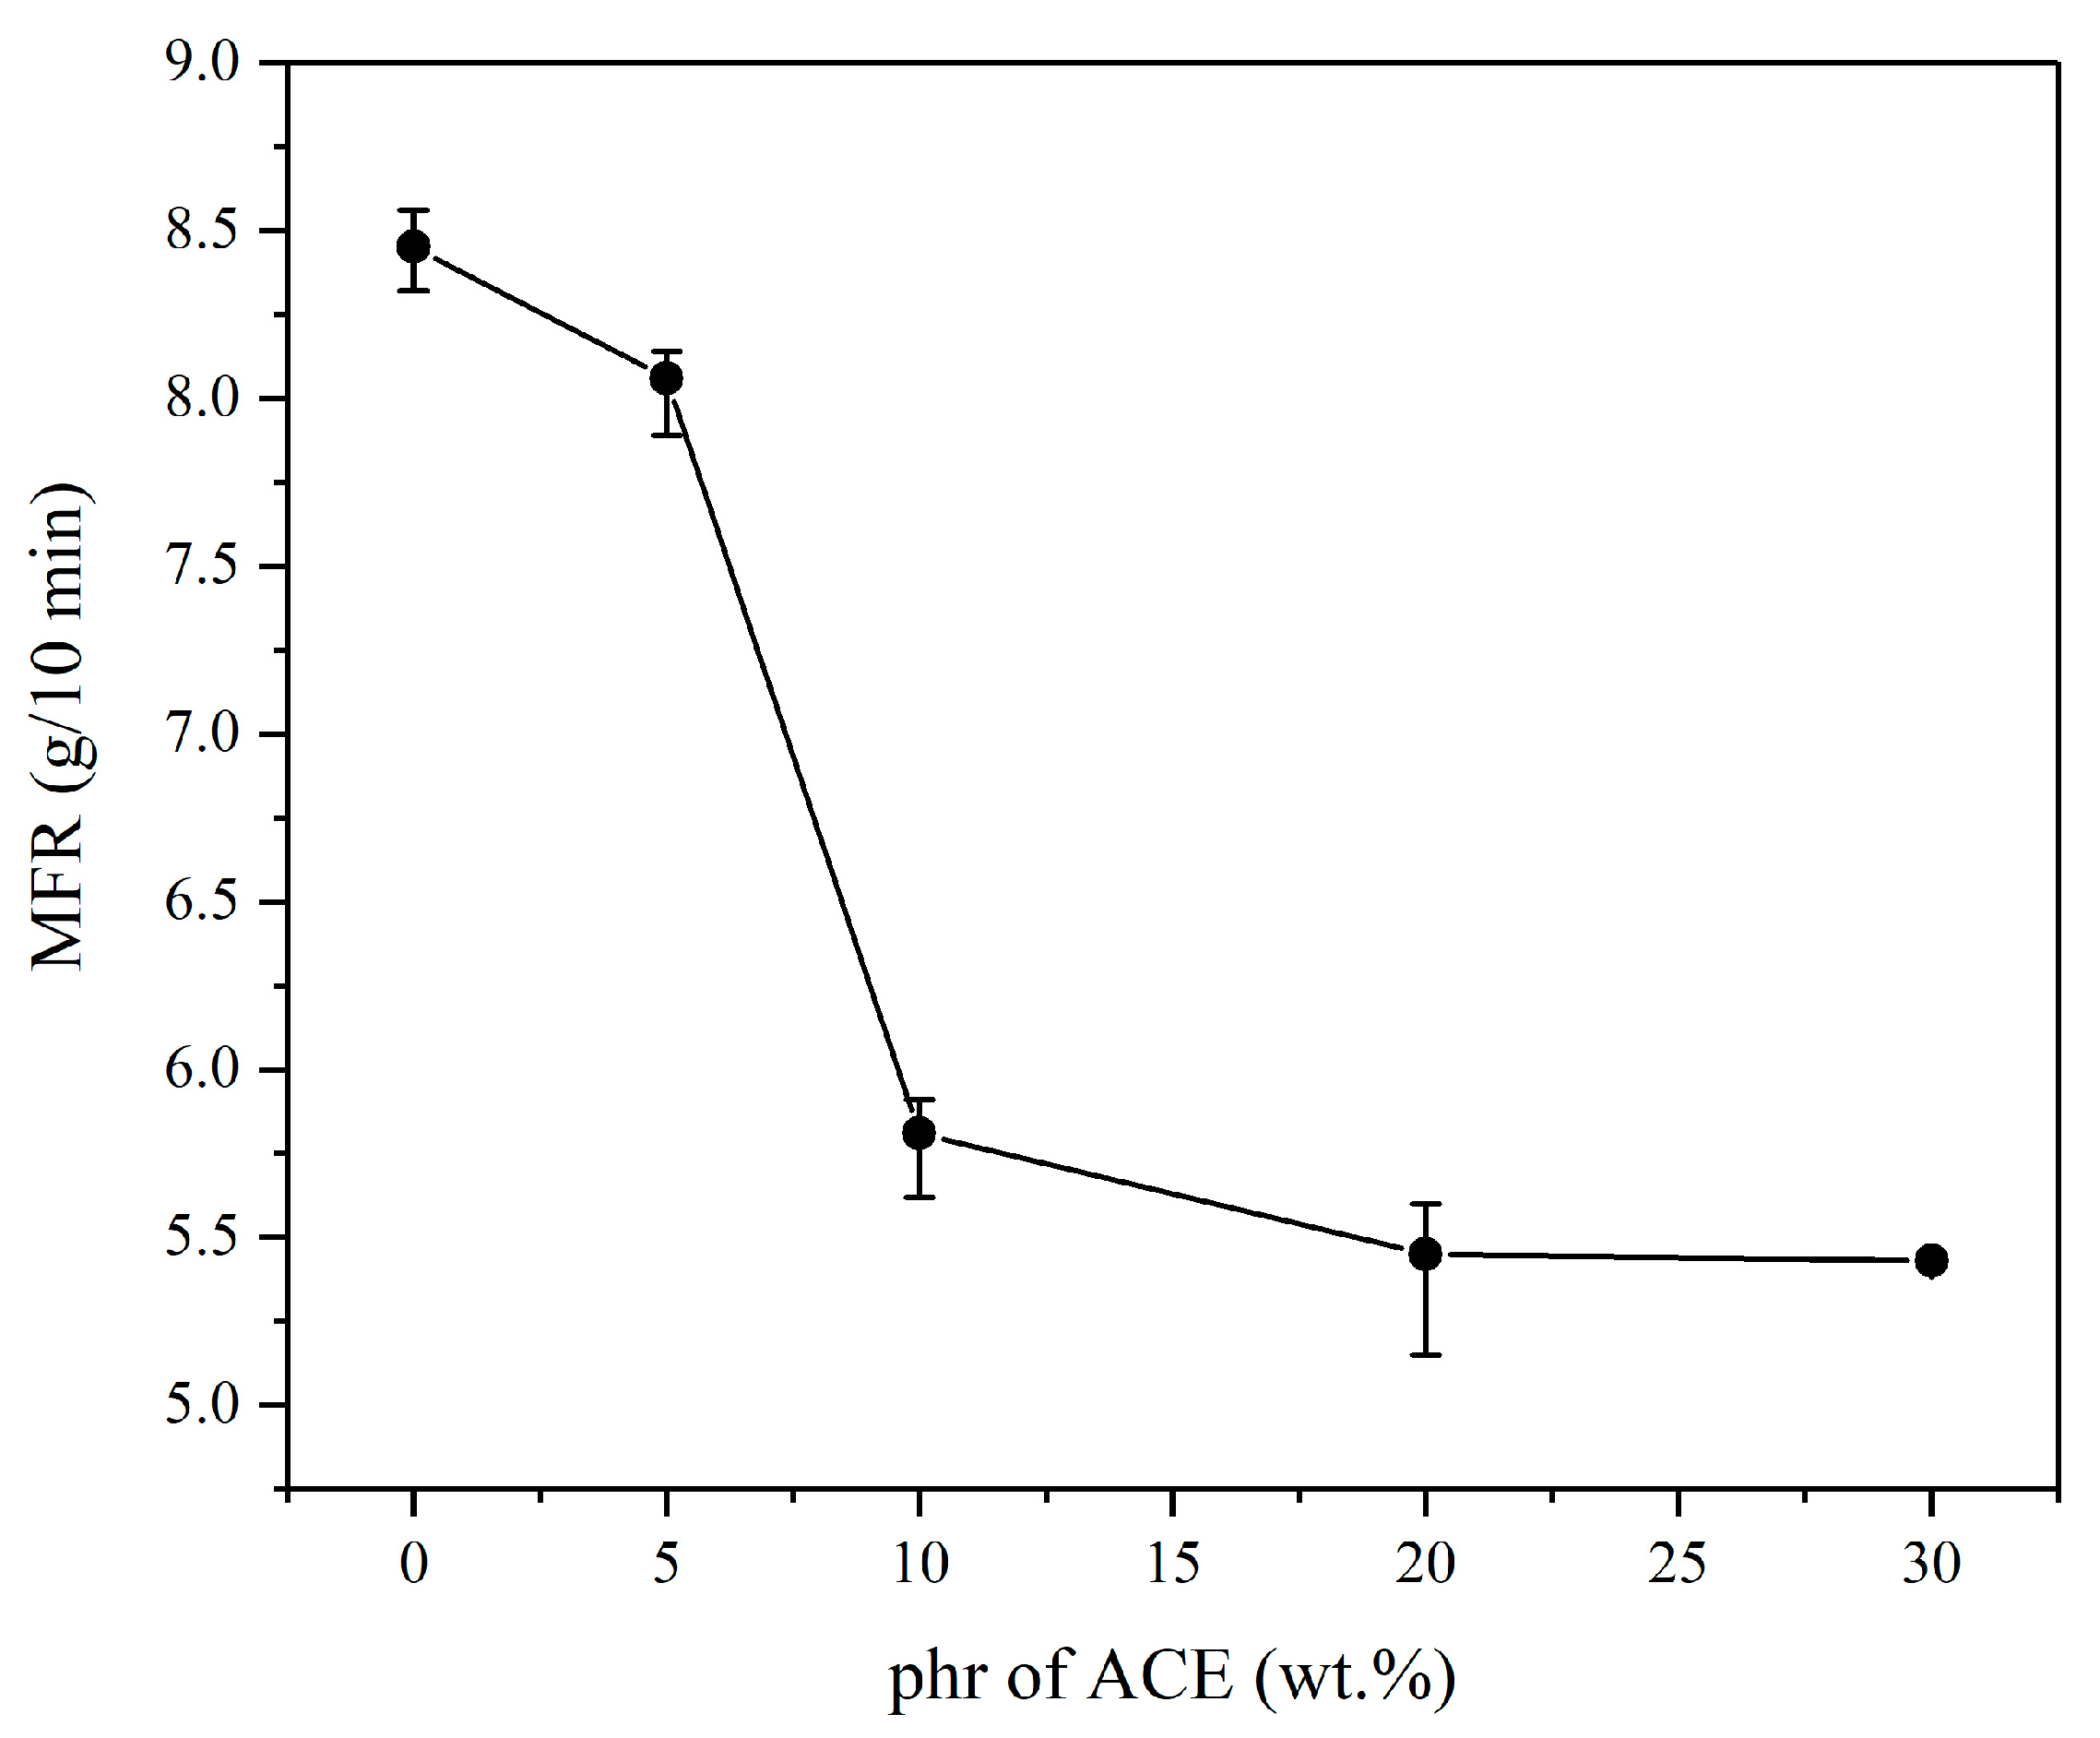
3.2. Change of the Melt Flow Rate
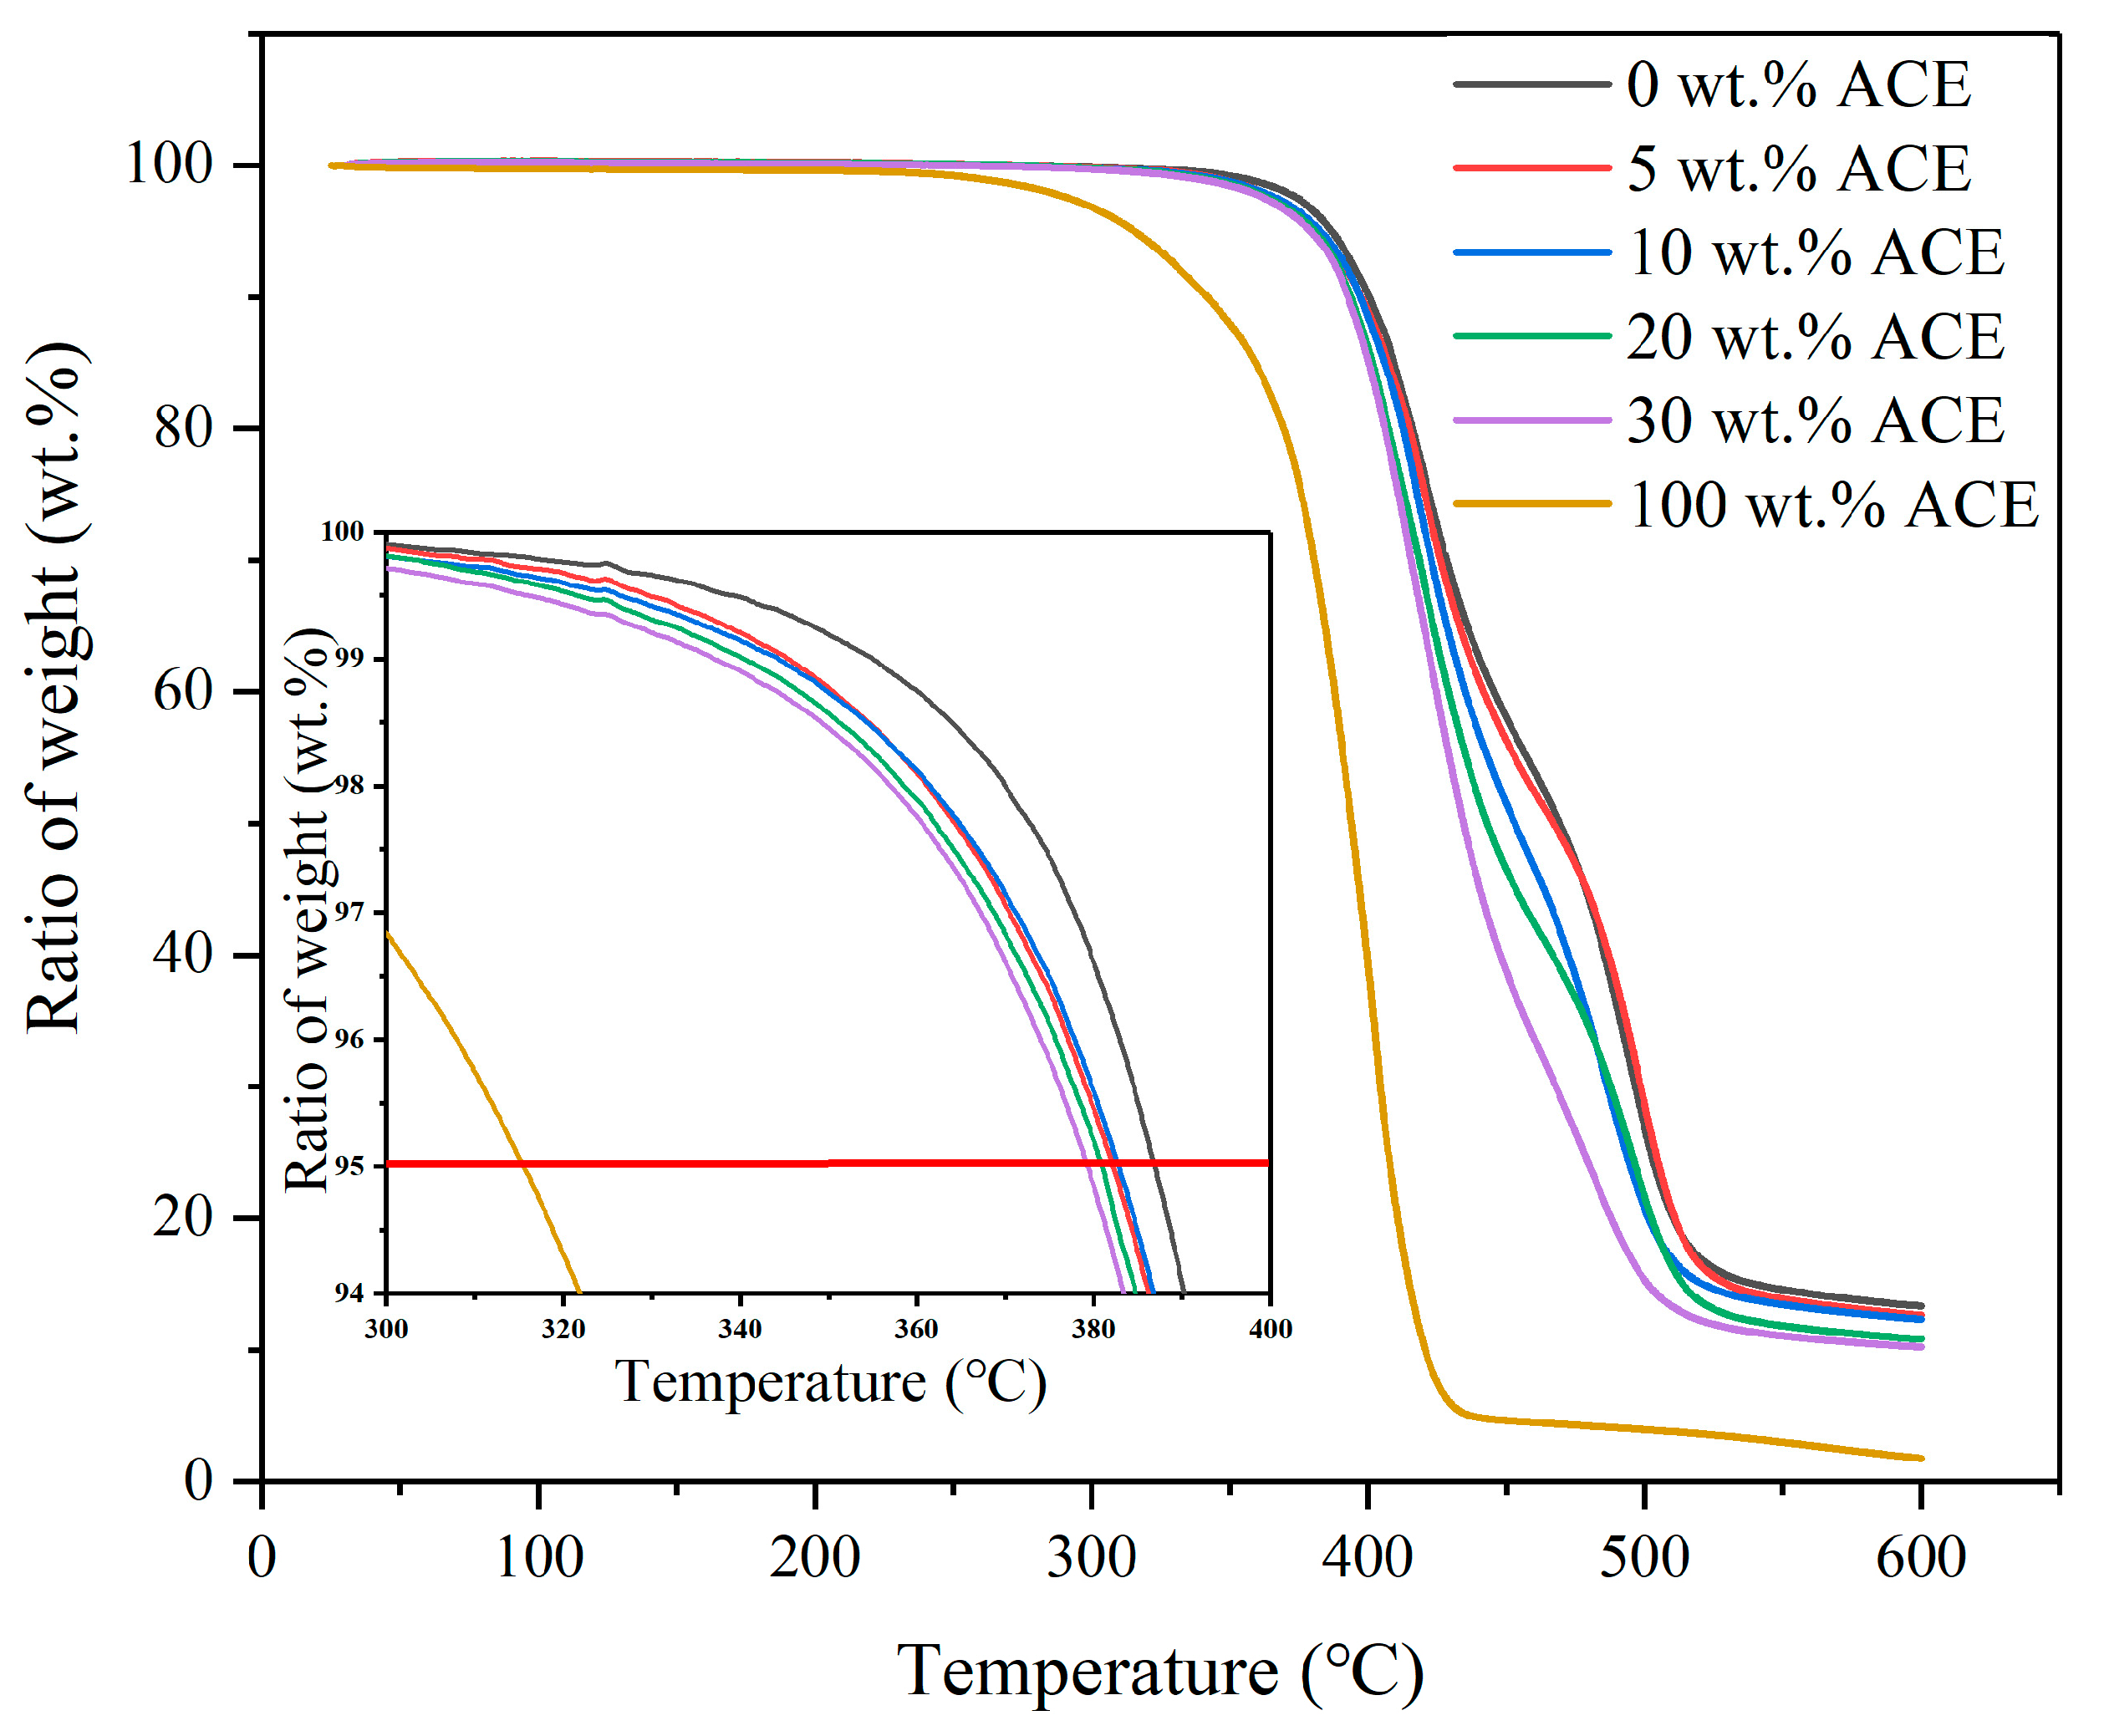
3.3. Thermal Stability
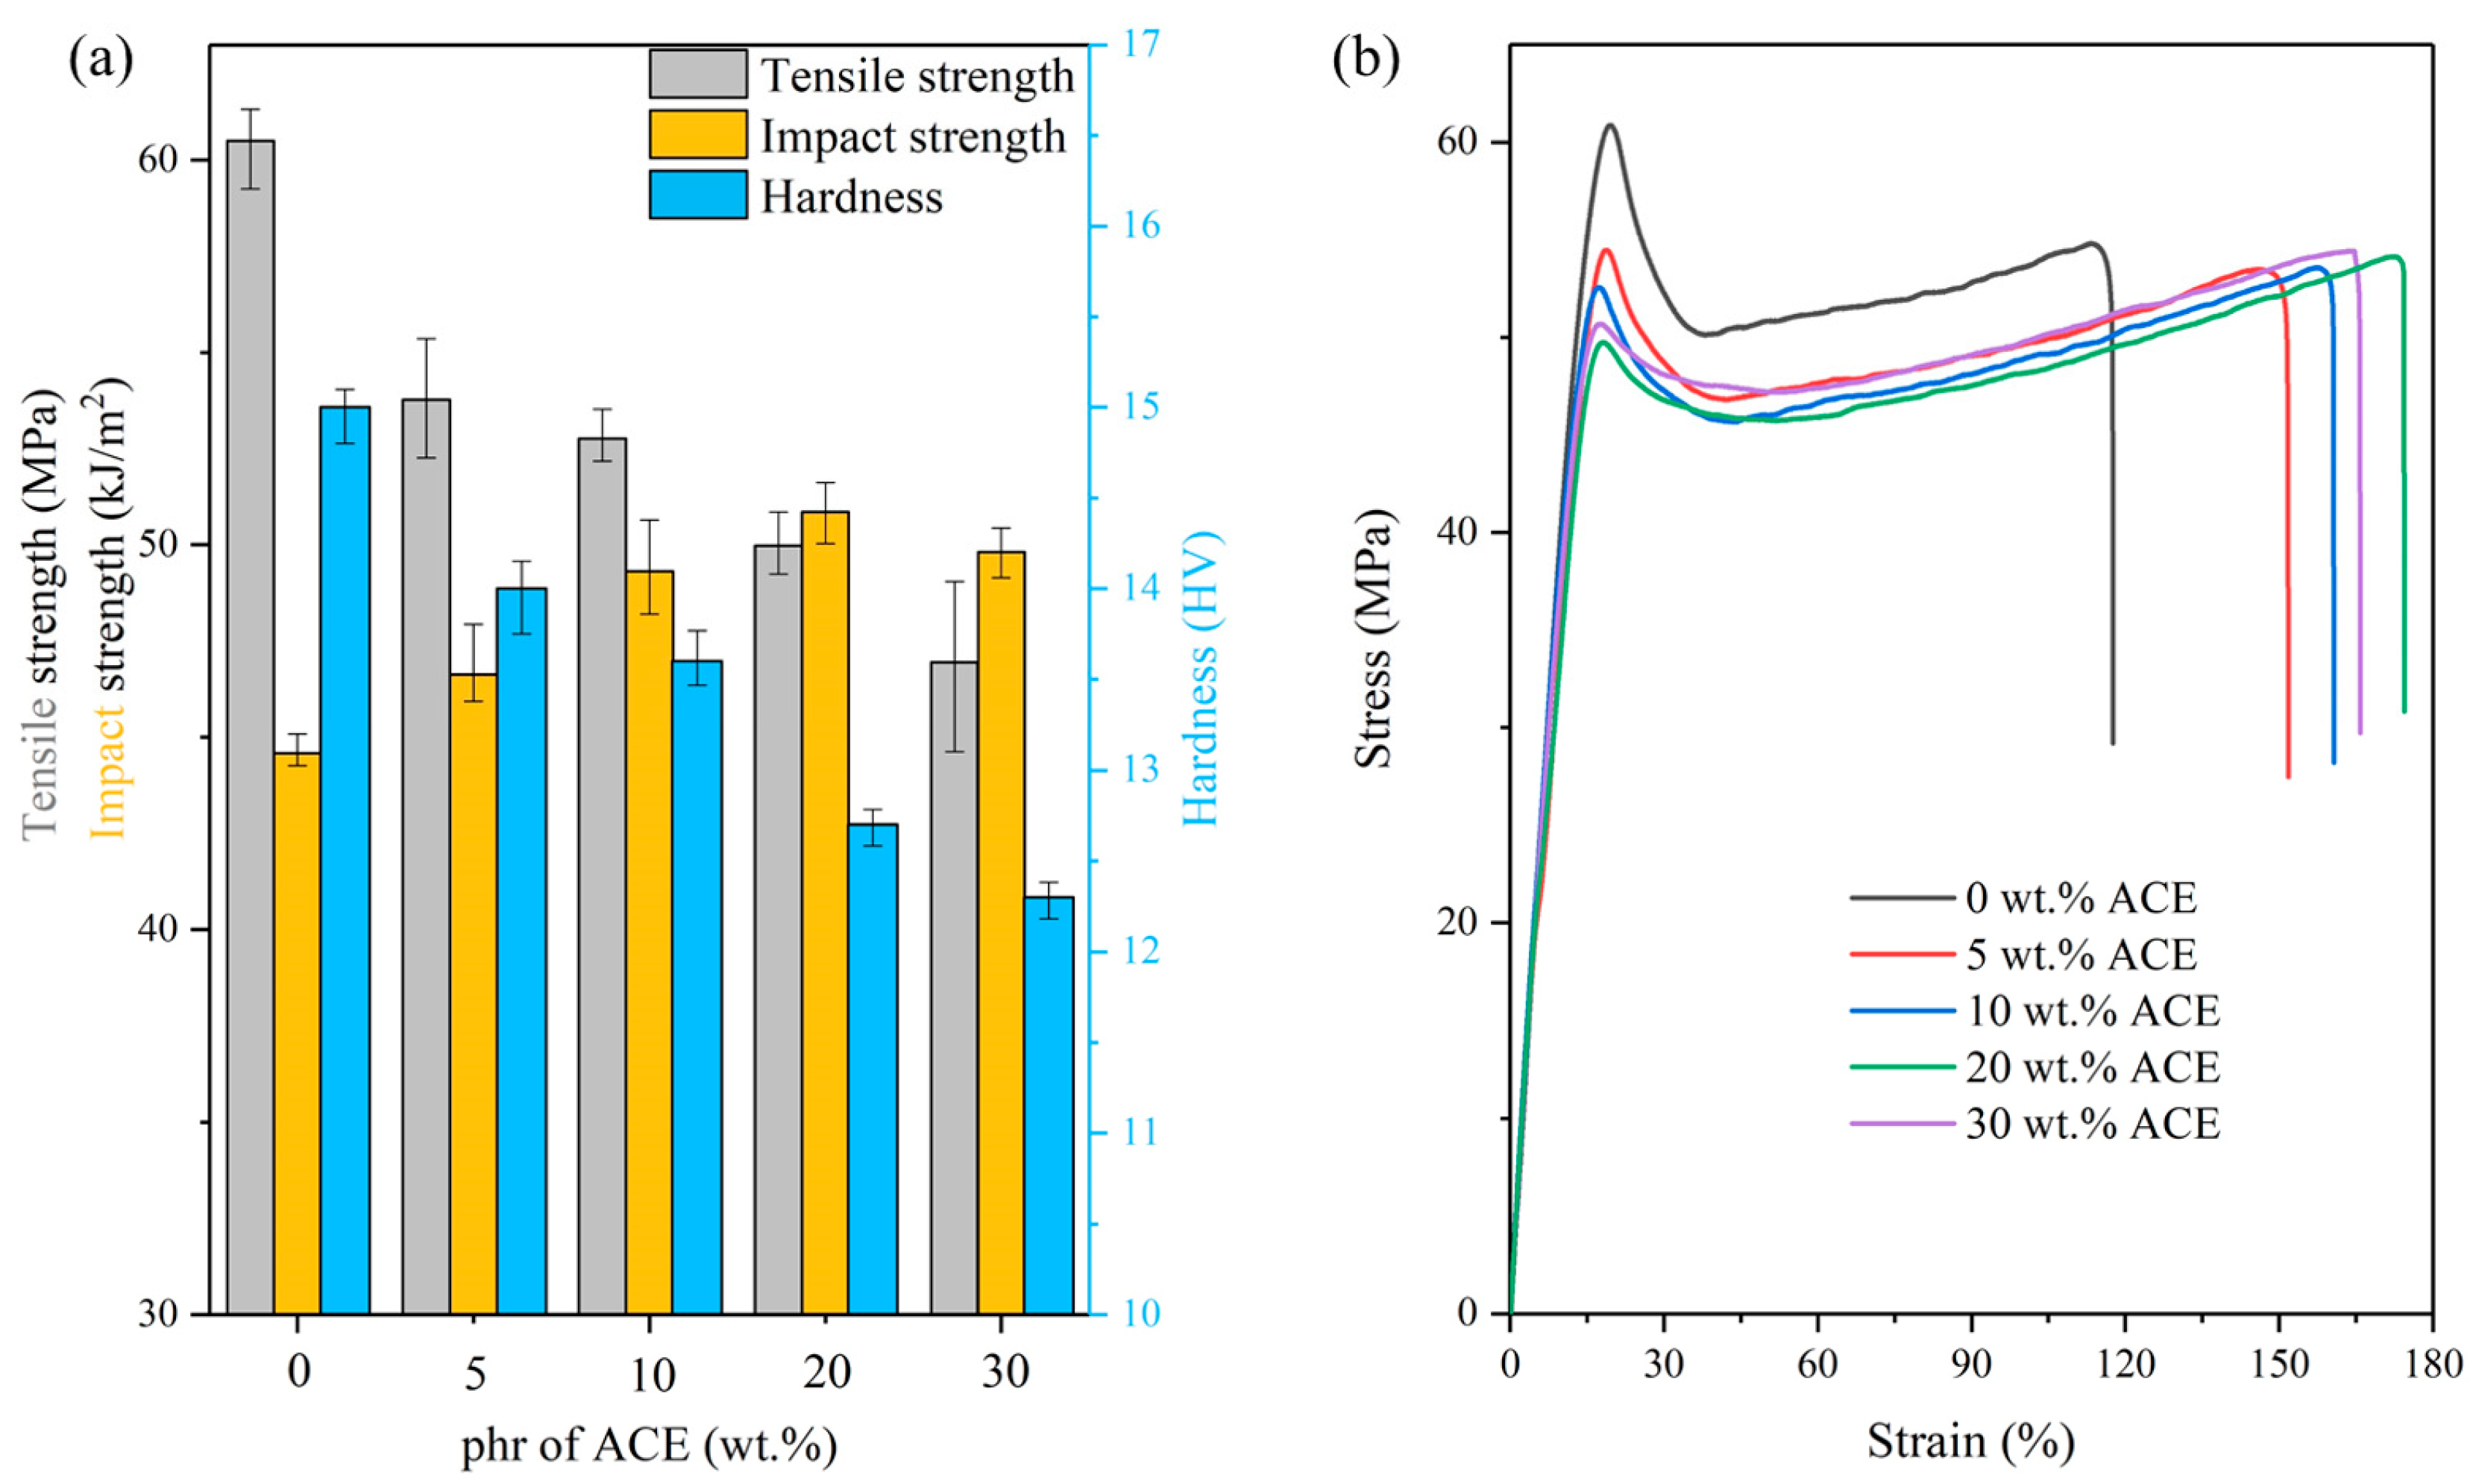
3.4. Mechanical Properties
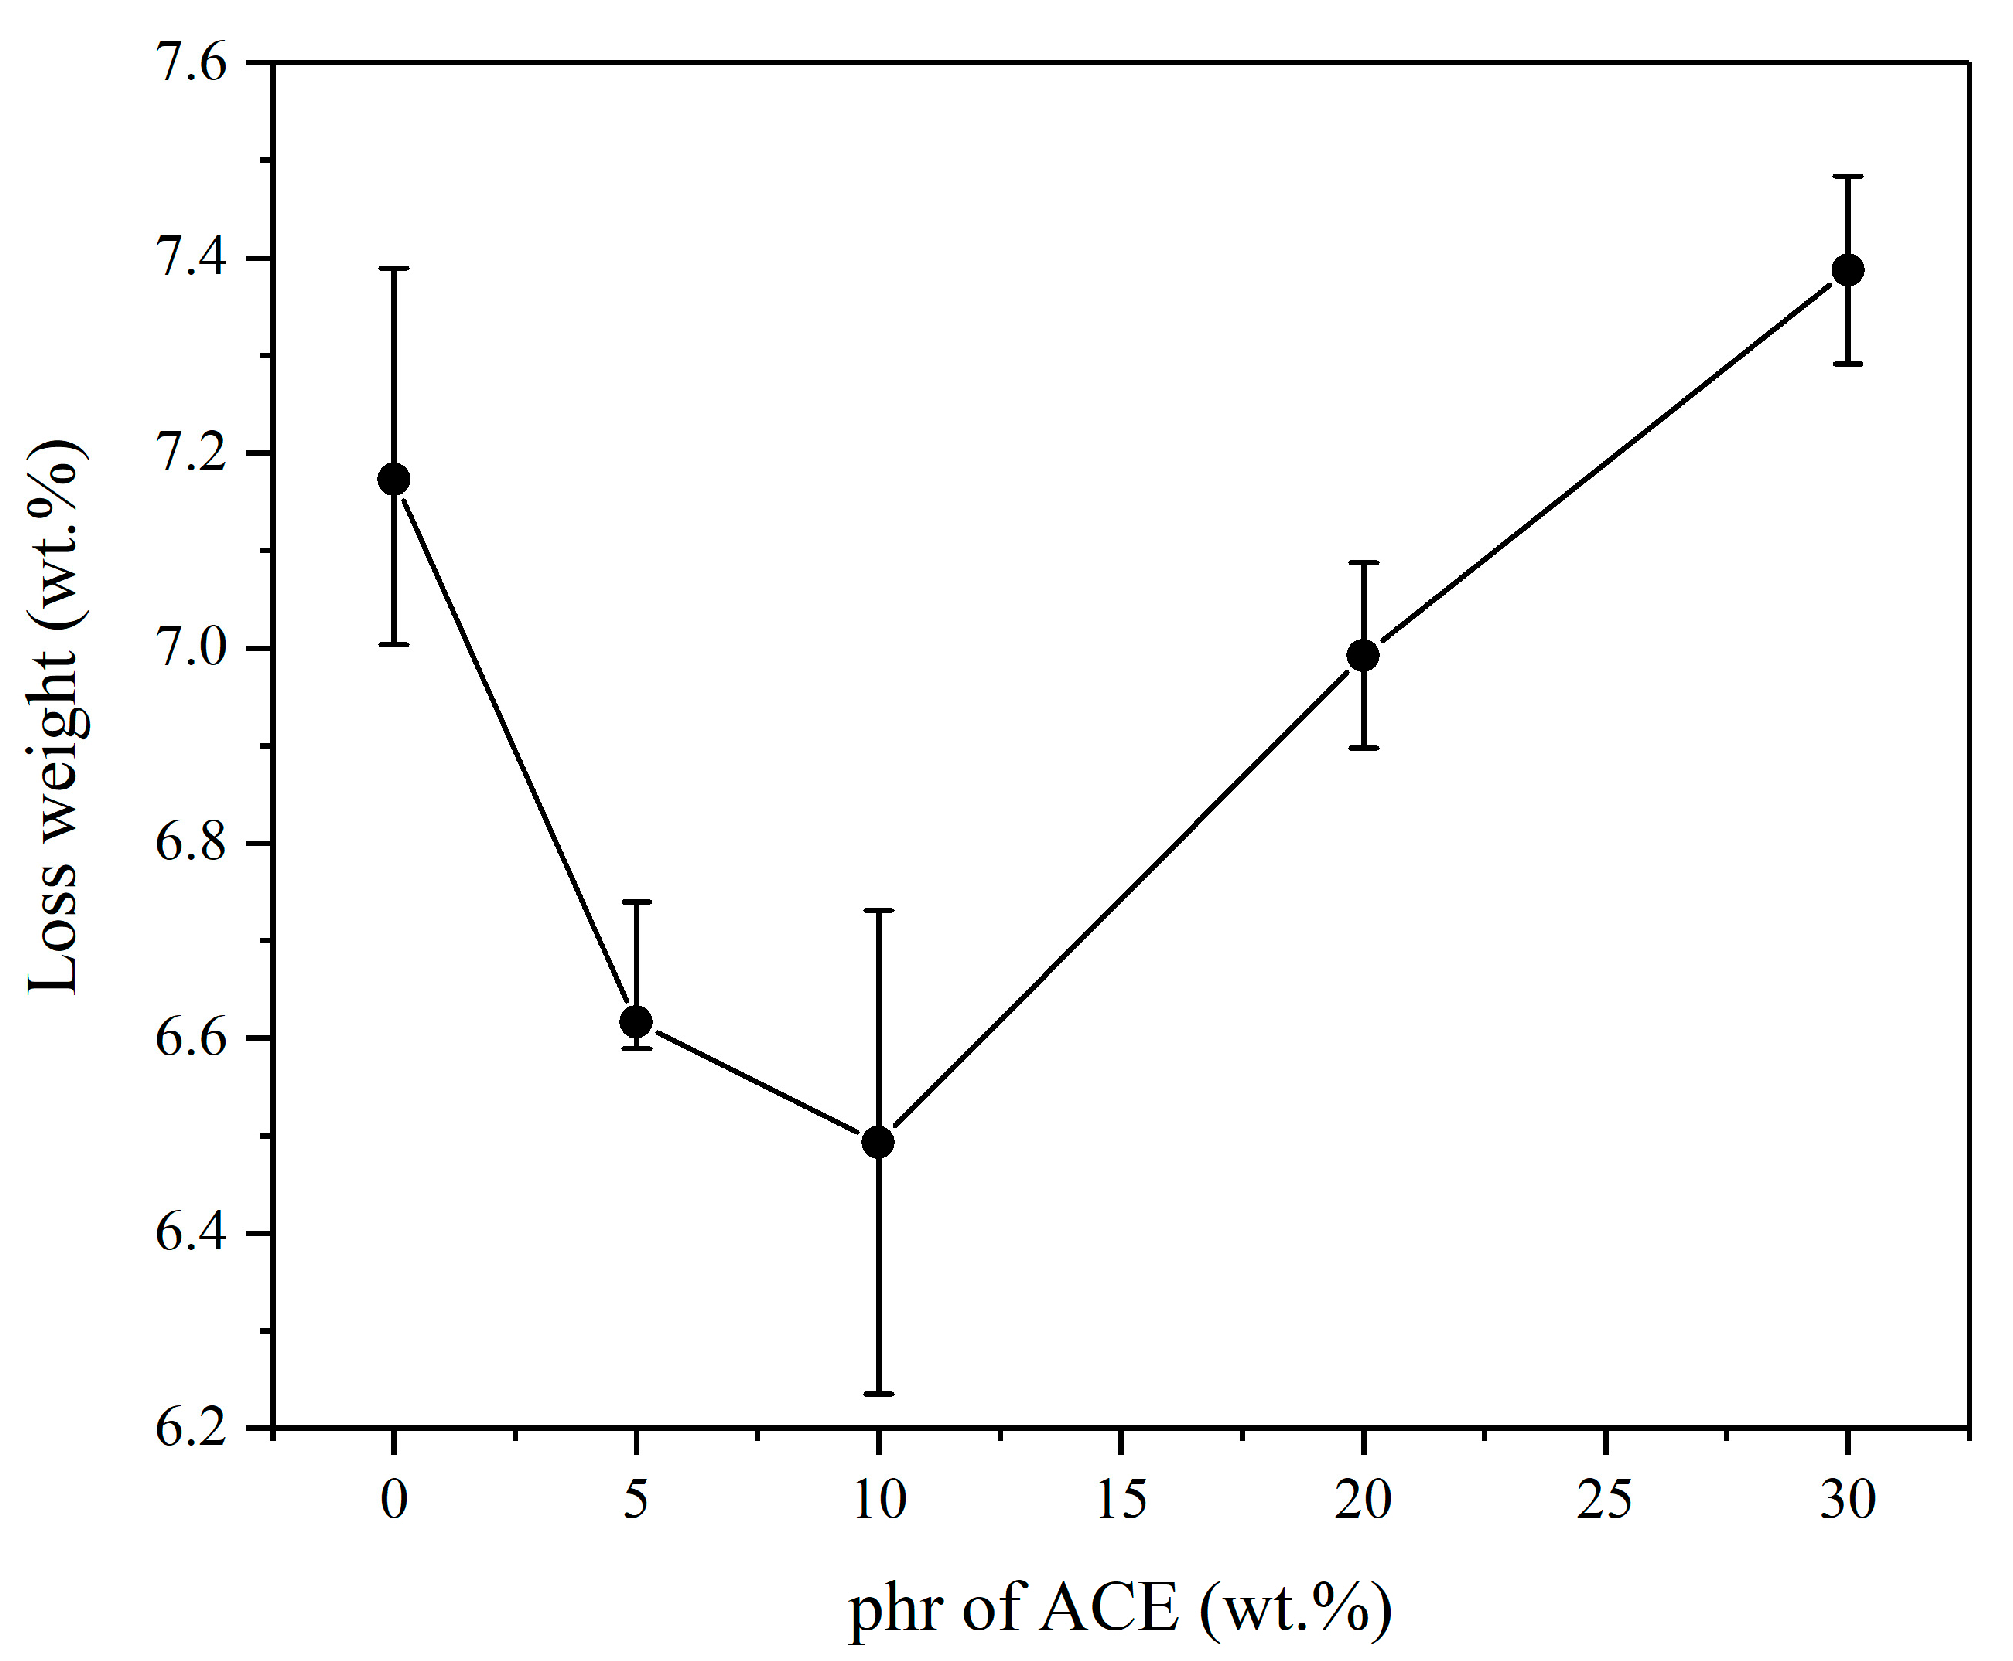
3.5. Abrasion Properties of Materials
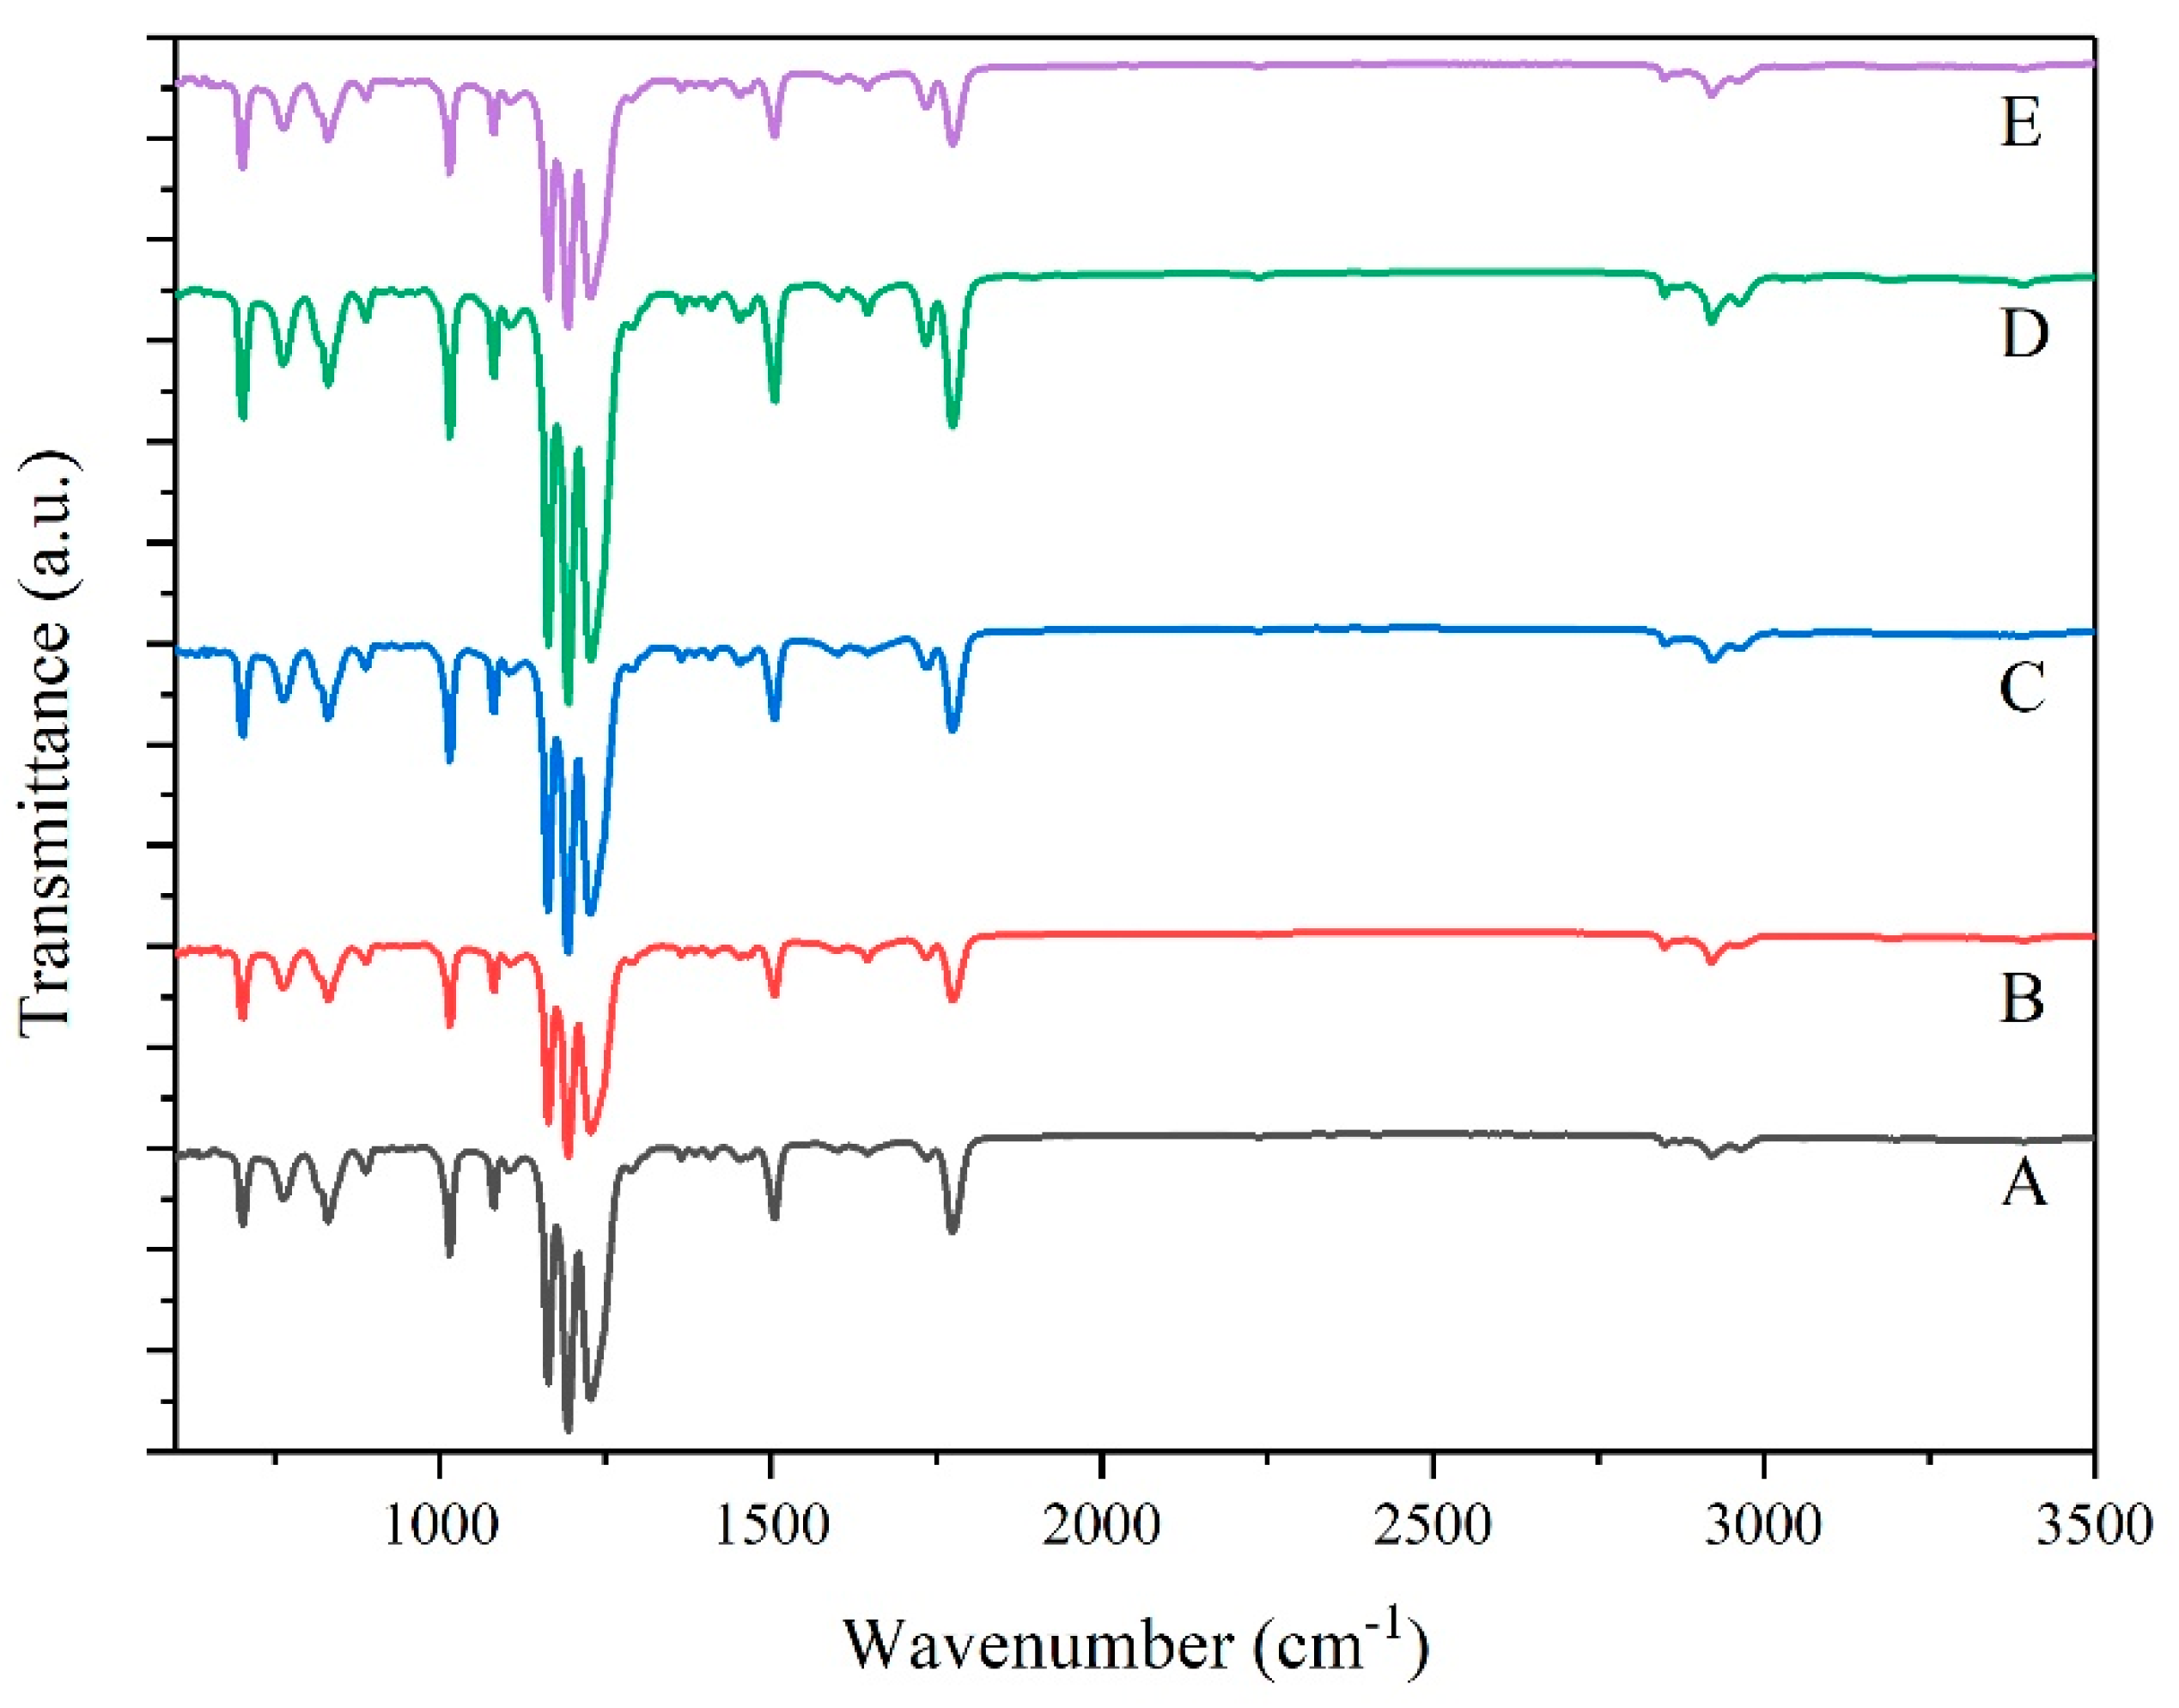
3.6. Interactions between Materials
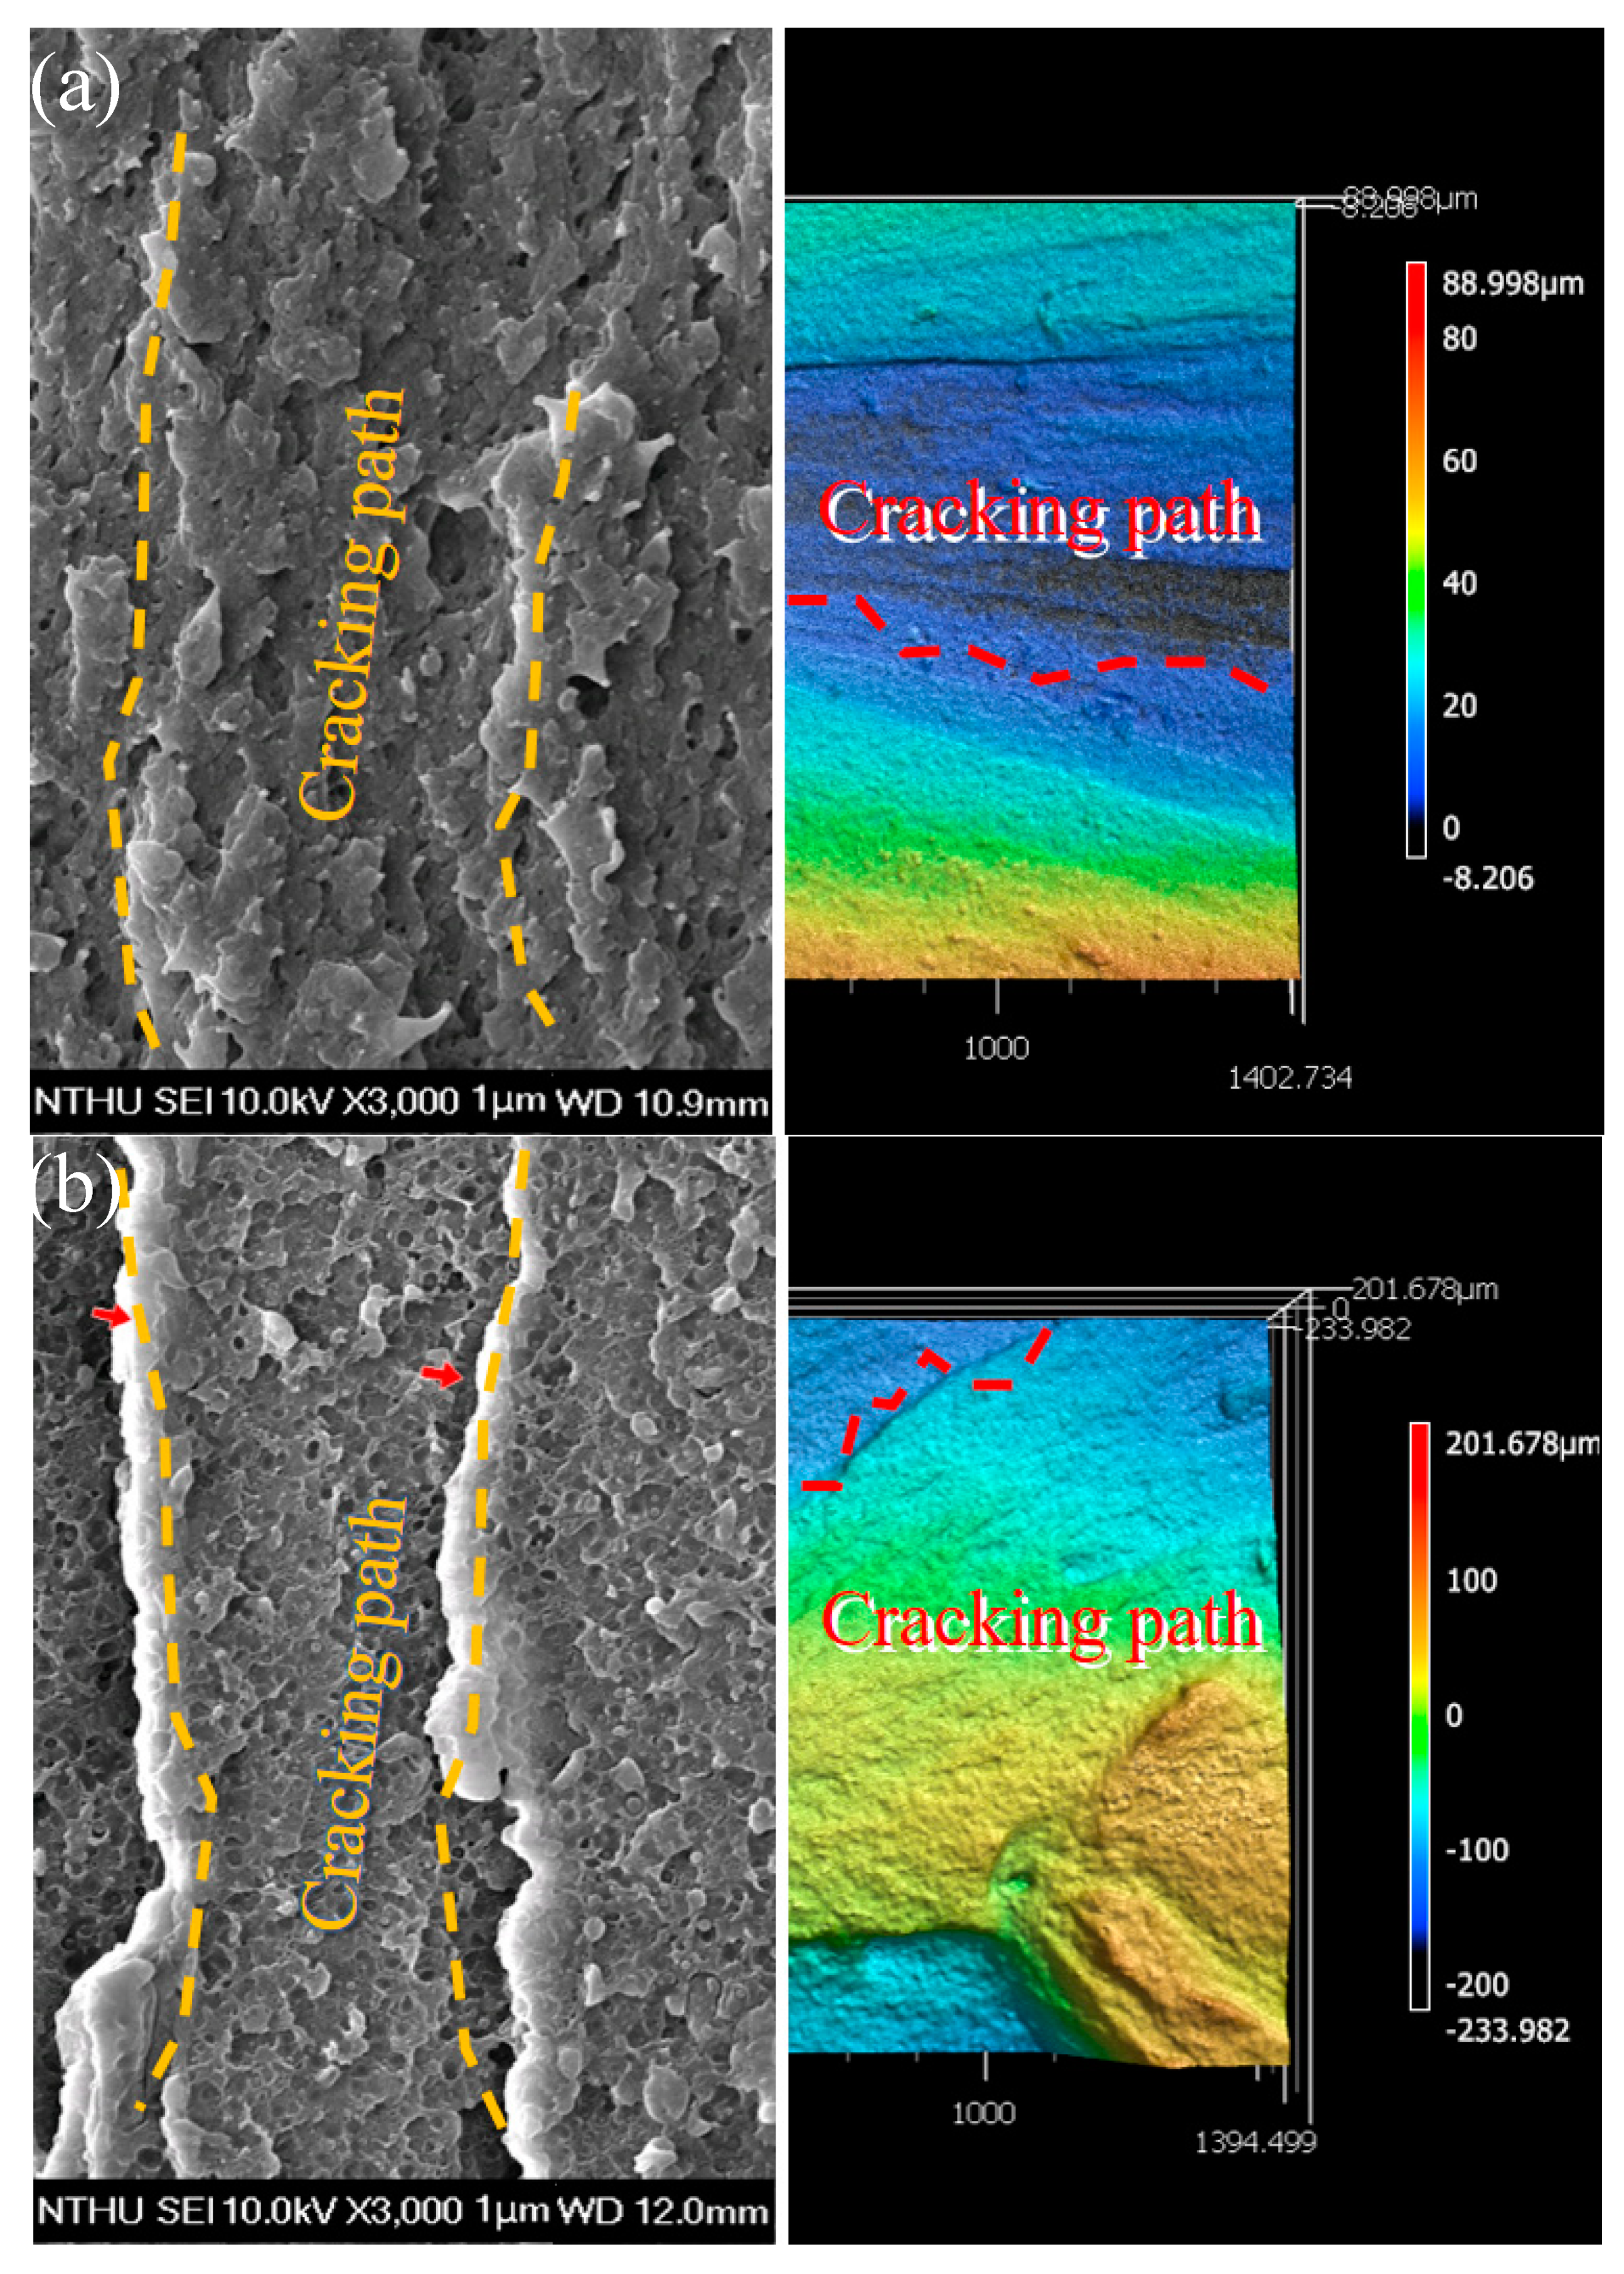
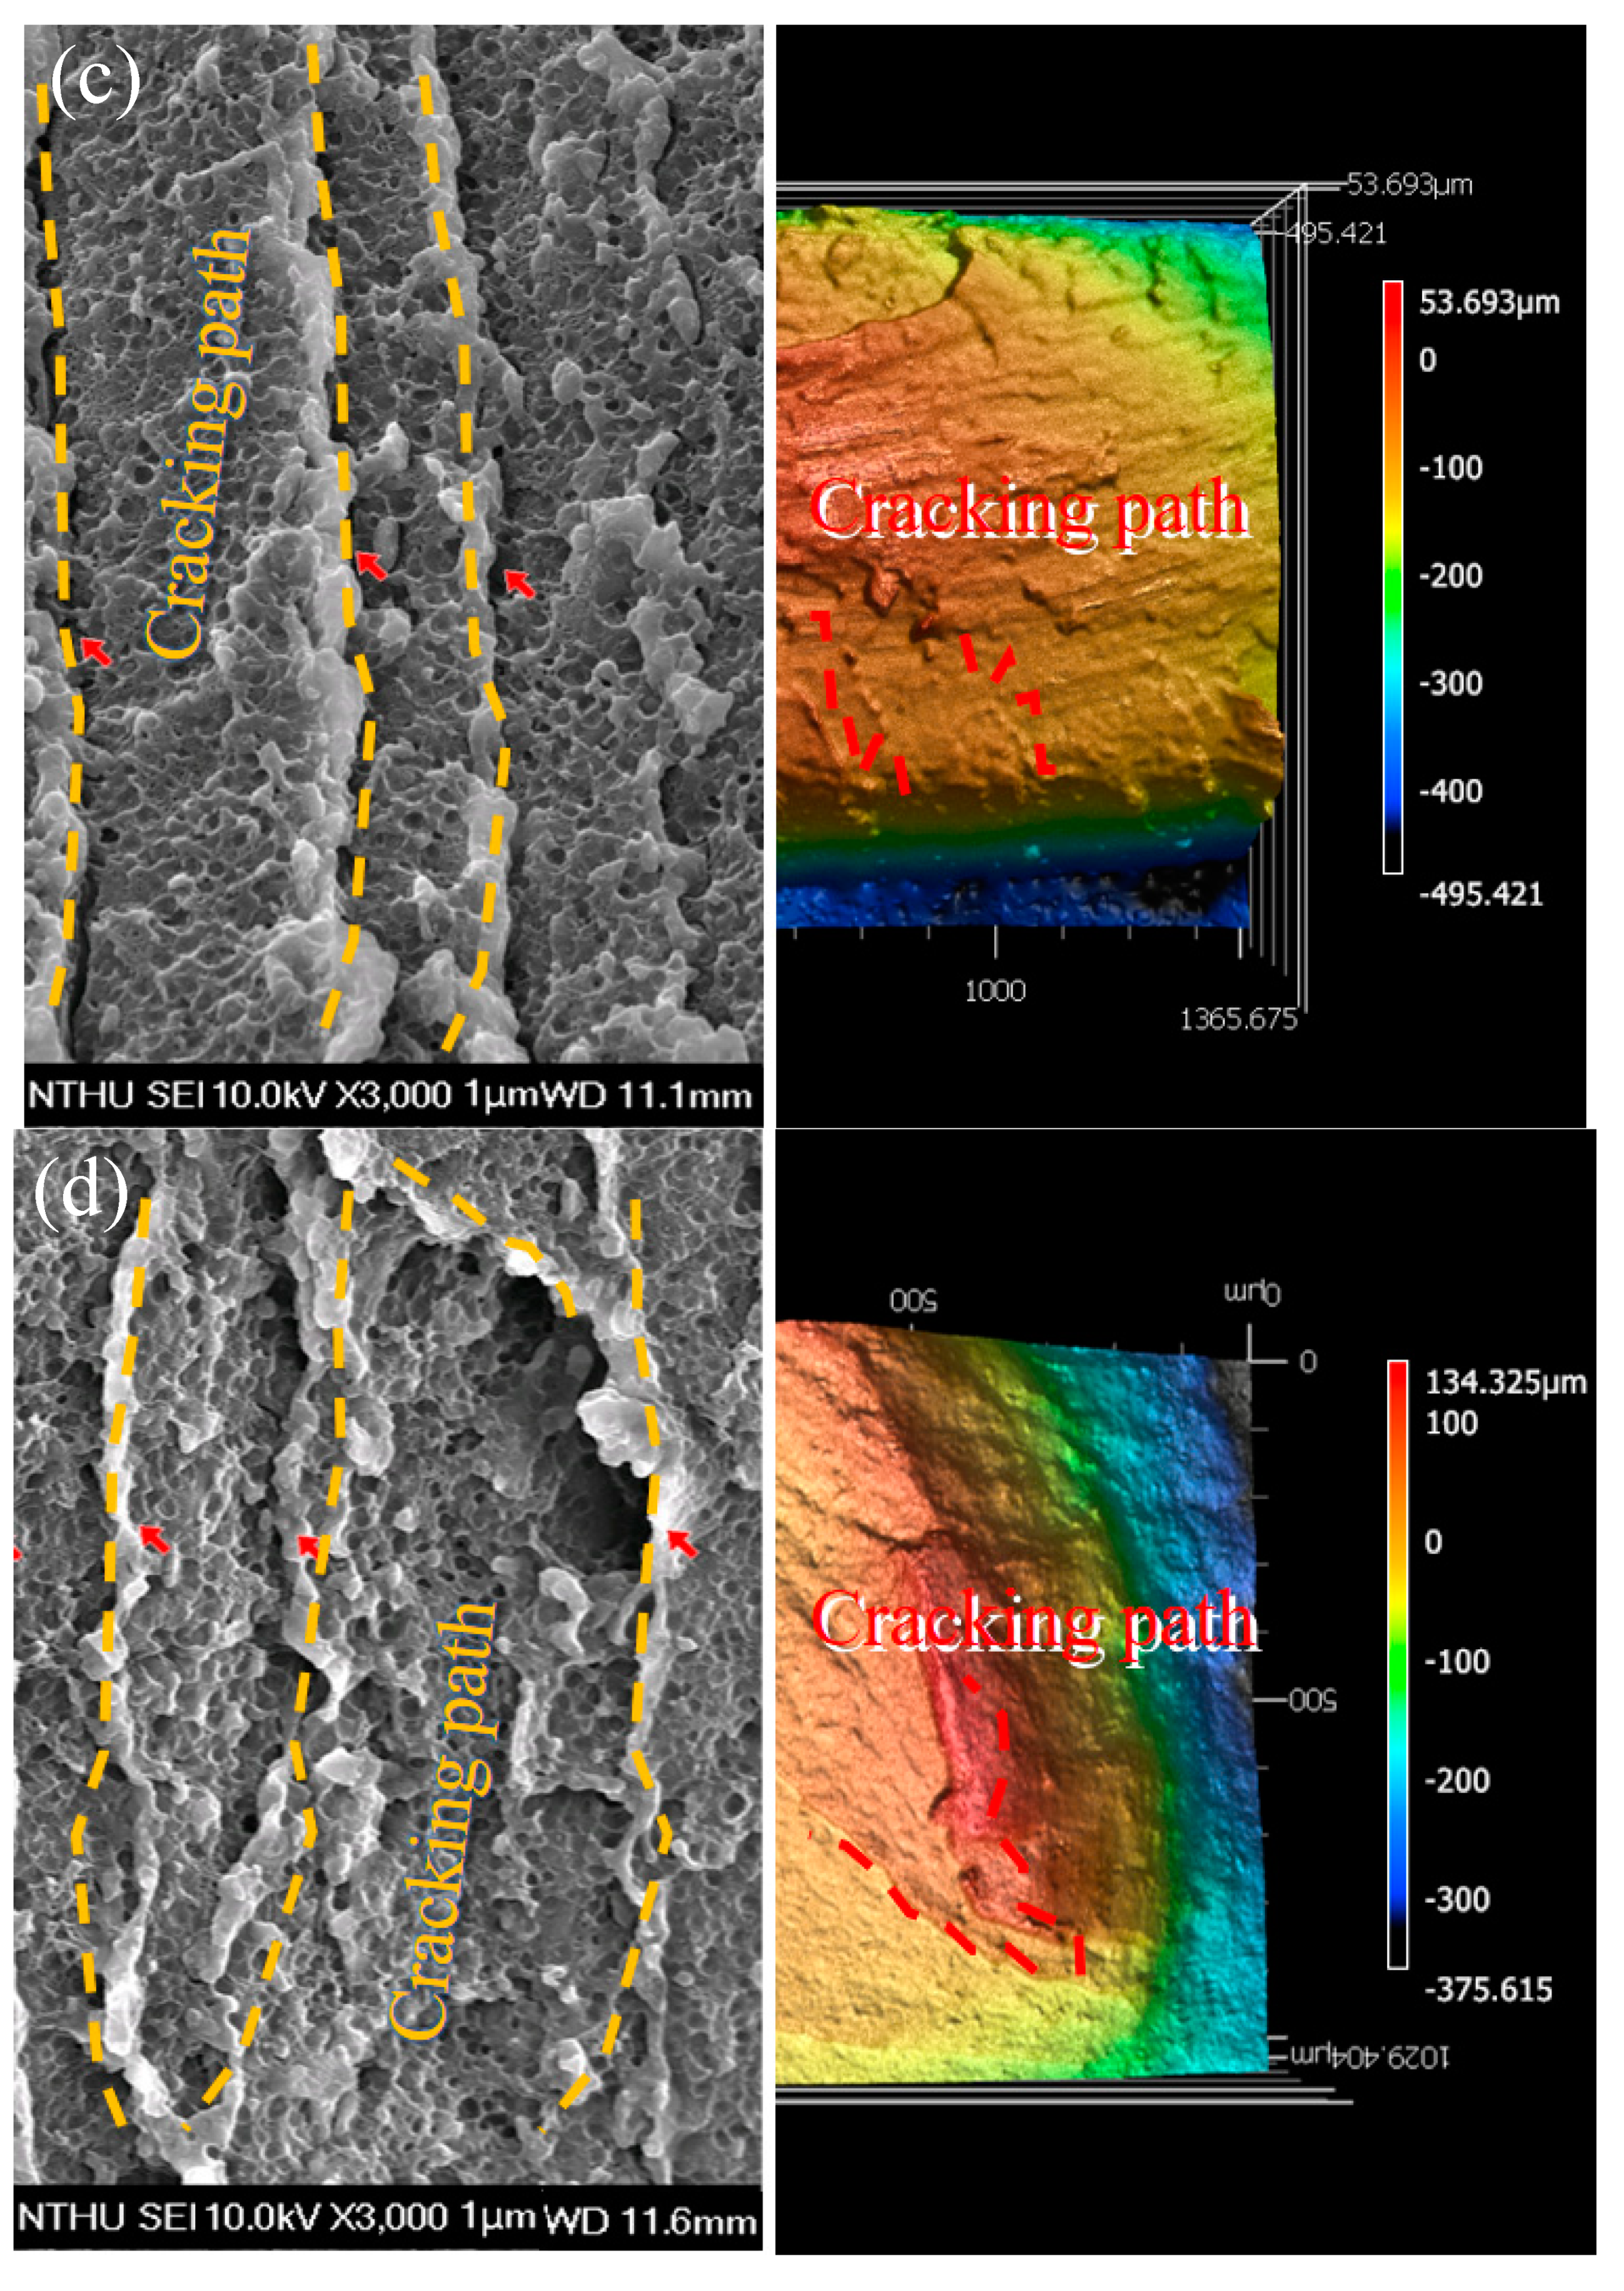
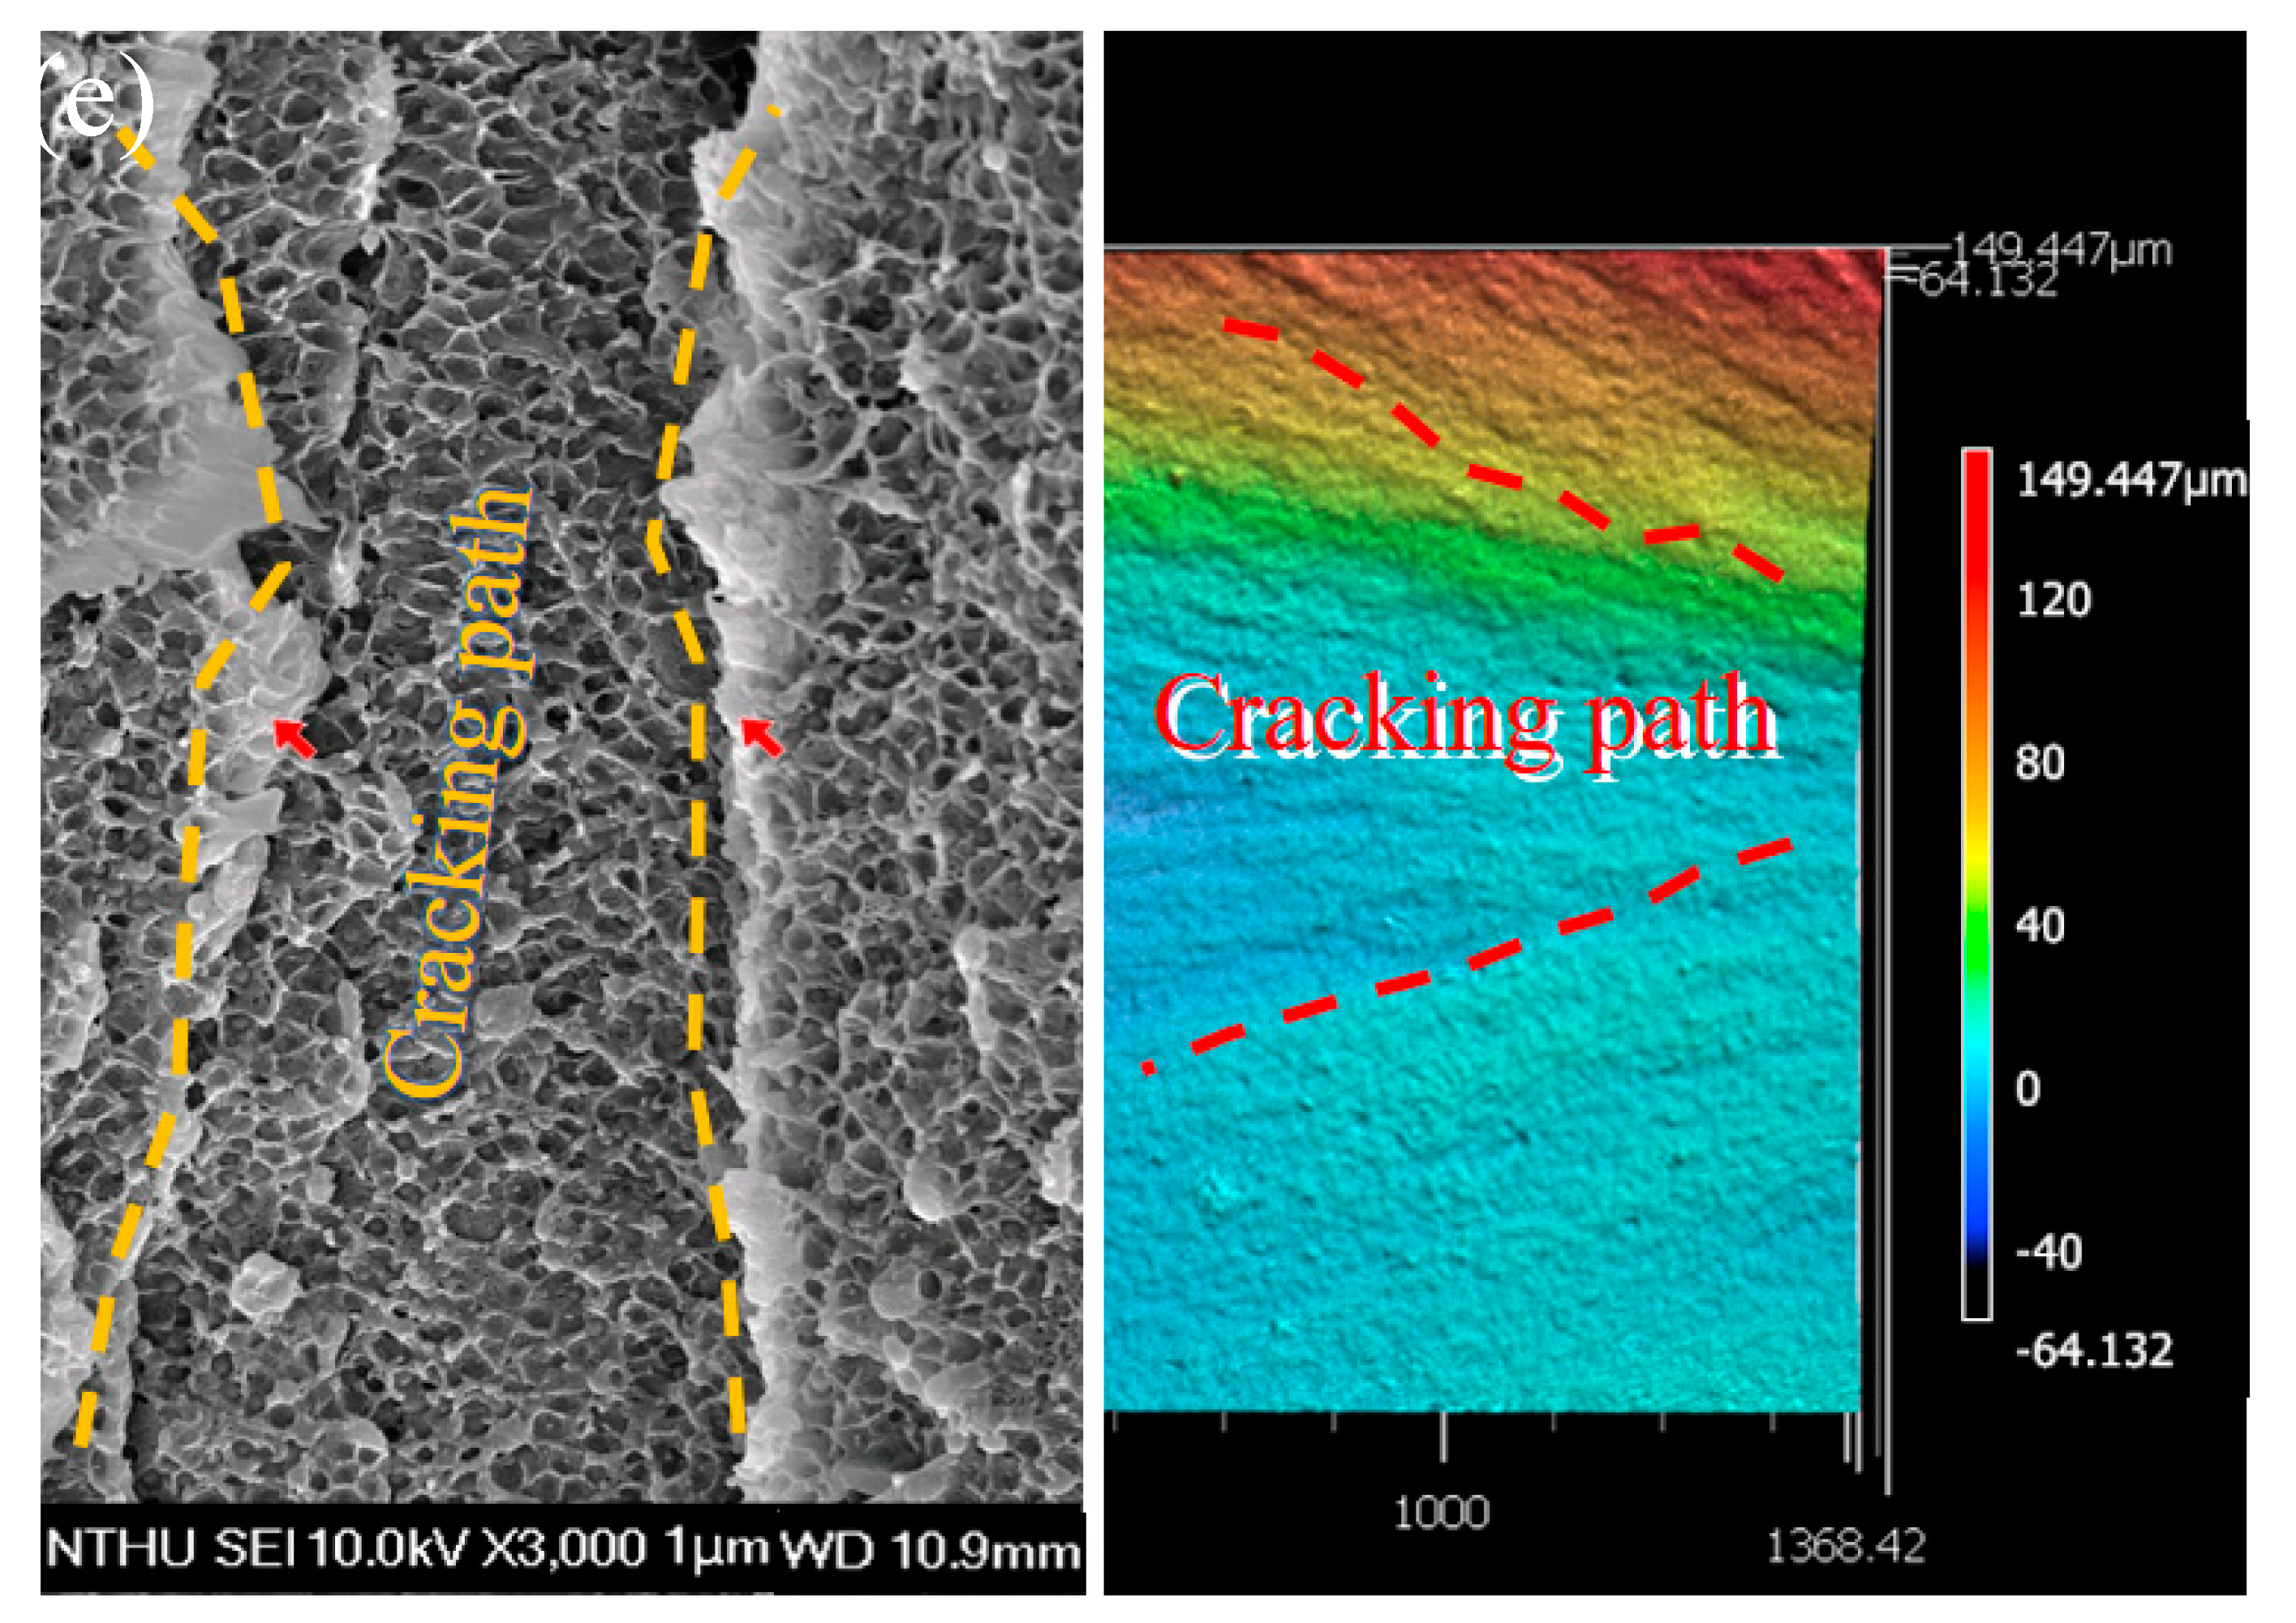
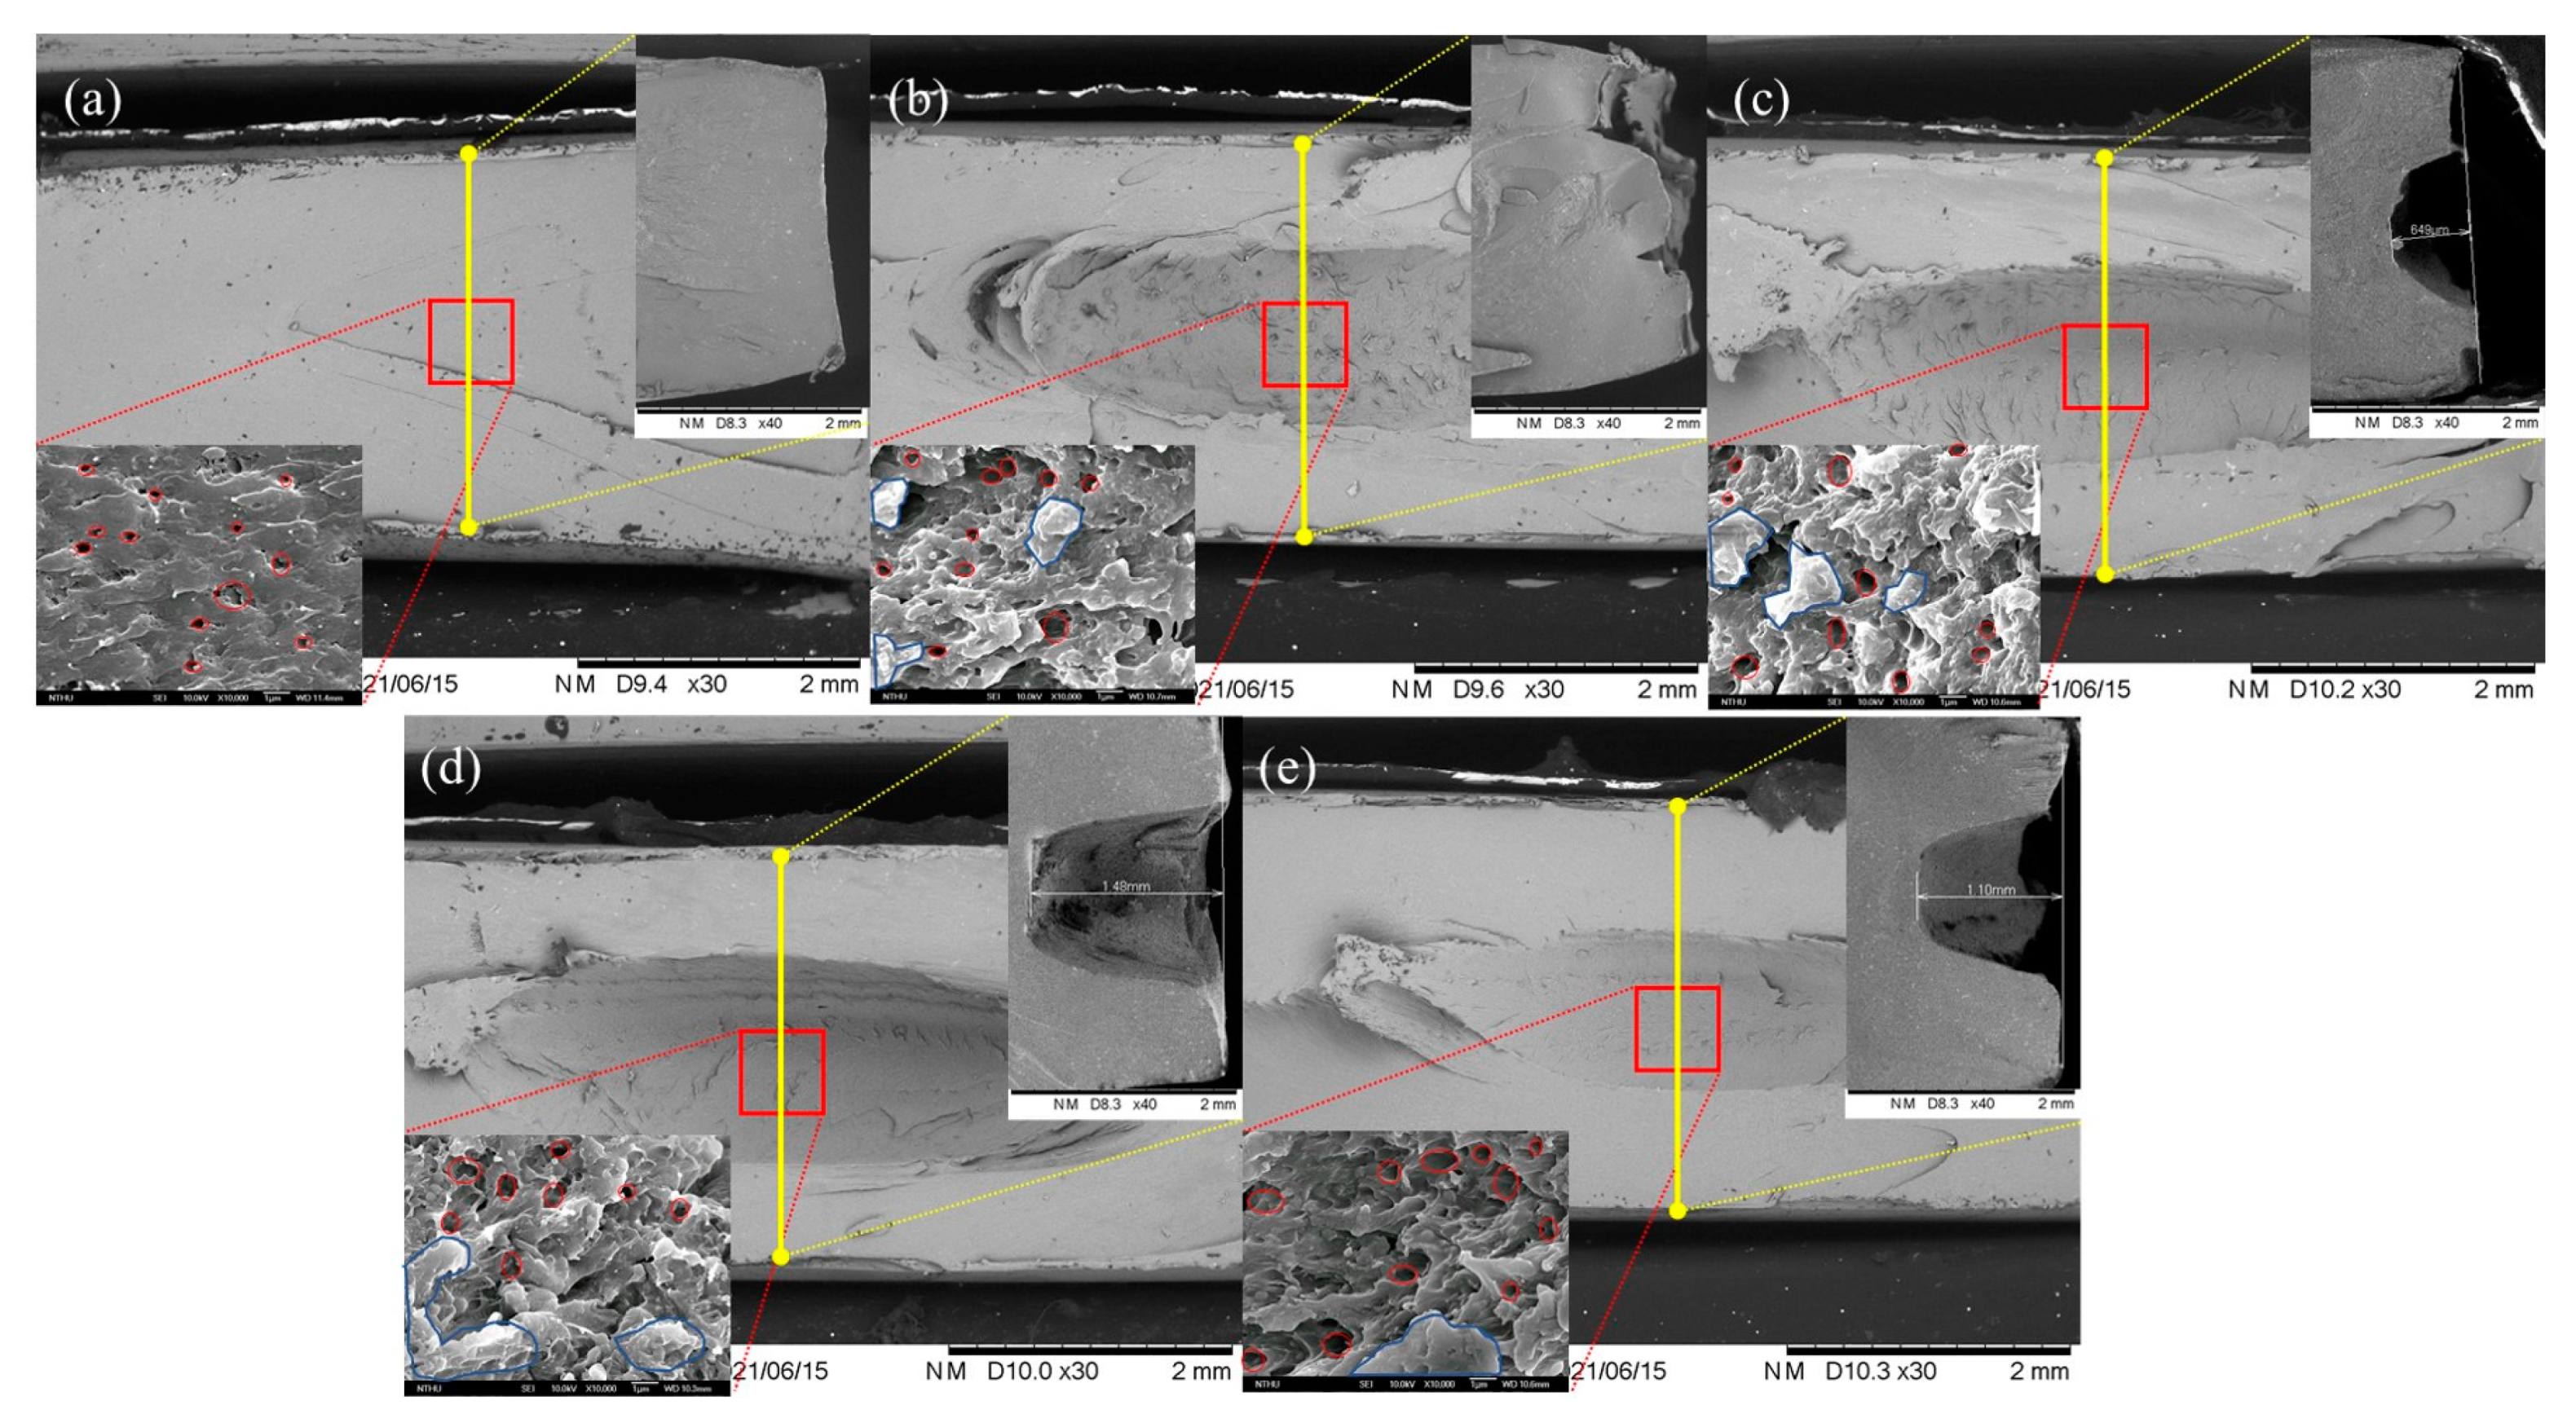
3.7. Scanning Electron Microscopy Analysis and Roughness Testing
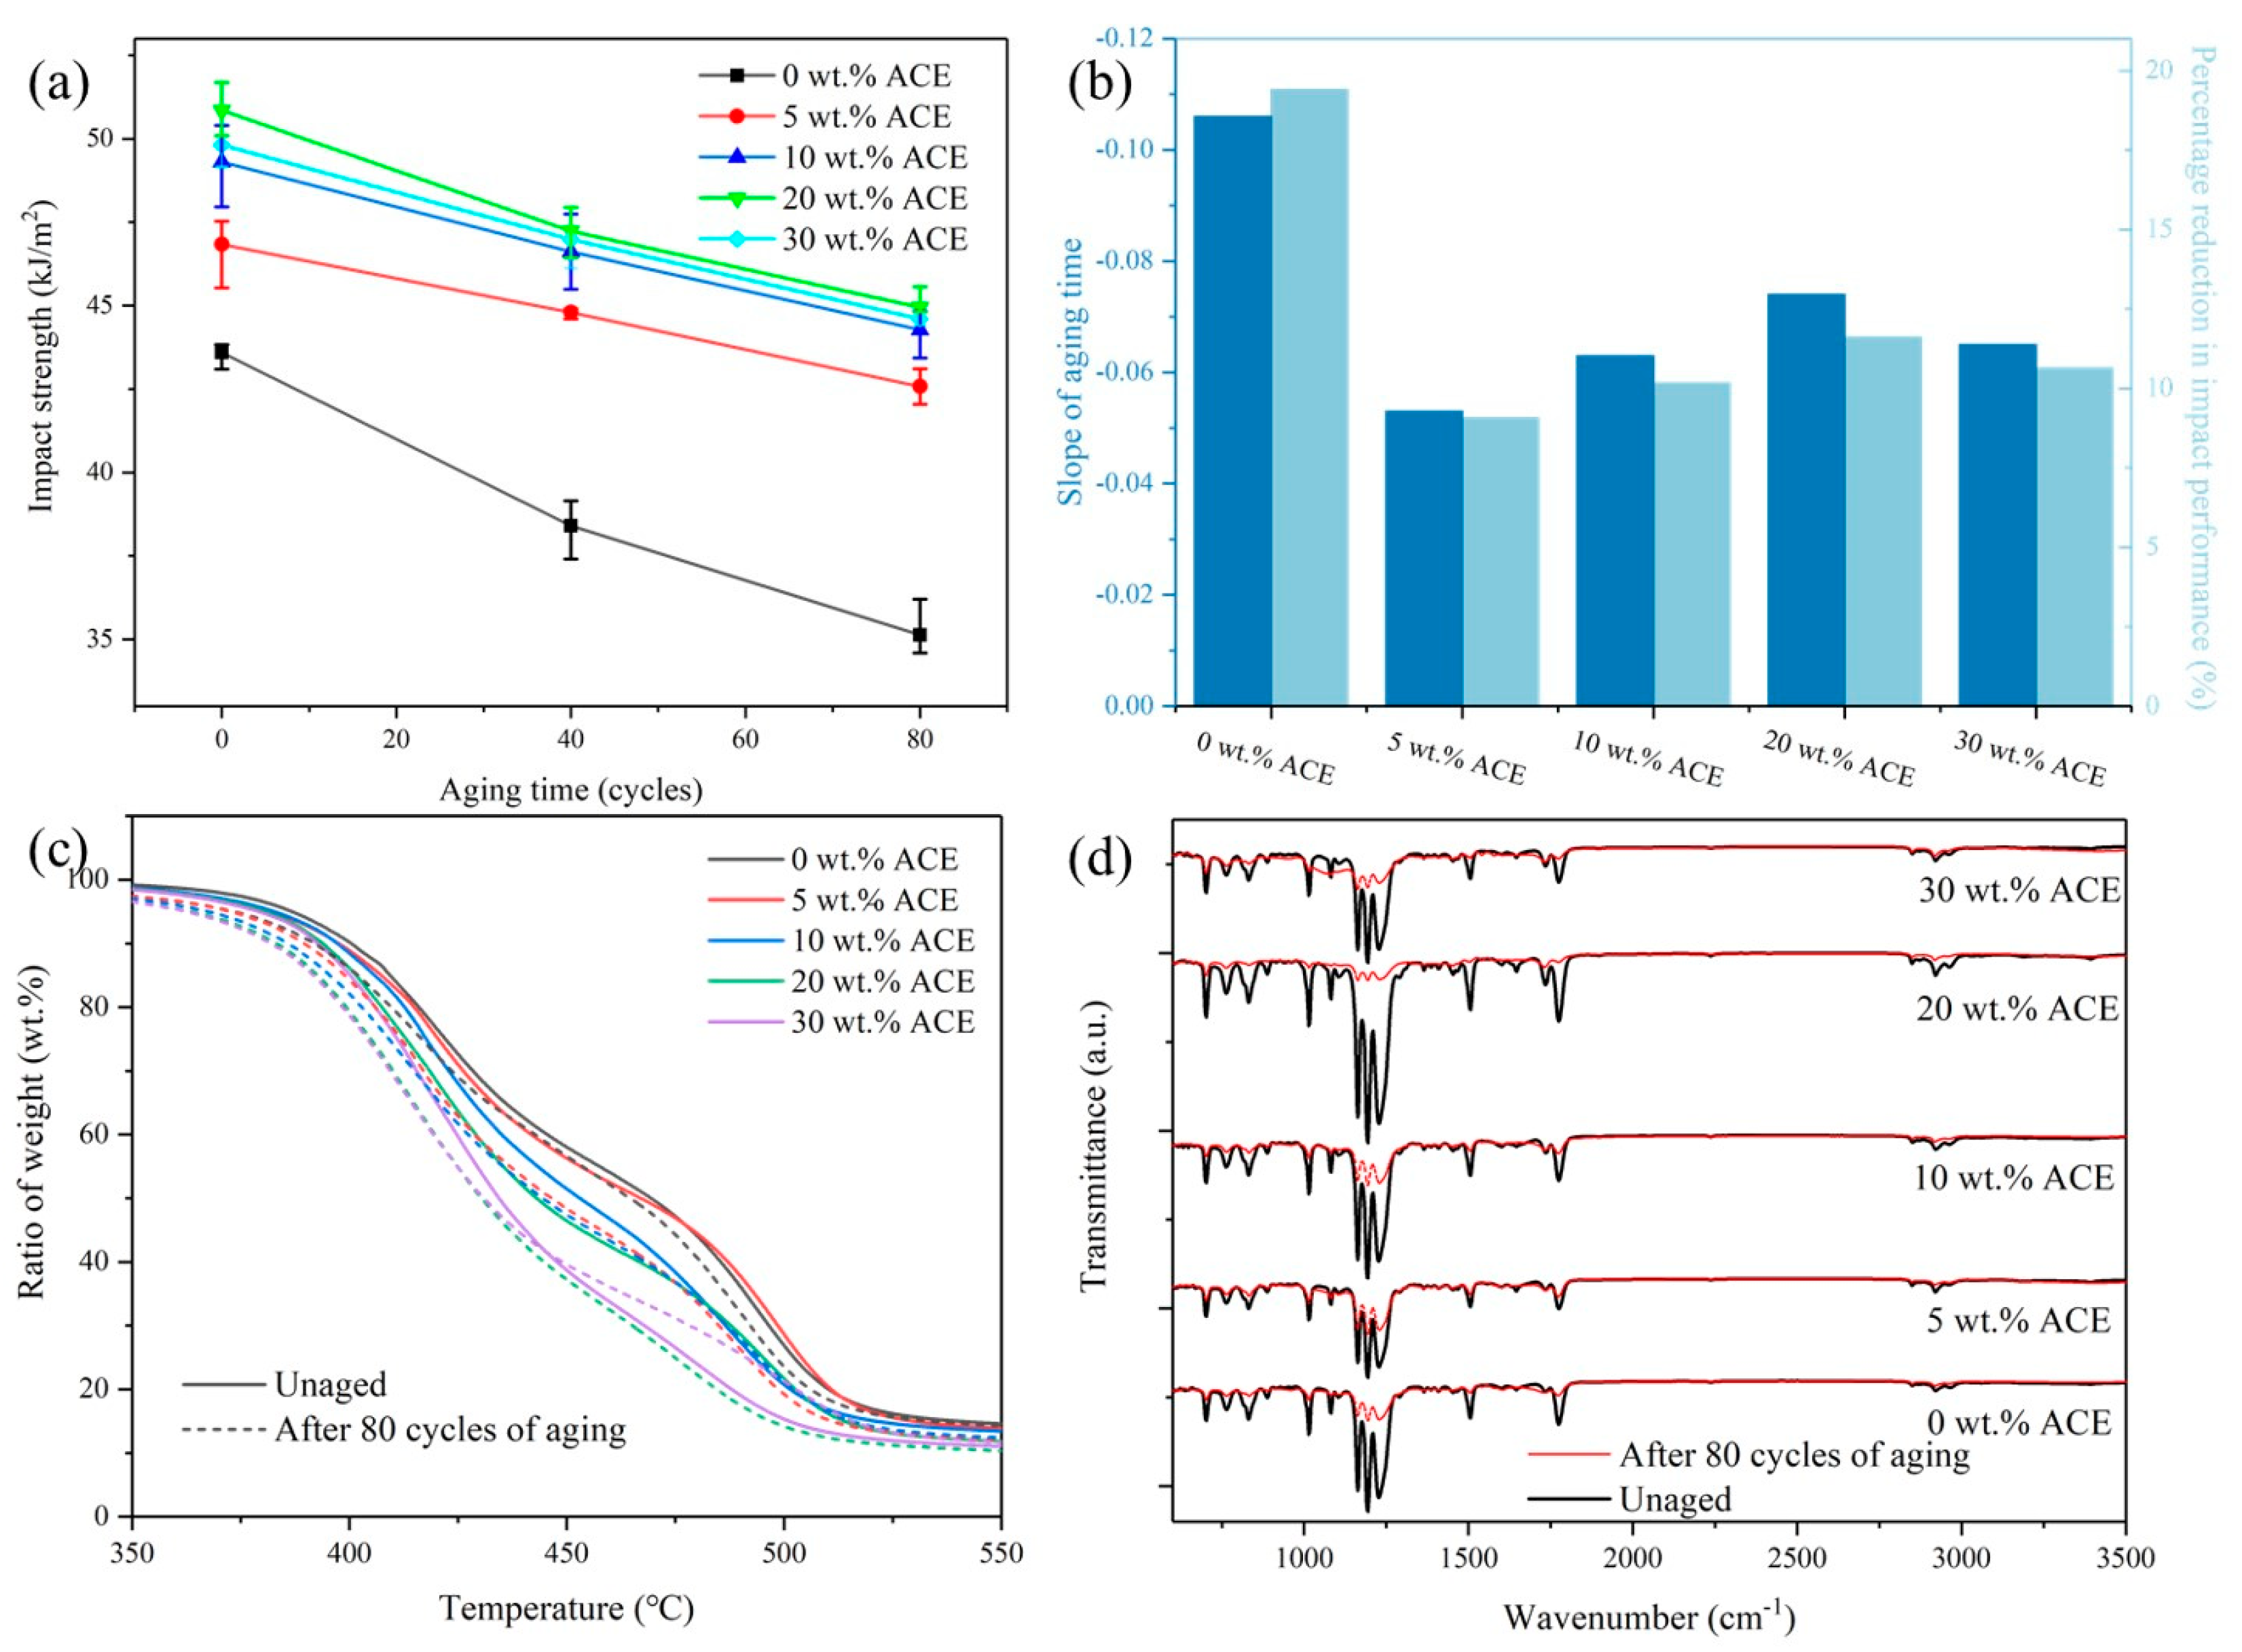
3.8. The Effect of Accelerated Weathering Test
4. Conclusions
Author Contributions
Funding
Acknowledgments
Conflicts of Interest
References
- Datta, P.; Guha, C.; Sarkhel, G. Study of mechanical, thermal, morphological, and process rheology of acrylonitrile styrene acrylate (ASA)/Na+ 1 poly (ethylene-co-methacrylic acid) ionomer blend. Polym. Eng. Sci. 2015, 55, 1571–1579. [Google Scholar] [CrossRef]
- Tolue, S.; Moghbeli, M.R.; Ghafelebashi, S.M. Preparation of ASA (acrylonitrile-styrene-acrylate) structural latexes via seeded emulsion polymerization. Eur. Polym. J. 2009, 45, 714–720. [Google Scholar] [CrossRef]
- Hoang, D.; Kim, J. Synthesis and applications of biscyclic phosphorus flame retardants. Polym. Degrad. Stab. 2008, 93, 36–42. [Google Scholar] [CrossRef]
- Swoboda, B.; Buonomo, S.; Leroy, E.; Cuesta, J.L. Fire retardant poly (ethylene terephthalate)/polycarbonate/triphenyl phosphite blends. Polym. Degrad. Stab. 2008, 93, 910–917. [Google Scholar] [CrossRef]
- Stanculescu, F.; Stanculescu, A. Polycarbonate-based blends for optical non-linear applications. Nanoscale Res. Lett. 2016, 11, 1–13. [Google Scholar] [CrossRef] [Green Version]
- Zhao, W.; Li, B.; Xu, M.; Yang, K.; Lin, L. Novel intumescent flame retardants: Synthesis and application in polycarbonate. Fire Mater. 2013, 37, 530–546. [Google Scholar] [CrossRef]
- Ramteke, A.A.; Maiti, S. Mechanical properties of polycarbonate/modified acrylonitrile-styrene-acrylate terpolymer blend. J. Appl. Polym. Sci. 2010, 116, 486–492. [Google Scholar] [CrossRef]
- Han, Y.; Liu, J.; He, X.J.; Zhou, C. Morphology and Properties of ASA/PC Blends. Adv. Mater. Res. 2012, 450–451, 1467–1470. [Google Scholar] [CrossRef]
- Wu, S. Phase structure and adhesion in polymer blends: A criterion for rubber toughening. Polymer 1985, 26, 1855–1863. [Google Scholar] [CrossRef]
- Hwang, I.J.; Kim, B.K. Effect of the type of SAN in SAN/CPE blend: Morphology, mechanical, and rheological properties. J Appl Polym. Sci. 1998, 67, 27–36. [Google Scholar] [CrossRef]
- Wei, Z.; Jun, Z. Toughening effect of PNBR on ASA/SAN binary blends. J. Vinyl Addit. Technol. 2014, 20, 268–274. [Google Scholar] [CrossRef]
- Lutz, J.T., Jr. Impact modifiers for PVC. J. Vinyl Technol. 1993, 15, 82–99. [Google Scholar] [CrossRef]
- Yu, J.; Feng, P.; Zhang, H. Effects of core-shell acrylate particles on impact properties of chlorinated polyethylene/polyvinyl chloride blends. Polym. Eng. Sci. 2010, 50, 295–301. [Google Scholar] [CrossRef]
- Zhang, W.; Zhang, J.; Chen, S. Effect of core–shell structured modifier ACR on ASA/SAN/ACR ternary blends. J. Mater. Sci. 2012, 47, 5041–5049. [Google Scholar] [CrossRef]
- Gong, G.; Xie, B.-H.; Yang, M.-B.; Yang, W.; Zhang, W.-Q.; Zhao, M. Mechanical properties and fracture behavior of injection and compression molded polypropylene/coal gangue powder composites with and without a polymeric coupling agent. Compos. A Appl. Sci. Manuf. 2007, 38, 1683–1693. [Google Scholar] [CrossRef]
- Xiao, C.; Leng, X.; Zhang, X.; Zheng, K.; Tian, X. Improved thermal properties by controlling selective distribution of AlN and MWCNT in immiscible polycarbonate (PC)/Polyamide 66 (PA66) composites. Compos. A Appl. Sci. Manuf. 2018, 110, 133–141. [Google Scholar] [CrossRef]
- González, I.; Santamaría, P.; Eguiazábal, J. Tough semiconductor polycarbonate/multiwalled carbon nanotubes nanocomposites by rubber modification. Compos. A Appl. Sci. Manuf. 2015, 71, 227–234. [Google Scholar] [CrossRef]
- Pettarin, V.; Eliçabe, G.; Frontini, P.; Leskovics, K.; Lenkey, G.B.; Czigany, T. Analysis of low temperature impact fracture data of thermoplastic polymers making use of an inverse methodology. Eng. Fract. Mech. 2006, 73, 738–749. [Google Scholar] [CrossRef]
- Ozyhar, T.; Baradel, F.; Zoppe, J. Effect of functional mineral additive on processability and material properties of wood-fiber reinforced poly (lactic acid) (PLA) composites. Compos. A Appl. Sci. Manuf. 2020, 132, 105827. [Google Scholar] [CrossRef]
- Crawford, E.; Lesser, A. Mechanics of rubber particle cavitation in toughened polyvinylchloride (PVC). Polymer 2000, 41, 5865–5870. [Google Scholar] [CrossRef]
- Argon, A.; Cohen, R. Toughenability of polymers. Polymer 2003, 44, 6013–6032. [Google Scholar] [CrossRef]
- Rong, Q.; Zhu, A.; Zhong, T. Poly (styrene-n-butyl acrylate-methyl methacrylate)/silica nanocomposites prepared by emulsion polymerization. J. Appl. Polym. Sci. 2011, 120, 3654–3661. [Google Scholar] [CrossRef]
- L’Abee, R.; Li, W.; Goossens, H.; van Duin, M. Application of FTIR microscopy in combinatorial experimentation on polymer blends. Macromol. Symp. 2008, 265, 281–289. [Google Scholar] [CrossRef]
- Vieira, I.; Severgnini, V.; Mazera, D.; Soldi, M.; Pinheiro, E.; Pires, A.; Soldi, V. Effects of maleated ethylene propylene diene rubber (EPDM) on the thermal stability of pure polyamides, and polyamide/EPDM and polyamide/poly (ethylene terephthalate) blends: Kinetic parameters and reaction mechanism. Polym. Degrad. Stab. 2001, 74, 151–157. [Google Scholar] [CrossRef]
- Sunitha, K.; Kumar, Y.R.; Sridhar, S. Effect of PVP loading on pervaporation performance of poly (vinyl alcohol) membranes for THF/water mixtures. J. Mater. Sci. 2009, 44, 6280–6285. [Google Scholar] [CrossRef]
- Di Carlo, B.V.; Gottifredi, J.C.; Habert, A.C. Synthesis and characterization of composite membrane by deposition of acrylic acid plasma polymer onto pre-treated polyethersulfone support. J. Mater. Sci. 2011, 46, 1850–1856. [Google Scholar] [CrossRef]
- Aquino, K.A.D.S.; da Silva, F.F.; Araujo, E.S. Investigation of poly (vinyl chloride)/polystyrene mixture miscibility: Comparison of viscometry criteria with fourier transform infrared spectroscopy and refractive index measurements. J. Appl. Polym. Sci. 2011, 119, 2770–2777. [Google Scholar] [CrossRef]
- Ding, X.; Zhao, J.; Liu, Y.; Zhang, H.; Wang, Z. Silica nanoparticles encapsulated by polystyrene via surface grafting and in situ emulsion polymerization. Mater. Lett. 2004, 58, 3126–3130. [Google Scholar] [CrossRef]
- Wang, X.-F.; Yang, C.-J.; Yang, J.-H.; Wang, Y.; Zhang, J.-H. Toughening modification of polycarbonate/poly (butylene terephthalate) blends achieved by simultaneous addition of elastomer particles and carbon nanotubes. Compos. A Appl. Sci. Manuf. 2016, 90, 200–210. [Google Scholar] [CrossRef]
- Yu, M.; Cui, Z.; Ge, F.; Man, C.; Lei, L.; Wang, X. Fabrication of durable and roughness-regeneration superhydrophobic composite materials by hot pressing. Compos. B Eng. 2019, 179, 107431. [Google Scholar] [CrossRef]


| Experimental Group | 1 | 2 | 3 | 4 | 5 |
|---|---|---|---|---|---|
| PC/ASA (wt.%) | 70/30 | 70/30 | 70/30 | 70/30 | 70/30 |
| ACE (wt.%) | 0 | 5 | 10 | 20 | 30 |
| Tube 1 | Tube 2 | Tube 3 | Tube 4 | Tube 5 | Head |
|---|---|---|---|---|---|
| 245 °C | 245 °C | 250 °C | 255 °C | 260 °C | 260 °C |
| Tube 1 | Tube 2 | Tube 3 | Tube 4 | Mold |
|---|---|---|---|---|
| 245 °C | 250 °C | 255 °C | 260 °C | 70 °C |
| Blending System PC/ASA/ACE | Glass Transition Temperature | ||||
|---|---|---|---|---|---|
| Tg1 | ΔTg12 | Tg2 | ΔTg23 | Tg3 | |
| PC/ASA/ACE(70/30/0) | −38.1 | 151.4 | 113.3 | 37.2 | 150.5 |
| PC/ASA/ACE(70/30/5) | −33.1 | 146.3 | 113.2 | 33.9 | 147.1 |
| PC/ASA/ACE(70/30/10) | −34.2 | 147.6 | 113.4 | 34.3 | 147.7 |
| PC/ASA/ACE(70/30/20) | −35.1 | 147.8 | 112.7 | 34.6 | 147.3 |
| PC/ASA/ACE(70/30/30) | −33.7 | 145.5 | 111.8 | 32.9 | 144.7 |
| Sample | 0 wt.% ACE | 5 wt.% ACE | 10 wt.% ACE | 20 wt.% ACE | 30 wt.% ACE | 100 wt.% ACE |
|---|---|---|---|---|---|---|
| 5% weight loss/°C | 386.8 | 382.2 | 382.7 | 380.8 | 379.2 | 315.5 |
| Sample | 0 wt.% ACE | 5 wt.% ACE | 10 wt.% ACE | 20 wt.% ACE | 30 wt.% ACE |
|---|---|---|---|---|---|
| Toughness (J/m3) | 58.7 | 72.1 | 75.8 | 81.9 | 79.7 |
| Roughness Parameter | Unit | 0 wt.% ACE | 5 wt.% ACE | 10 wt.% ACE | 20 wt.% ACE | 30 wt.% ACE |
|---|---|---|---|---|---|---|
| Sa | μm | 0.89 | 2.74 | 4.95 | 10.96 | 3.75 |
| Sz | μm | 7.34 | 13.70 | 26.71 | 70.15 | 23.58 |
| Sdr | 0.05 | 0.08 | 0.24 | 0.29 | 0.08 |
| Carboxyl Index | 0 wt.% ACE | 5 wt.% ACE | 10 wt.% ACE | 20 wt.% ACE | 30 wt.% ACE |
|---|---|---|---|---|---|
| Unaged | 1.01 | 1.00 | 1.01 | 1.02 | 1.01 |
| After 80 cycles of aging time | 1.58 | 1.39 | 1.45 | 1.48 | 1.40 |
Publisher’s Note: MDPI stays neutral with regard to jurisdictional claims in published maps and institutional affiliations. |
© 2022 by the authors. Licensee MDPI, Basel, Switzerland. This article is an open access article distributed under the terms and conditions of the Creative Commons Attribution (CC BY) license (https://creativecommons.org/licenses/by/4.0/).
Share and Cite
Huang, J.; Kuo, C.; Tsai, H.-Y. Stiffness Enhancement, Anti-Aging, and Self-Forming Holes in Polycarbonate/Acrylonitrile-Styrene-Acrylic by the Core-Shell Structure of Acrylic Resin. Polymers 2022, 14, 782. https://doi.org/10.3390/polym14040782
Huang J, Kuo C, Tsai H-Y. Stiffness Enhancement, Anti-Aging, and Self-Forming Holes in Polycarbonate/Acrylonitrile-Styrene-Acrylic by the Core-Shell Structure of Acrylic Resin. Polymers. 2022; 14(4):782. https://doi.org/10.3390/polym14040782
Chicago/Turabian StyleHuang, Ji, Chunliang Kuo, and Hung-Yin Tsai. 2022. "Stiffness Enhancement, Anti-Aging, and Self-Forming Holes in Polycarbonate/Acrylonitrile-Styrene-Acrylic by the Core-Shell Structure of Acrylic Resin" Polymers 14, no. 4: 782. https://doi.org/10.3390/polym14040782