
Synthesis and Characterizations of Eco-Friendly Organosolv Lignin-Based Polyurethane Coating Films for the Coating Industry

 ,
,  , , and
Abstract
:
1. Introduction
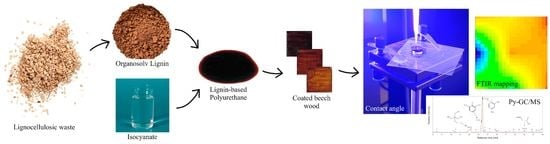
2. Materials and Methods
2.1. Materials
2.2. Methods
2.2.1. Polyurethane Synthesis
2.2.2. Coating Application
2.2.3. Pyrolysis-GC/MS
2.2.4. SEM
2.2.5. Weight Gain and Coating Film Thickness
2.2.6. Solid Content Analysis
2.2.7. Color Measurements
2.2.8. Optical Contact Angle
2.2.9. FTIR Spectroscopy and Mapping
2.2.10. Statistical Analysis
3. Results and Discussion
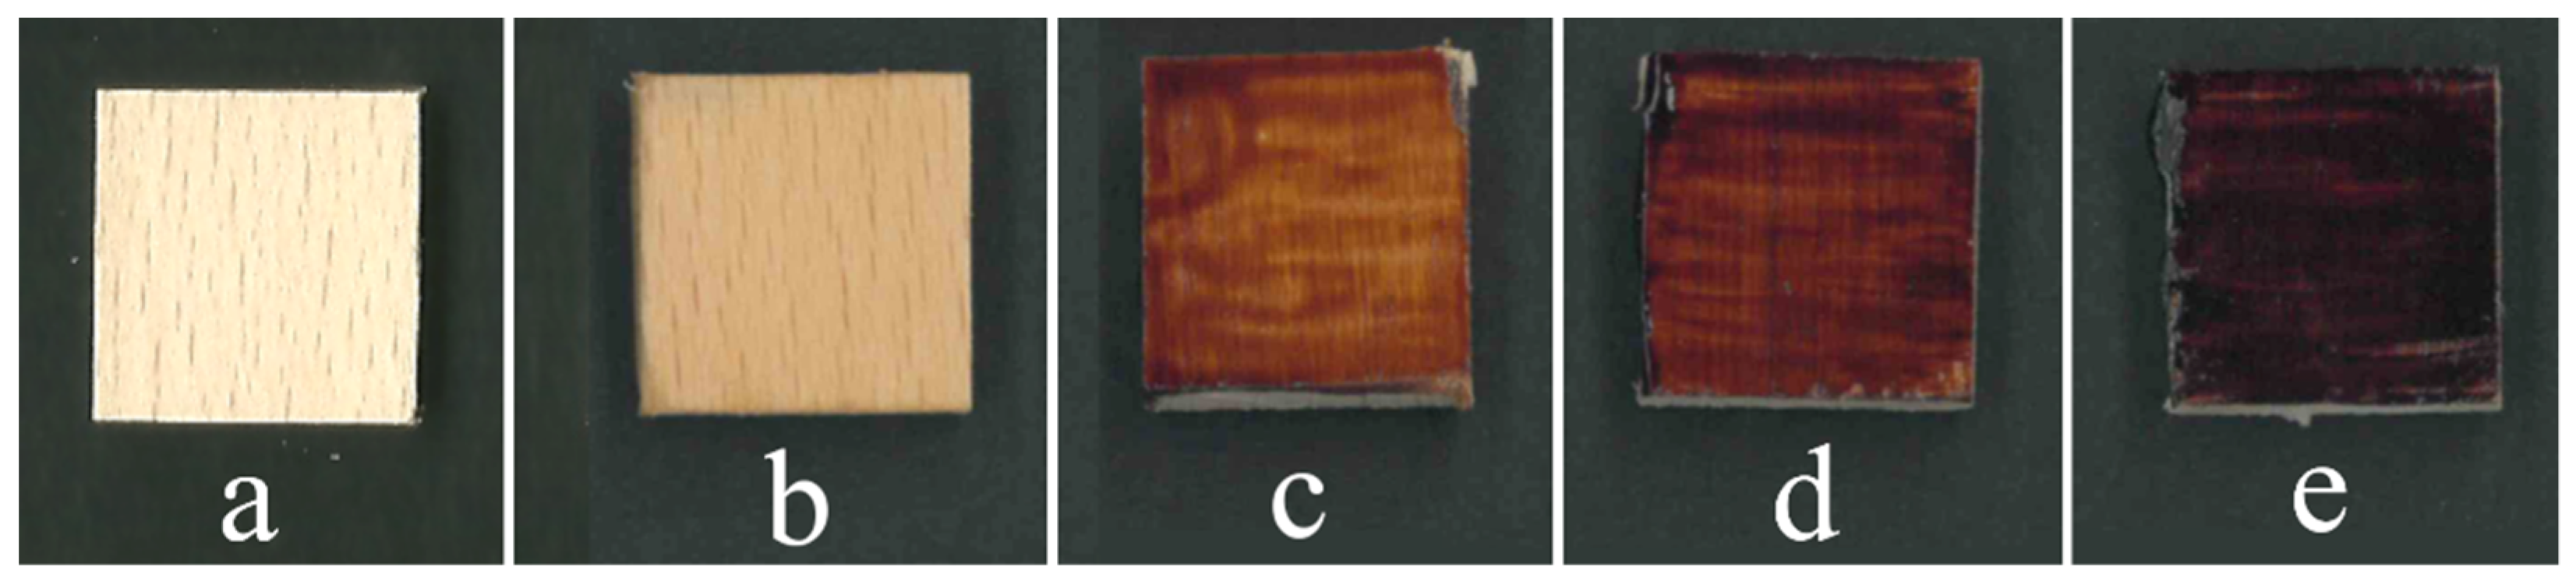
3.1. Color Measurements
3.2. Weight, Coating Film Thickness and Solid Content
3.3. Optical Contact Angle
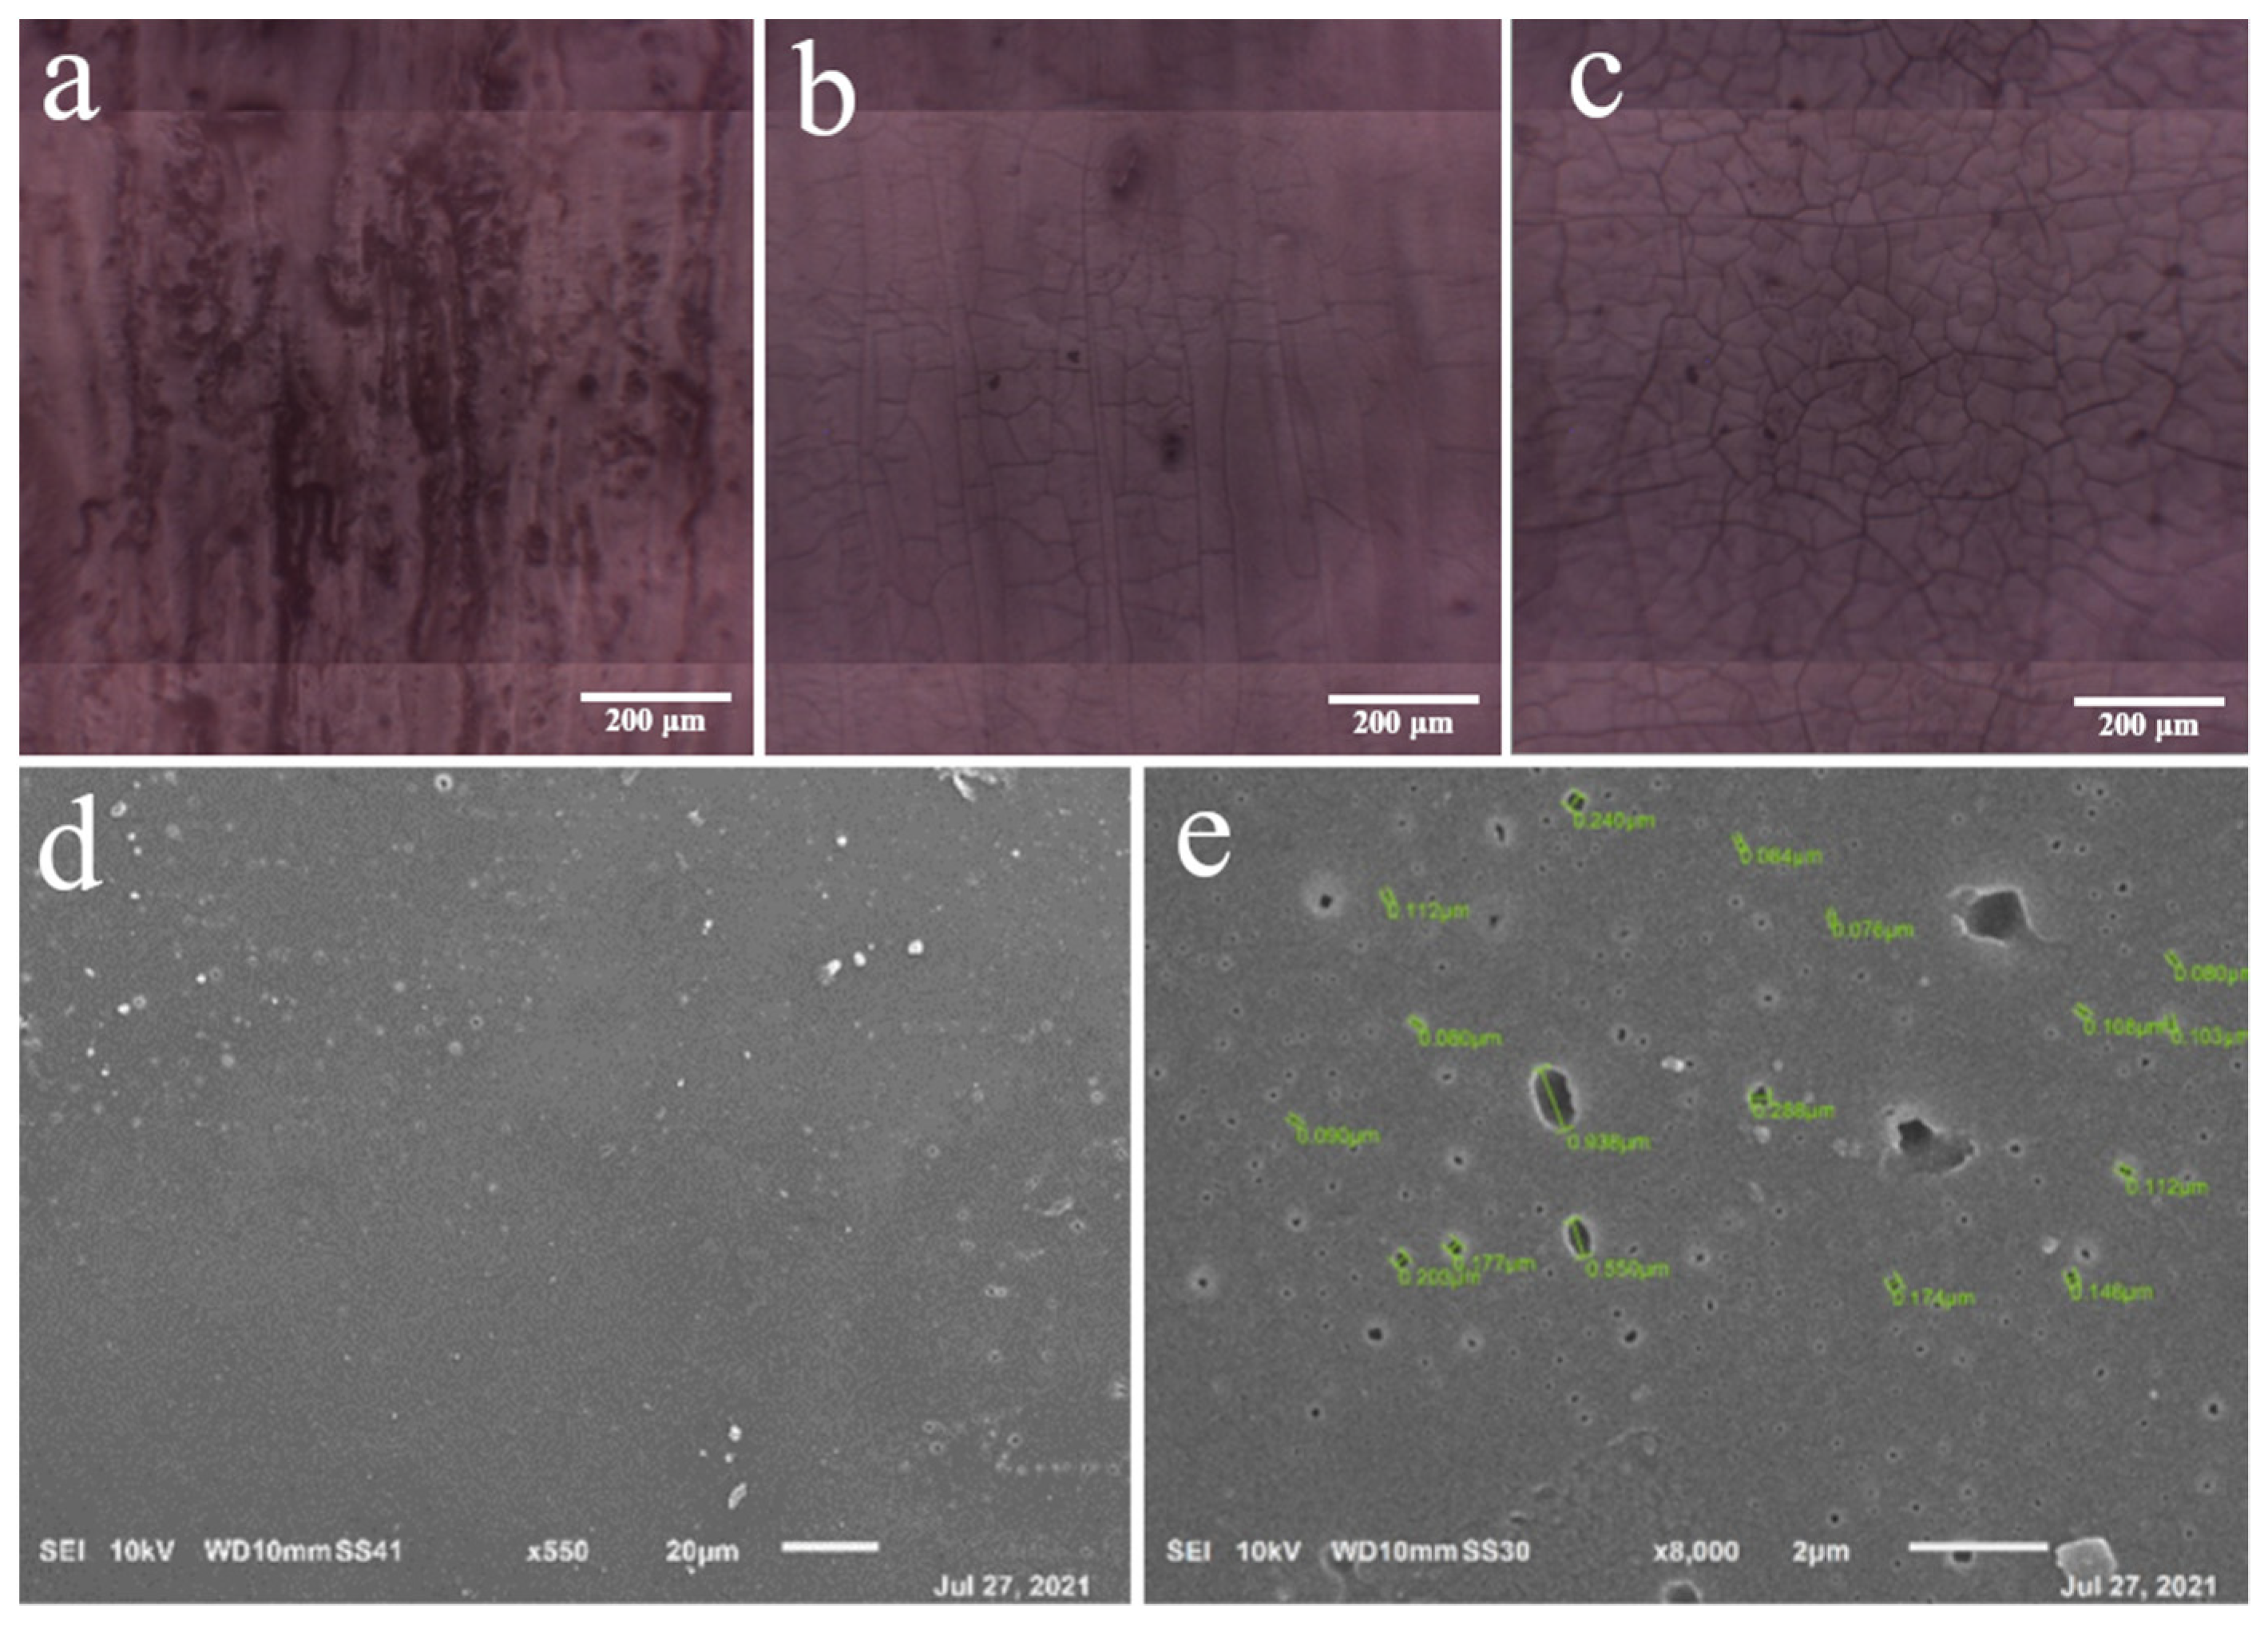
3.4. FTIR Microscopy and Scanning Electron Microscopy (SEM)
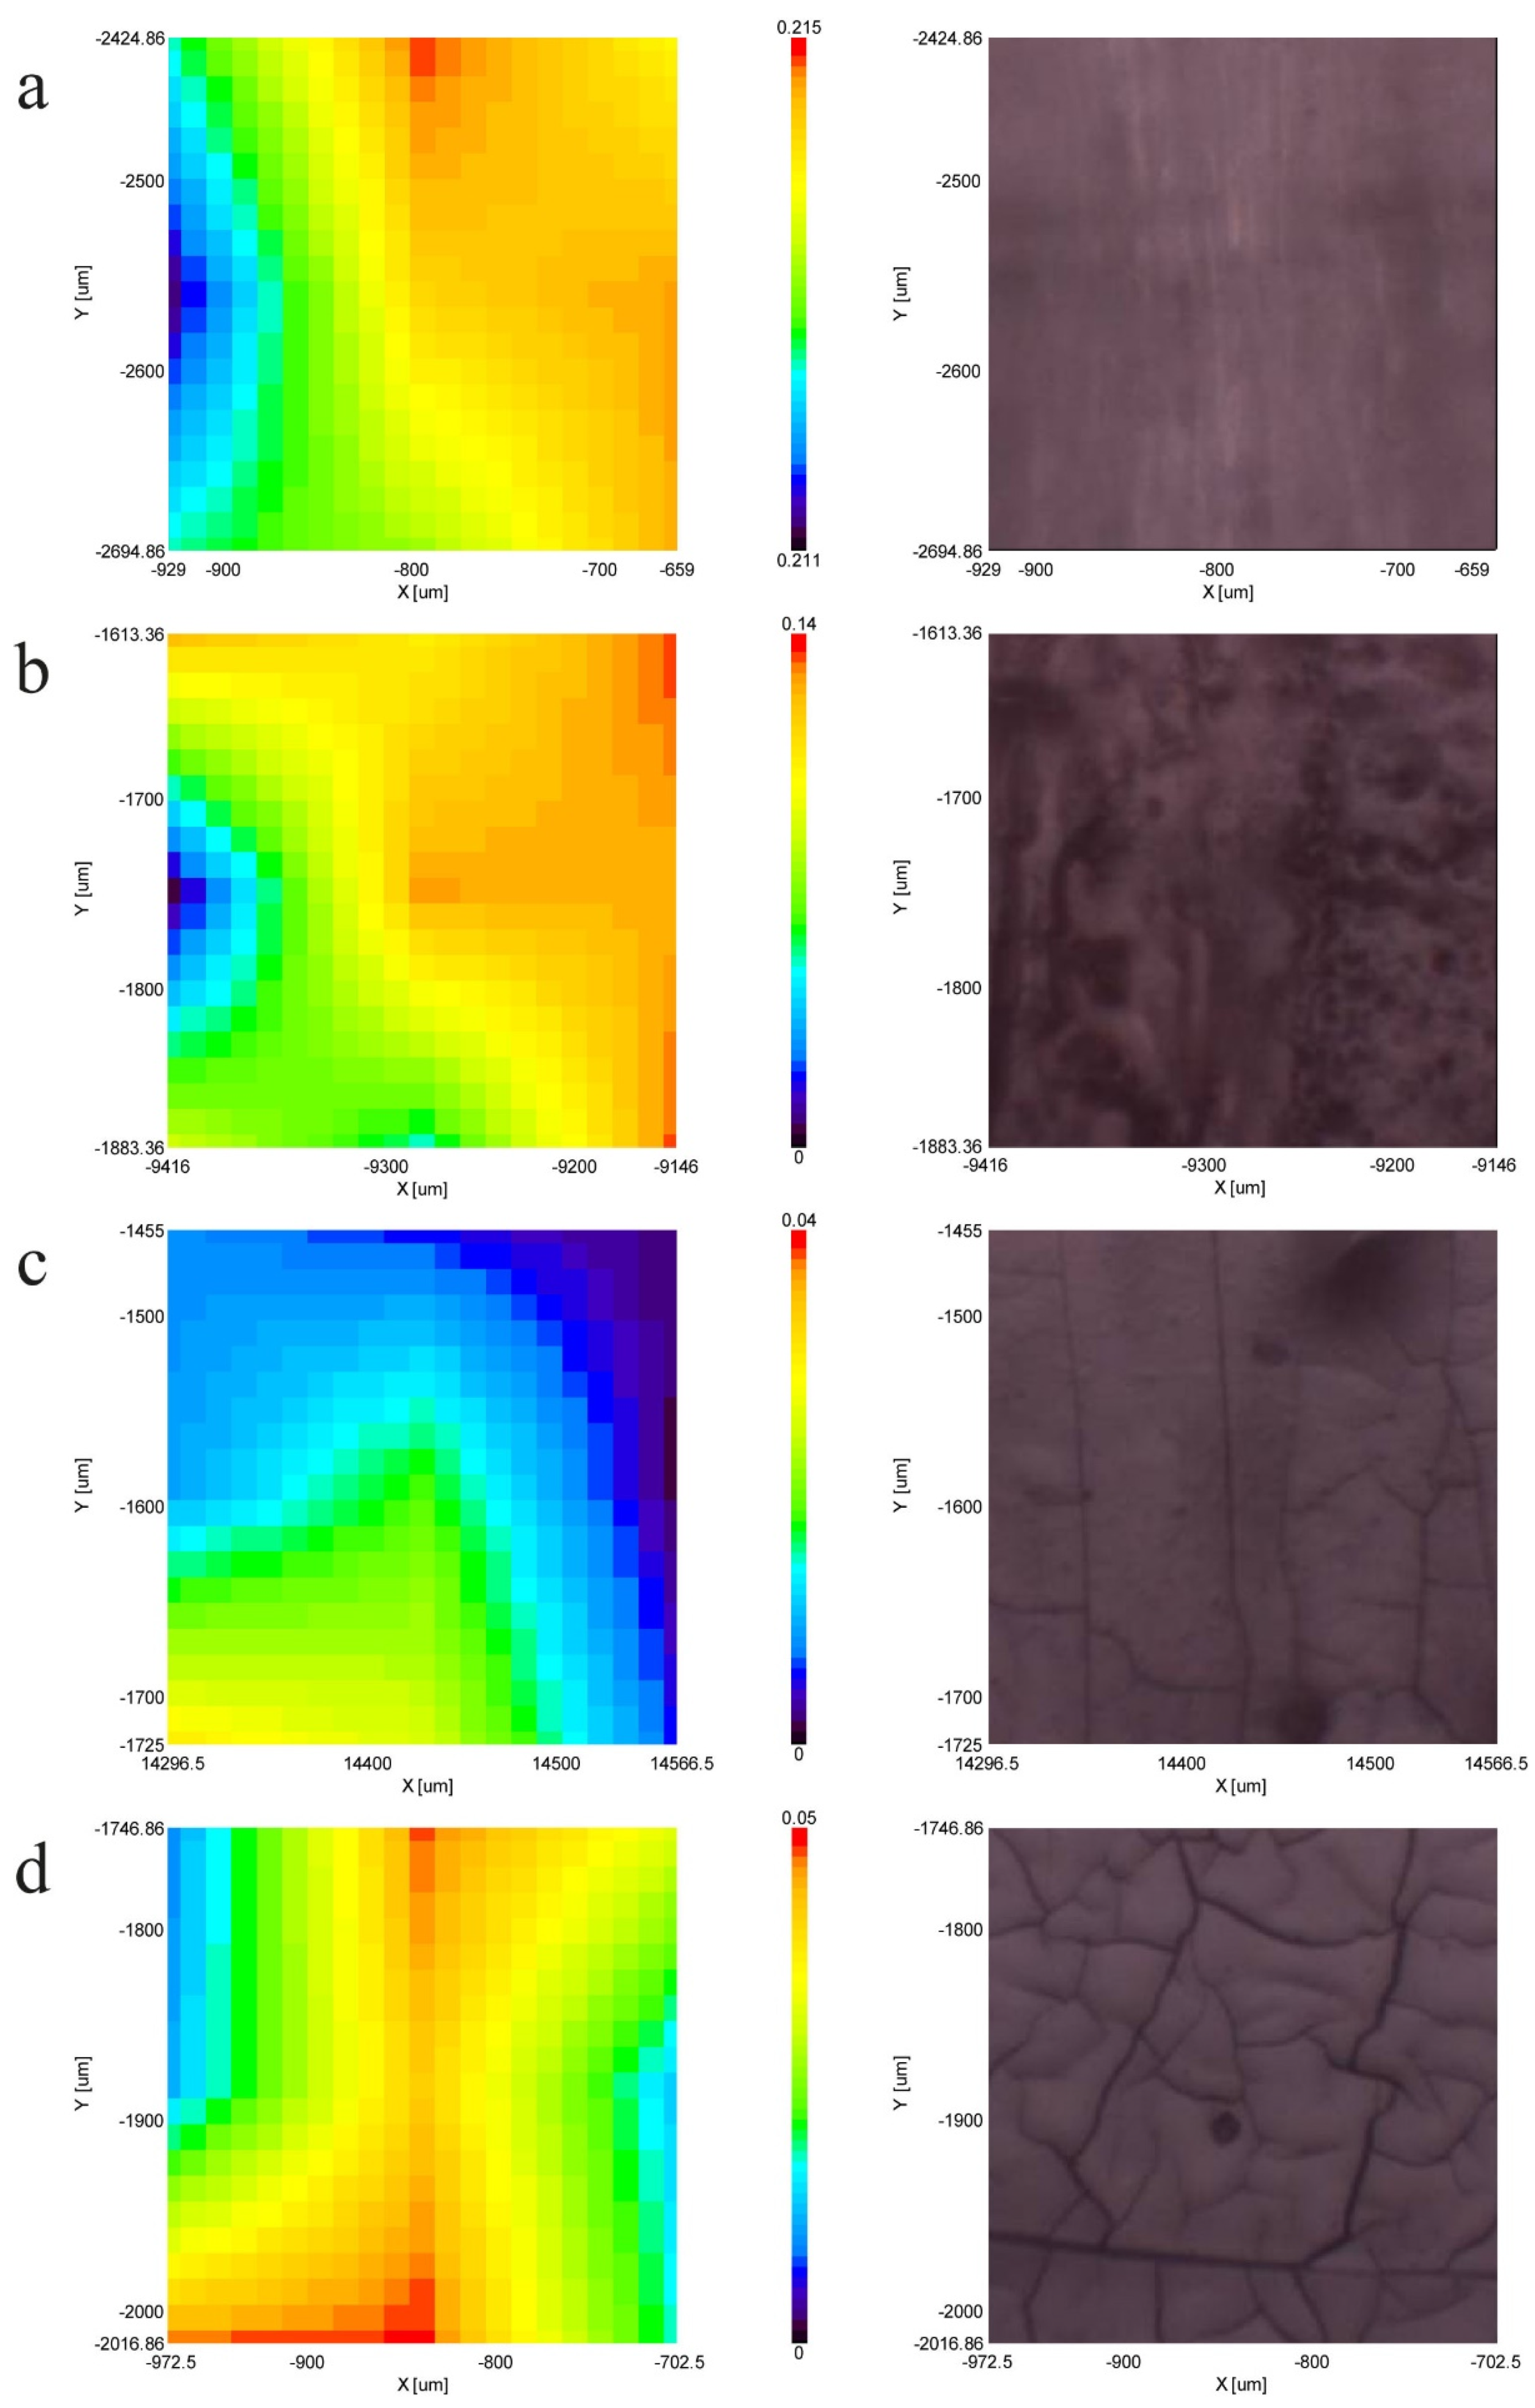
3.5. FTIR Spectroscopy and Imaging
3.6. Pyrolysis-GC/MS
4. Conclusions
Author Contributions
Funding
Institutional Review Board Statement
Informed Consent Statement
Data Availability Statement
Acknowledgments
Conflicts of Interest
References
- Tamantini, S.; Del Lungo, A.; Romagnoli, M.; Paletto, A.; Keller, M.; Bersier, J.; Zikeli, F. Basic Steps to Promote Biorefinery Value Chains in Forestry in Italy. Sustainability 2021, 13, 11731. [Google Scholar] [CrossRef]
- Nitzsche, R.; Gröngröft, A.; Köchermann, J.; Meisel, K.; Etzold, H.; Verges, M.; Leschinsky, M.; Bachmann, J.; Saake, B.; Torkler, S.; et al. Platform and fine chemicals from woody biomass: Demonstration and assessment of a novel biorefinery. Biomass Convers. Biorefin. 2020, 11, 2369–2385. [Google Scholar] [CrossRef]
- De Angelis, M.; Romagnoli, M.; Vek, V.; Poljanšek, I.; Oven, P.; Thaler, N.; Lesar, B.; Kržišnik, D.; Humar, M. Chemical composition and resistance of Italian stone pine (Pinus pinea L.) wood against fungal decay and wetting. Ind. Crop. Prod. 2018, 117, 187–196. [Google Scholar] [CrossRef]
- Füchtner, S.; Brock-Nannestad, T.; Smeds, A.; Fredriksson, M.; Pilgård, A.; Thygesen, L.G. Hydrophobic and Hydrophilic Extractives in Norway Spruce and Kurile Larch and Their Role in Brown-Rot Degradation. Front. Plant Sci. 2020, 11, 1–20. [Google Scholar] [CrossRef]
- Romagnoli, M.; Cavalli, D.; Pernarella, R.; Zanuttini, R.; Togni, M. Physical and mechanical characteristics of poor-quality wood after heat treatment. iForest-Biogeosci. For. 2015, 8, 884–891. [Google Scholar] [CrossRef] [Green Version]
- Khan, A.; Huang, K.; Sarwar, M.G.; Cheng, K.; Li, Z.; Tuhin, M.O.; Rabnawaz, M. Self-healing and self-cleaning clear coating. J. Colloid Interface Sci. 2020, 577, 311–318. [Google Scholar] [CrossRef] [PubMed]
- Jusic, J.; Tamantini, S.; Romagnoli, M.; Vinciguerra, V.; Di Mattia, E.; Zikeli, F.; Cavalera, M.; Scarascia Mugnozza, G. Improving sustainability in wood coating: Testing lignin and cellulose nanocrystals as additives to commercial acrylic wood coatings for bio-building. iForest-Biogeosci. For. 2021, 14, 499–507. [Google Scholar] [CrossRef]
- Thakur, V.K.; Thakur, M.K.; Raghavan, P.; Kessler, M.R. Progress in Green Polymer Composites from Lignin for Multifunctional Applications: A Review. ACS Sustain. Chem. Eng. 2014, 2, 1072–1092. [Google Scholar] [CrossRef]
- Mattos, B.D.; Tardy, B.L.; Magalhães, W.L.E.; Rojas, O.J. Controlled release for crop and wood protection: Recent progress toward sustainable and safe nanostructured biocidal systems. J. Control. Release 2017, 262, 139–150. [Google Scholar] [CrossRef] [PubMed]
- Papadopoulos, A.N.; Bikiaris, D.N.; Mitropoulos, A.C.; Kyzas, G.Z. Nanomaterials and Chemical Modifications for Enhanced Key Wood Properties: A Review. Nanomaterials 2019, 9, 607. [Google Scholar] [CrossRef] [Green Version]
- UNI EN 927-1:2013. Paints and Varnishes-Coating Materials and Coating Systems for Exterior Wood—Part 1: Classification and Selection; UNI: Milan, Italy, 2013. [Google Scholar]
- Singh, T.; Singh, A.P. A review on natural products as wood protectant. Wood Sci. Technol. 2011, 46, 851–870. [Google Scholar] [CrossRef]
- Teacǎ, C.A.; Rosu, D.; Mustaţǎ, F.; Rusu, T.; Roşu, L.; Irina, R.; Varganici, C.-D. Natural bio-based products for wood coating and protection against degradation: A Review. BioResources 2019, 14, 4873–4901. [Google Scholar] [CrossRef]
- Bulian, F.; Graystone, J.A. Chapter 3-raw materials for wood coatings (1)-film formers (binders, resins and polymers). In Wood Coatings; Bulian, F., Graystone, J.A., Eds.; Elsevier: Amsterdam, The Netherlands, 2009; pp. 53–94. [Google Scholar] [CrossRef]
- Ahvazi, B.; Wojciechowicz, O.; Ton-That, T.-M.; Hawari, J. Preparation of Lignopolyols from Wheat Straw Soda Lignin. J. Agric. Food Chem. 2011, 59, 10505–10516. [Google Scholar] [CrossRef] [Green Version]
- Aristri, M.A.; Lubis, M.A.R.; Yadav, S.M.; Antov, P.; Papadopoulos, A.N.; Pizzi, A.; Fatriasari, W.; Ismayati, M.; Iswanto, A.H. Recent Developments in Lignin- and Tannin-Based Non-Isocyanate Polyurethane Resins for Wood Adhesives—A Review. Appl. Sci. 2021, 11, 4242. [Google Scholar] [CrossRef]
- Jia, Z.; Lu, C.; Zhou, P.; Wang, L. Preparation and characterization of high boiling solvent lignin-based polyurethane film with lignin as the only hydroxyl group provider. RSC Adv. 2015, 5, 53949–53955. [Google Scholar] [CrossRef]
- Wang, Y.-Y.; Cal, C.M.; Ragauskas, A.J. Recent advances in lignin-based polyurethanes. Tappi J. 2017, 16, 203–207. [Google Scholar] [CrossRef]
- Stachak, P.; Łukaszewska, I.; Hebda, E.; Pielichowski, K. Recent Advances in Fabrication of Non-Isocyanate Polyurethane-Based Composite Materials. Materials 2021, 14, 3497. [Google Scholar] [CrossRef]
- Rokicki, G.; Parzuchowski, P.G.; Mazurek, M. Non-isocyanate polyurethanes: Synthesis, properties, and applications. Polym. Adv. Technol. 2015, 26, 707–761. [Google Scholar] [CrossRef]
- Wei, D.; Zeng, J.; Yong, Q. High-Performance Bio-Based Polyurethane Antismudge Coatings Using Castor Oil-Based Hyperbranched Polyol as Superior Cross-Linkers. ACS Appl. Polym. Mater. 2021, 3, 3612–3622. [Google Scholar] [CrossRef]
- Alinejad, M.; Henry, C.; Nikafshar, S.; Gondaliya, A.; Bagheri, S.; Chen, N.; Singh, S.K.; Hodge, D.B.; Nejad, M. Lignin-Based Polyurethanes: Opportunities for Bio-Based Foams, Elastomers, Coatings and Adhesives. Polymers 2019, 11, 1202. [Google Scholar] [CrossRef] [PubMed] [Green Version]
- Balakshin, M.Y.; Capanema, E.A.; Sulaeva, I.; Schlee, P.; Huang, Z.; Feng, M.; Borghei, M.; Rojas, O.J.; Potthast, A.; Rosenau, T. New Opportunities in the Valorization of Technical Lignins. ChemSusChem 2021, 14, 1016–1036. [Google Scholar] [CrossRef]
- Ralph, J.; Lapierre, C.; Boerjan, W. Lignin structure and its engineering. Curr. Opin. Biotechnol. 2019, 56, 240–249. [Google Scholar] [CrossRef] [PubMed]
- Gadhave, R.V.; Kasbe, P.S.; Mahanwar, P.A.; Gadekar, P.T. Synthesis and characterization of lignin-polyurethane based wood adhesive. Int. J. Adhes. Adhes. 2019, 95, 102427. [Google Scholar] [CrossRef]
- Zikeli, F.; Vinciguerra, V.; D’Annibale, A.; Capitani, D.; Romagnoli, M.; Scarascia Mugnozza, G. Preparation of Lignin Nanoparticles from Wood Waste for Wood Surface Treatment. Nanomaterials 2019, 9, 281. [Google Scholar] [CrossRef] [Green Version]
- Pan, X.; Saddler, J.N. Effect of replacing polyol by organosolv and kraft lignin on the property and structure of rigid polyurethane foam. Biotechnol. Biofuels 2013, 6, 1–10. [Google Scholar] [CrossRef] [Green Version]
- Faix, O.; Meier, D.; Fortmann, I. Thermal degradation products of wood: Gas chromatographic separation and mass spectrometric characterization of monomeric lignin derived products. Holz Als Roh- Und Werkst. 1990, 48, 281–285. [Google Scholar] [CrossRef]
- Faix, O.; Meier, D.; Fortmann, I. Thermal degradation products of wood: A collection of electron-impact (EI) mass spectra of monomeric lignin derived products. Holz Als Roh- Und Werkst. 1990, 48, 351–354. [Google Scholar] [CrossRef]
- UNI EN ISO/CIE 11664-4:2019. Colorimetry—Part 4: CIE 1976 L*a*b* Colour Space; UNI: Milan, Italy, 2019. [Google Scholar]
- UNI EN 927-6:2019. Paints and Varnishes-Coating Materials and Coating Systems for Exterior Wood—Part 6: Exposure of Wood Coatings to Artificial Weathering Using Fluorescent Uv Lamps and Water; UNI: Milan, Italy, 2019. [Google Scholar]
- Klein, S.E.; Rumpf, J.; Kusch, P.; Albach, R.; Rehahn, M.; Witzleben, S.; Schulze, M. Unmodified kraft lignin isolated at room temperature from aqueous solution for preparation of highly flexible transparent polyurethane coatings. RSC Adv. 2018, 8, 40765–40777. [Google Scholar] [CrossRef] [Green Version]
- Griffini, G.; Passoni, V.; Suriano, R.; Levi, M.; Turri, S. Polyurethane Coatings Based on Chemically Unmodified Fractionated Lignin. ACS Sustain. Chem. Eng. 2015, 3, 1145–1154. [Google Scholar] [CrossRef]
- Lang, J.M.; Shrestha, U.M.; Dadmun, M. The Effect of Plant Source on the Properties of Lignin-Based Polyurethanes. Front. Energy Res. 2018, 6, 1–12. [Google Scholar] [CrossRef] [Green Version]
- Nasar, A.S.; Kalaimani, S. Synthesis and studies on forward and reverse reactions of phenol-blocked polyisocyanates: An insight into blocked isocyanates. RSC Adv. 2016, 6, 76802–76812. [Google Scholar] [CrossRef]
- Chauhan, M.; Gupta, M.; Singh, B.; Singh, A.; Gupta, V. Effect of functionalized lignin on the properties of lignin–isocyanate prepolymer blends and composites. Eur. Polym. J. 2014, 52, 32–43. [Google Scholar] [CrossRef]
- Faix, O. Classification of Lignins from Different Botanical Origins by FT-IR Spectroscopy. Holzforschung 1991, 45, 21–28. [Google Scholar] [CrossRef]
- Bandekar, J.; Klima, S. FT-IR spectroscopic studies of polyurethanes Part I. Bonding between urethane C-O-C groups and the NH Groups. J. Mol. Struct. 1991, 263, 45–57. [Google Scholar] [CrossRef]
- Zikeli, F.; Vinciguerra, V.; Taddei, A.R.; D’Annibale, A.; Romagnoli, M.; Scarascia Mugnozza, G. Isolation and characterization of lignin from beech wood and chestnut sawdust for the preparation of lignin nanoparticles (LNPs) from wood industry side-streams. Holzforschung 2018, 72, 961–972. [Google Scholar] [CrossRef]
- Jiao, L.; Xiao, H.; Wang, Q.; Sun, J. Thermal degradation characteristics of rigid polyurethane foam and the volatile products analysis with TG-FTIR-MS. Polym. Degrad. Stab. 2013, 98, 2687–2696. [Google Scholar] [CrossRef]


| Abbreviation | Formulation |
|---|---|
| PU-R | Reference sample: commercial polyurethane-based coating |
| PU-3:1 | Lignin-based polyurethane, isocyanate:lignin ratio = 3:1 |
| PU-1:1 | Lignin-based polyurethane, isocyanate:lignin ratio = 1:1 |
| PU-1:3 | Lignin-based polyurethane, isocyanate:lignin ratio = 1:3 |
| W-R | Reference sample: uncoated beech wood |
| WPU-R | Reference sample: beech wood coated with PU-R |
| WPU-3:1 | Beech wood coated with PU-3:1 |
| WPU-1:1 | Beech wood coated with PU-1:1 |
| WPU-1:3 | Beech wood coated with PU-1:3 |
| Before Coating (W-R) | After Coating | ||||||
|---|---|---|---|---|---|---|---|
| L* | a* | b* | L* | a* | b* | ΔE* | |
| WPU-R | 85.8 ± 3.8 | 6.4 ± 2.2 | 19.8 ± 2.0 | 71.8 ± 2.0 *** | 11.3 ± 1.1 | 31.4 ± 2.6 | 19.5 ± 4.9 *** |
| WPU-3:1 | 85.6 ± 6.7 | 6.0 ± 2.4 | 20.3 ± 2.6 | 37.6 ± 5.3 *** | 26.4 ± 2.6 *** | 30.0 ± 5.5 | 54.7 ± 7.6 *** |
| WPU-1:1 | 86.2 ± 3.5 | 5.9 ± 2.0 | 21.3 ± 2.0 | 21.0 ± 4.3 *** | 21.1 ± 4.2 *** | 11.4 ± 5.8 *** | 68.7 ± 5.7 *** |
| WPU-1:3 | 90.1 ± 2.4 | 4.0 ± 1.8 | 19.7 ± 2.4 | 10.8 ± 2.5 *** | 7.8 ± 5.7 | 0.3 ± 1.0 *** | 82.3 ± 3.9 *** |
| Mean W-R | 86.9 ± 7.3 | 5.6 ± 2.9 | 20.3 ± 3.0 | ||||
| Weight Gain (%) | Thickness (μm) | SC (%) | |
|---|---|---|---|
| WPU-R | 5.2 ± 1.7 | 28.2 ± 20.6 | 57.1 1 |
| WPU-3:1 | 0.6 ± 1.7 *** | 25.9 ± 7.0 | 45.1 2 |
| WPU-1:1 | 0.8 ± 1.6 *** | 28.1 ± 7.1 | 47.1 3 |
| WPU-1:3 | 0.7 ± 1.3 *** | 27.8 ± 9.2 | 51.0 4 |
| CA-T0 (°) | CA-T10 (°) | CA-T600 (°) | |
|---|---|---|---|
| W-R | 93.9 ± 4.0 | 76.6 ± 5.9 | - |
| WPU-R | 89.5 ± 6.1 | 89.1 ± 6.2 | 79.9 ± 6.6 |
| WPU-3:1 | 82.0 ± 8.2 | 79.7 ± 7.8 | 69.1 ± 9.6 |
| WPU-1:1 | 79.8 ± 8.1 | 77.3 ± 8.5 | 54.7 ± 10.7 ** |
| WPU-1:3 | 79.0 ± 7.7 | 70.4 ± 5.4 ** | - |
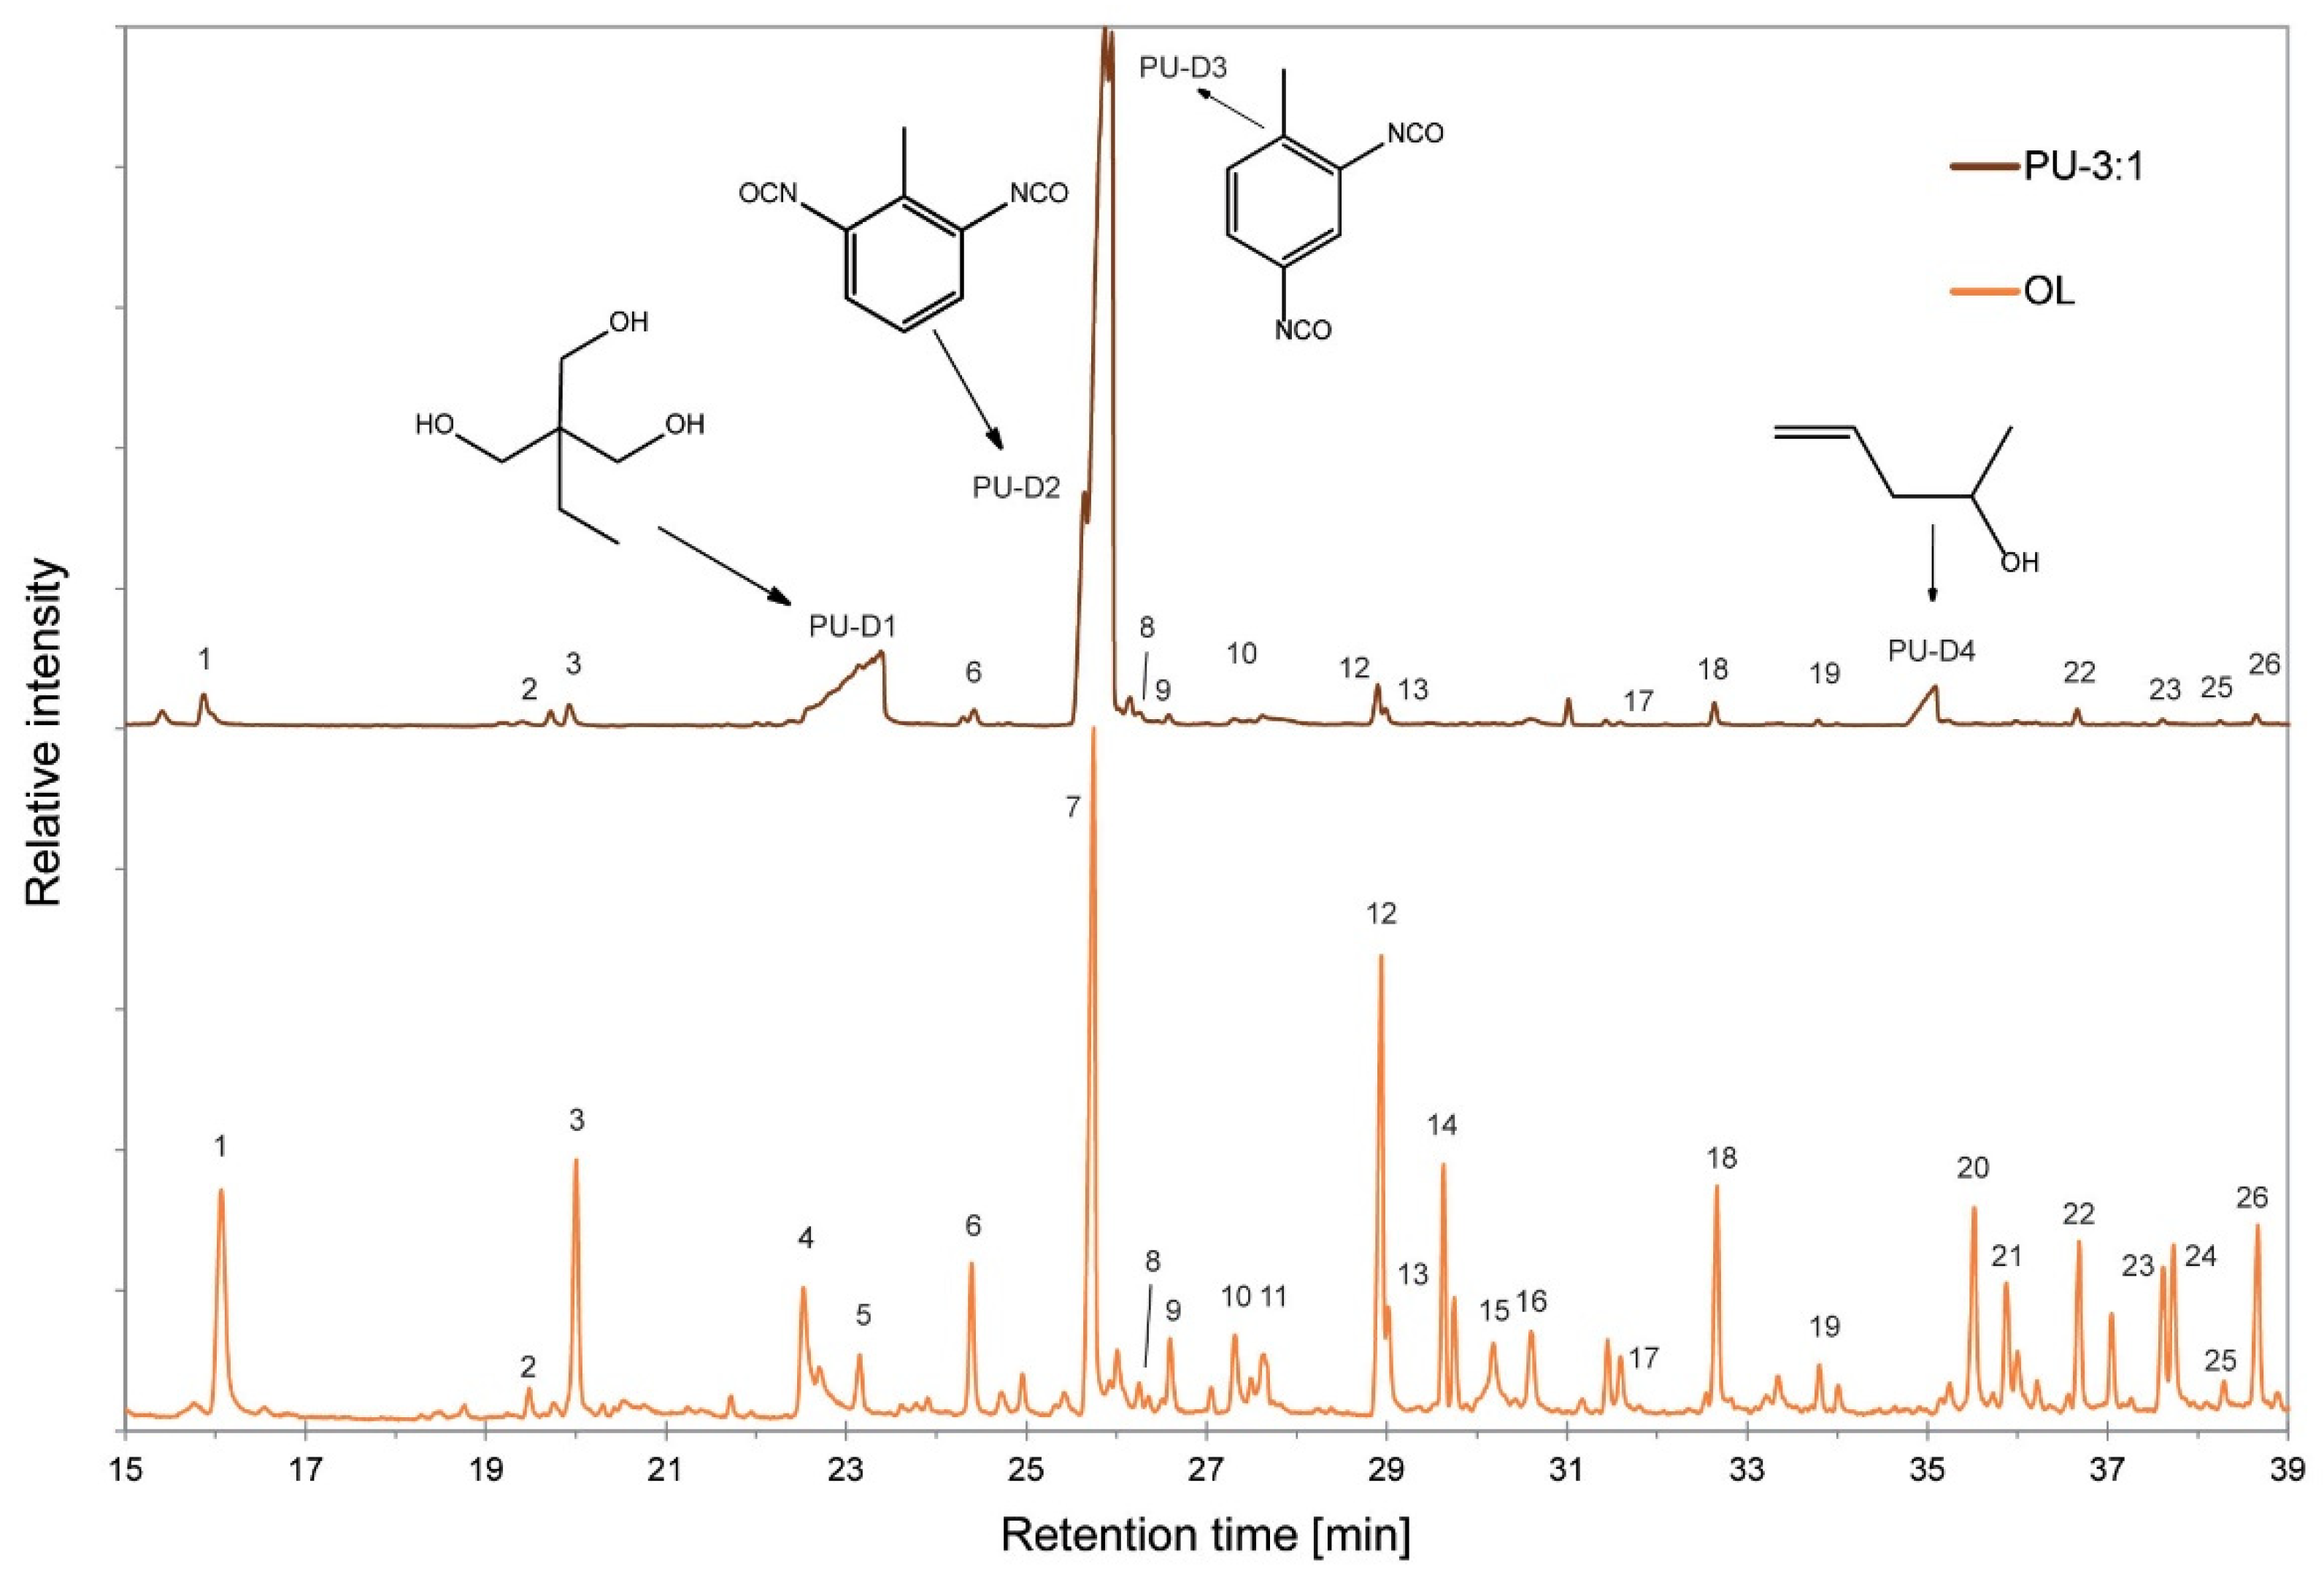
| # | Pyrolysis Product | RT (min) | PU-3:1 (%) | OL (%) |
|---|---|---|---|---|
| 1 | Guaiacol | 16.07 | 1.3 | 6.7 |
| 2 | 5-Methylguaiacol | 19.48 | 0.4 | 0.5 |
| 3 | Creosol | 20.01 | 0.7 | 4.6 |
| 4 | 5-Methoxyresinol | 22.53 | - | 2.8 |
| PU-D1 | Trimethylolpropane | 23.13 | 15.0 | - |
| 5 | 4-Ethylguaiacol | 23.15 | - | 1.0 |
| 6 | 4-Vinylguaiacol | 24.39 | 0.7 | 2.6 |
| PU-D2 | 2.6-Diisocyanate toluene | 25.65 | 9.1 | - |
| 7 | Syringol | 25.75 | - | 15.1 |
| PU-D3 | 2,4-Diisocyanate toluene | 25.95 | 63.3 | - |
| 8 | Dihydroeugenol | 26.25 | - | 0.4 |
| 9 | Methylsyringol | 26.60 | 0.2 | 1.1 |
| 10 | Vanillin | 27.31 | 0.1 | 1.6 |
| 11 | Isoeugenol, cis | 27.63 | - | 1.4 |
| 12 | Vanillic acid | 28.94 | 1.1 | 8.5 |
| 13 | Isoeugenol, trans | 29.01 | 0.4 | 1.6 |
| 14 | Lauryl chloride | 29.63 | - | 3.4 |
| 15 | 1-Dodecanol | 29.75 | - | 1.6 |
| 16 | Acetoguaiacone | 30.18 | - | 0.9 |
| 17 | Guaiacylacetone | 31.59 | 0.1 | 0.9 |
| 18 | 3,5-Dimethoxyacetophenone | 32.67 | 0.6 | 3.9 |
| 19 | Methoxyeugenol | 33.80 | 0.1 | 0.7 |
| PU-D4 | 4-Penten-2-ol | 35.08 | 2.7 | - |
| 20 | Syringaldehyde | 35.52 | - | 3.7 |
| 21 | Myristyl chloride | 35.89 | - | 2.7 |
| 22 | Ferulic acid | 36.68 | 0.4 | 2.8 |
| 23 | Acetosyringone | 37.61 | 0.1 | 2.6 |
| 24 | Myristyl alcohol | 37.73 | - | 2.7 |
| 25 | Stearic acid | 38.29 | 0.1 | 0.4 |
| 26 | Homosyringic acid | 38.67 | 0.3 | 3.2 |
| S/G ratio | - | 1.0 |
Publisher’s Note: MDPI stays neutral with regard to jurisdictional claims in published maps and institutional affiliations. |
© 2022 by the authors. Licensee MDPI, Basel, Switzerland. This article is an open access article distributed under the terms and conditions of the Creative Commons Attribution (CC BY) license (https://creativecommons.org/licenses/by/4.0/).
Share and Cite
Bergamasco, S.; Tamantini, S.; Zikeli, F.; Vinciguerra, V.; Scarascia Mugnozza, G.; Romagnoli, M. Synthesis and Characterizations of Eco-Friendly Organosolv Lignin-Based Polyurethane Coating Films for the Coating Industry. Polymers 2022, 14, 416. https://doi.org/10.3390/polym14030416
Bergamasco S, Tamantini S, Zikeli F, Vinciguerra V, Scarascia Mugnozza G, Romagnoli M. Synthesis and Characterizations of Eco-Friendly Organosolv Lignin-Based Polyurethane Coating Films for the Coating Industry. Polymers. 2022; 14(3):416. https://doi.org/10.3390/polym14030416
Chicago/Turabian StyleBergamasco, Sara, Swati Tamantini, Florian Zikeli, Vittorio Vinciguerra, Giuseppe Scarascia Mugnozza, and Manuela Romagnoli. 2022. "Synthesis and Characterizations of Eco-Friendly Organosolv Lignin-Based Polyurethane Coating Films for the Coating Industry" Polymers 14, no. 3: 416. https://doi.org/10.3390/polym14030416