
Analysis of Particle Variation Effect on Flexural Properties of Hollow Glass Microsphere Filled Epoxy Matrix Syntactic Foam Composites

Abstract
:
1. Introduction
2. Materials and Methods
2.1. Materials
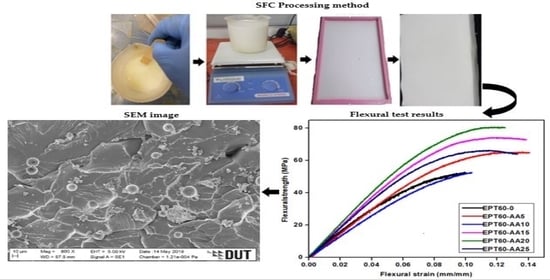
2.2. Fabrication of Syntactic Foam Composites
2.3. Particle Size Distribution Analysis
2.4. Design Experimentation and Specimen Coding
2.5. Flexural Test
2.6. Scanning Electron Microscopy (SEM), Thermogravimetric Analysis (TGA), and Dynamic Mechanical Analysis (DMA)
3. Results and Discussion
3.1. Flexural Properties of Syntactic Foam Composites
3.2. SEM Micrographs of Syntactic Foam Composite
3.3. Thermal Analysis
3.3.1. Thermogravimetric Analysis (TGA)
3.3.2. Dynamic Mechanical Analysis
Storage Modulus
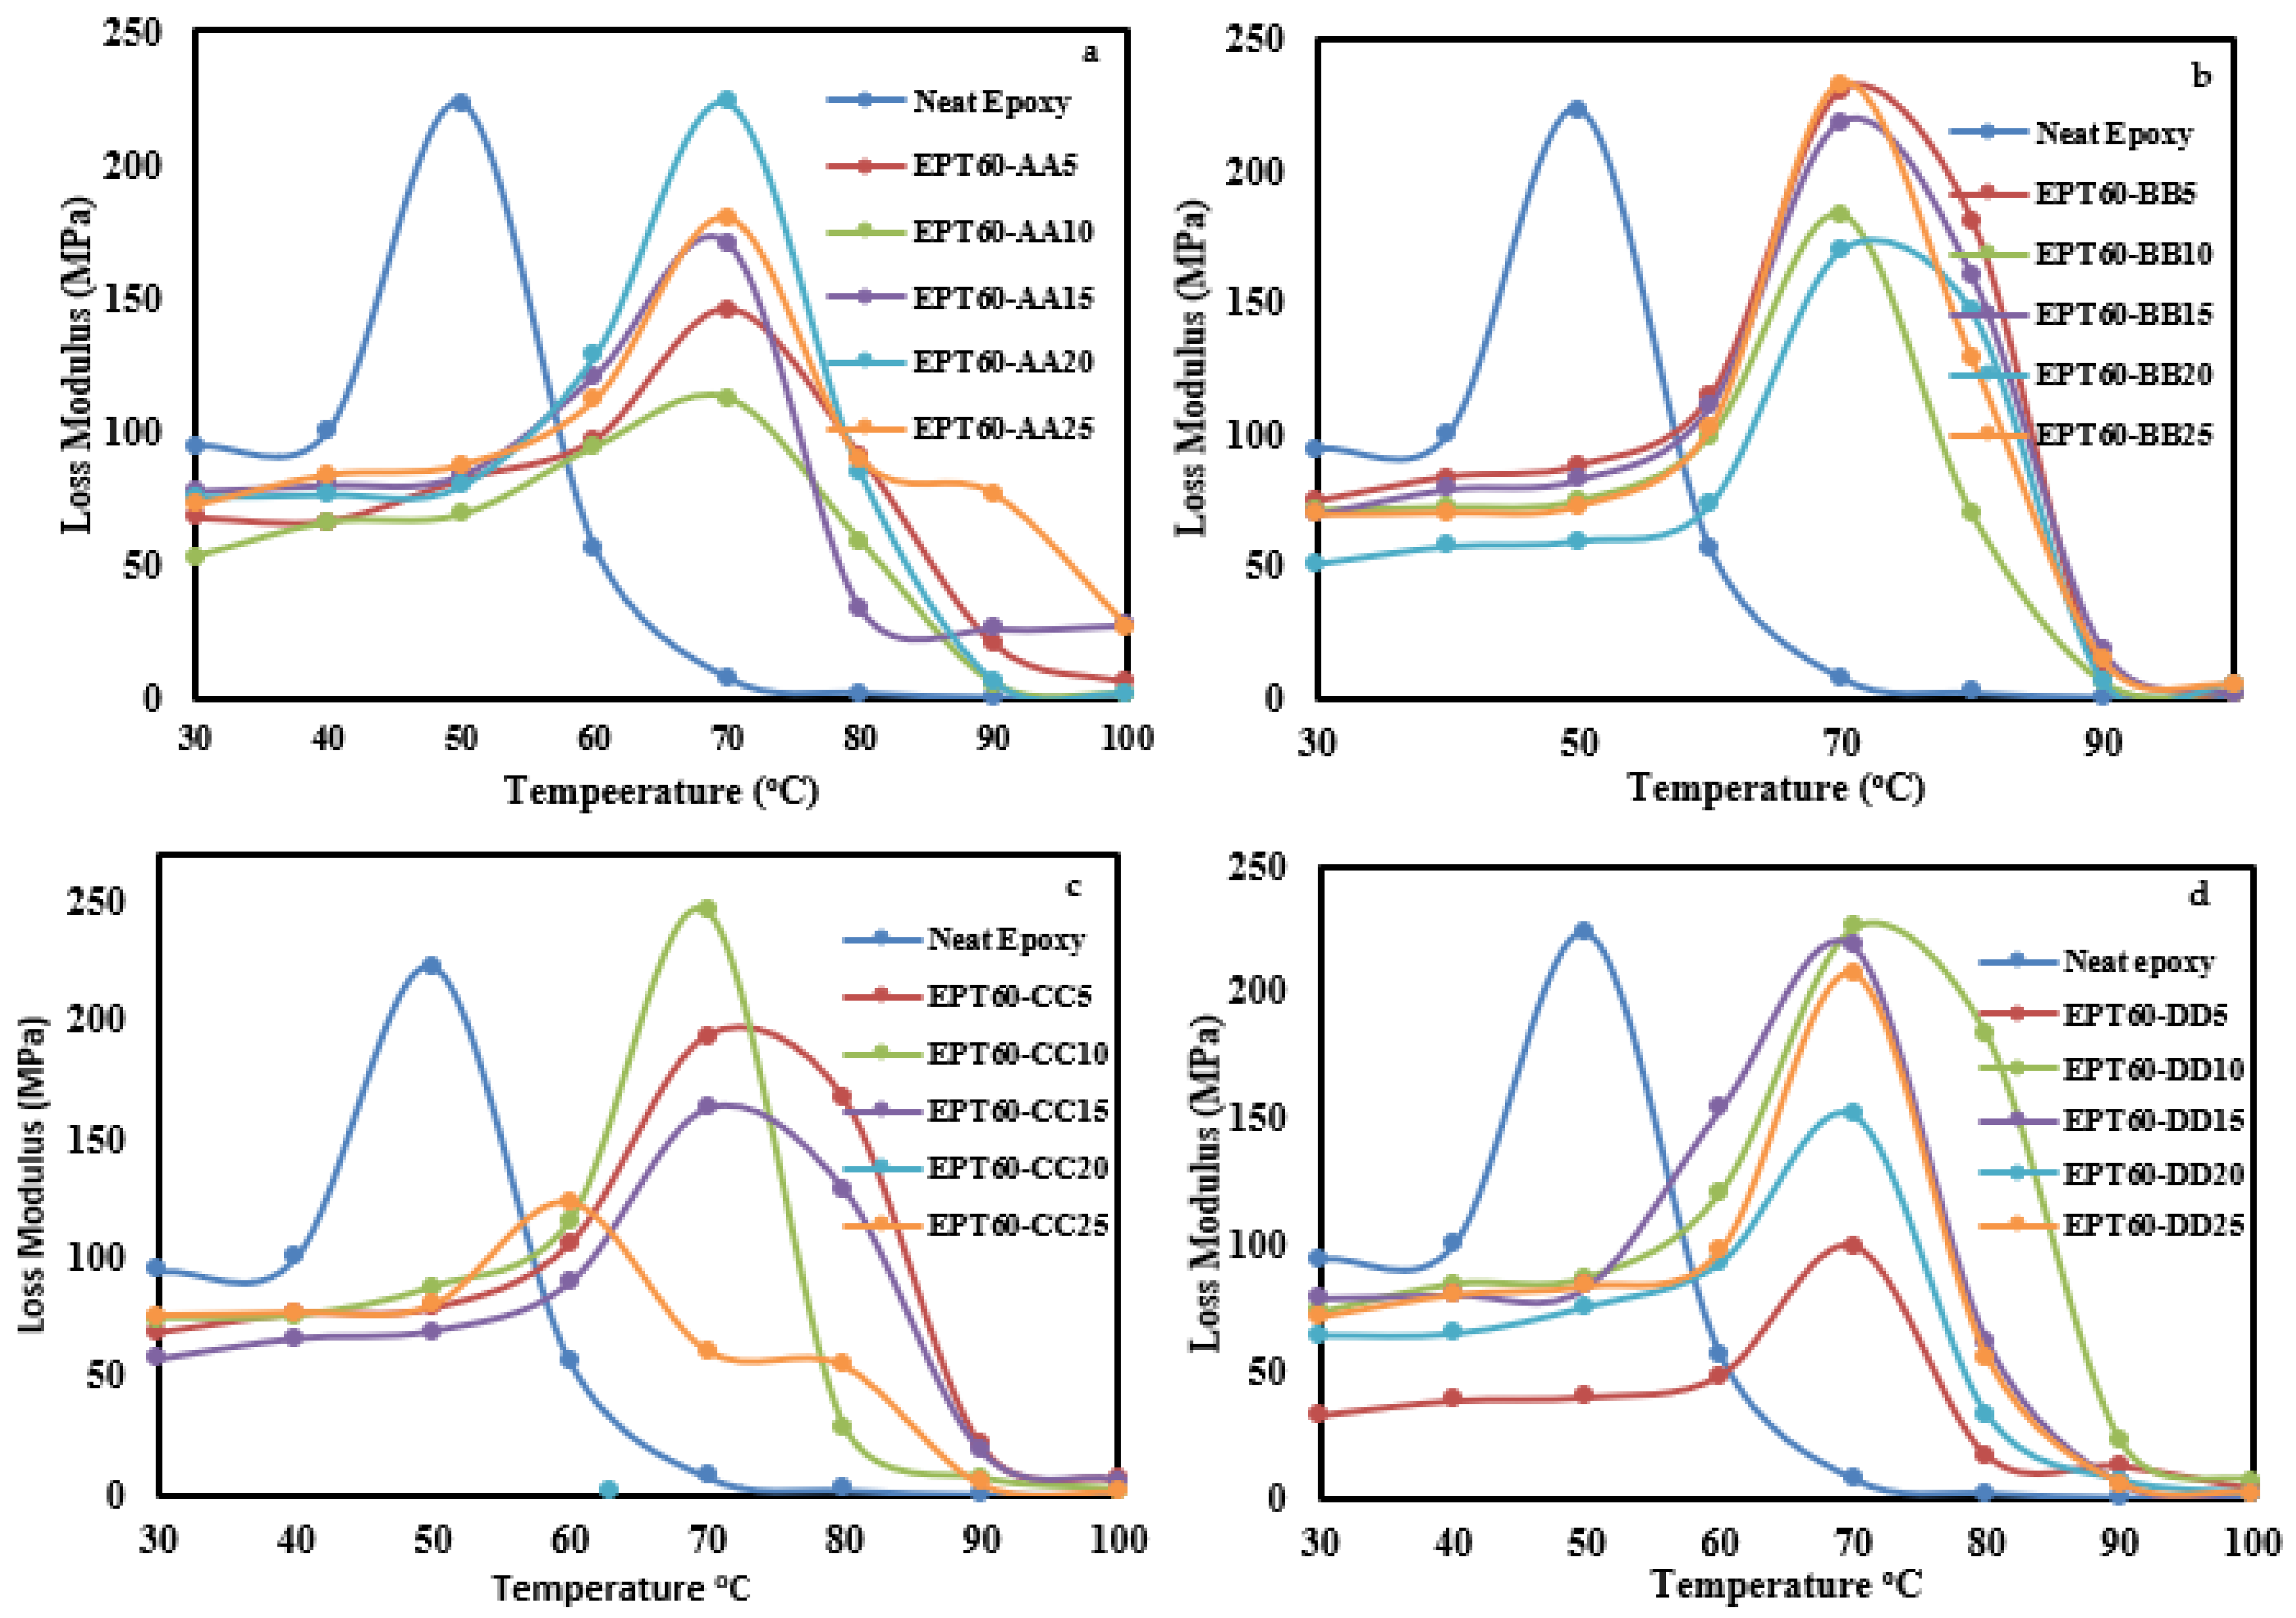
Loss Modulus
Tan Delta
4. Conclusions
- The particle size distribution (Vd) was highest at BB with 31.02%. This shows that HGM distribution at particle size ranges is more uniform than the others;
- The results showed that flexural stress and strain of the syntactic foam composites increased with the inclusion of the HGM filler more than the neat epoxy for all the size variations and volume fractions except at EPT60-AA10 and EPT60-CC25, which can be considered insignificant because of the small percentage difference, i.e., 1.6% and 2.6% respectively less than the neat epoxy;
- The flexural modulus of all SFCs decreased by 45% compared to the neat epoxy. However, the flexural modulus increased with increasing particle size variation, which can be related to increasing wall thickness “ω” with increasing particle sizes;
- The highest flexural strength is 89 MPa at EPT60-DD5, which is a 66.4% increase compared to the neat resin at 5 vol% fractions and 50–90 µm particle size variation. This is an indication that the flexural strength increased with an increase in size variation and volume fraction in the syntactic foam composites;
- The microstructural analysis on the fracture surfaces revealed the size of the filler HGM at each variation through a higher magnification (1500×) scanning, while agglomeration, broken and unbroken HGM on the fractured surfaces at each particle size variation could be clearly seen at a lower magnification of micrographs (200×);
- Moreover, reduced wall thickness “ω” resulted in a higher aspect ratio “a”, which invariably increased the modulus and strength of SFCs. This trend was noticed majorly at lower volume fractions with respect to higher particle size (BB, CC, and DD) variation of HGM.
- The TGA of SFCs at 5% weight loss shows a 12% reduction in degradation temperature. While at 20% and 55% weight loss, SFCs increased in degradation temperature by 4.5% and 2.7%, respectively. This implies that increased wall thickness “ω” of HGM influenced the TGA of SFCs at higher weight loss;
- The storage modulus, E’ increased at 30 °C, 50 °C, and 60 °C by 3.2%, 47%, and 96%, respectively. The E’ and E” values of SFCs increased with increasing wall thickness “ω” as the particle sizes increased. The Tg determined from tan δ peak at a temperature of above 70 °C increased compared to the NE up to 86 °C;
- The overall conclusion shows that the flexural strength and bending modulus of syntactic foam were affected by the change in the particle sizes and volume fraction of the HGM filler due to their different interfacial surfaces, wall thicknesses, and aspect ratio.
Author Contributions
Funding
Institutional Review Board Statement
Informed Consent Statement
Data Availability Statement
Acknowledgments
Conflicts of Interest
References
- Lorenzo Bardella, F.G. On the elastic behavior of syntactic foams. Int. J. Solids Struct. 2001, 38, 7235–7260. [Google Scholar] [CrossRef]
- Adel Shams, S.Z. Mauruzio Porfiri. Water Impact of Syntactic Foams. Materials 2017, 10, 224. [Google Scholar] [CrossRef] [PubMed] [Green Version]
- Anbuchezhiyan, G.; Mohan, B.; Sathianarayanan, D.; Muthuramalingam, T. Synthesis and characterization of hollow glass microspheres reinforced magnesium alloy matrix syntactic foam. J. Alloys Compd. 2017, 719, 125–132. [Google Scholar] [CrossRef]
- Tagliavia, G.; Porfiri, M.; Gupta, N. Analysis of flexural properties of hollow-particle filled composites. Compos. Part B Eng. 2010, 41, 86–93. [Google Scholar] [CrossRef]
- Bardella, L.; Sfreddo, A.; Ventura, C.; Porfiri, M.; Gupta, N. A critical evaluation of micromechanical models for syntactic foams. Mech. Mater. 2012, 50, 53–69. [Google Scholar] [CrossRef]
- Bharath Kumar, B.R.; Doddamani, M.; Zeltmann, S.E.; Gupta, N.; Uzma; Gurupadu, S.; Sailaja, R.R.N. Effect of particle surface treatment and blending method on flexural properties of injection-molded cenosphere/HDPE syntactic foams. J. Mater. Sci. 2016, 51, 3793–3805. [Google Scholar] [CrossRef]
- Manalo, A.; Aravinthan, T.; Karunasena, W.; Islam, M. Flexural behaviour of structural fibre composite sandwich beams in flatwise and edgewise positions. Compos. Struct. 2010, 92, 984–995. [Google Scholar] [CrossRef] [Green Version]
- Karthikeyan, C.S.; Sankaran, S.; Kishore. Investigation of bending modulus of fiber-reinforced syntactic foams for sandwich and structural applications. Polym. Adv. Technol. 2007, 18, 254–256. [Google Scholar] [CrossRef]
- Paul, D.; Velmurugan, R.; Jayaganthan, R.; Gupta, N.K.; Manzhirov, A.V. Analysis of syntactic foam GFRP sandwich composite for flexural loads. J. Phys. Conf. Ser. 2018, 991, 12064. [Google Scholar] [CrossRef]
- Bhatia, S.; Khan, M.; Sengar, H.; Bhatia, V.A. A review on the mechanical properties and environmental impact of hollow glass microsphere epoxy composite. IIOAB J. 2018, 9, 1–8. [Google Scholar]
- Cosse, R.L.; Morais, A.C.L.D.; Silva, L.R.C.D.; Carvalho, L.H.D.; Reis Sobrinho, J.F.D.; Barbosa, R.; Alves, T.S. Preparation of Syntactic Foams made from Green Polyethylene and Glass Microspheres: Morphological and Mechanical Characterization. Mater. Res. 2019, 22 (Suppl. 1), e20190035. [Google Scholar] [CrossRef]
- Gogoi, R.; Kumar, N.; Mireja, S.; Ravindranath, S.S.; Manik, G.; Sinha, S. Effect of Hollow Glass Microspheres on the Morphology, Rheology and Crystallinity of Short Bamboo Fiber-Reinforced Hybrid Polypropylene Composite. JOM 2018, 71, 548–558. [Google Scholar] [CrossRef]
- John, B.; Nair, C.P.R.; Ninan, K.N. Effect of nanoclay on the mechanical, dynamic mechanical and thermal properties of cyanate ester syntactic foams. Mater. Sci. Eng. A 2010, 527, 5435–5443. [Google Scholar] [CrossRef]
- Kanny, K.; Mohan, T.P. Resin infusion analysis of nanoclay filled glass fiber laminates. Compos. Part B Eng. 2014, 58, 328–334. [Google Scholar] [CrossRef]
- Elanchezhian, C.; Ramnath, B.V.; Kaosik, R.; Nellaiappan, T.K.; Santhosh Kumar, K.; Kavirajan, P.; Sughan, M.U. Evaluation of Mechanical Properties of Kernaf Based Hybrid Composite for Automotive Components Repalcement. ARPN J. Ofeng. Appl. Sci. 2015, 10, 5518–5523. [Google Scholar]
- Zhang, J.; Chaisombat, K.; He, S.; Wang, C.H. Hybrid composite laminates reinforced with glass/carbon woven fabrics for lightweight load bearing structures. Mater. Des. 2012, 36, 75–80. [Google Scholar] [CrossRef]
- Grosjean, F.; Bouchonneau, N.; Choqueuse, D.; Sauvant-Moynot, V. Comprehensive analyses of syntactic foam behaviour in deepwater environment. J. Mater. Sci. 2009, 44, 1462–1468. [Google Scholar] [CrossRef]
- d’Almeida, J.R.M. An Analysis of the Effect of the Diameter of Glass Microspheres on the Mechanical Behaviour of Glass-micropsheres. Compos. Sci. Technol. 1999, 59, 2087–2091. [Google Scholar] [CrossRef]
- Gupta, N.; Priya, S.; Islam, R.; Ricci, W. Characterization of Mechanical and Electrical Properties of Epoxy-Glass Microballoon Syntactic Composites. Ferroelectrics 2006, 345, 1–12. [Google Scholar] [CrossRef]
- Arpitha, G.R.; Sanjay, M.R.; Naik, L.L.; Yogesha, B. Mechanical properties of epoxy based hybrid composites reinforced with Sisal/SIC/glass fibers. Int. J. Eng. Res. Gen. Sci. 2014, 2, 398–405. [Google Scholar]
- Huang, C.; Huang, Z.; Qin, Y.; Ding, J.; Lv, X. Mechanical and dynamic mechanical properties of epoxy syntactic foams reinforced by short carbon fiber. Polym. Compos. 2016, 37, 1960–1970. [Google Scholar] [CrossRef]
- Karthikeyan, C.S.; Sankaran, S.; Kishore. Flexural Behaviour of Fibre-Reinforced Syntactic Foams. Macromol. Mater. Eng. 2005, 290, 60–65. [Google Scholar] [CrossRef]
- Liang, J.-Z. Tensile and Flexural Properties of Hollow Glass Bead-filled ABS Composites. J. Elastomers Plast. 2005, 37, 361–370. [Google Scholar] [CrossRef]
- Paul, D.; Velmurugan, R. Analysis of the specific properties of glass microballoon-epoxy syntactic foams under tensile and flexural loads. Mater. Today Proc. 2018, 5, 16956–16962. [Google Scholar] [CrossRef]
- Qiao, Y.; Wang, X.; Zhang, X.; Xing, Z. Investigation of flexural properties of hollow glass microsphere filled resin-matrix composites. Pigment Resin Technol. 2016, 45, 426–430. [Google Scholar] [CrossRef]
- Zhi, C.; Long, H. Flexural Properties of Syntactic foam Reinforced by Warp Knitted Spacer Fabric. Autex Res. J. 2016, 16, 57–66. [Google Scholar] [CrossRef] [Green Version]
- Garcia, C.D.; Shahapurkar, K.; Doddamani, M.; Kumar, G.C.M.; Prabhakar, P. Effect of arctic environment on flexural behavior of fly ash cenosphere reinforced epoxy syntactic foams. Compos. Part B Eng. 2018, 151, 265–273. [Google Scholar] [CrossRef]
- Huang, C.; Huang, Z.; Wang, Q. Effect of high-temperature treatment on the mechanical and thermal properties of phenolic syntactic foams. Polym. Eng. Sci. 2018, 58, 2200–2209. [Google Scholar] [CrossRef]
- Sankaran, S.; Sekhar, K.R.; Raju, G.; Kumar, M.N.J. Characterization of epoxy syntactic foams by dynamic mechanical analysis. J. Mater. Sci. 2006, 41, 4041–4046. [Google Scholar] [CrossRef]
- Shunmugasamy, V.C.; Pinisetty, D.; Gupta, N. Viscoelastic properties of hollow glass particle filled vinyl ester matrix syntactic foams: Effect of temperature and loading frequency. J. Mater. Sci. 2013, 48, 1685–1701. [Google Scholar] [CrossRef]
- Poveda, R.L.; Achar, S.; Gupta, N. Viscoelastic properties of carbon nanofiber reinforced multiscale syntactic foam. Compos. Part B Eng. 2014, 58, 208–216. [Google Scholar] [CrossRef]
- Capela, C.; Ferreira, J.A.M.; Costa, J.D. Viscoelastic Properties Assessment of Syntactic Foams by Dynamic Mechanical Analysis. Mater. Sci. Forum 2010, 636–637, 280–286. [Google Scholar] [CrossRef]
- Swetha, C.; Kumar, R. Quasi-static uni-axial compression behaviour of hollow glass microspheres/epoxy based syntactic foams. Mater. Des. 2011, 32, 4152–4163. [Google Scholar] [CrossRef]
- Colloca, M.; Gupta, N.; Porfiri, M. Tensile properties of carbon nanofiber reinforced multiscale syntactic foams. Compos. Part B Eng. 2013, 44, 584–591. [Google Scholar] [CrossRef]
- Ullas, A.V.; Kumar, D.; Roy, P.K. Epoxy-Glass Microballoon Syntactic Foams: Rheological Optimization of the Processing Window. Adv. Polym. Technol. 2019, 2019, 1–12. [Google Scholar] [CrossRef] [Green Version]
- Chen, Z.; Huang, Z.X.; Qin, Y.; Shi, M.X.; Mei, Q.L.; Zhang, M. Effect of glass microballoons size on compressive strength of syntactic foams. In Advanced Materials Research; Trans Tech Publications, Ltd.: Wollerau, Switzerland, 2011; pp. 7–10. [Google Scholar]
- Kishore; Shankar, R.; Sankaran, S. Effects of microballoon’s size and content in epoxy on compressive strength and modulus. J. Mater Sci. 2006, 41, 7459–7465. [Google Scholar] [CrossRef]
- Al-Sahlani, K.; Broxtermann, S.; Lell, D.; Fiedler, T. Effects of particle size on the microstructure and mechanical properties of expanded glass-metal syntactic foams. Mater. Sci. Eng. A 2018, 728, 80–87. [Google Scholar] [CrossRef]
- Wang, P.; Zhong, S.; Yan, K.; Liao, B.; Zhang, J. Influence of a batch of hollow glass microspheres with different strength grades on the compression strength of syntactic foam. Compos. Sci. Technol. 2022, 223, 109442. [Google Scholar] [CrossRef]
- Afolabi, O.A.; Kanny, K.; Mohan, T.P. Processing of Hollow Glass Microspheres (HGM) filled Epoxy Syntactic Foam Composites with improved Structural Characteristics. Sci. Eng. Compos. Mater. 2021, 28, 116–127. [Google Scholar] [CrossRef]
- Bas, H.K.; Jin, W.; Gupta, N. Chemical stability of hollow glass microspheres in cementitious syntactic foams. Cem. Concr. Compos. 2021, 118, 103928. [Google Scholar] [CrossRef]
- Liang, J.Z.; Li, R.K.Y. Effect of Filler Content and Surface Treatment on the Tensile Properties of Glass Bead filled Polypropylene Composites. Polym. Int. 2000, 49, 170–174. [Google Scholar] [CrossRef]
- Kumar, K.P.; Sekaran, A.S.J.; Pitchandi, K. Investigation on Mechanical Properties of Woven Alovera/Sisal/Kenaf Fibre and Its Hybrid Composites. Bull. Mater. Sci. 2017, 40, 117–128. [Google Scholar] [CrossRef] [Green Version]
- Karthikeyan, C.S.; Sankaran, S. Influence of chopped strand on flexural behaviour of syntactic foam. Polym. Int. 2000, 49, 158–162. [Google Scholar] [CrossRef]
- Dong, C.; Ranaweera-Jayawardena, H.A.; Davies, I.J. Flexural properties of hybrid composites reinforced by S-2 glass and T700S carbon fibres. Compos. Part B Eng. 2012, 43, 573–581. [Google Scholar] [CrossRef]
- Afolabi, O.A.; Kanny, K.; Mohan, T. Loading Effect of Hollow Glass Microsphere (HGM) and Foam Microstructure on the Specific Mechanical Properties and Water Absorption of Syntactic Foam Composite. Int. J. Eng. Res. Afr. 2021, 56, 34–50. [Google Scholar] [CrossRef]
- Doddamani, M.; Kishore; Shunmugasamy, V.C.; Gupta, N.; Vijayakumar, H.B. Compressive and flexural properties of functionally graded fly ash cenosphere-epoxy resin syntactic foams. Polym. Compos. 2015, 36, 685–693. [Google Scholar] [CrossRef]
- Salleh, Z. Characterisation of Syntactic Foams for Marine Applications. Ph.D. Thesis, University of Southern Queensland, Darling Heights, Australia, 2017. [Google Scholar]
- Cosse, R.L.; Araújo, F.H.; Pinto, F.A.N.C.; de Carvalho, L.H.; de Morais, A.C.L.; Barbosa, R.; Alves, T.S. Effects of the type of processing on thermal, morphological and acoustic properties of syntactic foams. Compos. Part B Eng. 2019, 173, 106933. [Google Scholar] [CrossRef]
- Zhao, H.; Gao, W.C.; Li, Q.; Khan, M.R.; Hu, G.H.; Liu, Y.; Wu, W.; Huang, C.X.; Li, R.K.Y. Recent advances in superhydrophobic polyurethane: Preparations and applications. Adv. Colloid Interface Sci. 2022, 303, 102644. [Google Scholar] [CrossRef]
- Ghamsari, A.K.; Zegeye, E.; Woldesenbet, E. Viscoelastic properties of syntactic foam reinforced with short sisal fibers. J. Compos. Mater. 2013, 49, 27–34. [Google Scholar] [CrossRef]
- Sharma, A.; Choudhary, M.; Agarwal, P.; Joshi, S.; Biswas, S.K.; Patnaik, A. Mechanical, Thermal and Thermomechanical Properties of Sponge Iron Slag filled Needle-Punched Nonwoven Jute Epoxy Hybrid Composites. Fibers Polym. 2021, 22, 1082–1098. [Google Scholar] [CrossRef]


| HGM Size Variation | D10 Volume (µm) | D50 Volume (µm) | D90 Volume (µm) |
|---|---|---|---|
| AA | 5.54 | 20.59 | 37.53 |
| BB | 5.72 | 29.39 | 45.30 |
| CC | 6.43 | 30.42 | 47.27 |
| DD | 14.18 | 56.07 | 77.97 |
| Particle Size (µm) | AA | BB | CC | DD |
|---|---|---|---|---|
| Vd (%) | 9.66 | 31.02 | 9.80 | 12.16 |
| d (µm) | 29.62 | 30.86 | 29.40 | 55.04 |
| ω (µm) | 3.22 | 3.89 | 4.06 | 7.67 |
| a | 9.58 | 7.61 | 7.24 | 8.23 |
| Size Variation | Volume Fraction of HGM (%) | |||||
|---|---|---|---|---|---|---|
| Particle Sizes | NE | EPT60-5 | EPT60-10 | EPT60-15 | EPT60-20 | EPT60-25 |
| AA (20–24 µm) | 2.4 | 0.81 ± 0.19 | 0.60 ± 0.11 | 1.00 ± 0.13 | 1.02 ± 0.17 | 0.94 ± 0.16 |
| BB (25–44 µm) | 2.4 | 1.09 ± 0.19 | 1.01 ± 0.16 | 1.02 ± 0.07 | 0.95 ± 0.13 | 0.82 ± 0.05 |
| CC (45–49 µm) | 2.4 | 1.31 ± 0.25 | 0.81 ± 0.14 | 1.06 ± 0.16 | 0.74 ± 0.20 | 0.90 ± 0.13 |
| DD (50–60 µm) | 2.4 | 1.14 ± 0.20 | 1.01 ± 0.11 | 0.86 ± 0.10 | 0.78 ± 0.14 | 1.03 ± 0.08 |
| Size Variation | Volume Fraction (%) | |||||
|---|---|---|---|---|---|---|
| Particle Sizes | NE | EPT60-5 | EPT60-10 | EPT60-15 | EPT60-20 | EPT60-25 |
| AA (20–24 µm) | 53.5 | 65.3 ± 8.3 | 52.6 ± 0.6 | 74.4 ± 4.8 | 80.7 ± 9.2 | 66.3 ± 9.1 |
| BB (25–44 µm) | 53.5 | 86.7 ± 3.5 | 72.7 ± 3.6 | 70.7 ± 2.2 | 62.8 ± 6.5 | 59.5 ± 4.2 |
| CC (45–49 µm) | 53.5 | 85.5 ± 2.6 | 61.2 ± 5.4 | 77.8 ± 7.2 | 57.6 ± 2.9 | 52.1 ± 0.9 |
| DD (50–60 µm) | 53.5 | 89 ± 5.1 | 58.6 ± 3.6 | 70.5 ± 2.0 | 64.5 ± 7.8 | 67.8 ± 1.1 |
| Size Variation | Volume Fraction (%) | |||||
|---|---|---|---|---|---|---|
| Particle Sizes | NE | EPT60-5 | EPT60-10 | EPT60-15 | EPT60-20 | EPT60-25 |
| AA (20–24 µm) | 0.044 | 0.141 ± 0.014 | 0.104 ± 0.006 | 0.139 ± 0.014 | 0.125 ± 0.018 | 0.133 ± 0.021 |
| BB (25–44 µm) | 0.044 | 0.175 ± 0.011 | 0.128 ± 0.005 | 0.153 ± 0.022 | 0.114 ± 0.042 | 0.212 ± 0.055 |
| CC (45–49 µm) | 0.044 | 0.129 ± 0.023 | 0.099 ± 0.020 | 0.165 ± 0.056 | 0.193 ± 0.059 | 0.076 ± 0.034 |
| DD (50–60 µm) | 0.044 | 0.148 ± 0.034 | 0.167 ± 0.029 | 0.225 ± 0.049 | 0.154 ± 0.011 | 0.093 ± 0.102 |
Publisher’s Note: MDPI stays neutral with regard to jurisdictional claims in published maps and institutional affiliations. |
© 2022 by the authors. Licensee MDPI, Basel, Switzerland. This article is an open access article distributed under the terms and conditions of the Creative Commons Attribution (CC BY) license (https://creativecommons.org/licenses/by/4.0/).
Share and Cite
Afolabi, O.A.; Kanny, K.; Mohan, T.P. Analysis of Particle Variation Effect on Flexural Properties of Hollow Glass Microsphere Filled Epoxy Matrix Syntactic Foam Composites. Polymers 2022, 14, 4848. https://doi.org/10.3390/polym14224848
Afolabi OA, Kanny K, Mohan TP. Analysis of Particle Variation Effect on Flexural Properties of Hollow Glass Microsphere Filled Epoxy Matrix Syntactic Foam Composites. Polymers. 2022; 14(22):4848. https://doi.org/10.3390/polym14224848
Chicago/Turabian StyleAfolabi, Olusegun Adigun, Krishnan Kanny, and Turup Pandurangan Mohan. 2022. "Analysis of Particle Variation Effect on Flexural Properties of Hollow Glass Microsphere Filled Epoxy Matrix Syntactic Foam Composites" Polymers 14, no. 22: 4848. https://doi.org/10.3390/polym14224848