1. Introduction
Tetra Pak
® is a contemporary type of packaging widely used around the world for aseptically packaged goods. Billions of litres of liquid food items, such as milk and juice, require Tetra Pak
® to maintain their freshness and maximise their quality without any preservatives [
1]. Tetra Pak
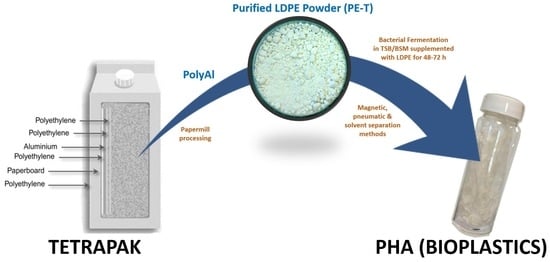
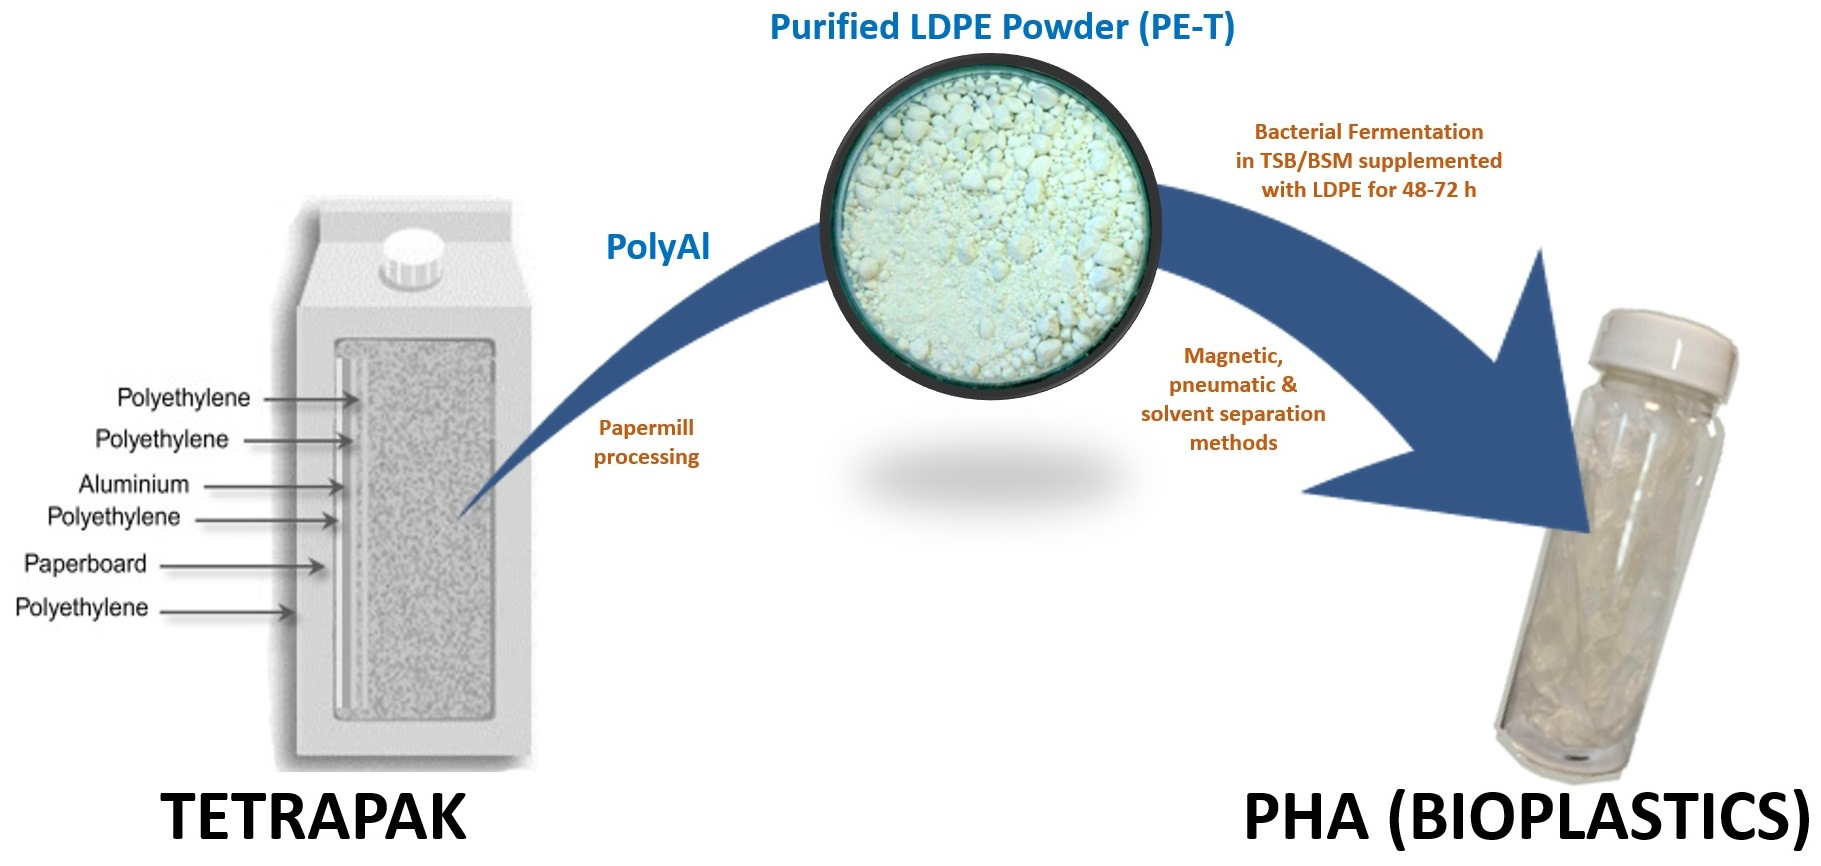
® packaging materials are made up of three primary raw materials: paperboard, aluminium foil, and low-density polyethylene (LDPE) [
1]. The paperboard is the dominant material in Tetra Pak
® cartons; it constitutes 75% of the total carton weight, where it provides mechanical strength and stability to the packaging [
1,
2]. The LDPE functions as an adhesive agent between the components of the packaging material, and also protects the product from external moisture, while making up 20% of the total packaging weight [
1]. Despite comprising only 5% of the packaging, the aluminium plays a vital role in the thermal stabilisation of the food product by blocking out oxygen and light [
2]. Therefore, it inhibits both microbial growth (which could promote oxidation damage) and photodegradation, which causes the loss of vital vitamins (A, B
2, C, D, and E), carboxylic acids, enzymes, and the food’s flavour [
2]. Blocking UV light is also particularly important for dairy products, as riboflavin is susceptible to UV light degradation [
3,
4,
5].
Tetra Pak
® packages are used in more than 160 countries around the world [
6]. In 2019, over 190 billion Tetra Pak
® packages were sold [
6]. The geography of net sales indicated that 89% of total sales happened in Europe, America, and Asia [
6]. In light of these statistics, it is certain that the amount of waste Tetra Pak
® in municipal solid waste is also increasing considerably, especially given the fact that the majority of these packages are dumped in landfills after use [
7]. The year 2016 recorded the accumulation of 188 billion tonnes of waste Tetra Pak
®, which is expected to continually increase annually [
8]. Of this waste Tetra Pak
®, only a small amount is recycled, while the rest is incinerated to toxic ash or piled up on beaches, roads, rubbish dumps, and landfills [
9]. For instance, the global recycling rate of Tetra Pak
® packages was only 26% in 2019 [
10]. It is known that this accumulation in landfills and incineration can lead to environmental pollution, but more importantly, the polyethylene polymer within the packaging material is believed to cause negative toxic effects on the health of humans and animals, affecting the endocrine system, and linked to cancer [
11] and reproductive problems [
12].
Current recycling techniques can be broadly separated into three main categories: One category involves methods that do not separate out the three components, and either has energy recovery as the primary target, or converts everything into other materials, such as chipboard products, fillers, roof sheets, and polymer concrete [
13,
14,
15]. Another category uses the hydro-pulping technique, which involves the mechanical separation of paperboard from LDPE and aluminium, leaving behind a combined LDPE–aluminium component [
14,
15]. This seems to be the main recycling route, and a large amount of cellulose fibre is recovered, which can then be reused for the manufacturing of paper and packaging materials [
14]. The recycled LDPE and aluminium (so-called recycled polyAl) can either be converted into other useful products—such as panel boards, roof sheets, waterproof boards, and furniture—or can be used for energy recovery through incineration [
14,
15]. Methods of the third category, which recover aluminium through a thermochemical process such as pyrolysis [
16,
17], or through the separation of polyethylene and aluminium by acid-based wet processing techniques and plasma technology, have also been reported [
18,
19].
Despite all of these recycling solutions, there still exist some major challenges that limit the full recycling of Tetra Pak
®. Among these challenges are the lack of adequate Tetra Pak
® recycling infrastructure in most parts of the world, the high processing cost of the recycling methods, high energy consumption, low demand for recycled end products, and low engagement and the lack of education on post-consumer recycling [
7]. Considering the abovementioned recycling problems, research is still ongoing to improve the life cycle of Tetra Pak
® packaging by enhancing the recycling process of waste Tetra Pak
® packages—in particular, by upcycling these wastes to valuable products with economic and environmental importance [
13,
19,
20,
21]. One such effort is to find a way to recover the LDPE and return it into the carbon cycle. This paper reports a novel recycling technique of LDPE from Tetra Pak
® waste to synthesise polyhydroxyalkanoates (PHAs) via
Cupriavidus necator. PHAs are biopolyesters that can be synthesised from a wide range of carbon sources by many microbial strains. They are viewed as a class of biodegradable bioplastics that can potentially replace synthetic petroleum-derived plastics and minimise the hazardous impacts caused by synthetic plastic waste. PHA production from waste Tetra Pak
® could be an important economical alternative to the other recycling methods of polyethylene polymer materials. We have extensively described the use of oxidised polypropylene (PP) as a feedstock for PHA production in previous publications [
22], as well as a recycling method for controlled oxidative fragmentation of LDPE plastics by
Cupriavidus necator [
23]. The PHB producer
Cupriavidus necator consistently stands out for its ability to produce PHA from multiple carbon sources, including sugars and fatty acids [
23]. It is genetically stable, and is one of the most studied microbes used in this area of study, making it a potential candidate for industrial PHA production [
22,
23]. This strain was used as a biocatalyst to upcycle LDPE fragments in Tetra Pak
® waste to value-added PHA. The present study reveals the effects of the waste Tetra Pak
® mechanical grinding and separation process, using the “solvents method” of PE, as a possible carbon source for the biosynthesis of high-value biodegradable PHA.
2. Materials and Methods
2.1. Carbon Source
Polyethylene from Tetra Pak
® packaging was purified according to the Polish patent in [
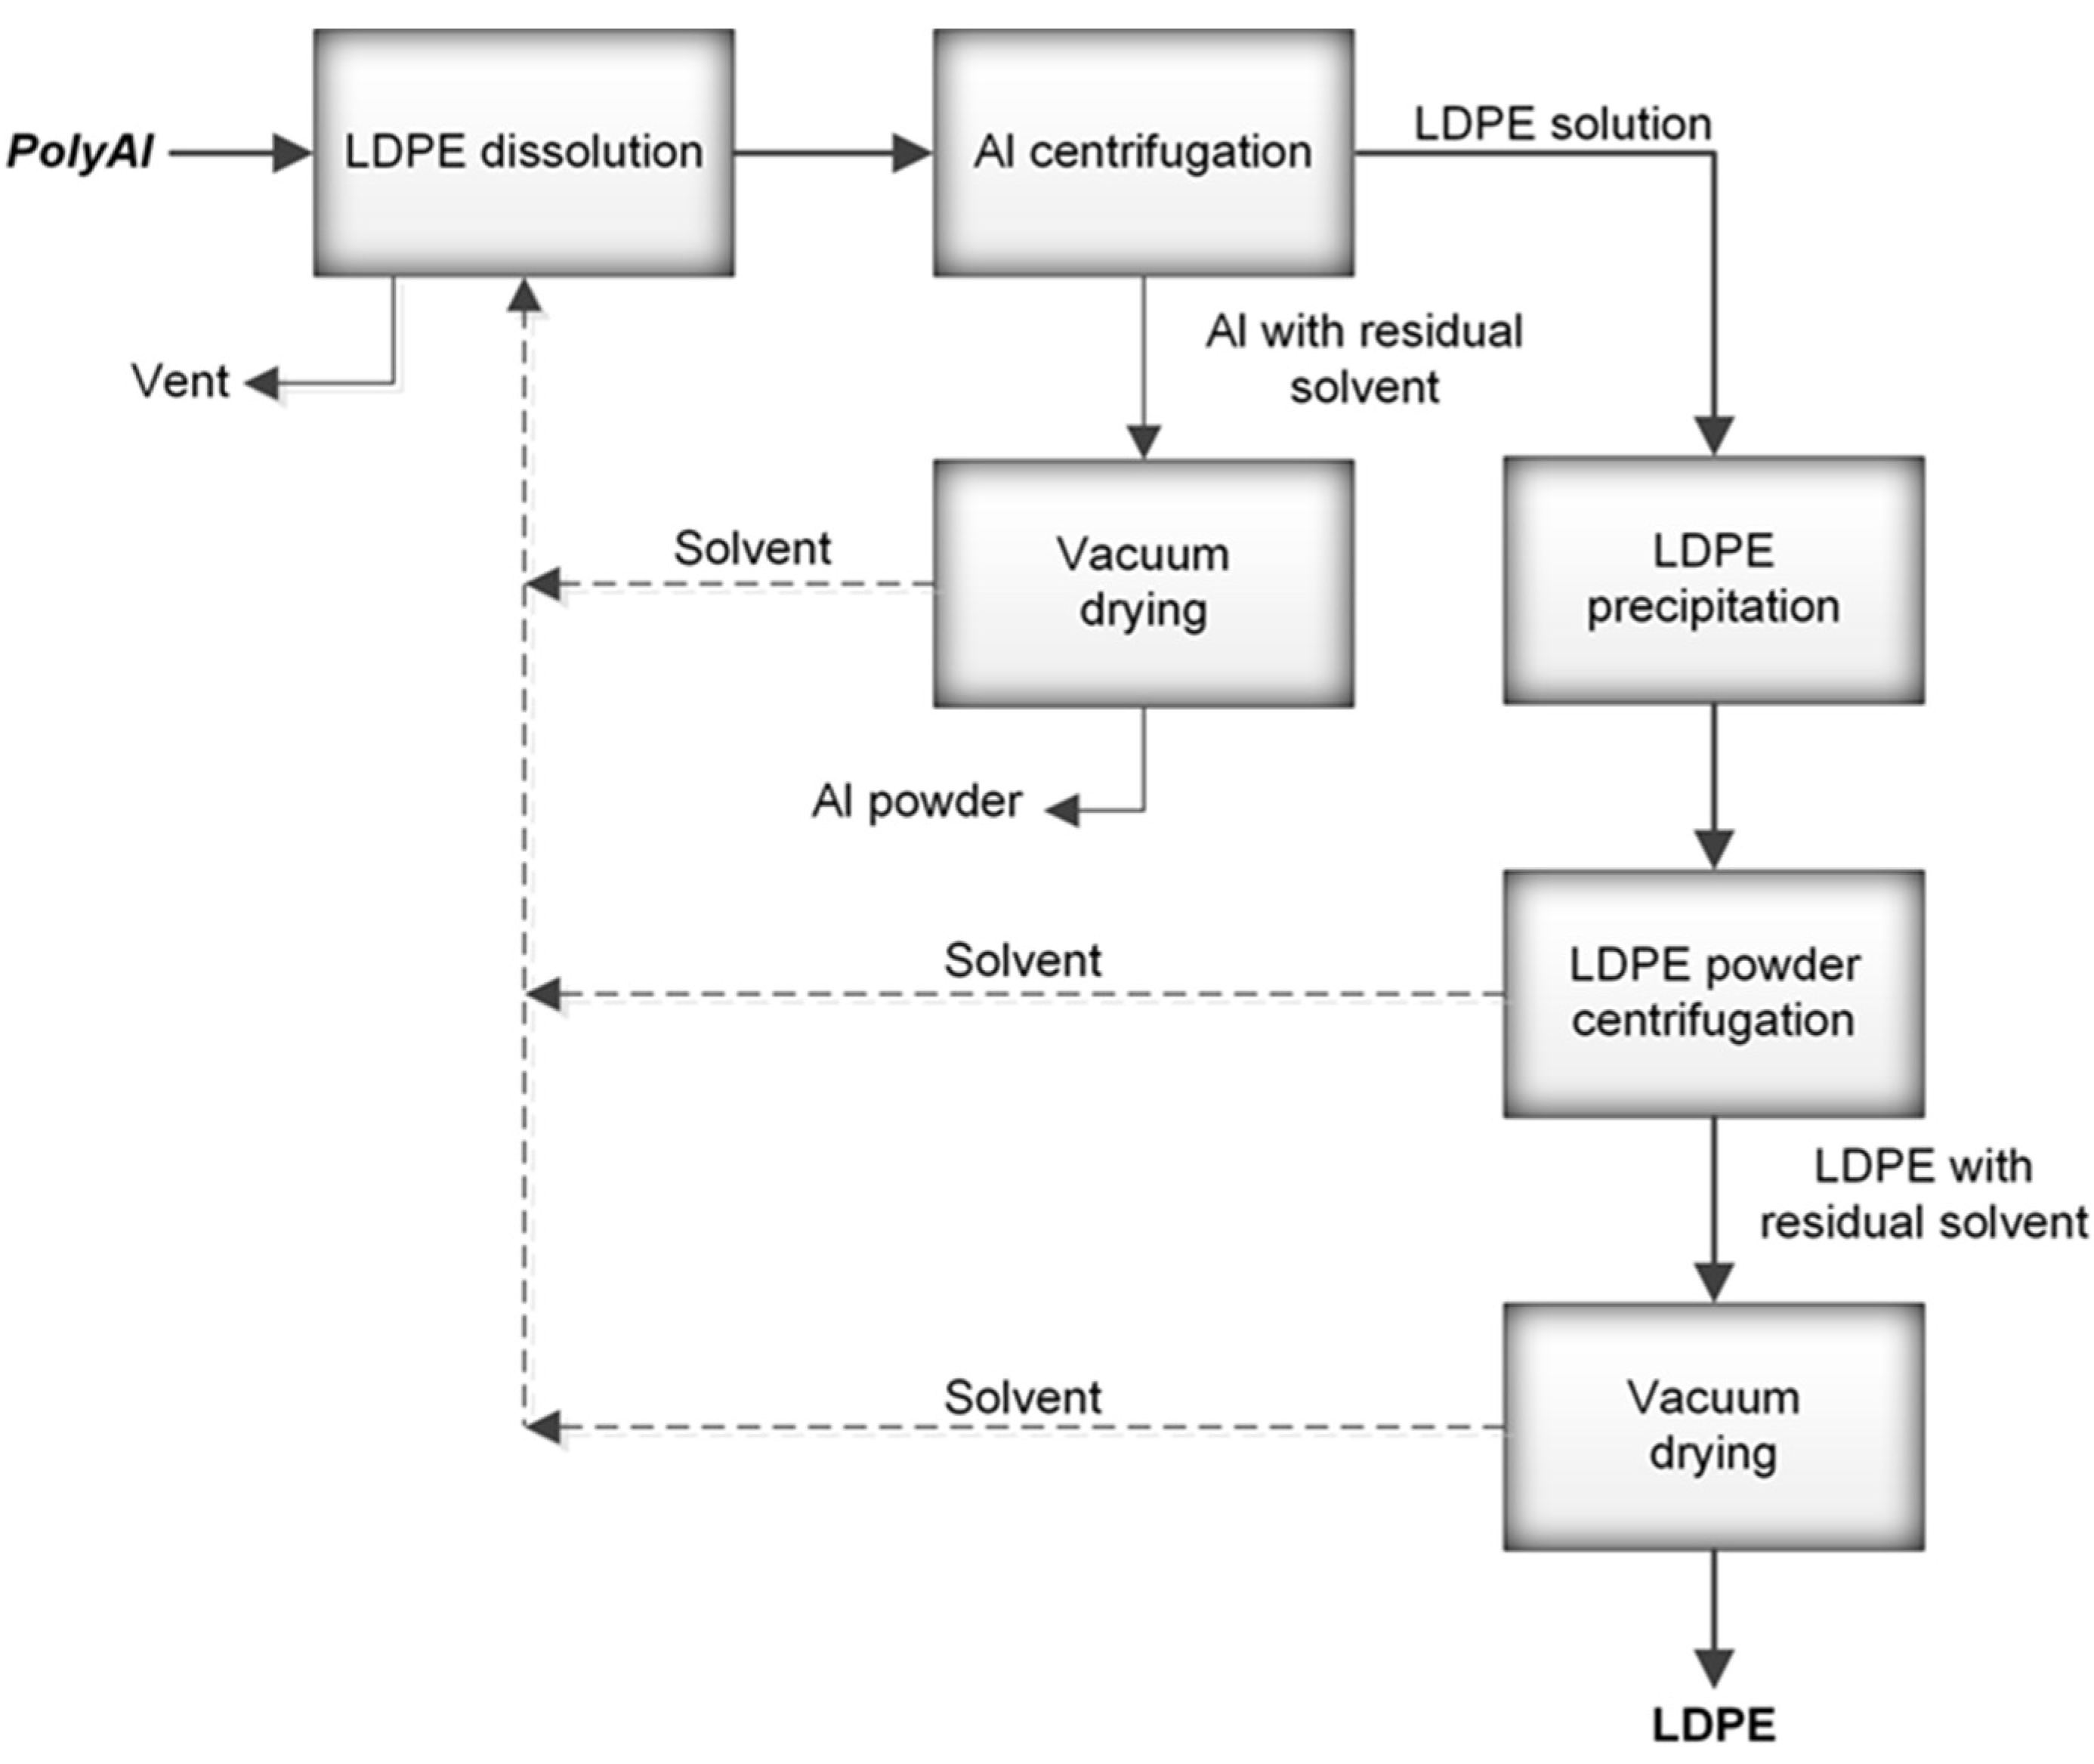
24]. A schematic diagram of the method used for the processing of polyAl from waste Tetra Pak
® is shown in
Figure 1. Waste Tetra Pak
® packages were processed in an industrial paper mill suited for the handling of such materials. The process resulted in above 95% paper fibre recovery. PolyAl, obtained as a byproduct, was subjected to magnetic and pneumatic separation. As a result, most of the heavy contaminants—such as HDPE cups and lids, steel wire, glass, pebbles, or pieces of wood—were separated. Purified polyAl was then shredded to fractions below 8 × 8 mm and mixed for 20 min with a solvent at 120 °C. The dissolution of LDPE in a solvent was carried out in an Ichemad PSMH 22 F Ex1 horizontal paddle mixer, with a capacity of 1.6 m
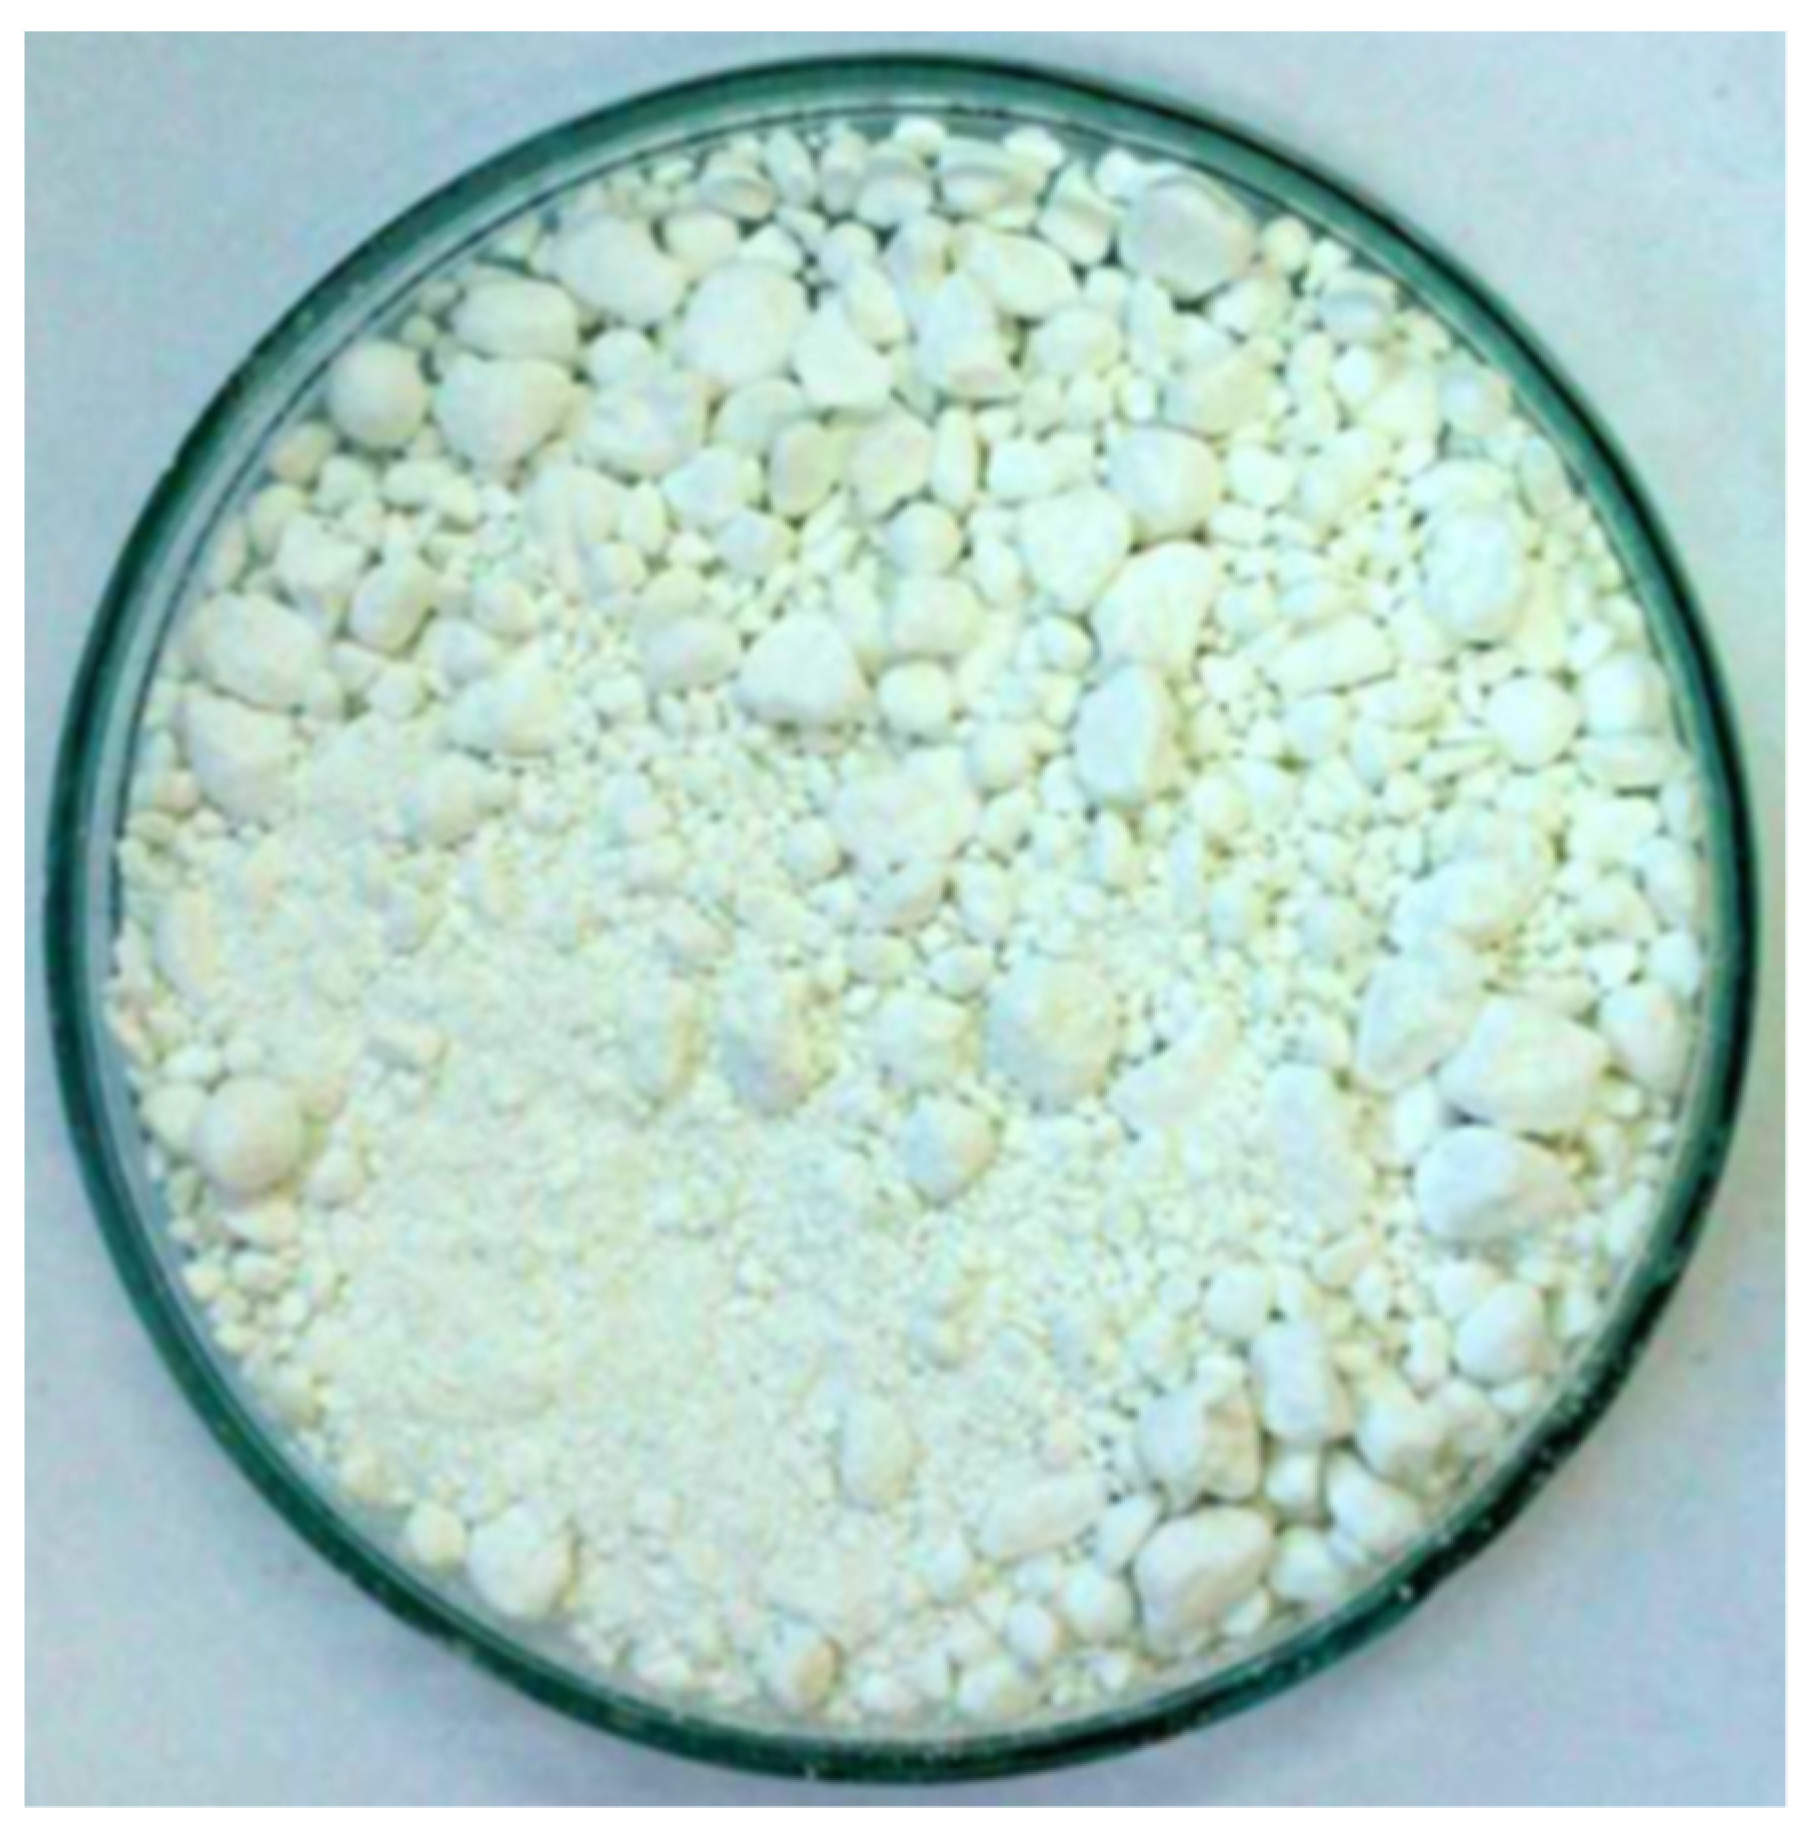
3 per batch. The solvent used for dissolution was a mixture of medium–low-boiling-point aliphatic esters. During mixing, the LDPE was fully dissolved. The resulting viscous suspension of aluminium particles in the polymer solution was then separated using a Flottweg Decanter centrifuge, model Z23 g. Decantation was performed at 120 °C with a g-force of 2000 g. In this process, the first product was separated—aluminium foil containing 55% residual solvent. The aluminium foil was then vacuum-dried from residual solvent in an AVA conical dryer, model HVW-VT 180, at 70 °C and 40 mbar(a). The LDPE solution, no longer containing aluminium foil or other contaminants, was transferred to a horizontal mixer of the same type as the one used for dissolution, but with a cooling jacket. During cooling, polyethylene powder precipitated from the solution, with the final temperature of the mixture being 70 °C. Upon precipitation, the powder was separated from the solvent by centrifugation and vacuum-drying using the equipment and parameters mentioned above. A sample of this powder (PE-T) was used as the carbon source for PHA production (
Figure 2).
2.2. Media and Chemicals
Tryptone soya agar (TSA) and tryptone soya broth (TSB) were purchased from Lab M Ltd. (Lancashire, UK) and prepared according to the manufacturer’s protocol. Both TSB and TSA media contain peptone (20 g/L) and glucose (2.5 g/L). All basal salts used in the preparation of BSM (low nitrogen content) were obtained from BDH Chemicals Ltd. (Dorset, UK) and prepared accordingly: 1 L of distilled water, 1 g/L K2HPO4, 1 g/L KH2PO4, 1 g/L KNO3, 1 g/L (NH4)2SO4, 0.1 g/L MgSO4.7H2O, 0.1 g/L NaCl, and 10 mL/L trace elements. The trace elements solution contained 2 mg/L CaCl2, 2 mg/L CuSO4.5H2O, 2 mg/L MnSO4.5H2O, 2 mg/L ZnSO4.5H2O, 2 mg/L FeSO4, and 2 mg/L (NH4)6Mo7O24.4H2O. Ringer’s solution (Lab M, Lancashire, UK) was used as a saline solution for the analysis of viable cells during the cultivation process. To prepare this solution, a ¼-strength tablet was left to completely dissolve in 500 mL of deionised water with constant stirring. All media used in this study were sterilised by autoclaving (Priorclave Ltd., London, UK) for 15 min at 121 °C.
2.3. Microorganism
The bacterial strain Cupriavidus necator H16 (NCIMB 10442, ATCC 17699) was used for this investigation. The stock culture was freeze-dried and stored at −20 °C in the University of Wolverhampton’s culture collection. Before use, the culture was revived by inoculation into sterile TSB and kept in a shaker incubator (150 rpm) at 30 °C and for 24 h. In preparation for the synthesis of PHA, an inoculum from the revived broth culture was streaked onto TSA plates and incubated overnight at 30 °C. The prepared plates were used in further experiments.
2.4. Pre-Culture Conditions
Prior to experimental use, overnight broth cultures (starter) were aseptically prepared using the stock plates. Starter cultures were first prepared in four different 50 mL conical flasks, each containing 20 mL of TSB medium. Single colonies of C. necator from the initial streaked plate were aseptically inoculated into these flasks. All flasks were cultured aerobically at 30 °C in TSB medium for 24 h, with rotary shaking at 150 rpm (New Brunswick Scientific Co. Series 25 Incubator Shaker, Enfield, CT, USA). Furthermore, at the end of this incubation period, small samples of the microbial cultures were aseptically collected to perform a Gram staining analysis to ascertain that these cultures were free from any form of contamination.
2.5. Shake-Flask Production of PHA
In this study, 230 mL of each growth medium (TSB or BSM) was prepared in a 500 mL conical flask as a batch system. Next, 50 mL of TSB or BSM was transferred aseptically into 100 mL sterile beakers, and 0.50 g of PE-T was added. To ensure an even dispersion of samples in the TSB/BSM media, these beakers and their contents were sonicated (Bandelin Electronic Sonicator, Berlin, Germany) for 10 min at 0.5 active and passive intervals using a power of 70%. The sterility of the emulsified broths was checked by spread plating on TSA medium. Next, 50 mL of sterile, emulsified medium was aseptically transferred back into a 500 mL conical flask containing the reaming 180 mL of TSB or BSM medium, followed by the addition of a 20 mL starter culture to each flask to create high-cell-density cultures. Thus, the final volume of the batch culture was 250 mL, and the pH of each medium was adjusted to pH 7.0. Each shake-flask experiment was conducted in triplicate. All bacterial cultures were incubated for 48 h or 72 h in a rotary incubator (New Brunswick Scientific Co. Series 25 Incubator Shaker, Enfield, CT, USA), with constant rotation of 150 rpm and at a constant temperature of 30 °C. An experimental control was also set up under the same conditions in either TSB or BSM medium only, without the addition of the PE-T sample.
To monitor the growth patterns during the cultivation process, viable cell counts were conducted using the method described by Miles and Misra [
25]. Following this method, 0.5 mL of sample was aseptically withdrawn from each growing culture at times 0, 3, 6, 9, 15, 21, 24, 27, 30, 40, 44, 48, 54, 65, and 72. Each sample was serially diluted from 10
−1 to 10
−8. In the next step, 20 µL of each dilution was aseptically pipetted onto TSA plates in triplicate. All plates were incubated for 24 h at 30 °C. The colonies observed afterwards were counted, and the obtained counts were expressed in Log
10 CFU/mL
−1.
2.6. Determination of Cell Dry Weight (CDW)
At the end of the 48 h incubation period, all flasks were removed from the shaker incubator. The culture broth was collected in 400 mL centrifuge tubes and centrifuged for 10 min at 4500 rpm using a Sigma 6-16 KS centrifuge. The obtained cell pellet was left overnight to freeze in a −20 °C freezer. Each frozen cell pellet was lyophilised for 48 h at −40 °C and 5 mbar using an Edward freeze-drier (Modulyo, Crawley, UK). The cell dry weight (CDW) was determined by weighing out the obtained dried biomass.
2.7. PHA Extraction and Purification Procedure
To extract the PHA, the dried biomass obtained from each flask was placed in an extraction thimble, covered with cotton wool, transferred to a Soxhlet extraction set up with HPLC-grade chloroform (Sigma-Aldrich, St. Louis, MO, USA), and left to run for 48 h. As part of a chloroform–biopolymer mixture, the PHA extracted was collected. Using a rotary evaporator set to 50 °C, leftover chloroform present in the mixture was evaporated, leaving behind the extracted PHA gathered in a 250 mL round-bottomed flask. In order to further purify the obtained biopolymer, PHA was precipitated in n-hexane. The precipitation was conducted in the round-bottomed flask. The flask was swirled gently to dislodge any PHA stuck to the flask, and the dispersion formed afterwards was filtered with a filter paper (Whatman No. 1 paper, Whatman Laboratory, Cardiff UK) to separate the polymer from the hexane solution. The purified polymer was left in a fume cupboard to dry, and later formed a thin PHA film. The PHA yield was determined afterwards using Equation (1):
2.8. PE Utilisation
The supernatant resulting from centrifuging the culture broth was recovered and filtered using a sieve to obtain the residual PE-T sample. The residual carbon source was left to concentrate to a constant mass. The carbon source utilisation was calculated using Equation (2):
2.9. Data Analysis
Results recorded during the experiments—such as viable counts and PHA yields—were statistically analysed by analysis of variance (ANOVA) using Microsoft Excel 2016 statistical software, and the differences between means were compared using the least significant differences (LSD) at 5% level of probability (p ≤ 0.05).
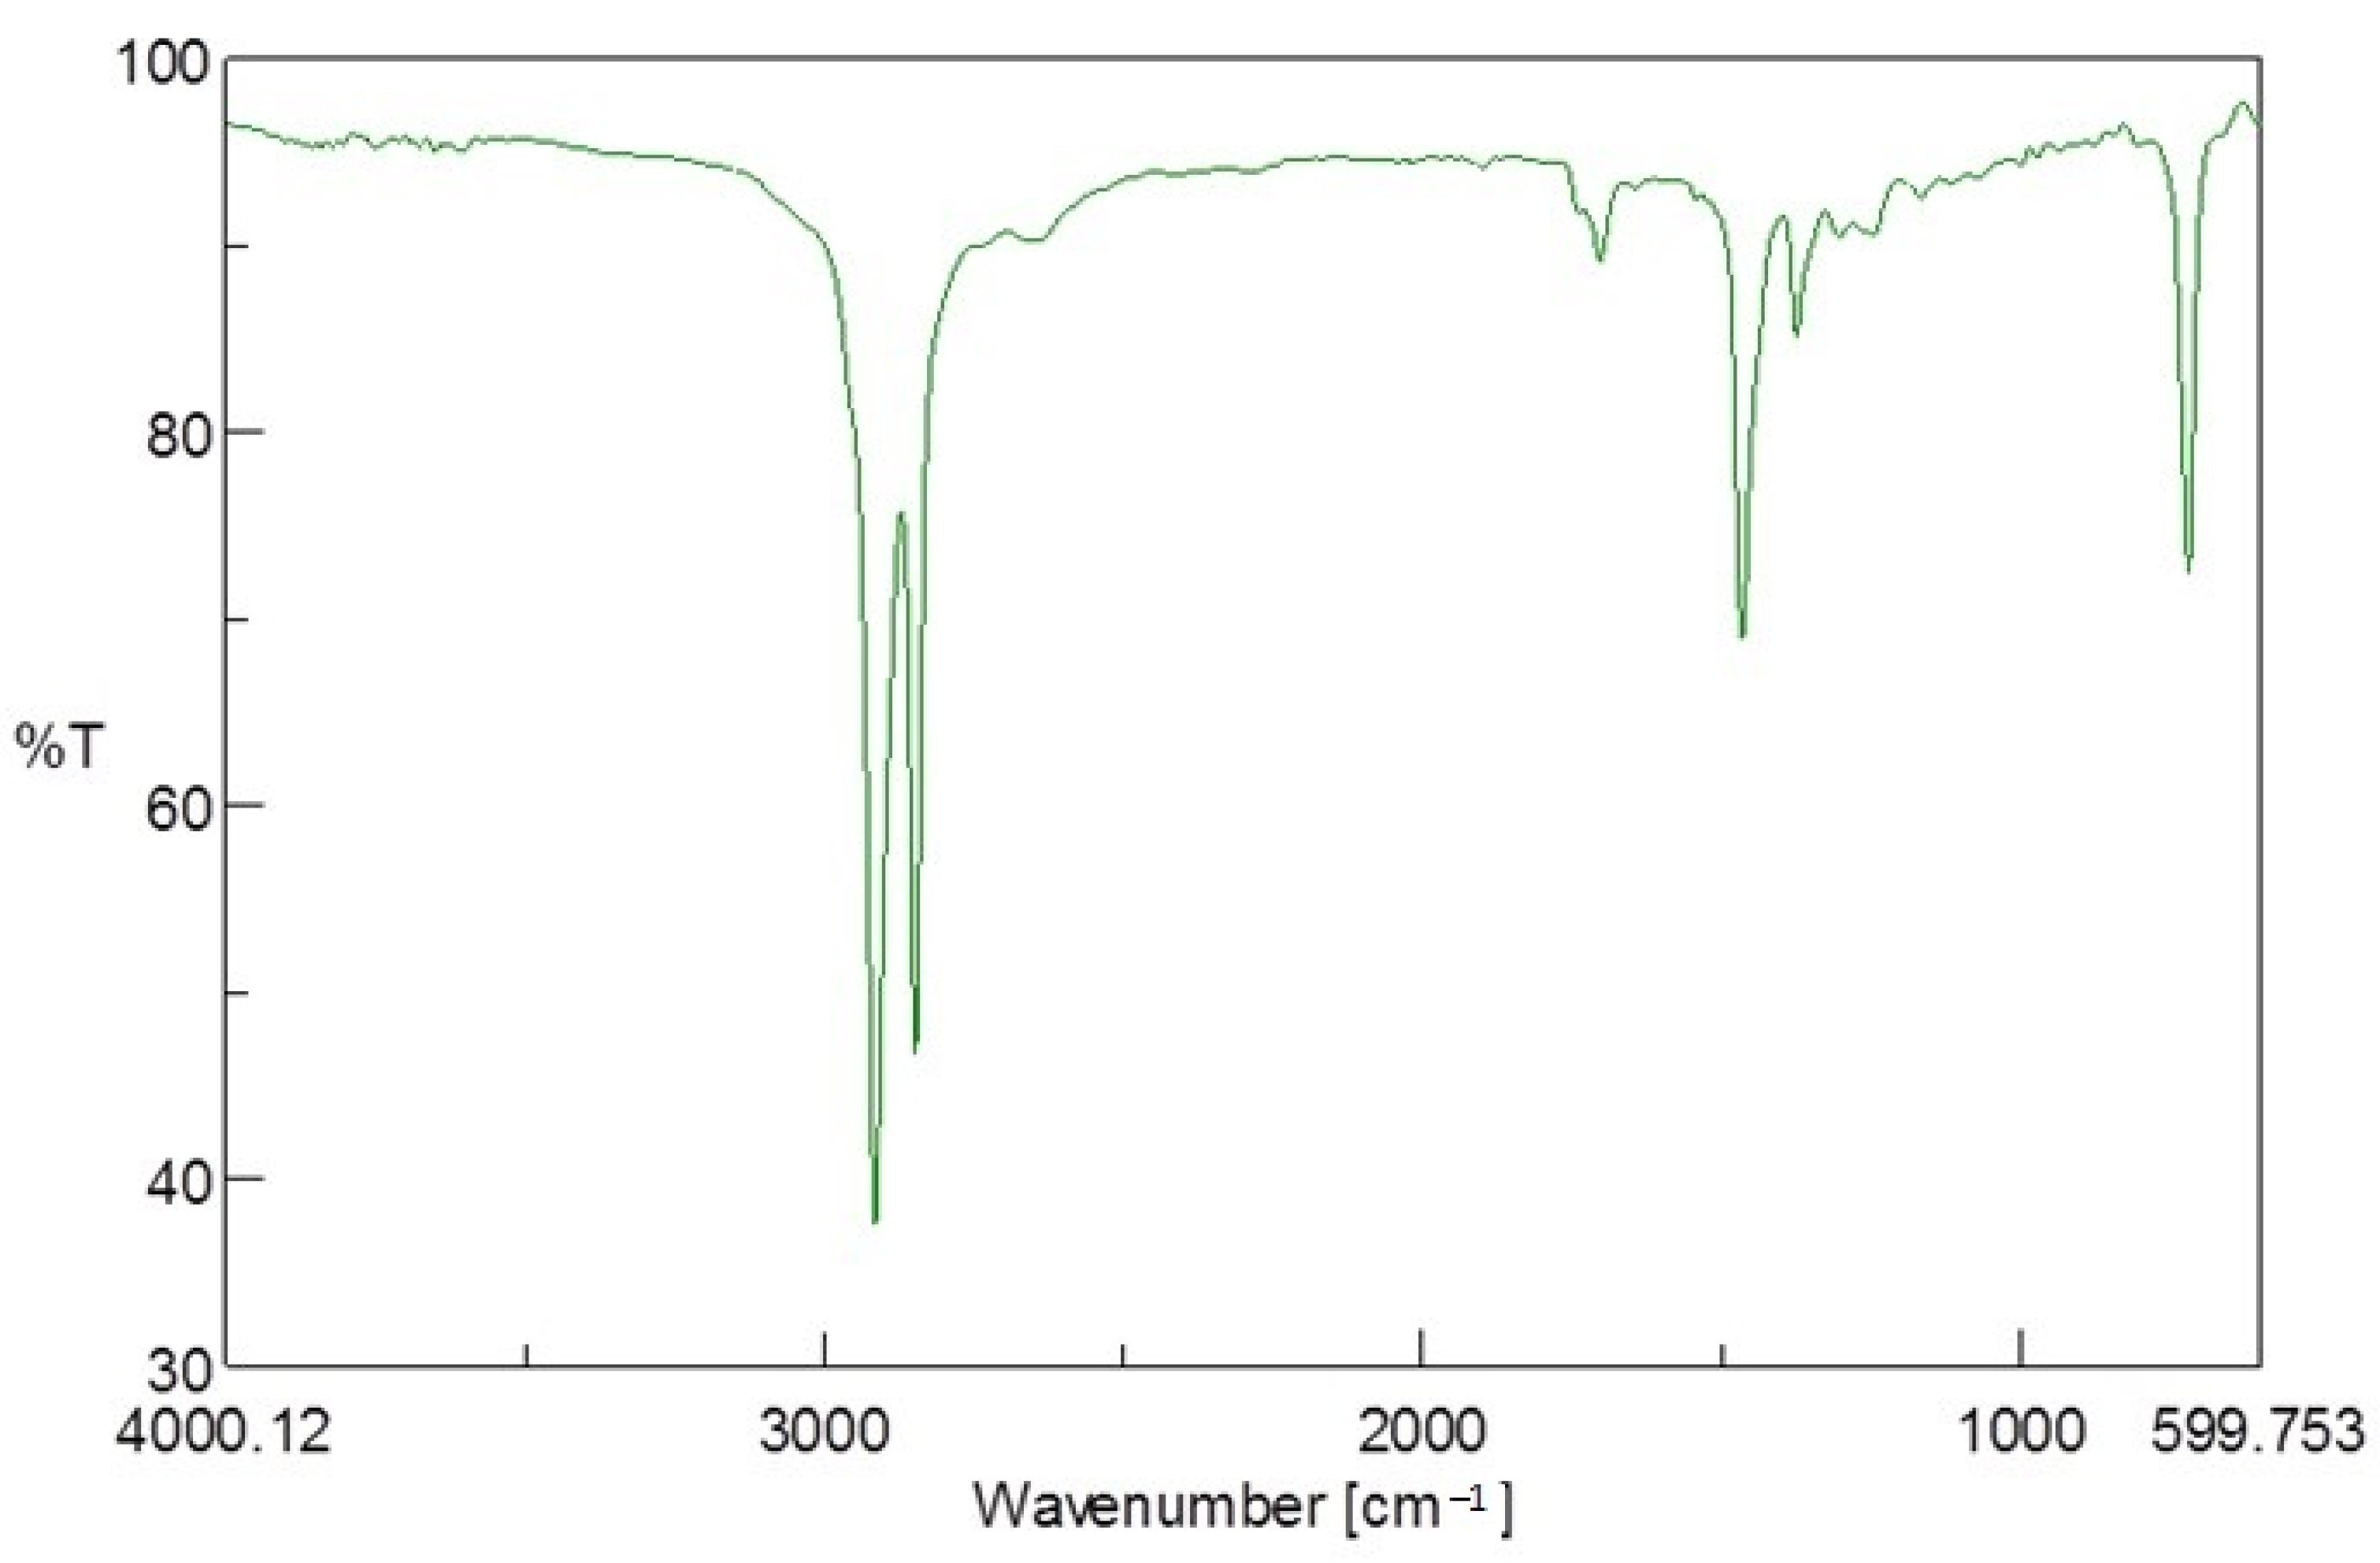
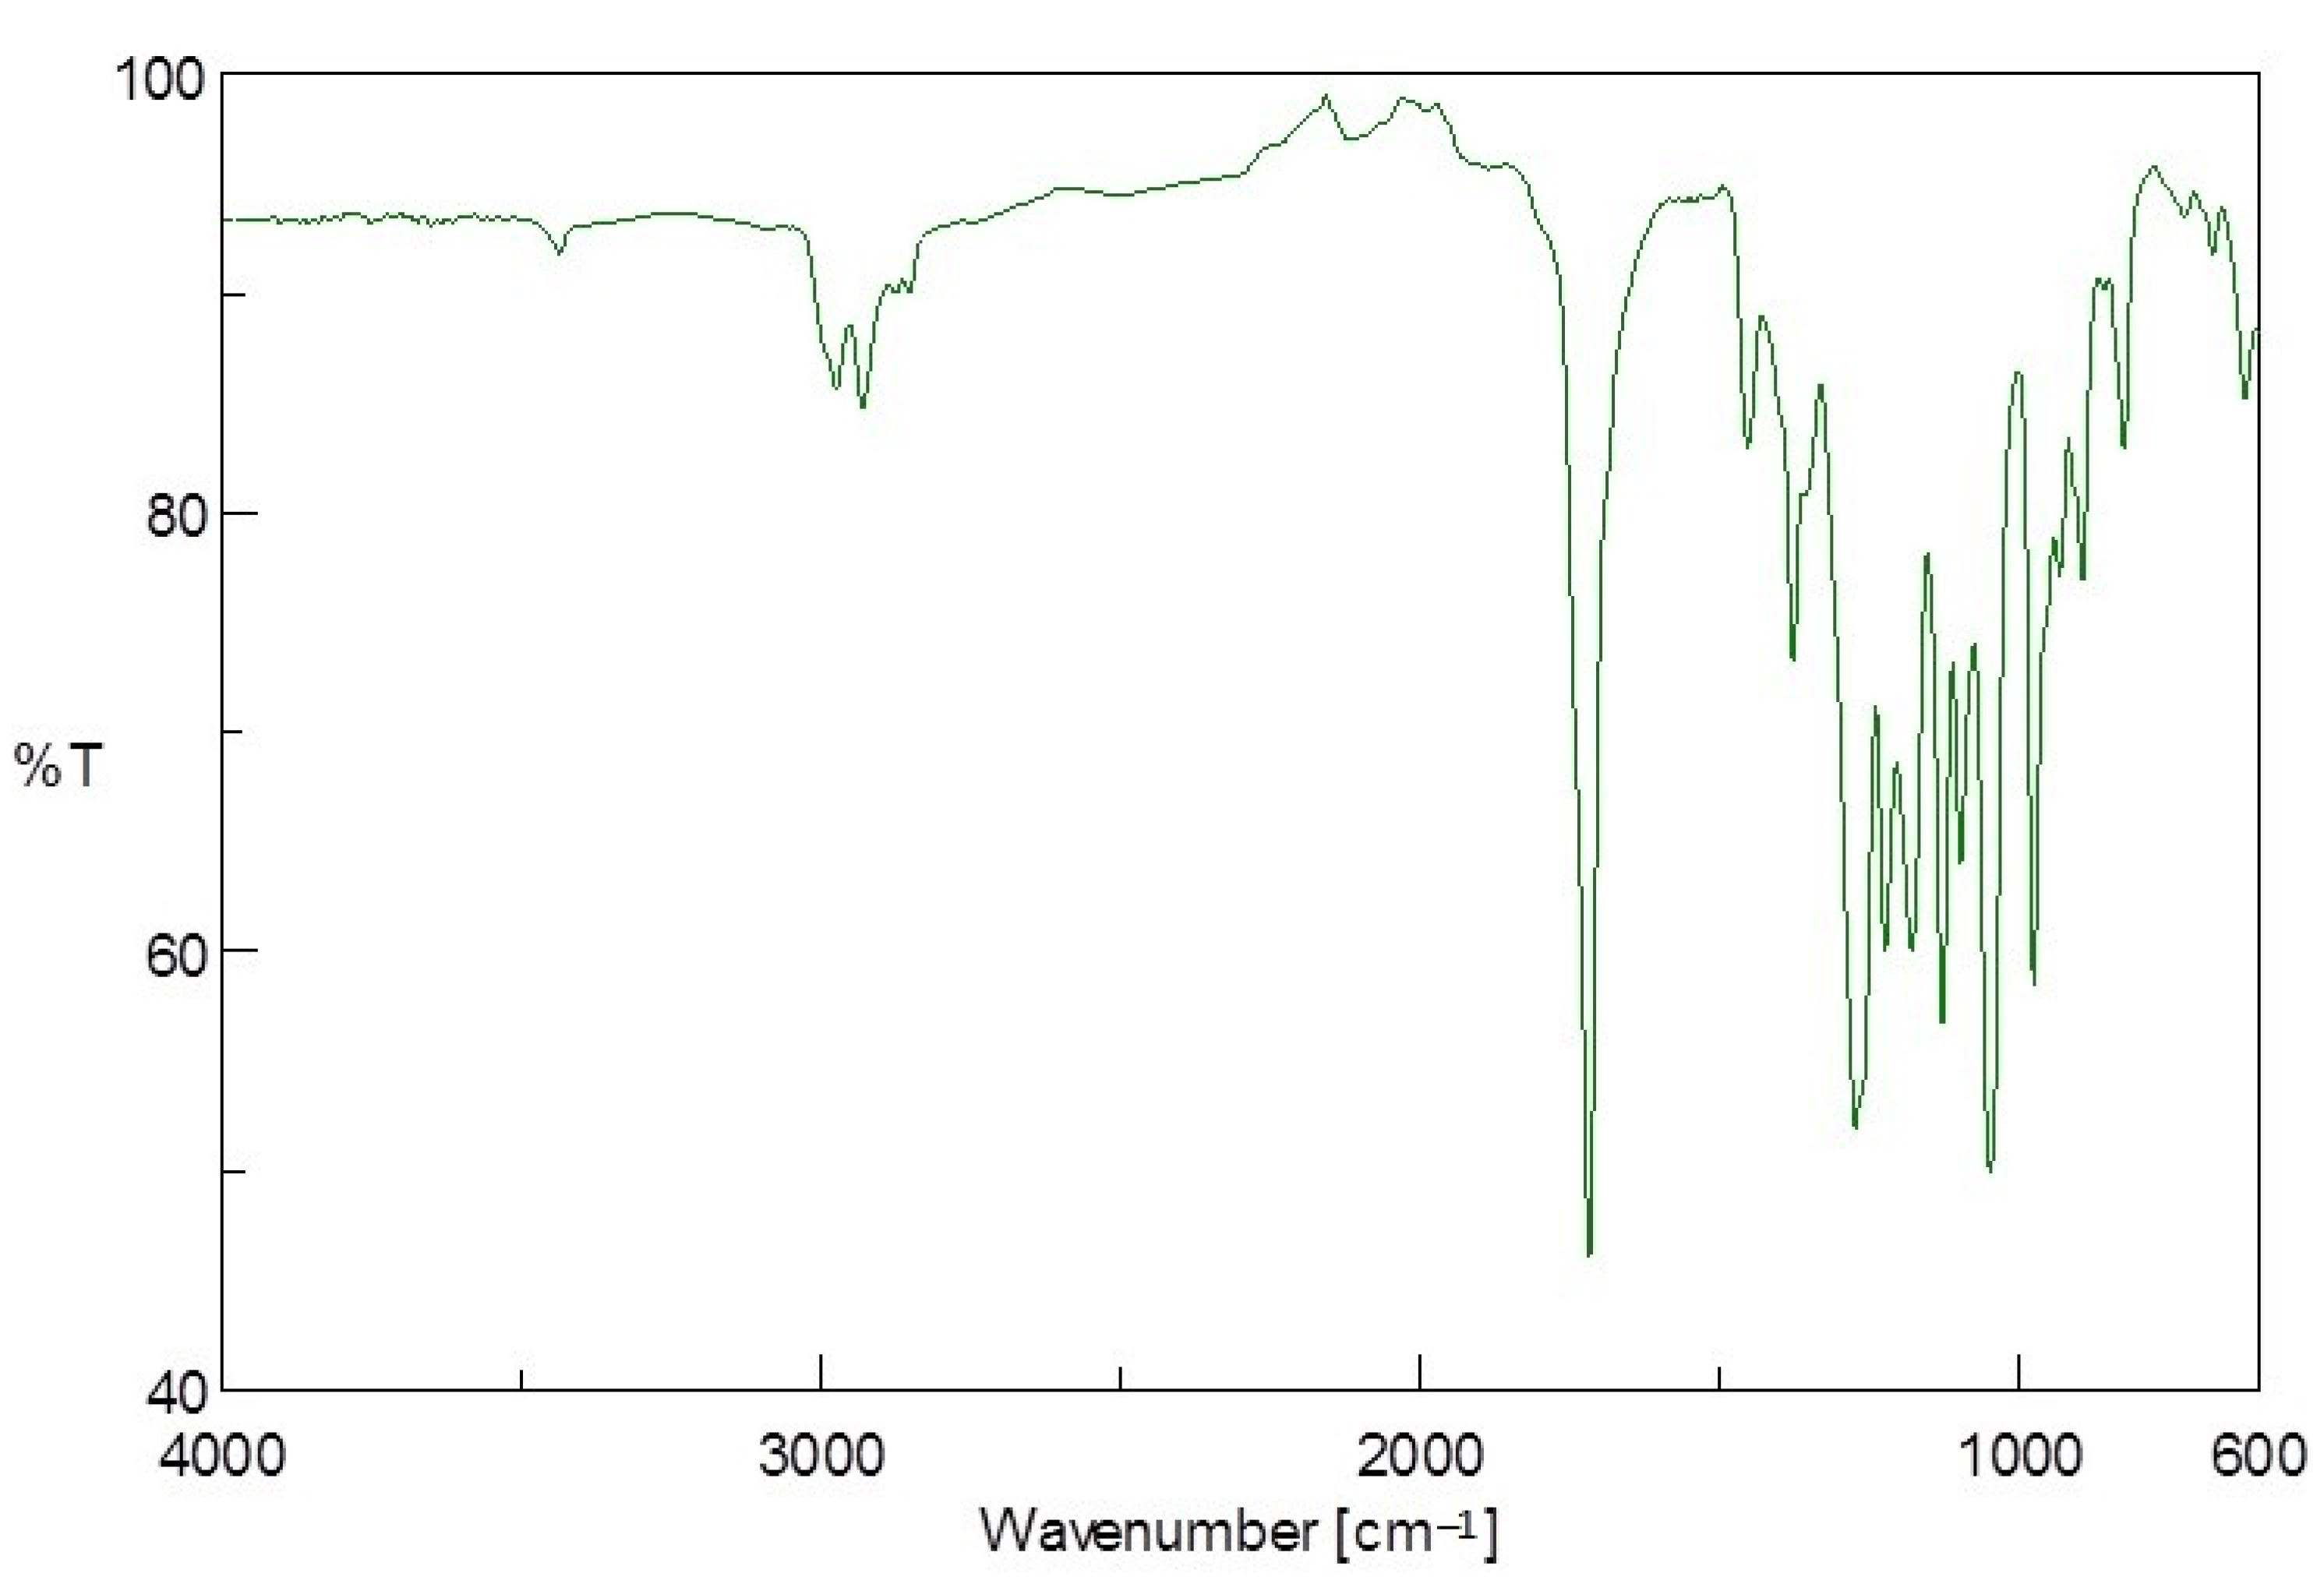
2.10. PE-T and PHA Characterisation
2.10.1. Fourier-Transform Infrared (FTIR) Spectroscopy
The PE-T and PHA polymers obtained after extraction were characterised using a Bruker FTIR spectrometer (UK) with an alpha platinum single-reflection diamond attenuated total reflectance (ATR) module. The sample loading jet was cleaned with acetone, after which a thin layer of the polymer sample was loaded and secured with the loading knob. The absorbance spectra of the samples were recorded at wavenumber values between 4000 and 500 cm−1, and 10 scans were carried out.
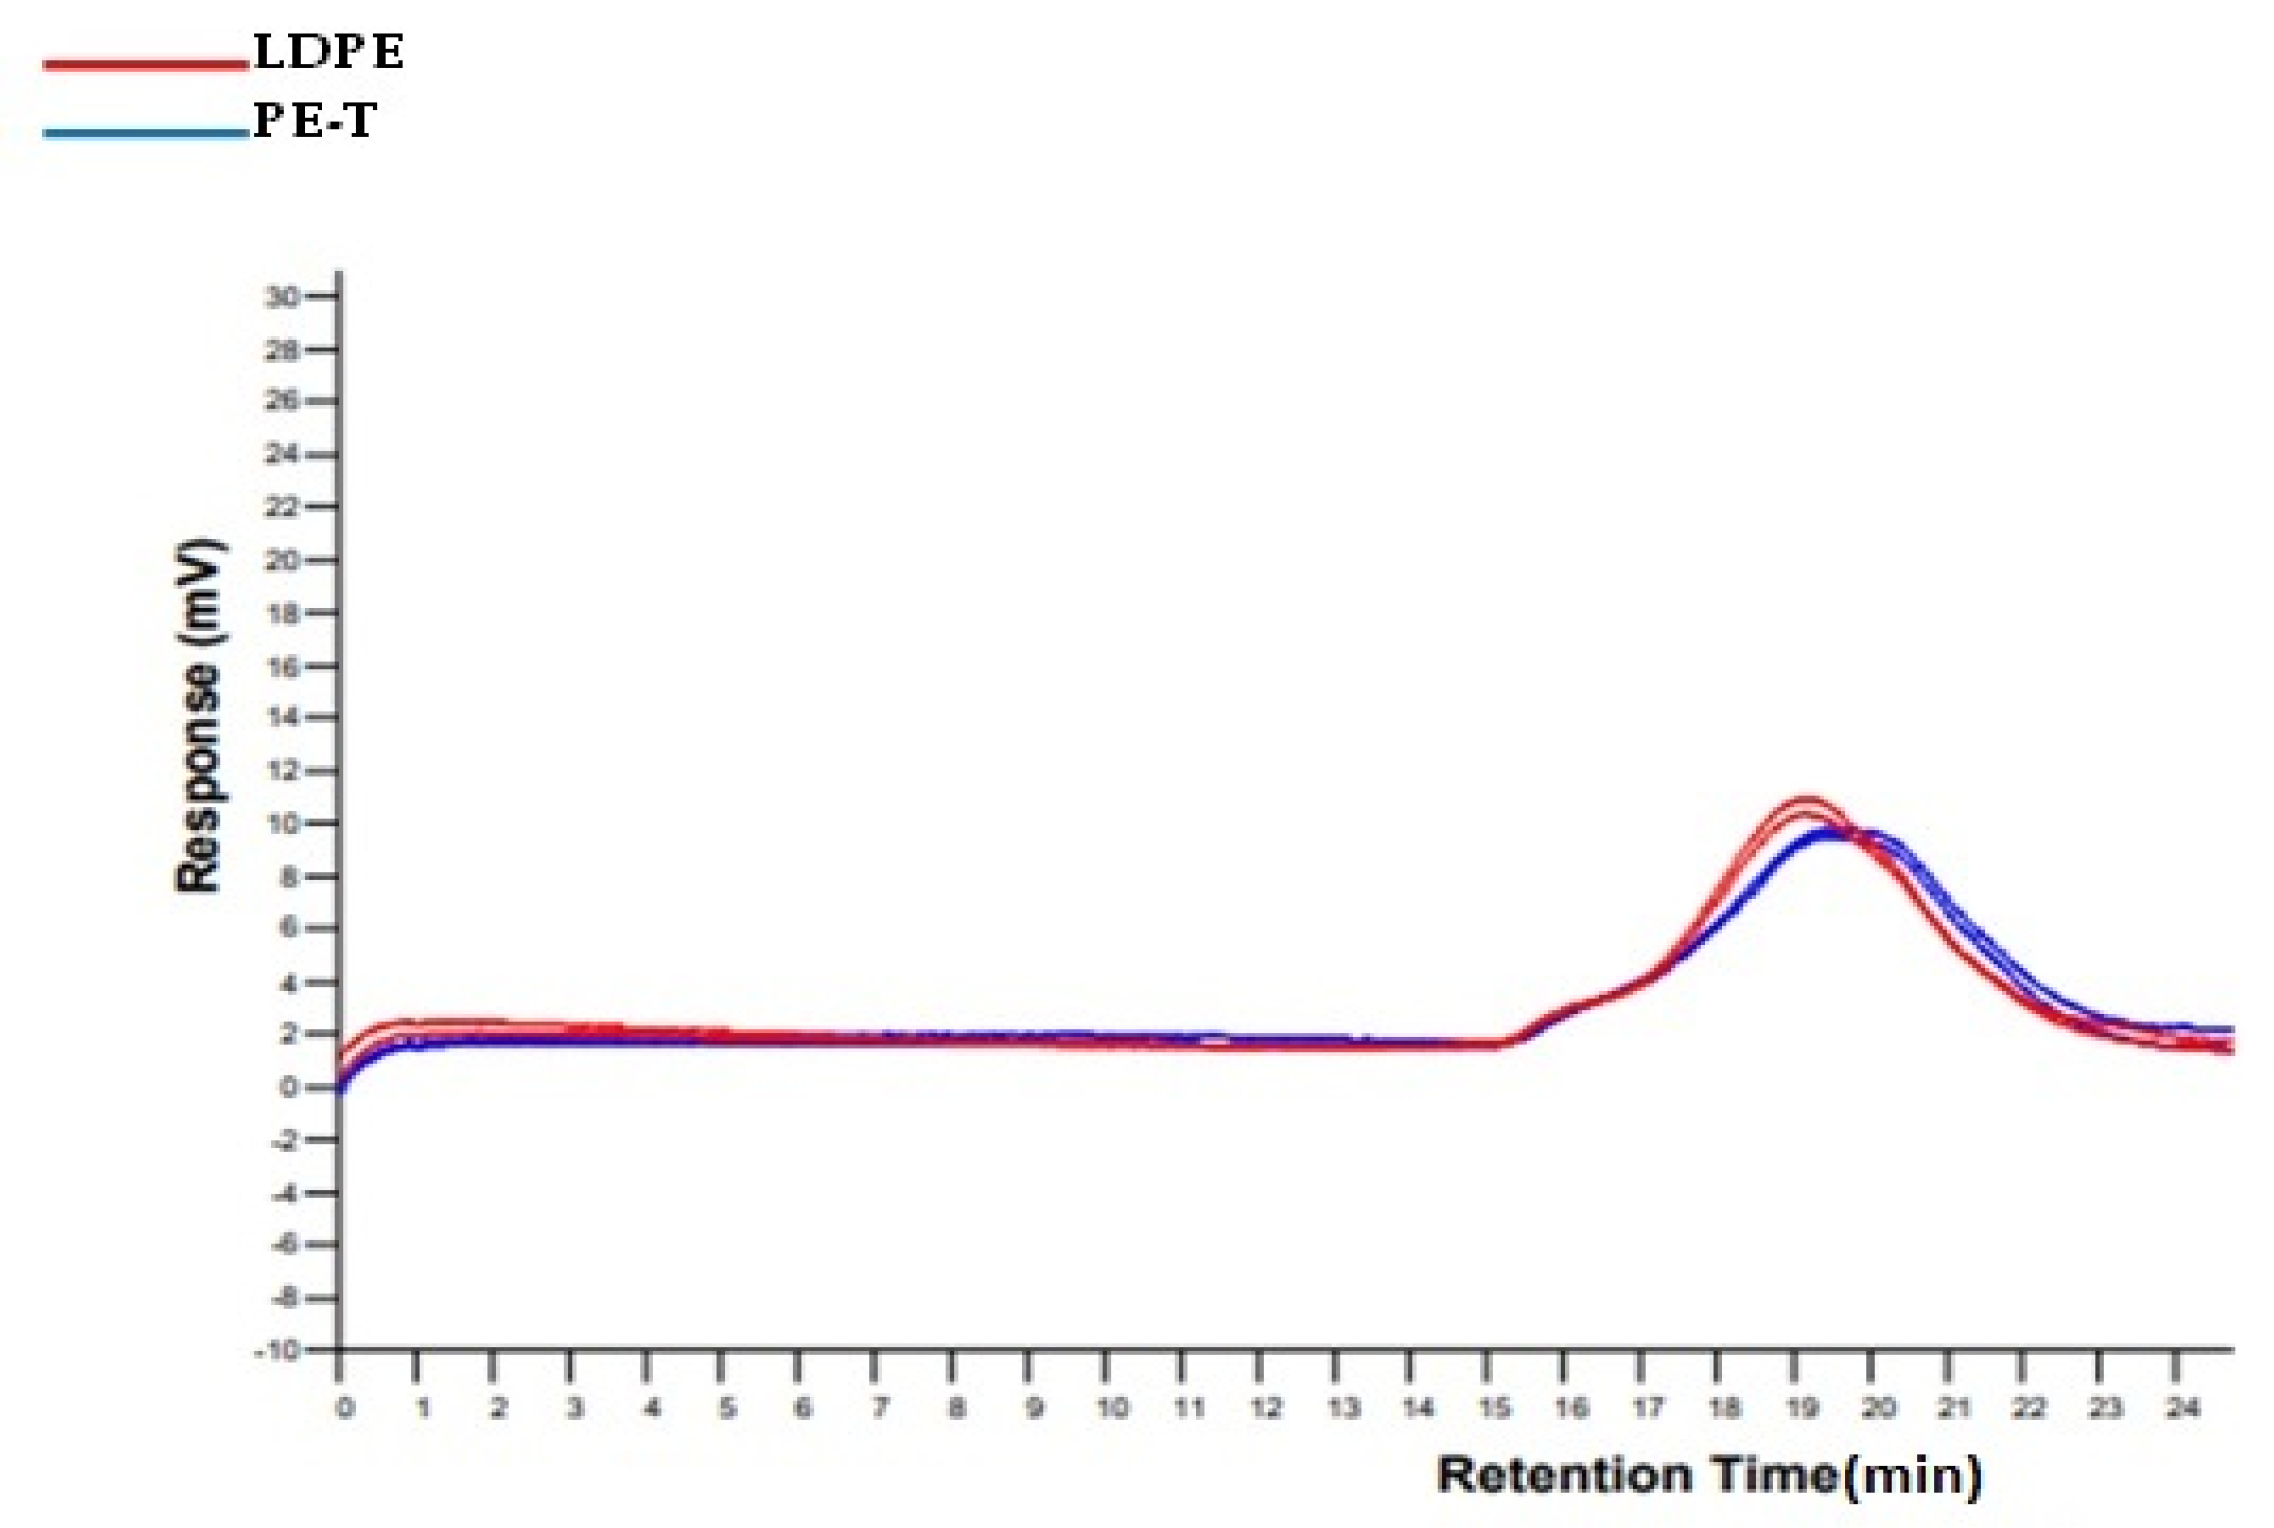
2.10.2. Gel Permeation Chromatography (GPC) Analysis of PE-T
The GPC experiments for plain LDPE—used for Tetra Pak® production—and PE-T were conducted in a 1,2,4-trichlorobenzene solution (with antioxidant) at 160 °C, and at a flow rate of 1 mL/min, using an Agilent PL GPC220 Integrated HT GPC system with Agilent PLgel Olexis guard plus 3 × Olexis, 30 cm, 13 μm columns in series, and a refractive index detector (with differential pressure and light scattering). A single solution of each sample was prepared by adding 15 mL of eluent to 15 mg of sample and heating at 190 °C for 20 min while shaking. The solutions were allowed to cool to 160 °C, and were then filtered through a 1.0 μm glass-fibre mesh. The solutions were filtered directly into autosampler vials, and injection of samples was carried out automatically. The GPC system used was calibrated using a series of Agilent/Polymer Laboratories EasiVial PS-H polystyrene calibrants, but a mathematical procedure involving the use of viscosity constants from the literature was applied to the calibration to express the results in the same manner as for linear polyethylene.
2.10.3. GPC Analysis of PHA
The number-average molar mass (Mn) and the molar mass distribution index (Mw/Mn) of the obtained PHA samples were determined by GPC experiments conducted in a chloroform solution at 35 °C and at a flow rate of 1 mL/min using a Viscotek VE 1122 (Malvern, Worcestershire, UK) pump with two Mixed C PLgel Styragel columns (Agilent, Santa Clara, CA, USA) in series, and a Shodex SE 61 RI detector (Showa Denko, Munich, Germany). A volume of 10 μL of a chloroform sample solution (concentration 0.5% m/V) was injected into the system. The instrument was calibrated using polystyrene standards with low dispersity.
2.10.4. Nuclear Magnetic Resonance (NMR)
NMR analysis was carried out using a 600 MHz Bruker Avance II (Bruker, Rheinstetten, Germany) and a 400 MHz JEOL NMR spectrometer JNM-ECZ400R/M1 (Akishima, Tokyo, Japan). Deuterated chloroform was used as the solvent, and tetramethylsilane (TMS) as the internal standard.
2.10.5. Electrospray Tandem Mass Spectrometry Analysis (ESI-MS/MS)
Electrospray tandem mass spectrometry analysis was performed using a Finnigan LCQ ion trap mass spectrometer (Thermo Finnigan LCQ Fleet, San Jose, CA, USA). PHA obtained from each medium’s conditions was partially degraded to lower-mass PHA oligomers, which were then dissolved in a chloroform/methanol system (1:1
v/v) [
22]. The solutions were introduced into the ESI source by continuous infusion using the instrument syringe pump at a rate of 5 µL/min. The LCQ ESI source was operated at 4.5 kV, and the capillary heater was set to 200 °C; the nebulising gas applied was nitrogen. For ESI-MS/MS experiments, the ions of interest were isolated monoisotopically in the ion trap, and were activated by collisions. The helium damping gas that was present in the mass analyser acted as a collision gas. The analysis was performed in the positive-ion mode.
2.10.6. 14C analysis (AMS Technique)
Combustion of organic samples was performed in closed (sealed under vacuum) quartz tubes with CuO and Ag wool at 900 °C for 10 h. The obtained gas (CO
2 + water vapour) was then dried in a vacuum line and reduced with hydrogen (H
2) using 2 mg of iron powder as a catalyst. The
14C content in the carbon samples was determined using a “Compact Carbon AMS” spectrometer [
26], by comparing the intensities of ionic beams of
14C,
13C, and
12C measured for each sample and for standard samples (the modern standard “Oxalic Acid II” and the standard of 14C-free carbon “background”). The
14C content in each sample was then expressed as a percentage of modern carbon (pMC), calculated using correction for isotopic fractionation [
27].
4. Discussion
The use of post-consumer waste products as feedstock for PHA production could enhance its process economics and market implementation. In addition, employing the PE component in waste Tetra Pak
® as feedstock for PHA production would be an economical and excellent Tetra Pak
® recycling technique for curbing Tetra Pak
® waste streams while producing value-added PHA biopolymer. One major attribute of
C. necator is its ability to accumulate PHA from various substrates, including glucose and fatty acids [
30]. Here, the metabolism of this strain was evaluated in terms of its ability to produce PHA by utilising PE-T from Tetra Pak
® waste as the sole or an additional carbon source.
Generally, LDPE is an amorphous polymer with short branches comprising one or more co-monomers (such as 1-octene and 1-hexene) [
31]. During sonication, the PE molecules are prevented from stacking closely together, due to its branching system, thus making the tertiary carbon atoms present at the branch sites more accessible and susceptible to microbial attack [
31]. As also revealed by the FTIR analysis, and previously reported by Ojeda et al. [
32], some carbonyl and hydroperoxide groups may also be present in the PE polymer, and could further improve the accessibility of the PE-T substrate. These short side chains may have been consumed first by
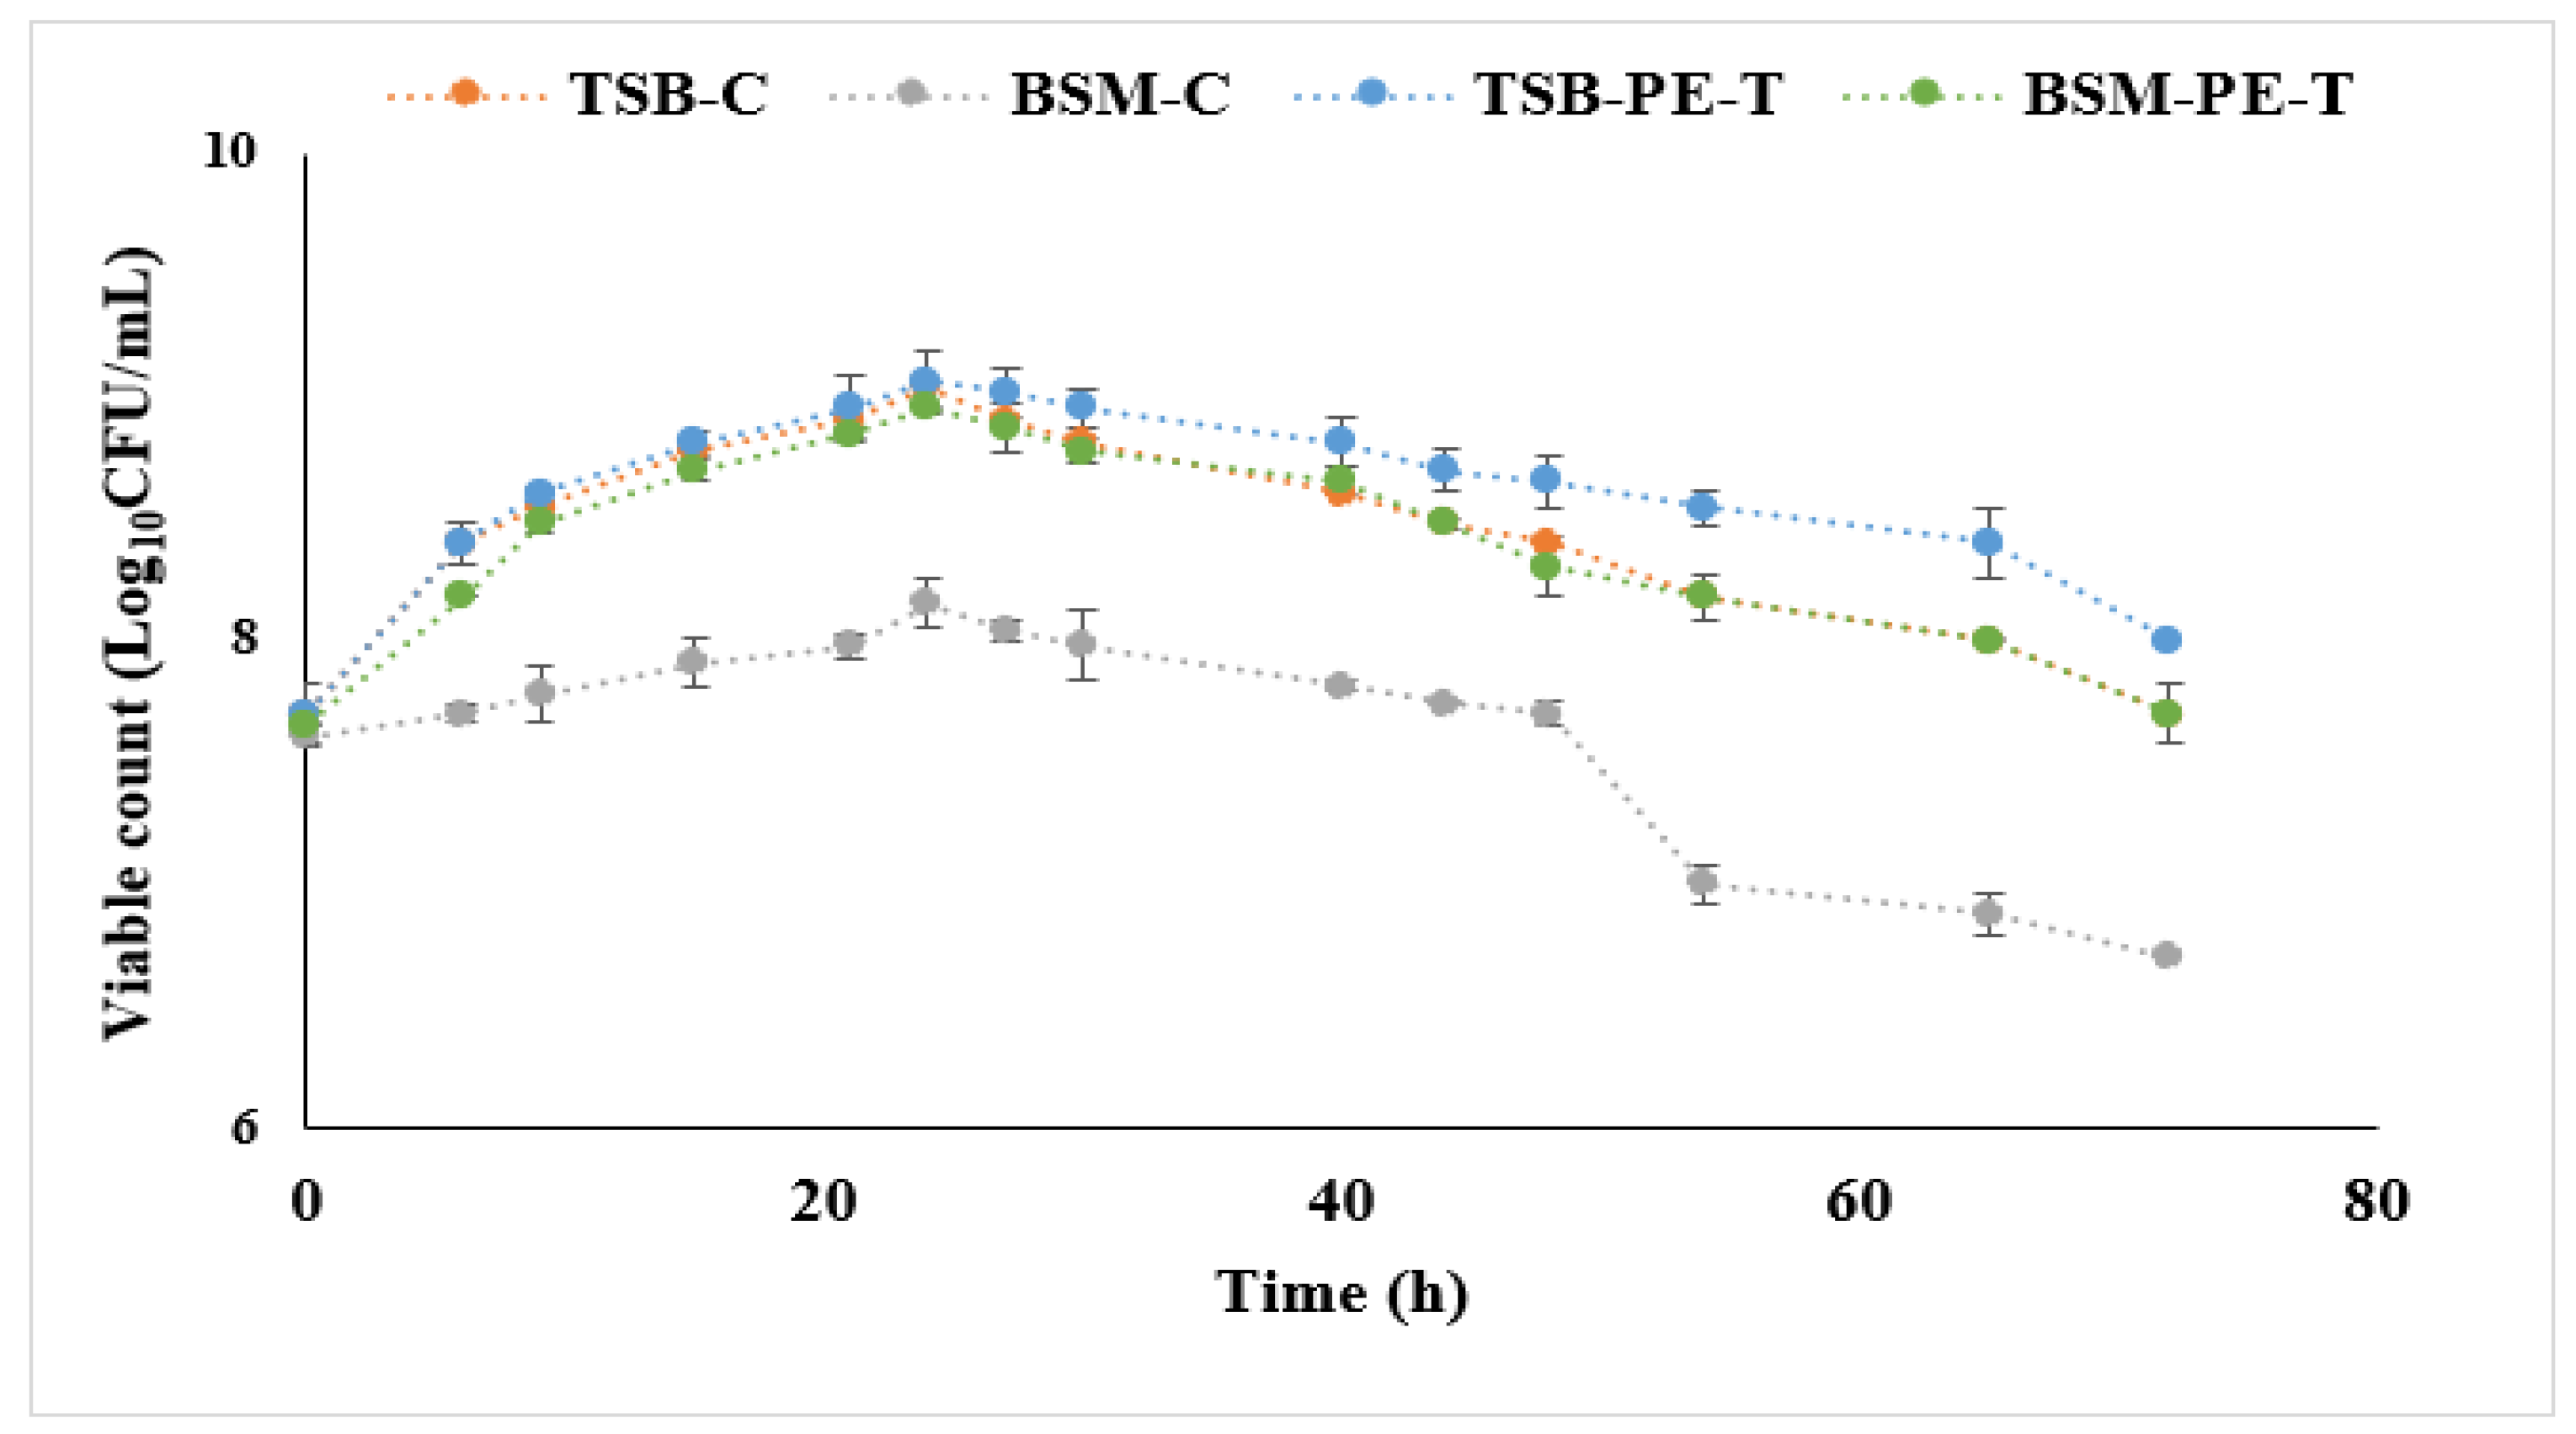
C. necator to maintain viability. In addition, the growth curve (
Figure 5) shows that PE-T was consumed during incubation, as indicated by the increase in biomass when TSB was supplemented with PE-T. Furthermore, the ability of
C. necator to remain viable in BSM limited in nitrogen content also suggests that PE-T substrates exhibit no antimicrobial properties and, thus, have no negative effects on the growth of
C. necator in either TSB or BSM. This finding is consistent with a previous report by Gregorova et al. [
33]. The cultivation of
C. necator in all performed experiments was started with high cell numbers to create high-cell-density cultures. This should quickly create a stress condition, resulting in slow cell growth or even growth inhibition whilst enhancing the production of non-growth-linked metabolites such as PHAs in both non-limited (TSB) and limited (BSM) nitrogen conditions. It is known that PHAs are produced by bacteria under stress conditions [
34,
35]. In high-cell-density cultivation, cells are subjected to oxygen limitation (as cells compete for oxygen) and, furthermore, to the accumulation of toxic metabolites during incubation. Therefore, as a result,
C. necator showed a small increase in the cell numbers in TSB and/or BSM with Tetra Pak
® and without it (controls).
It can be assumed from this study that PE-T could be used as a carbon source by
C. necator. While limited growth was observed with both TSB and BSM media, PHA accumulation occurred in TSB medium only (
Table 3). As observed in previous studies [
34,
35], the limited nitrogen content in BSM hinders its influence on PHA accumulation. The maximum PHA yield (40% CDW) obtained in this study was achieved after 48 h of growth in TSB supplemented with PE-T. The purification process of PE conducted in this study obviously facilitated the easier utilisation of PE-T by
C. necator, resulting in higher PHA accumulation. The percentage PHA yield per cell dry weight obtained for PE-T (40% CDW) was considerably higher than in PE studies recently published by Ekere et al. [
23] (29% CDW), Radecka et al. [
34] (33% CDW), Guzik et al. [
18] (25% CDW), and Johnston et al. [
30] (32% CDW), when LDPE, oxidised PE wax, PE pyrolysed wax, and non-oxygenated PE wax, respectively, were used as carbon sources for aerobic PHA production. The compositional changes that may have occurred during the PE-T purification process could have facilitated microbial attachment and, thus, be responsible for the increased PHA yield in our study. Moreover, no form of contamination was observed in the PHA produced.
It is important to evaluate the biological contents of microbial bioplastics sourced from petroleum-based carbon resources to promote the use of bioplastics, reduce CO
2 emissions into the atmosphere, and distinguish carbon atoms obtained from petroleum and those obtained from biomass [
36,
37]. Carbon-14 ratio measurement by AMS is the primary evaluation method commonly used for this purpose. The accuracy of this evaluation method has been previously demonstrated [
36,
37]; hence, its application in this study. The
14C method provided insight into the bio-derived fractions of the PHA obtained from this study. Employing radiocarbon analysis for this purpose was based on the large difference in
14C isotopic signatures between the petroleum-derived component (
14C free) and the biogenic component of carbon-based materials [
36]. This relies on the mechanism that modern biomass carbons comprise a certain (although very low) level of
14C, whereas petroleum carbons do not contain
14C [
38]. Thus, by measuring the carbon-14 content of a bioplastic product derived from petrochemical sources, a ratio between carbon originating from the bio-based component (i.e., modern carbon) and that originating from the petroleum-derived components (i.e., old carbon) can be derived [
39,
40]. The AMS results showed that the starting purified LDPE sample (PE-T) had an old carbon content of 99.5%, and in the case of PHA obtained from TSB supplemented with PE-T, almost 97% of its carbon content was modern carbon derived from direct synthesis by
C. necator, whereas only 3% was derived from old carbon present in the PE component of the Tetra Pak
® material. This further proves the potential of the bioconversion process proposed in this study for waste Tetra Pak
® packaging materials, and its use for PHA production.
More recent studies of microbial utilisation of PE polymers showed the use of PE polymer that had been subjected to some level of pretreatment technology [
18,
30,
34]. In our study, however, no pretreatment technique was employed. Irrespective of the absence of a PE pretreatment technique, the results obtained in our study suggest that the purification process leading to the formation of LDPE powder was enough to make the carbon monomers accessible for improved microbial utilisation. This further makes the PE-T sample recovered from Tetra Pak
® a suitable and economical carbon source for PHA production.
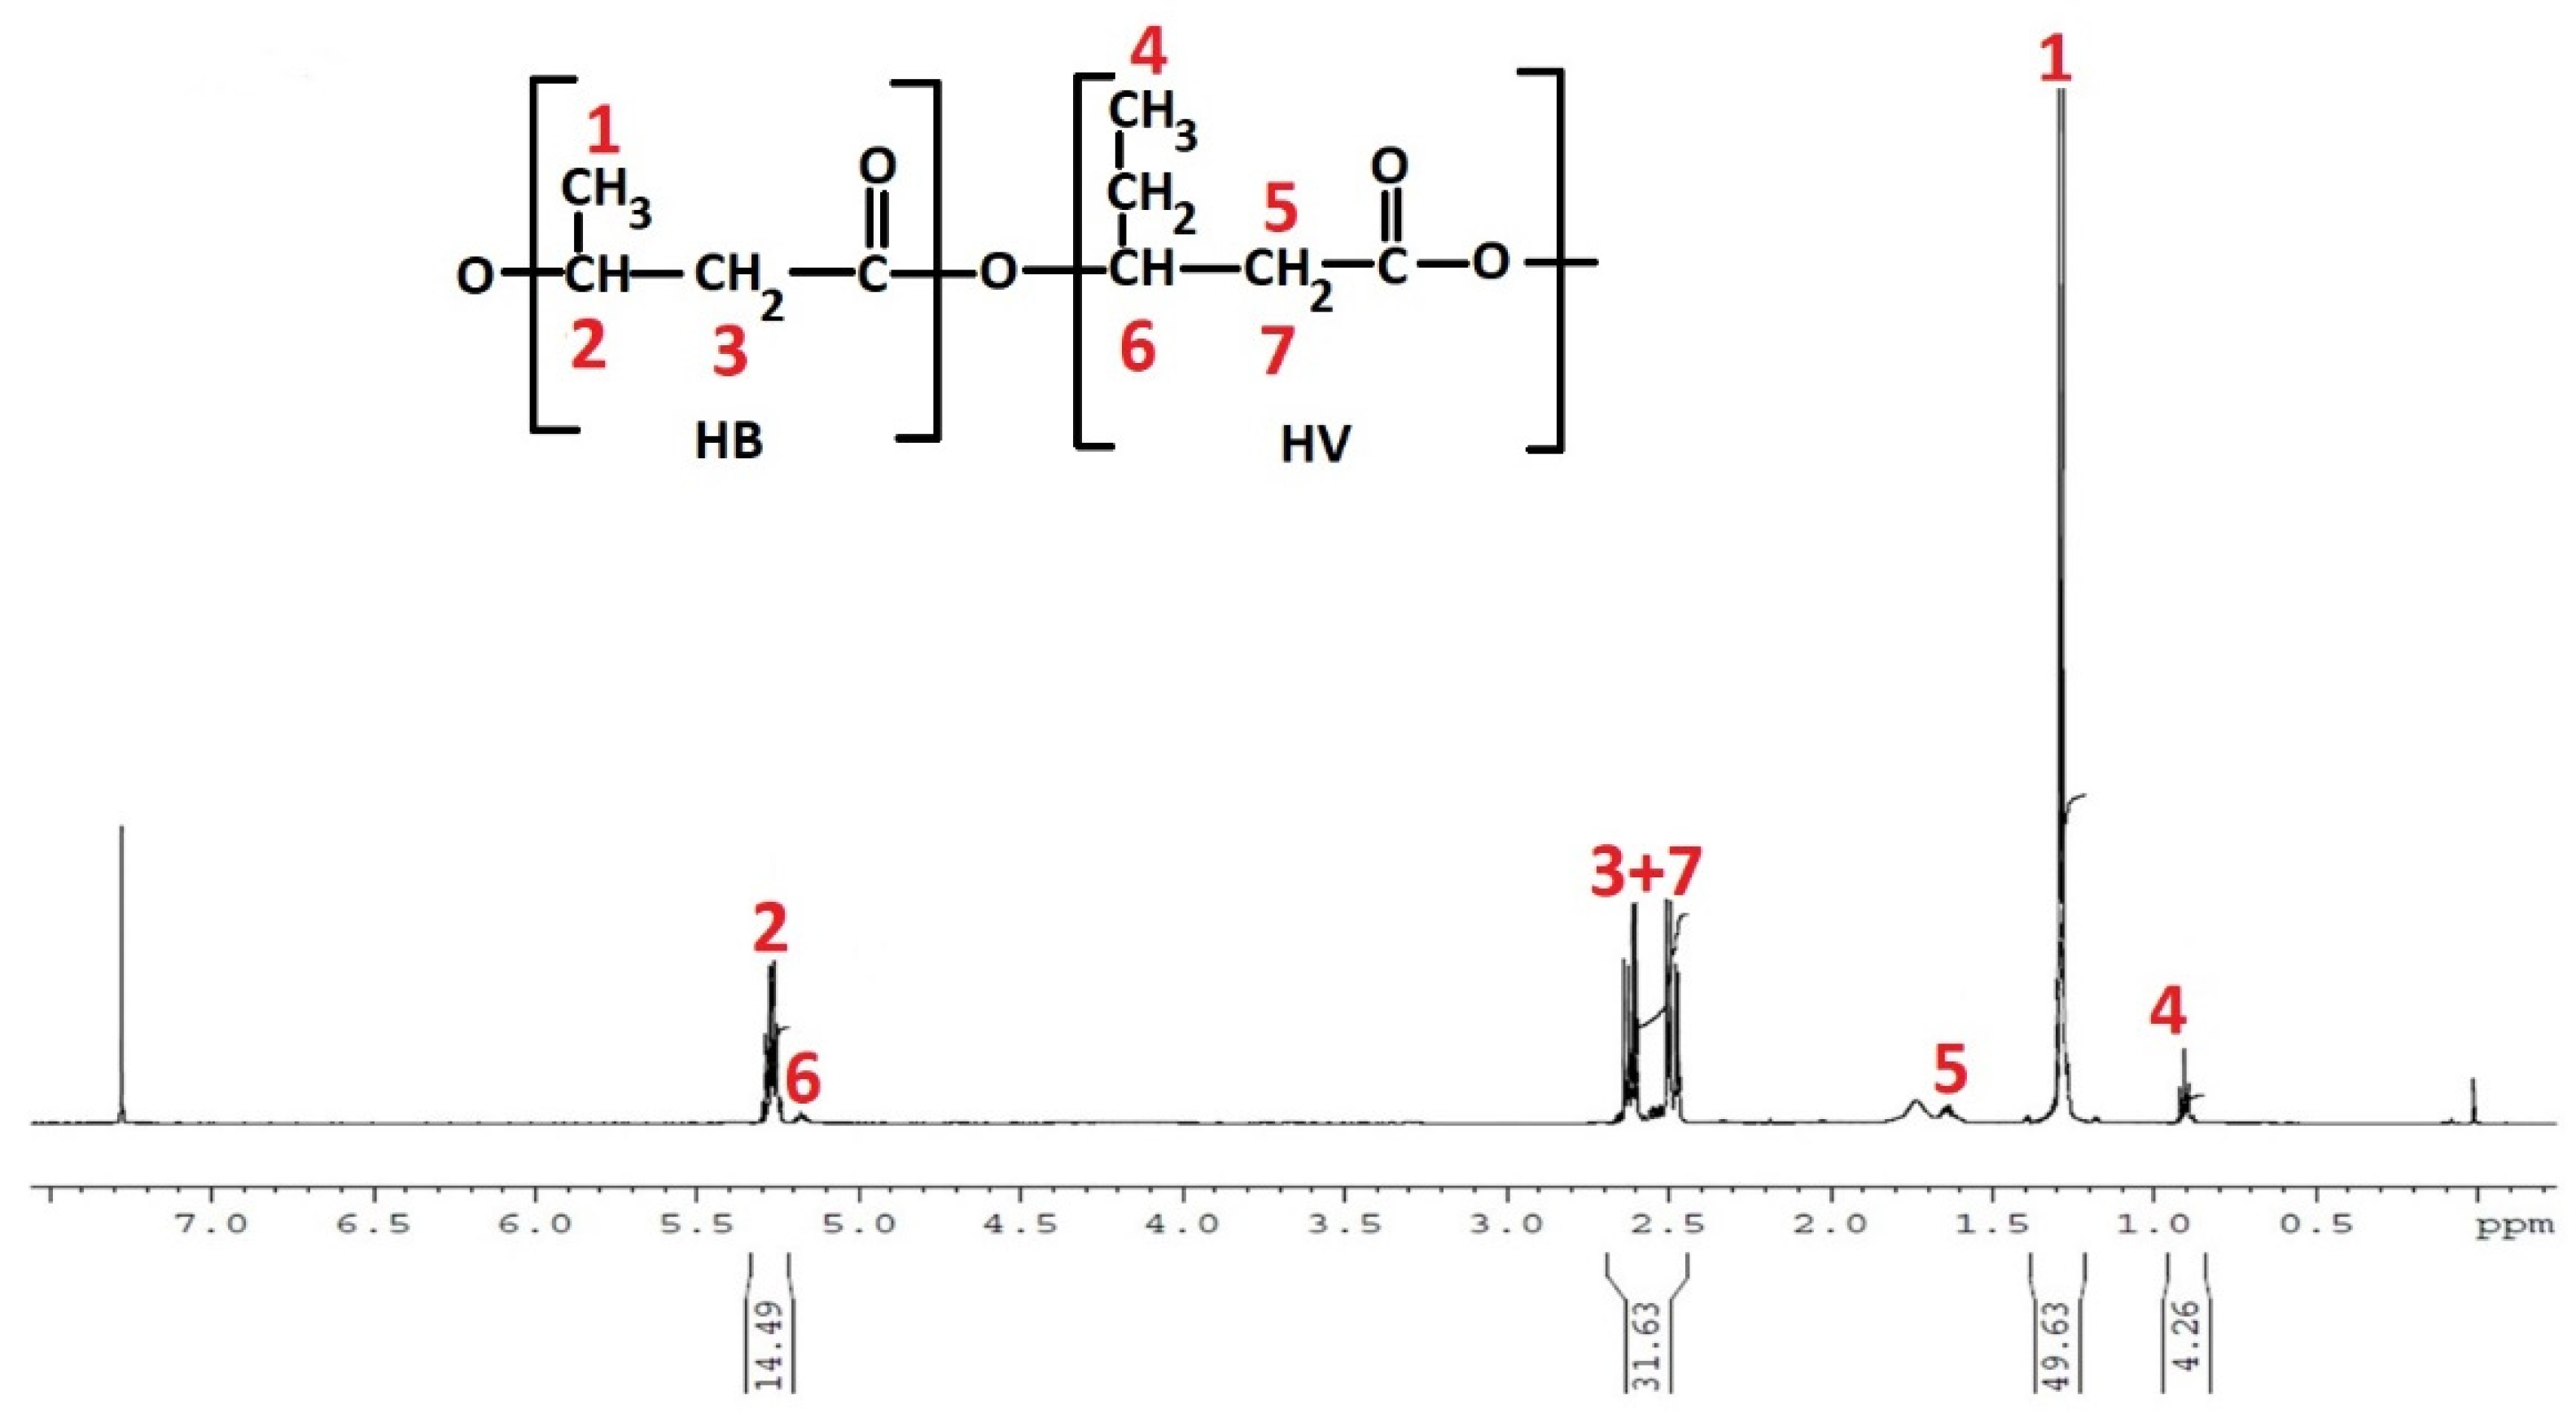
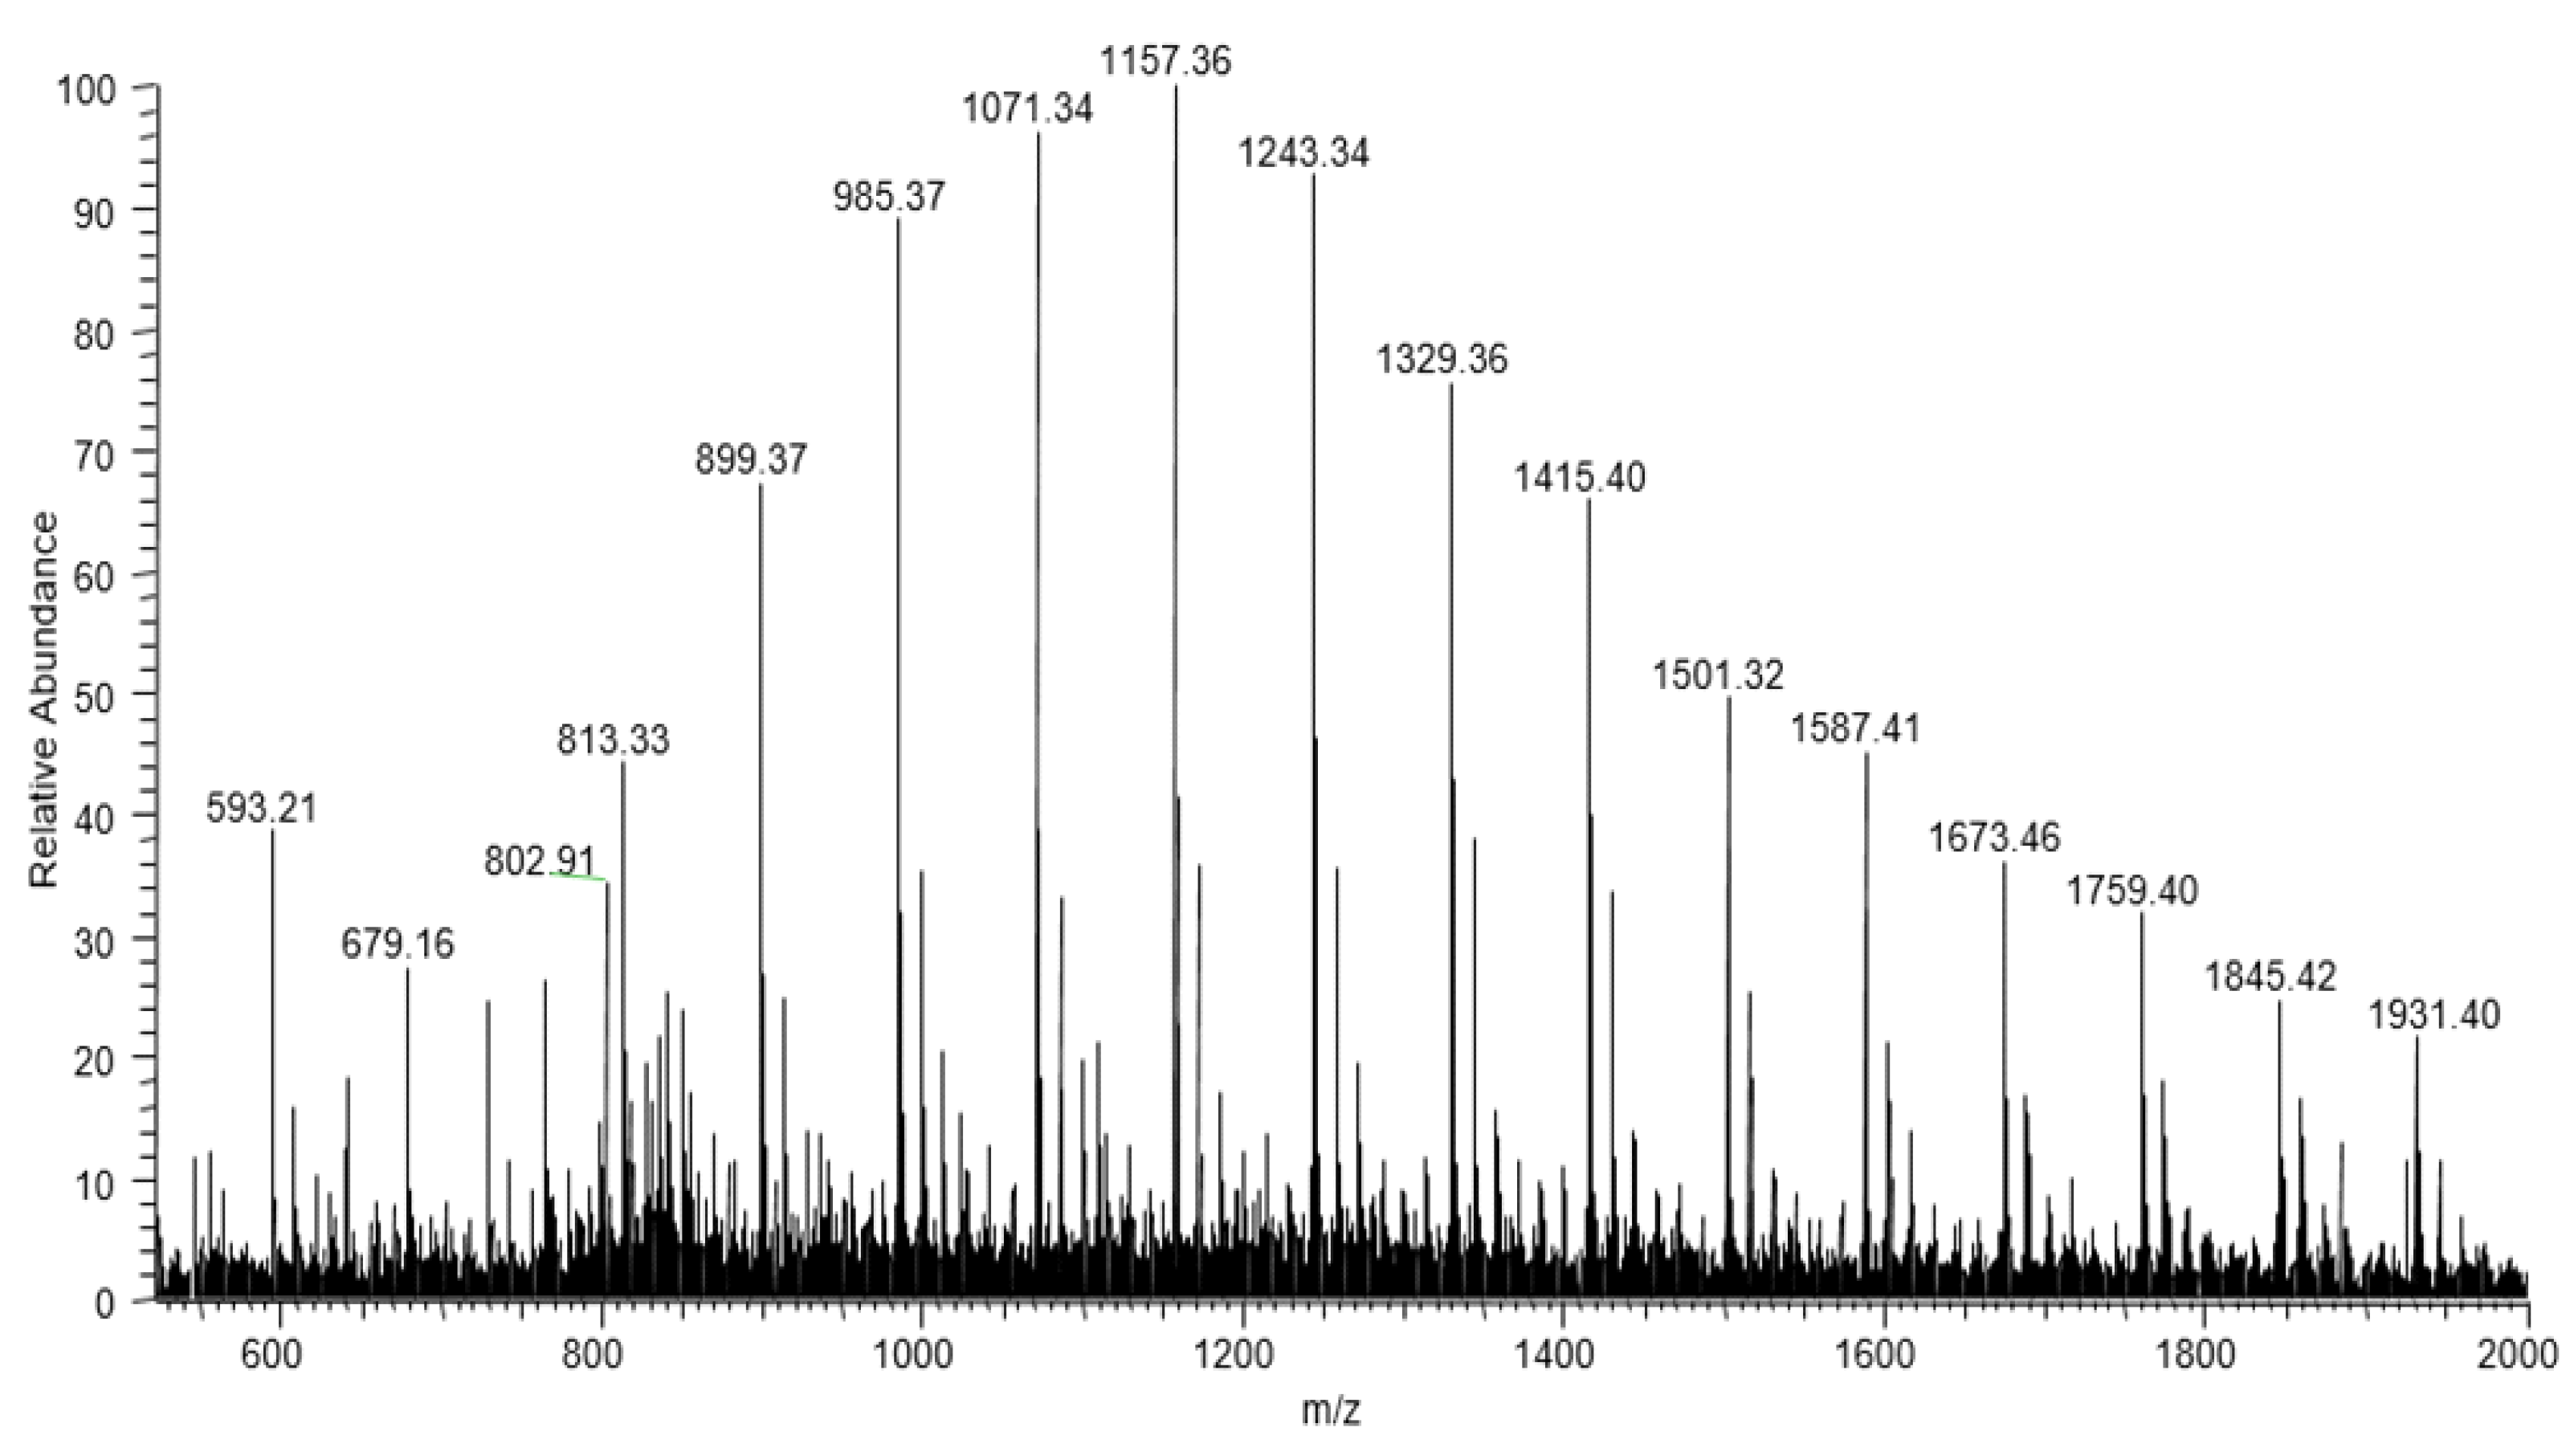
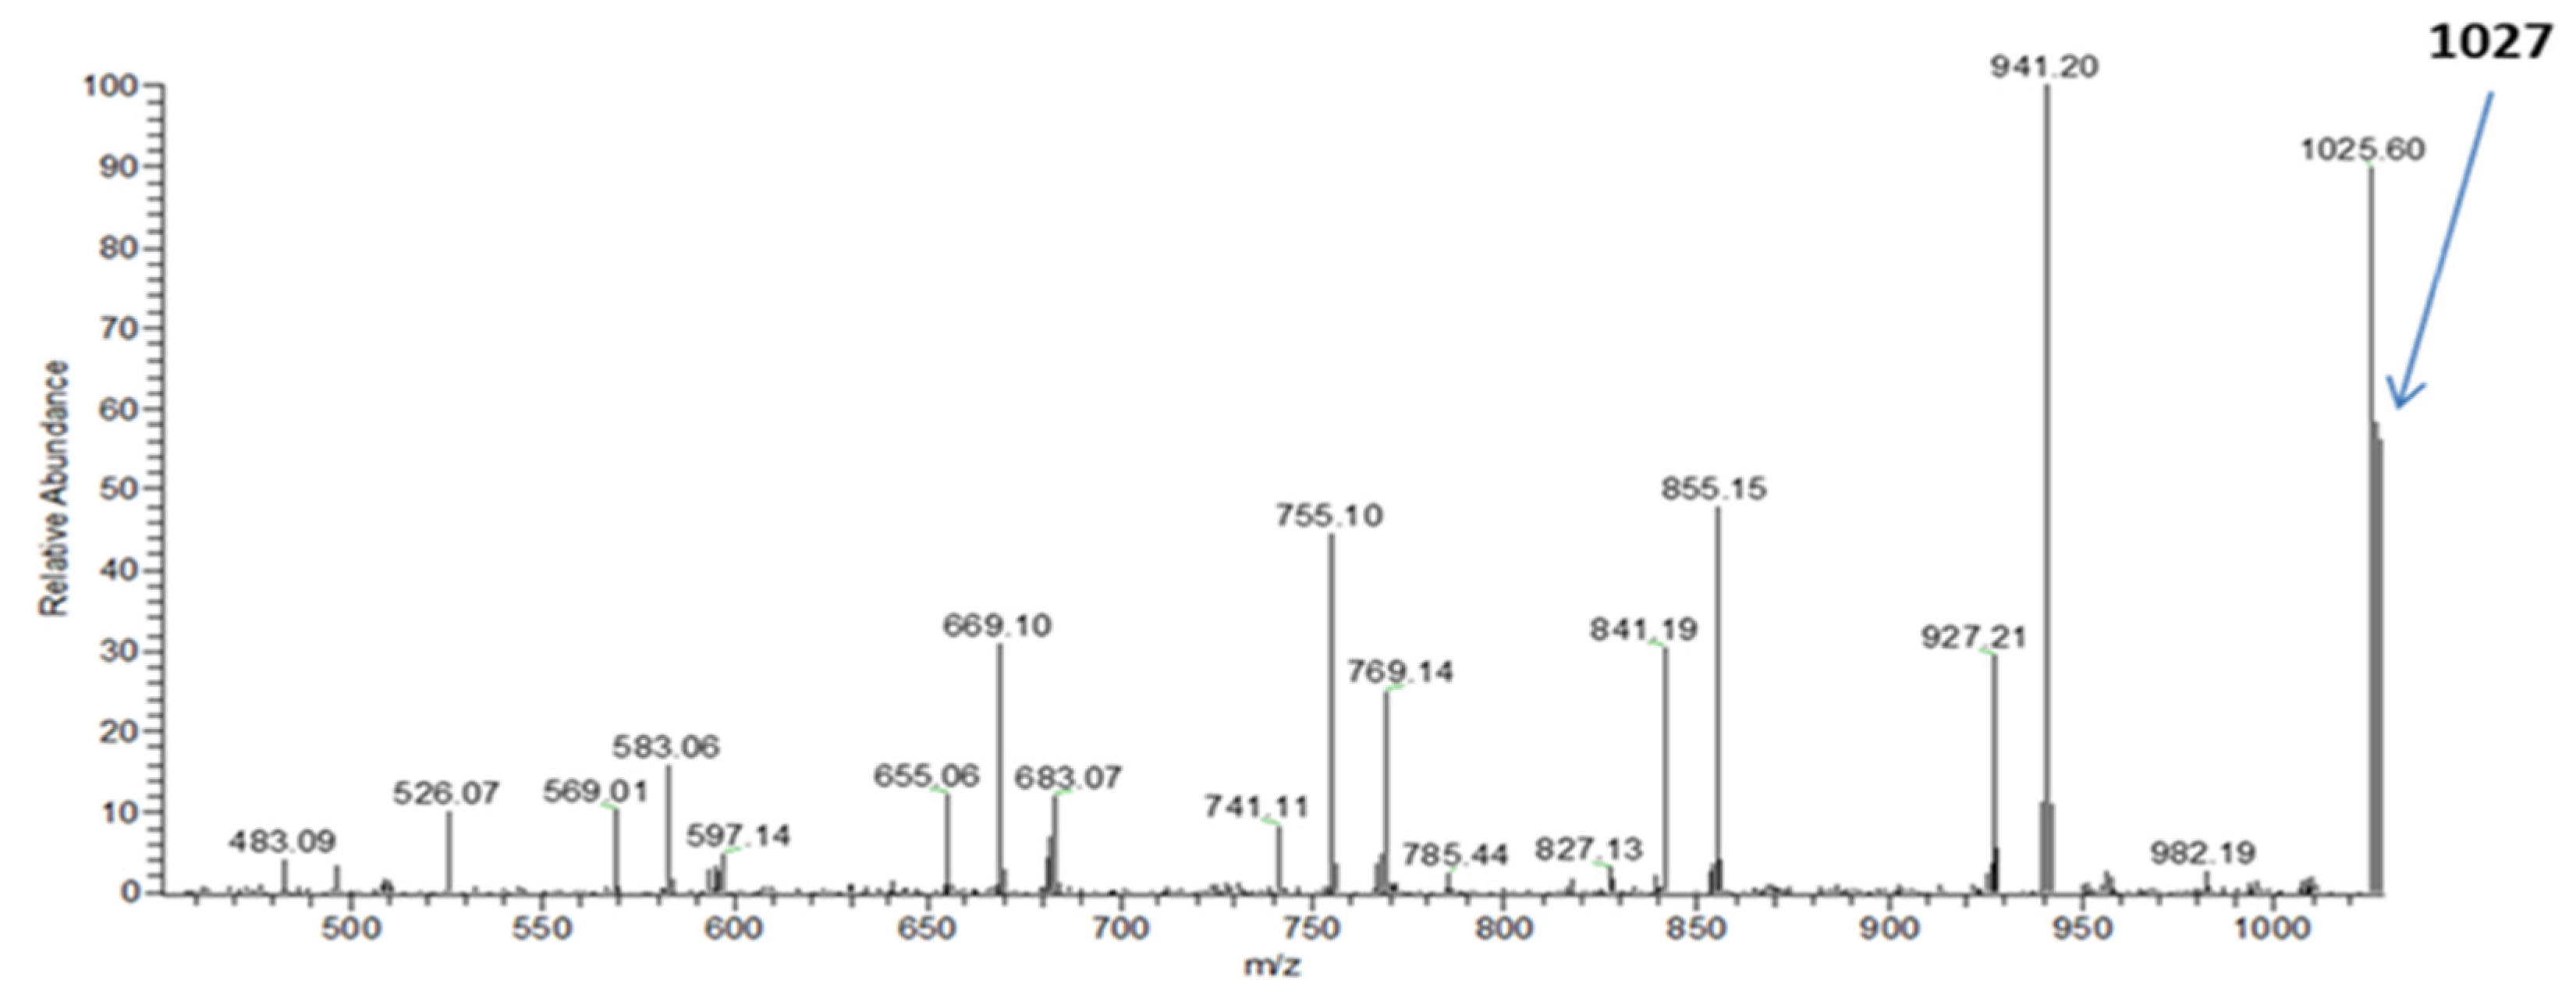
The complexity of the PE-T sample can affect the structural composition of the monomer and, consequently, the properties of the accumulated PHA polymer. To determine the chemical structure of the monomeric units, as well as the composition of co-monomers in the PHA polymer synthesised by
C. necator in this study, electrospray mass spectrometry (ESI-MS) was used. With the aid of this technique, it was confirmed that the PHA copolymer obtained from bacterial cultures with PE-T from Tetra Pak
® comprised 3-hydroxybutyrate, 3-hydroxyvalerate, and 3-hydroxyhexanoate co-monomeric units. Thus, the structure of PHA synthesised in this study with the aid of
C. necator was similar to that of biopolyesters previously prepared by some of our team using other PE-based carbon sources [
23,
34].


 ,
, 


