Article

An Innovative Preparation, Characterization, and Optimization of Nanocellulose Fibers (NCF) Using Ultrasonic Waves

by
Abdullah K. Alanazi
Department of Chemistry, College of Science, Taif University, P.O. Box 11099, Taif 21944, Saudi Arabia
Polymers 2022, 14(10), 1930; https://doi.org/10.3390/polym14101930
Submission received: 28 November 2021 / Revised: 29 December 2021 / Accepted: 31 December 2021 / Published: 10 May 2022

Abstract

:
Recently, environmental and ecological concerns have become a major issue owing to the shortage of resources, high cost, and so forth. In my research, I present an innovative, environmentally friendly, and economical way to prepare nanocellulose from grass wastes with a sodium hypochlorite (NaClO) solution of different concentrations (1–6% mol) at different times 10–80 min, washed with distilled water, and treated with ultrasonic waves. The optimum yield of the isolated cellulose was 95%, 90%, and 87% NaClO at 25 °C for 20 min and with NaOH and H2SO4 at 25 °C with 5% M, respectively. The obtained samples were characterized by dynamic light scattering (DLS), Fourier-transform infrared (FT-IR) spectroscopy, and X-ray diffraction (XRD). The effect of test temperature and reaction times on the crystallinity index (IC) of GNFC with different treated mediums was carried out and investigated. The IC was analyzed using the diffraction pattern and computed according to the Segal empirical method (method A), and the sum of the area under the crystalline adjusted peaks (method B) and their values proved that the effect of temperature is prominent. In both methods, GNFC/H2SO4 had the highest value followed by GNFC/NaOH, GNFC/NaClO and real sample nano fiber cellulose (RSNFC). The infrared spectral features showed no distinct changes of the four cellulose specimens at different conditions. The particle size distribution data proved that low acid concentration hydrolysis was not sufficient to obtain nano-sized cellulose particles. The Zeta potential was higher in accordance with (GNFC/H2SO4 > GNFC/NaOH > GNFC/NaClO), indicating the acid higher effect.

1. Introduction

Nanocellulose presents a significant achievement in science and technology, due to its regular atomic arrangement, stiffness comparable to steel, and successful use as an organic filler material in biopolymer nanocomposites, [1]. Moreover, Blessy et al. [2] stated that cellulose has low cytotoxicity, biocompatibility, good mechanical properties, high chemical stability, and cost effectiveness, which makes it a suitable candidate for biomedical applications. Zou et al. [3] designed and fabricated a mussel-inspired, low-cost, polydopamine-filled cellulose aerogel with both super hydrophilicity and under water super oleophobicity. Zhenghao et al. [4] concluded that cellulose, lignin, and lignocellulose not only protect the environment but also reduce dependence on fossil resources. Kusmono et al. [5] used ramie fibers accompanied by sulfuric acid hydrolysis, with a high crystallinity (90.77%), small diameter (6.67 nm), and length (145.61 nm). Lu et al. [6] applied the ultrasonic wave and microwave-assisted technique (SUMAT) for the preparation of nanocellulose. Syafri et al. [7] used the solution casting method for fabricating nanocellulose from water hyacinth (Eichhornia crassipes).
Chen et al. [8] showed that XRD profiles of Cr(NO) hydrolysis to isolate cellulose nanocrystals CNCCr(NO) had major peaks at around 2θ = 22.50° (200). Sangeetha et al. [9] showed intensive peaks at 2θ = 16.39°, 20.62°, and 22.60°, and Garvey et al. [10] showed XRD peaks at 15.00°, 22.50°, and 34.85°. Ju et al. [11] mentioned that the crystalline and amorphous peaks deconvolution on which the crystalline cellulose is represented by several intense peaks at (1ī0), (110), (102), (200), and (004). Yazdani et al. [12] showed that the amorphous subtraction method used to fit the amorphous component intensity profile. Agarwal et al. [13] and Segal et al. [14] calculated IC by subtracting the amorphous contribution approximately at 2ϴ = 18° as follows:
IC = 100 × [(I22.5° − I18°)/I22.5°].
Khukutapan et al. [15] used autoclaving cabbage outer leaves for the production of nano-fibrillated cellulose with a crystallinity index (CI) of 50.70% and cellulose content of 49.20% dry mass. Hu et al. [16] isolated fibrils from bamboo fiber (BF) with the assistance of negatively charged parts with the yield above 70.00% using the ultrasonic homogenization. Barbash et al. [17] treated bleached softwood sulfate pulp mechanochemically. Barbash et al. [18] prepared nanocellulose from organosolv straw pulp (OSP). Thakur et al. [19] concluded that cellulosic waste features dependents on the method of extraction. Sharma et al. [20] found that the cellulose is the biosynthetic product of plants, animals, and bacteria. Chen et al. [8] reported feasibility and practicability of the hydrolysis using CNCCr(NO) from native cellulosic feedstock that exhibited a higher crystallinity (86.50% ± 00.30%) and high yield (83.60% ± 00.60%). Mazela et al. [21] attempted to evaluate hybrid cellulose treatment, using a combination of a chemical method and ultrasound of medium frequency. Zhang et al. [22] showed that when the bagasse nanocellulose was rod-like and its content in PHB was 1 wt.%, the toughness of PHB (polyhydroxybutyrate) composite was the best. Park et al. [23] illustrated the effect of cellulose crystallinity on its accessibility, lignin/hemicellulose contents and distribution, porosity, and particle size. Chargot et al. [24] obtained nanocellulose from apple pomace. Trache et al. [25] illustrated the recent advances in the nanocellulose preparetion. Thomas et al. [26] used Acacia caesia fiber for the isolation of nanocellulose whiskers. Barbash et al. [27] used Miscanthus giganteus stalks to make organosolvent pulp and nanocellulose that has a crystallinity index of 76.50%. Yahya et al. [28] found that oil palm (Elaeisguineensis) empty fruit bunch (OPEFB) has nanocellulose yield of 81.37%. Duan and Yu [29] concluded that the jute fibers nanocellulose has high yield of 80%. Ma et al. [30] extracted nanocellulose from Xanthoceras sorbifolia husks through a series of chemical treatments, after which the obtained nanocellulose had a rod-like shape and diameter of 38 nm.
The present work aimed at investigating the effect of sonicated NaClO medium on the production of GNFC at different concentrations, test temperatures, and reaction time. The effect of sonication on GNFC/NaClO, GNFC/NaOH, and GNFC/H2SO4 systems in aqueous media on the crystallinity index (IC) was evaluated at different medium concentrations, test periods, and reaction times. SEM, XRD, FT-IR, HPLC, and Zeta potential technique were used. The size distribution of GNFC/NaClO, GNFC/NaOH, and GNFC/H2SO4 as measured by particle size analysis was obtained.

2. Experimental

2.1. Materials and Chemicals

Garden grass cellulose fibers were isolated and mowed in large quantities periodically from the vegetation cover of large areas of stadium floors, parks, and public gardens followed by 90.00% ethanol treatment at 70 °C. To isolate fibers, pigments, dusts, and fats were removed from the purified grass by washing with water. Bleaching with 120 mL of household bleaching agent (5% NaClO and 5% NaOH), carried out followed by drying. The product mixed with acetic anhydride (100 mL), glacial acetic acid (100 mL), and sulfuric acid (10 mL) and cooled to 7 °C 35 g used.

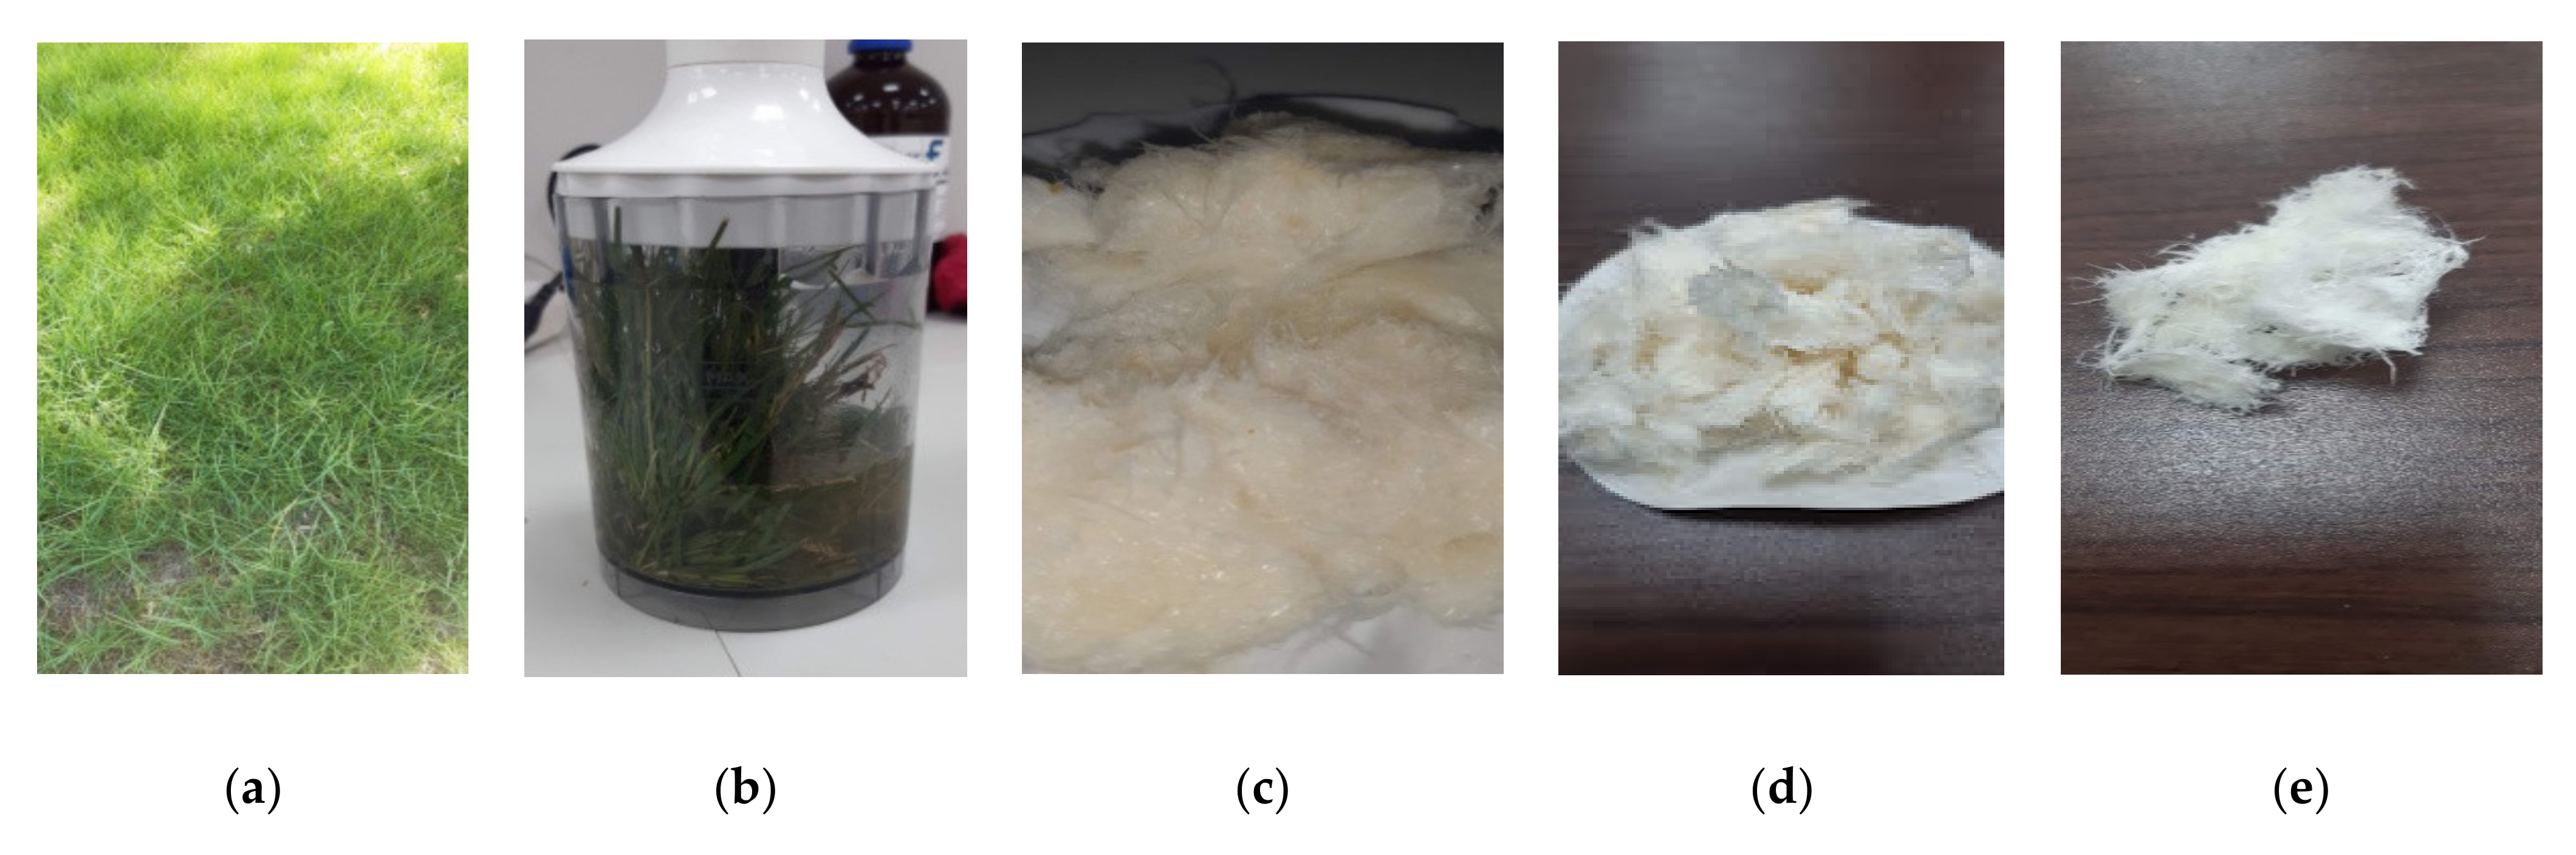
2.2. Preparation of KGNFC (Alkali Grass Nanofiber Cellulose)

The grass rinsed with NaOH solution, water, and finally with H2O2 (hydrogen peroxide) 3 times consecutively. As H2O2 dissolved hemicellulose, the color turned from green to white leaving only the cellulose in the mixture and it had 97.00% purity after drying. Sulphuric acid (98.00% concentration) was added to cellulose colloid (5 g cellulose powder + 250 mL water) under constant stirring condition for 3 h.
The suspension produced heated at 50 °C for 2 h and diluted 10 times with distilled water ice-cooled to prevent the acid hydrolysis reaction. The resulting white colloidal suspension centrifuged at 8000 rpm for 20 min followed by dialysis to remove excess acid and ultra-sonication for 45 min in ice cooled condition and lyophilized [31].

2.3. Preparation CGNFC (Acidic Grass Nanofiber Cellulose)

The fibers purified fibers hydrolyzed using 5% sulfuric acid at different conditions using two parameters (temperature and hydrolysis time) with H2SO4 of a constant concentration of 5 wt.% under different temperatures of 25 °C, 40 °C, 60 °C, and 80 °C and 10, 20, 40, 60, and 80 min to get the optimum temperature and time with high yield %. Centrifugation was conducted at 4500 rpm for 20 min to abolish the acid solution. Cellulose nanofiber (CNF) precipitates were collected and rinsed with distilled water to neutral condition. Then the ultra-sonication of CNFs suspension performed for 20 min and 50% amplitude to obtain the uniform cellulose nanofiber (CNF) suspensions [14,32,33].

2.4. Innovative Preparation of Grass Nanofiber Cellulose (IGNFC)

The collected grass was washed with rinsed water and ground mechanically with sodium hypochlorite of different concentrations, 1, 1.5, 2.5, and 5.0 mol, for 10, 20, 40, 60, and 80 min at 25 °C, 40 °C, 60 °C, and 80 °C. After that, the product was repeatedly washed with rinsed water and treated with ultrasonic waves, and the size of the particles was determined, (Figure 1). All methods of GNFC preparation methods are compared by studying particle size and yield using LDS, SEM, XRY, HPLC, and EDX methods and Zeta potential analysis.

2.4.1. Characterizations

Fourier Transform Infrared (FT-IR) Spectroscopy

Perkin-Elmer RX X2 Infrared spectrometer spectra used for RSNFC, GNFC/NaOH, GNFC/NaClO, and GNFC/H2SO4 using 4500‒500 cm−1 wave range, 1 cm−1 intervals and 4 cm−1 scanning resolution.

X-ray Diffraction (XRD)

Four samples were prepared from untreated grass fiber, and three synthesized nanocellulose: NAFC (nano acid cellulose), NKFC (nano alkaline cellulose), and NSFC (nano sodium hypochlorite cellulose). Three pellets were prepared, and measured in reflection mode, in the range 2θ = 5°–80° with Philips powder diffractometer with Cu Kα radiation (k = 0.154 nm), using Ni-filtered Cu Kα radiation (λ = 1.5406 Å) at 40 kV and 30 mA [34]. XRD studies were performed to evaluate the effect of each treating medium on the crystallinity behaviors of native cellulose and yielded nanocellulose specimens. The (IC) calculated using two methods, the first (A method) according to the Segal empirical method [14] as in Equation (1):
CrI% = [(I200 − Iam)/I200] × 100
where, I200 is the crystallites peak intensity at 2θ = 22.5° and Iam is the amorphous cellulose intensity at 2θ = 18°–19°.
The second approach (B method) is a deconvolution according to [8,35] as in Equation (2):
IC% = [Acryst/(Acryst + Aamorph)] × 100
where Acryst is the calculated area under X-ray and Aamorph is the total area under the X-ray pattern. The crystallite size (t) calculated according to Scherrer equation, [14]:
t = [Kλ/(β1/2 cos ϴ)]
where K = 0.89 is Scherrer constant, λ = 1.54060 Å is the radiation wavelength, β1/2 equal the full width at the half maximum (FWHM) of (200) diffraction peak in radians, and θ is the corresponding Bragg’s angle.

SEM Analysis

The cellulose microstructure morphology examined using a JEOL JSM-7001F TTLS (JEOL Ltd., Tokio, Japan) SEM with 5 kV accelerating voltage of 5 kV, 10 mm working distance of about 10 mm.

Determination of GNFC Yield

The oscillating ultrasonic frequency used was 40 kHz with an output of ultrasonic power of 40 KW. The nanocellulose yield was calculated according to the relation (4) [16,17,18,19];
Y = {[(m1 − m2) × V1]/mV2} × 100%
where Y is the yield of GNFCs, m1 and V1 are the GNFC mass and volume and weight bottle, m2 and V2 are the mass and volume bottle weight. m is the mass of grass fibers.

High-Performance Liquid Chromatography (HPLC)

HPLC was carried out using (HPLC, Shimadzu Corp., Kyoto, Japan). With a rotary shaker agitation of 25 mL of GNFC solution added in a flask with 50 mg GNFCs, the suspension produced filtered using a membrane filter (Millipore 0.45 lm pore size). The filtrates were analyzed for residual GNFC. HCl used to adjust the solution’s pH. The absorbed NC (nanocellulose) centrifuged with an initial dose of 2.0 g/L, water washed, and dried for 24 h at 35 °C. The NCs product conducted with various eluents such as 5% H2SO4, 5%NaOHand 5% NaClO by repeating the above procedure for two times to be used with HPLC [36,37].

Zeta Potential Measurement

Zeta potential used a Zetasizer Nano series for determining the electrophoretic mobility according to Henry equation [38].

3. Results and Discussion

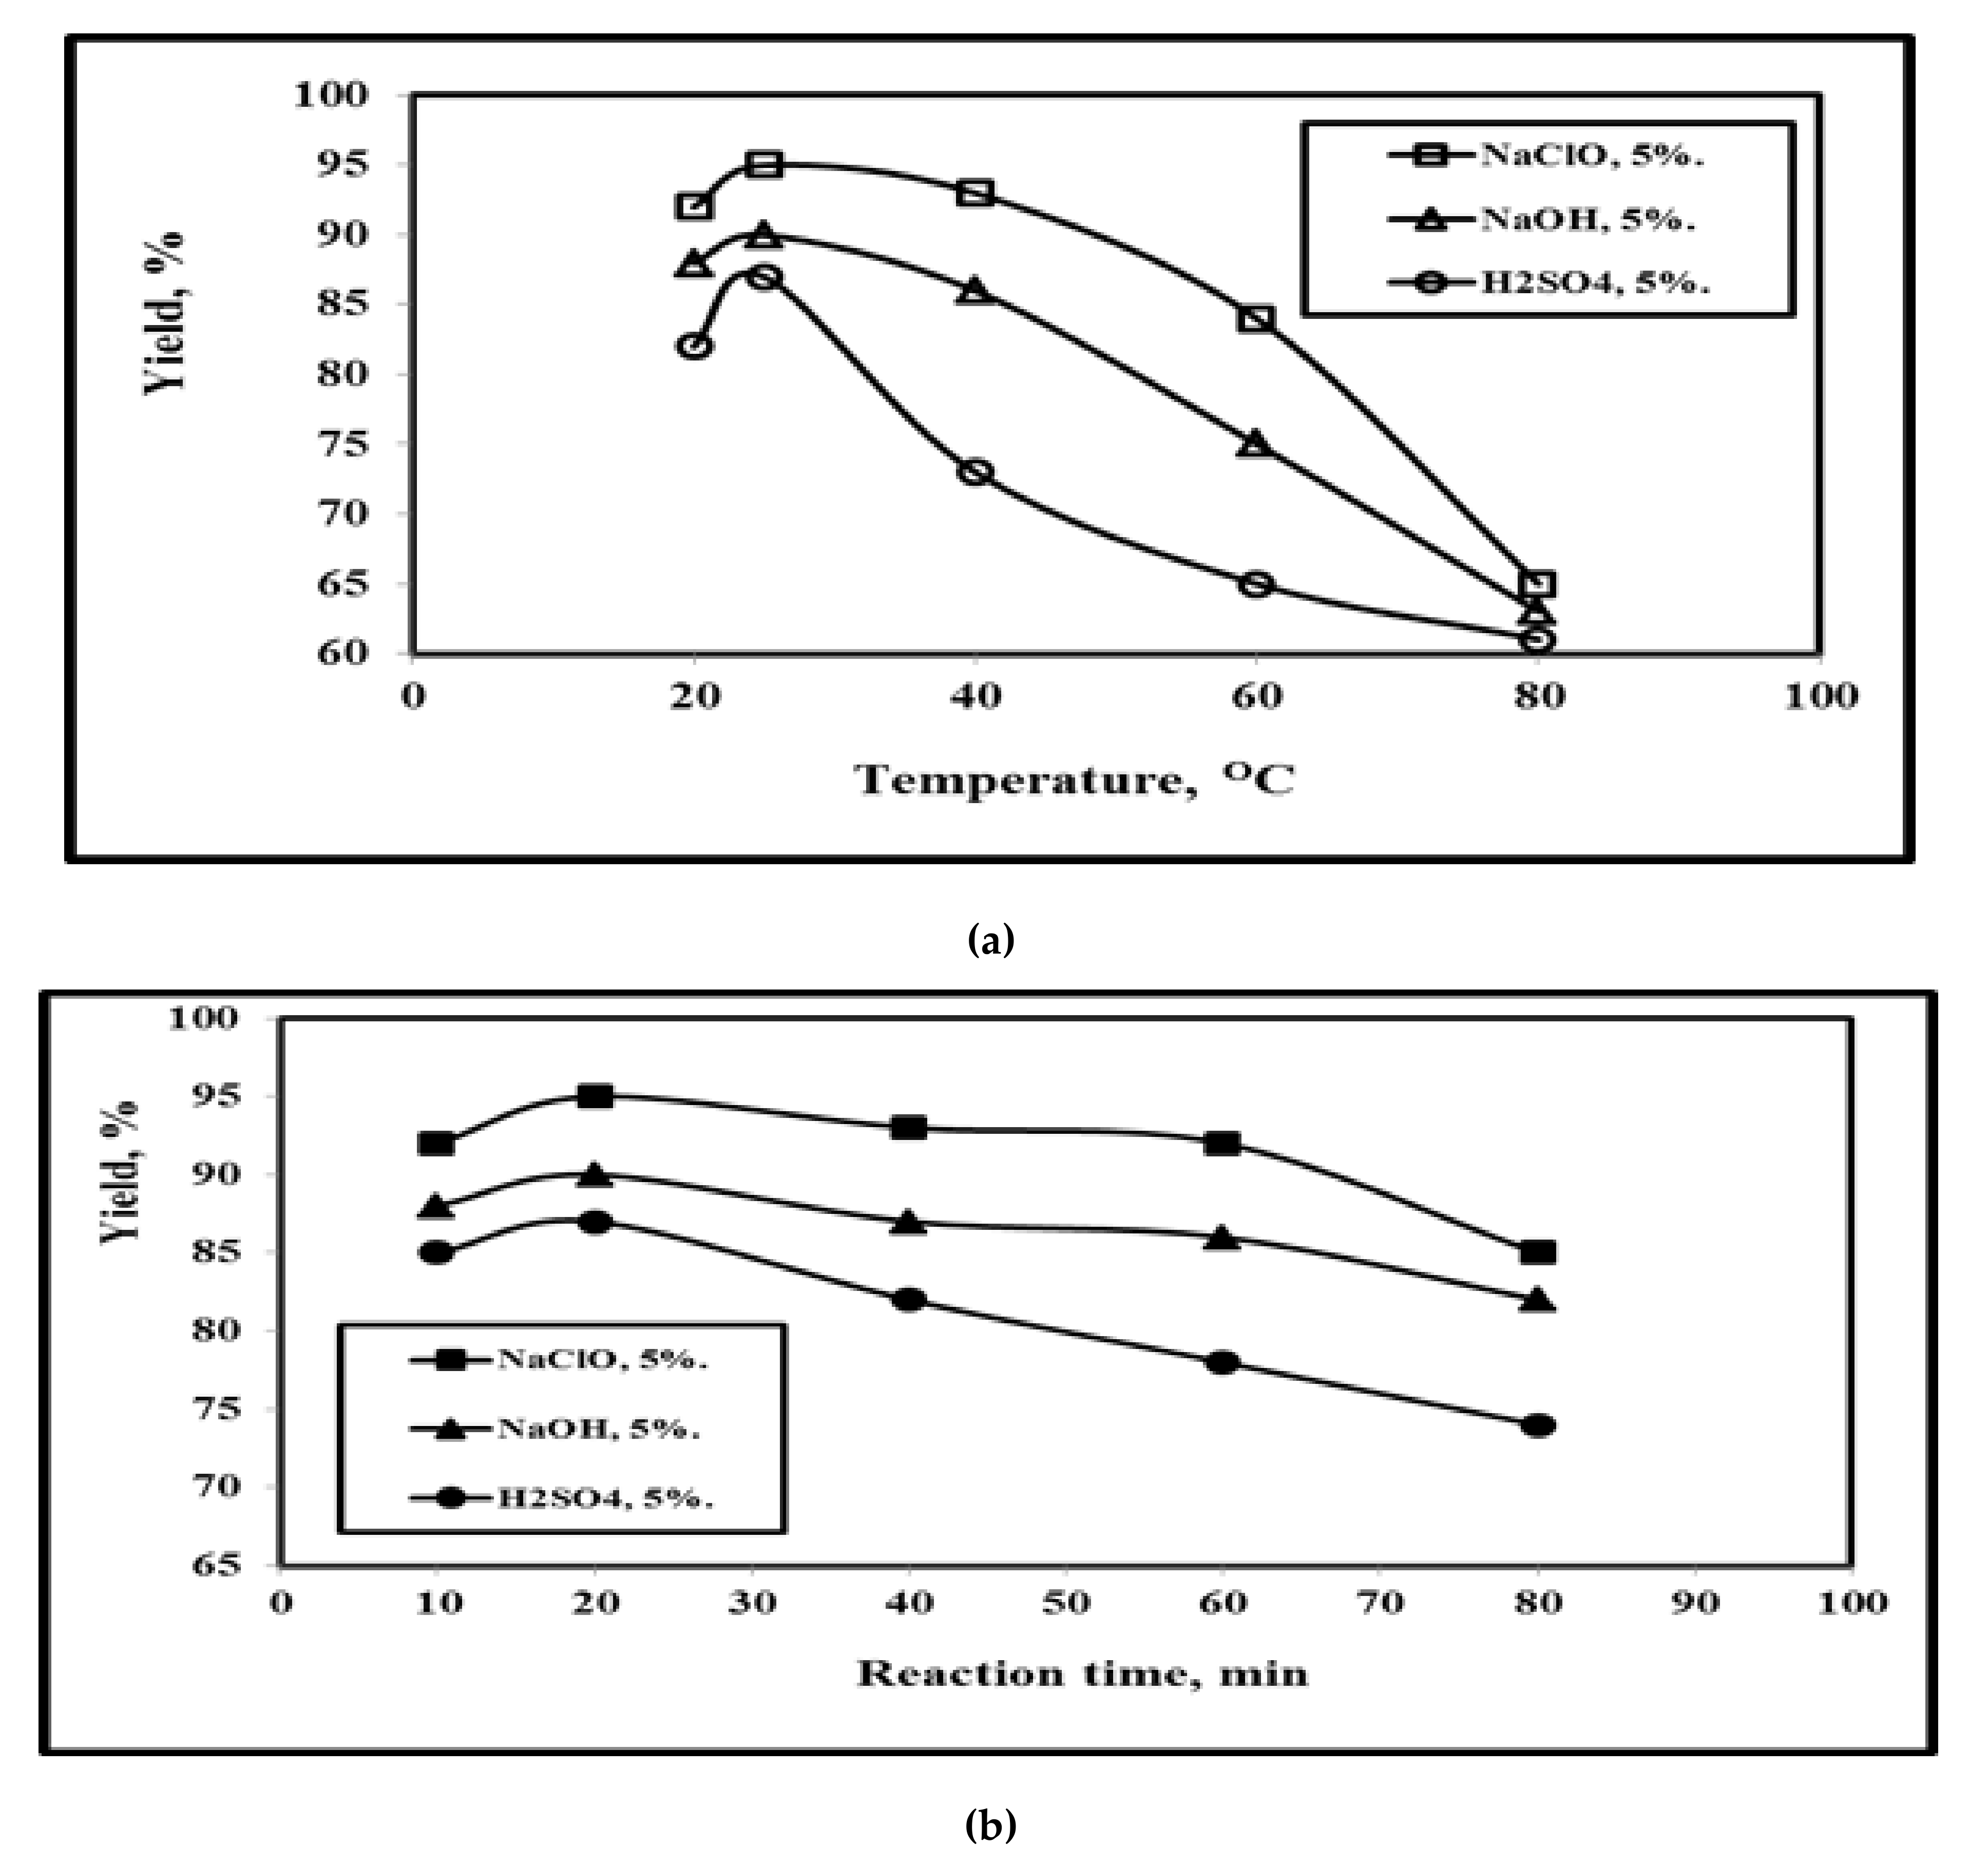
3.1. Temperature Effect on the GNFC Yield

The effect of reaction temperature of 20 °C, 40 °C, 60 °C, and 80 °C on GNFC yield shown in Figure 2. The optimum NaClO/GNFC yield value was 95% at 5% M, 20 min, and 25 °C. Figure 2a–d, indicated that the GNFC yield increased first followed by continuous decrement until reaching a minimum value about 38% at 80 °C, 80 min, with 6 M of NaClO due to the effect of both the higher temperature and hydrolysis medium on removing the amorphous components and accelerating the glycosidic bonds.
Furthermore, this is related to the fact that both the higher temperature, and treated hydrolysis medium hydrolysis removed amorphous components and some parts of crystalline that accelerating the hydrolytic cleavage of the glycosidic bonds and finally resulted in the yield and crystallinity decrement [5,16,38,39].

3.2. Time Effecton the GNFC Yield

Figure 2a–d showed that the GNFC yield decreased from 95% at 20 min, 25 °C of 5 M NaClO, to 38% at 80 min, 80 °C, and 6 M NaClO. Up to 20 min, the GNFC yield value increased directly due to the specific surface increment and more cellulose depolymerization followed by yield value decrement owing to the ultrasonic wave effect. Above 20 min, the yield decreased owing to the crystalline cellulose hydrolysis, [16]. So, 20 min us considered as optimum time.

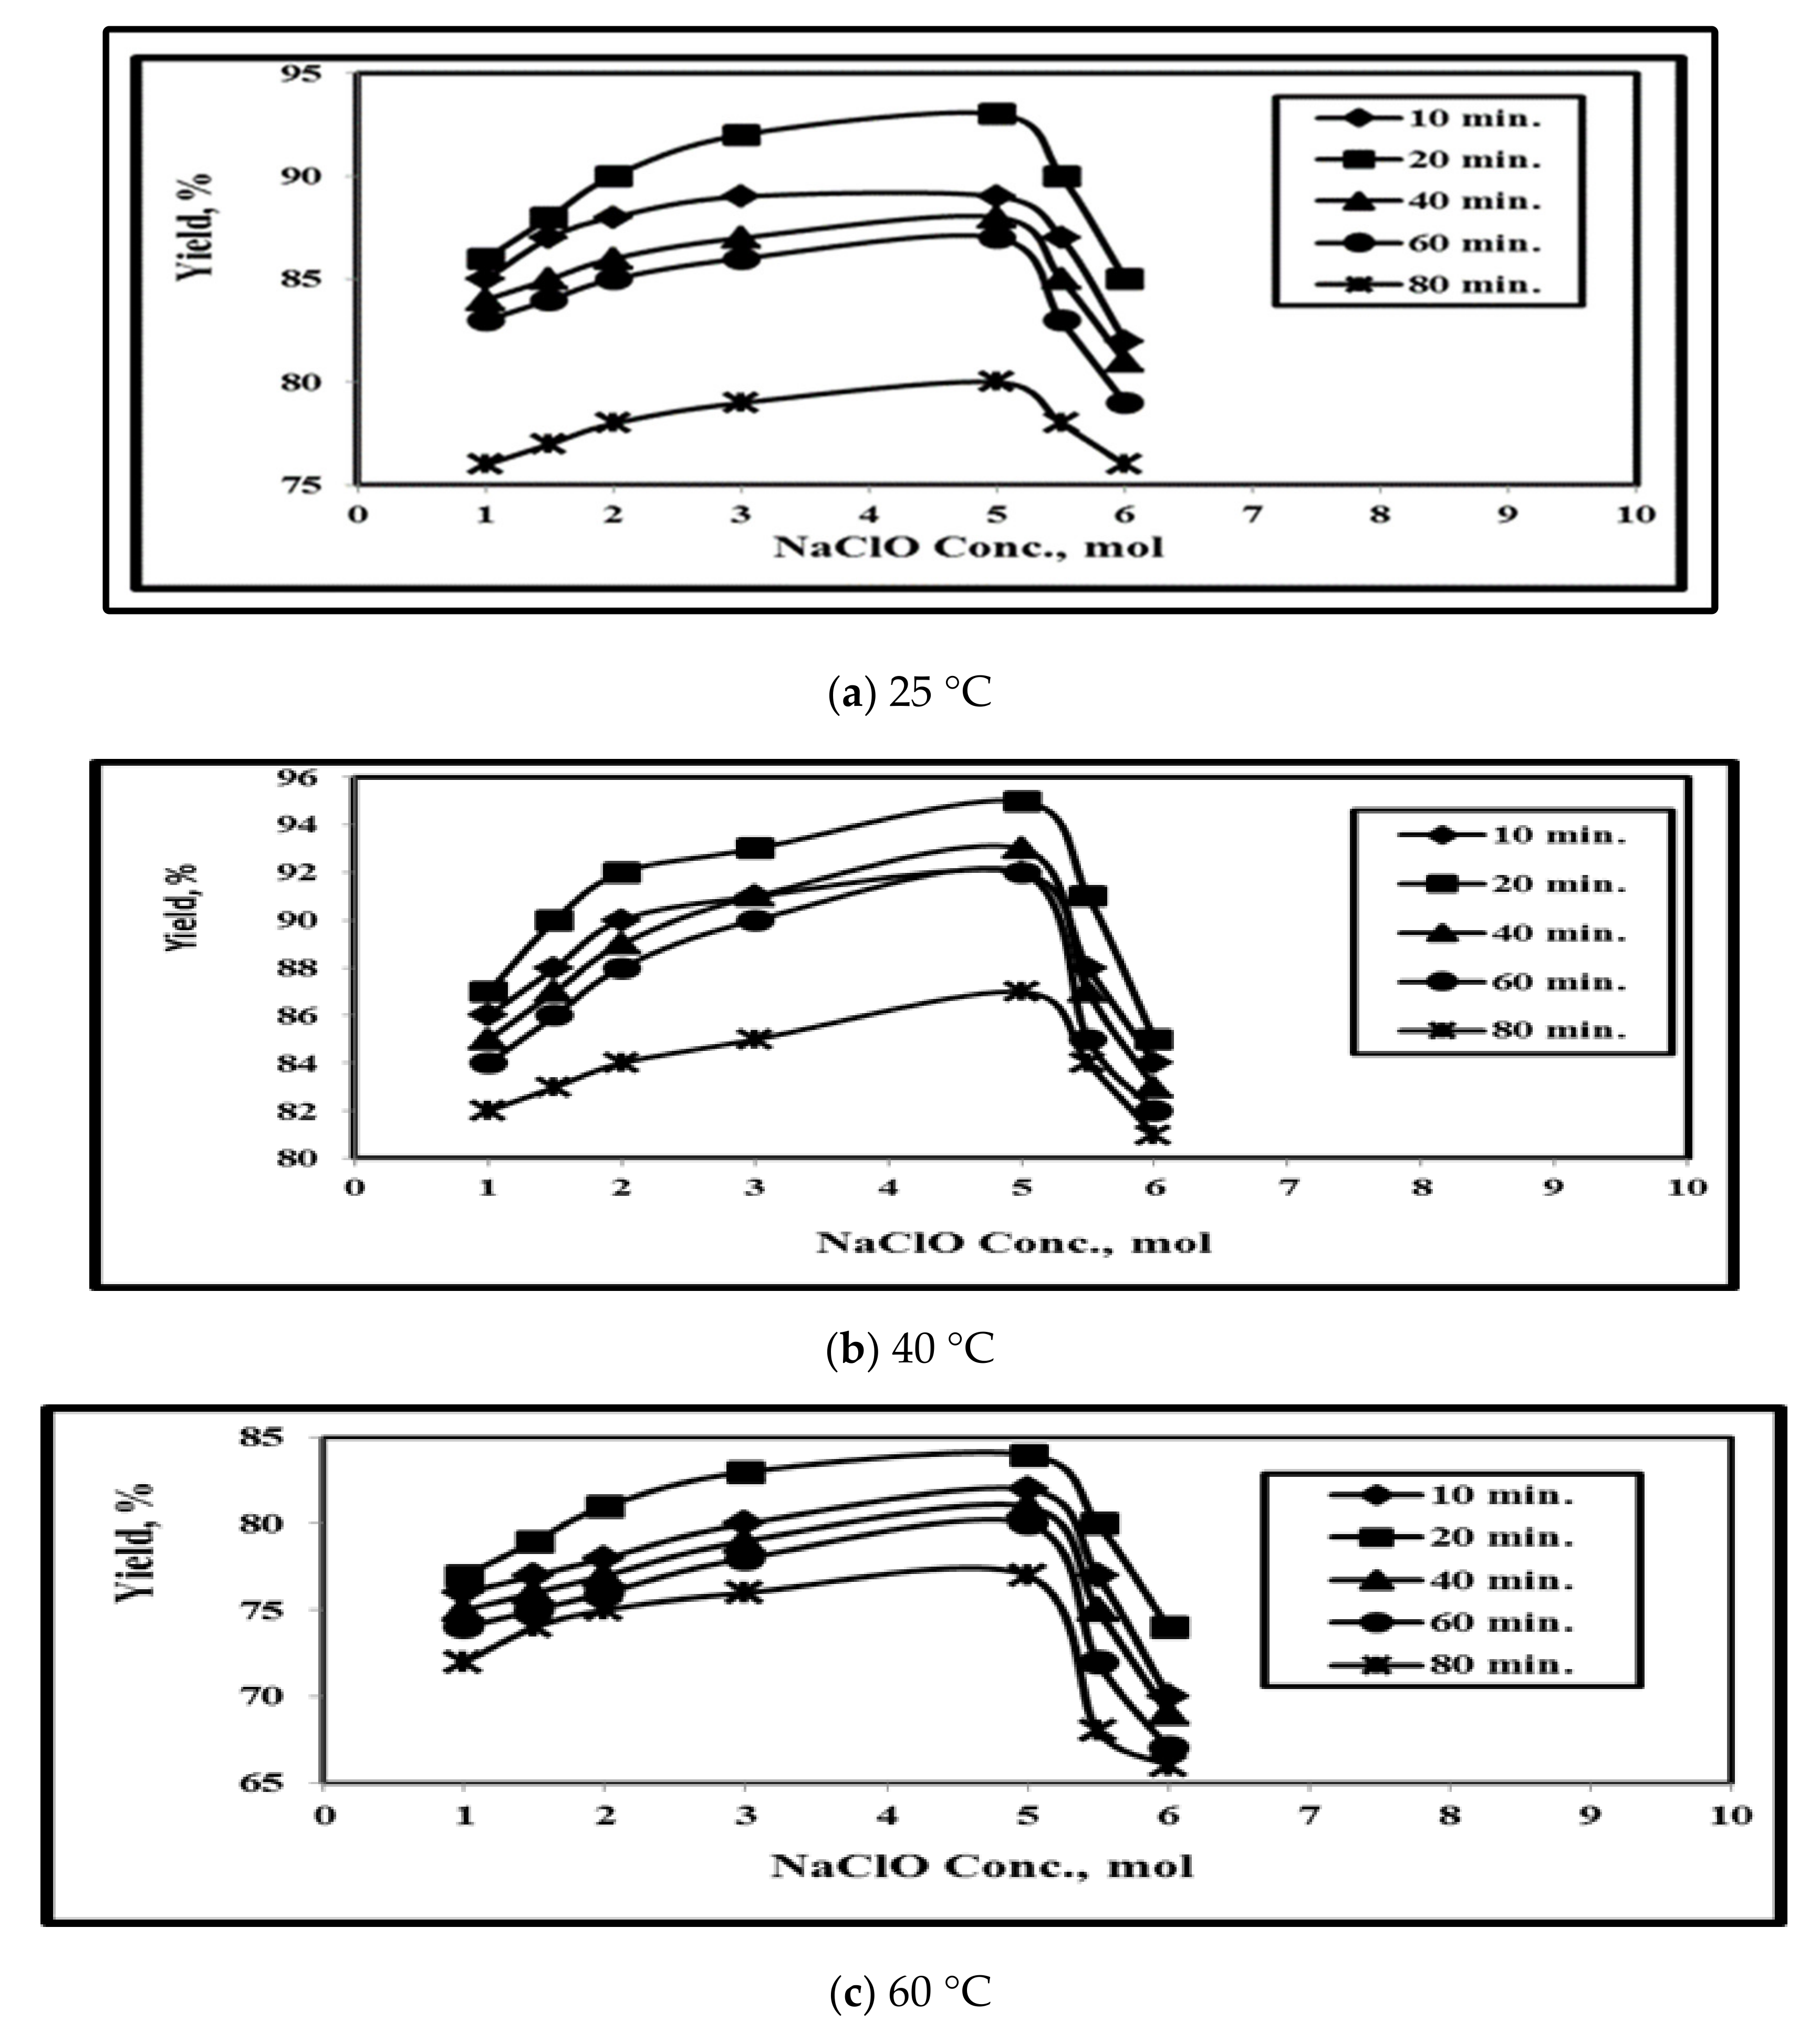
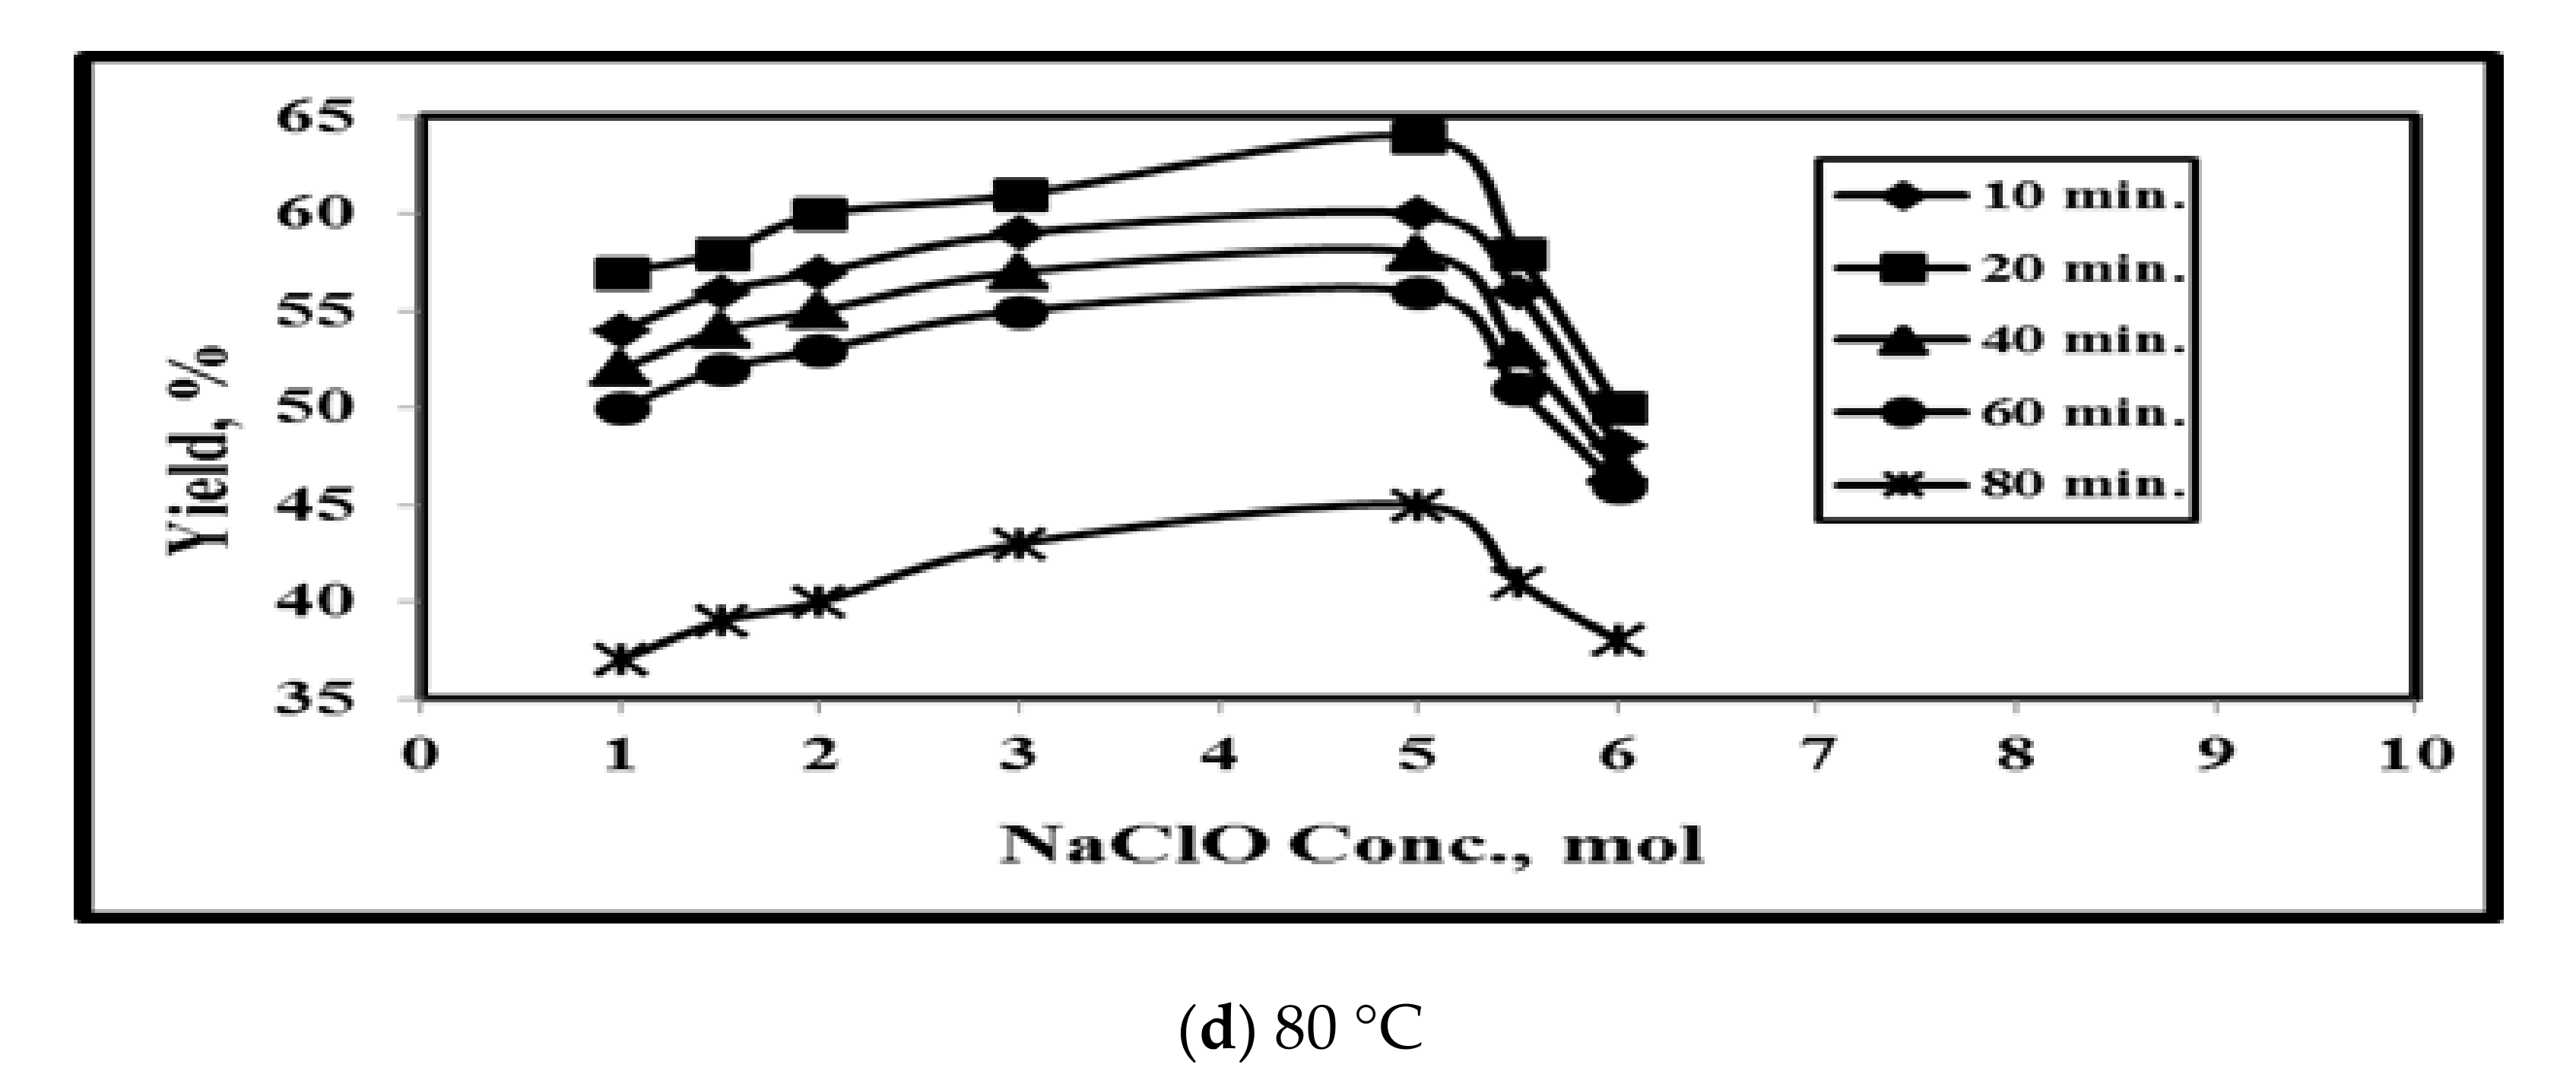
3.3. Effect of NaClO Concentration

Figure 2a–d revealed that when NaClO concentration increased from 1.0 to 6.0 M, the nanocellulose progressively increased from 87% to 95% at 25 °C and 20 min due to the Effect of catalytic hydrolysis process that causes crystallinity increment. Cellulose levels decreased with the increase of NaClO concentration over 5.0 M at longer time exposure at high temperatures since NaClO solution increment will fractured both the hemicellulose and cellulose connection ties. In an alkaline solution (NaClO), the temperature increment causes the lignocellulosic components destruction and the bonds termination in agreement with Winarsih [40].

3.4. Effect of Reaction Medium on GNFC Yield

Figure 3 illustrates the dependence of reaction medium on both reaction temperatures and reaction time. Three reaction mediums were used: NaClO, NaOH, and H2SO4. Figure 3a indicates that the optimum yield temperature was 25 °C with 95%, 90%, and 87% for 5% concentration of NaClO, NaOH, and H2SO4 respectively. The yield values of the three mediums increased up to 25 °C followed by a yield decrement with temperature increment, since high temperatures reduced the reaction activity of cellulose with excessively hydrolyzed into glucose monomers, which reduced the yield of GNFC, in agreement with [16]. Also, with temperature increment; the power applied reduced the reaction activity of cellulose, so the mass transfer of the intra-finer pores of GNC is also reduced that result in the decrement of GNFC Yield with temperature increment in agreement with Lu et al. [6].
Figure 3b shows that the yield rises up to an optimum value of 20 min reaction Time for 5% concentration of each of the three mediums. When the reaction time increases more than 20 min, the mass transfer resistance gradually decreases and the specific surface of the grass wastes increases with reaction time increament owing to the breakdown of their net structure and even the enlargement of the interand intra-fiber pores, which results from the hydrolysis of more and more cellulose that leading to the decrement of GNFC Yield with reaction time increment, [6]. The yield decreased with time increment than 20 min, therefore, the optimum yield value for obtaining cellulose from NaClO/GNFC was 95% which is higher compared to the cellulose yield of NaOH/GNFC of the previous publications which was 89% of pineapple [41], 83.40% of blenched fiber [42], 67.40% for non-woody biomass constitutes [34], 85.40% for non-woody biomass constitutes, 54.30% for organo-solvent miscanthus pulp (OMP) [31], and 81.00% and 54.00% from flax fibers and cotton linters [29]. Moreover, the yield of NaClO/H2SO4 cellulose was 90.00% the yield of the previous investigators which was 82% for non-woody biomass constitutes [43], ranging between 55 and 60% for bleached kraft pulp of loblolly pinewood [44], 85.75% for filter paper [6], 83.60% for native cellulosic feedstock [45] (Apendix A), 84.00% for oil palm (Elaeisguineensis) empty fruit bunch [46], from flax fibers (81.00%) and 54% from flax fibers (81.00%) and cotton linters [14]. In addition, Figure 3a,b show that the temperature increment had a higher effect on the yield decrement compared to the reaction time [9].

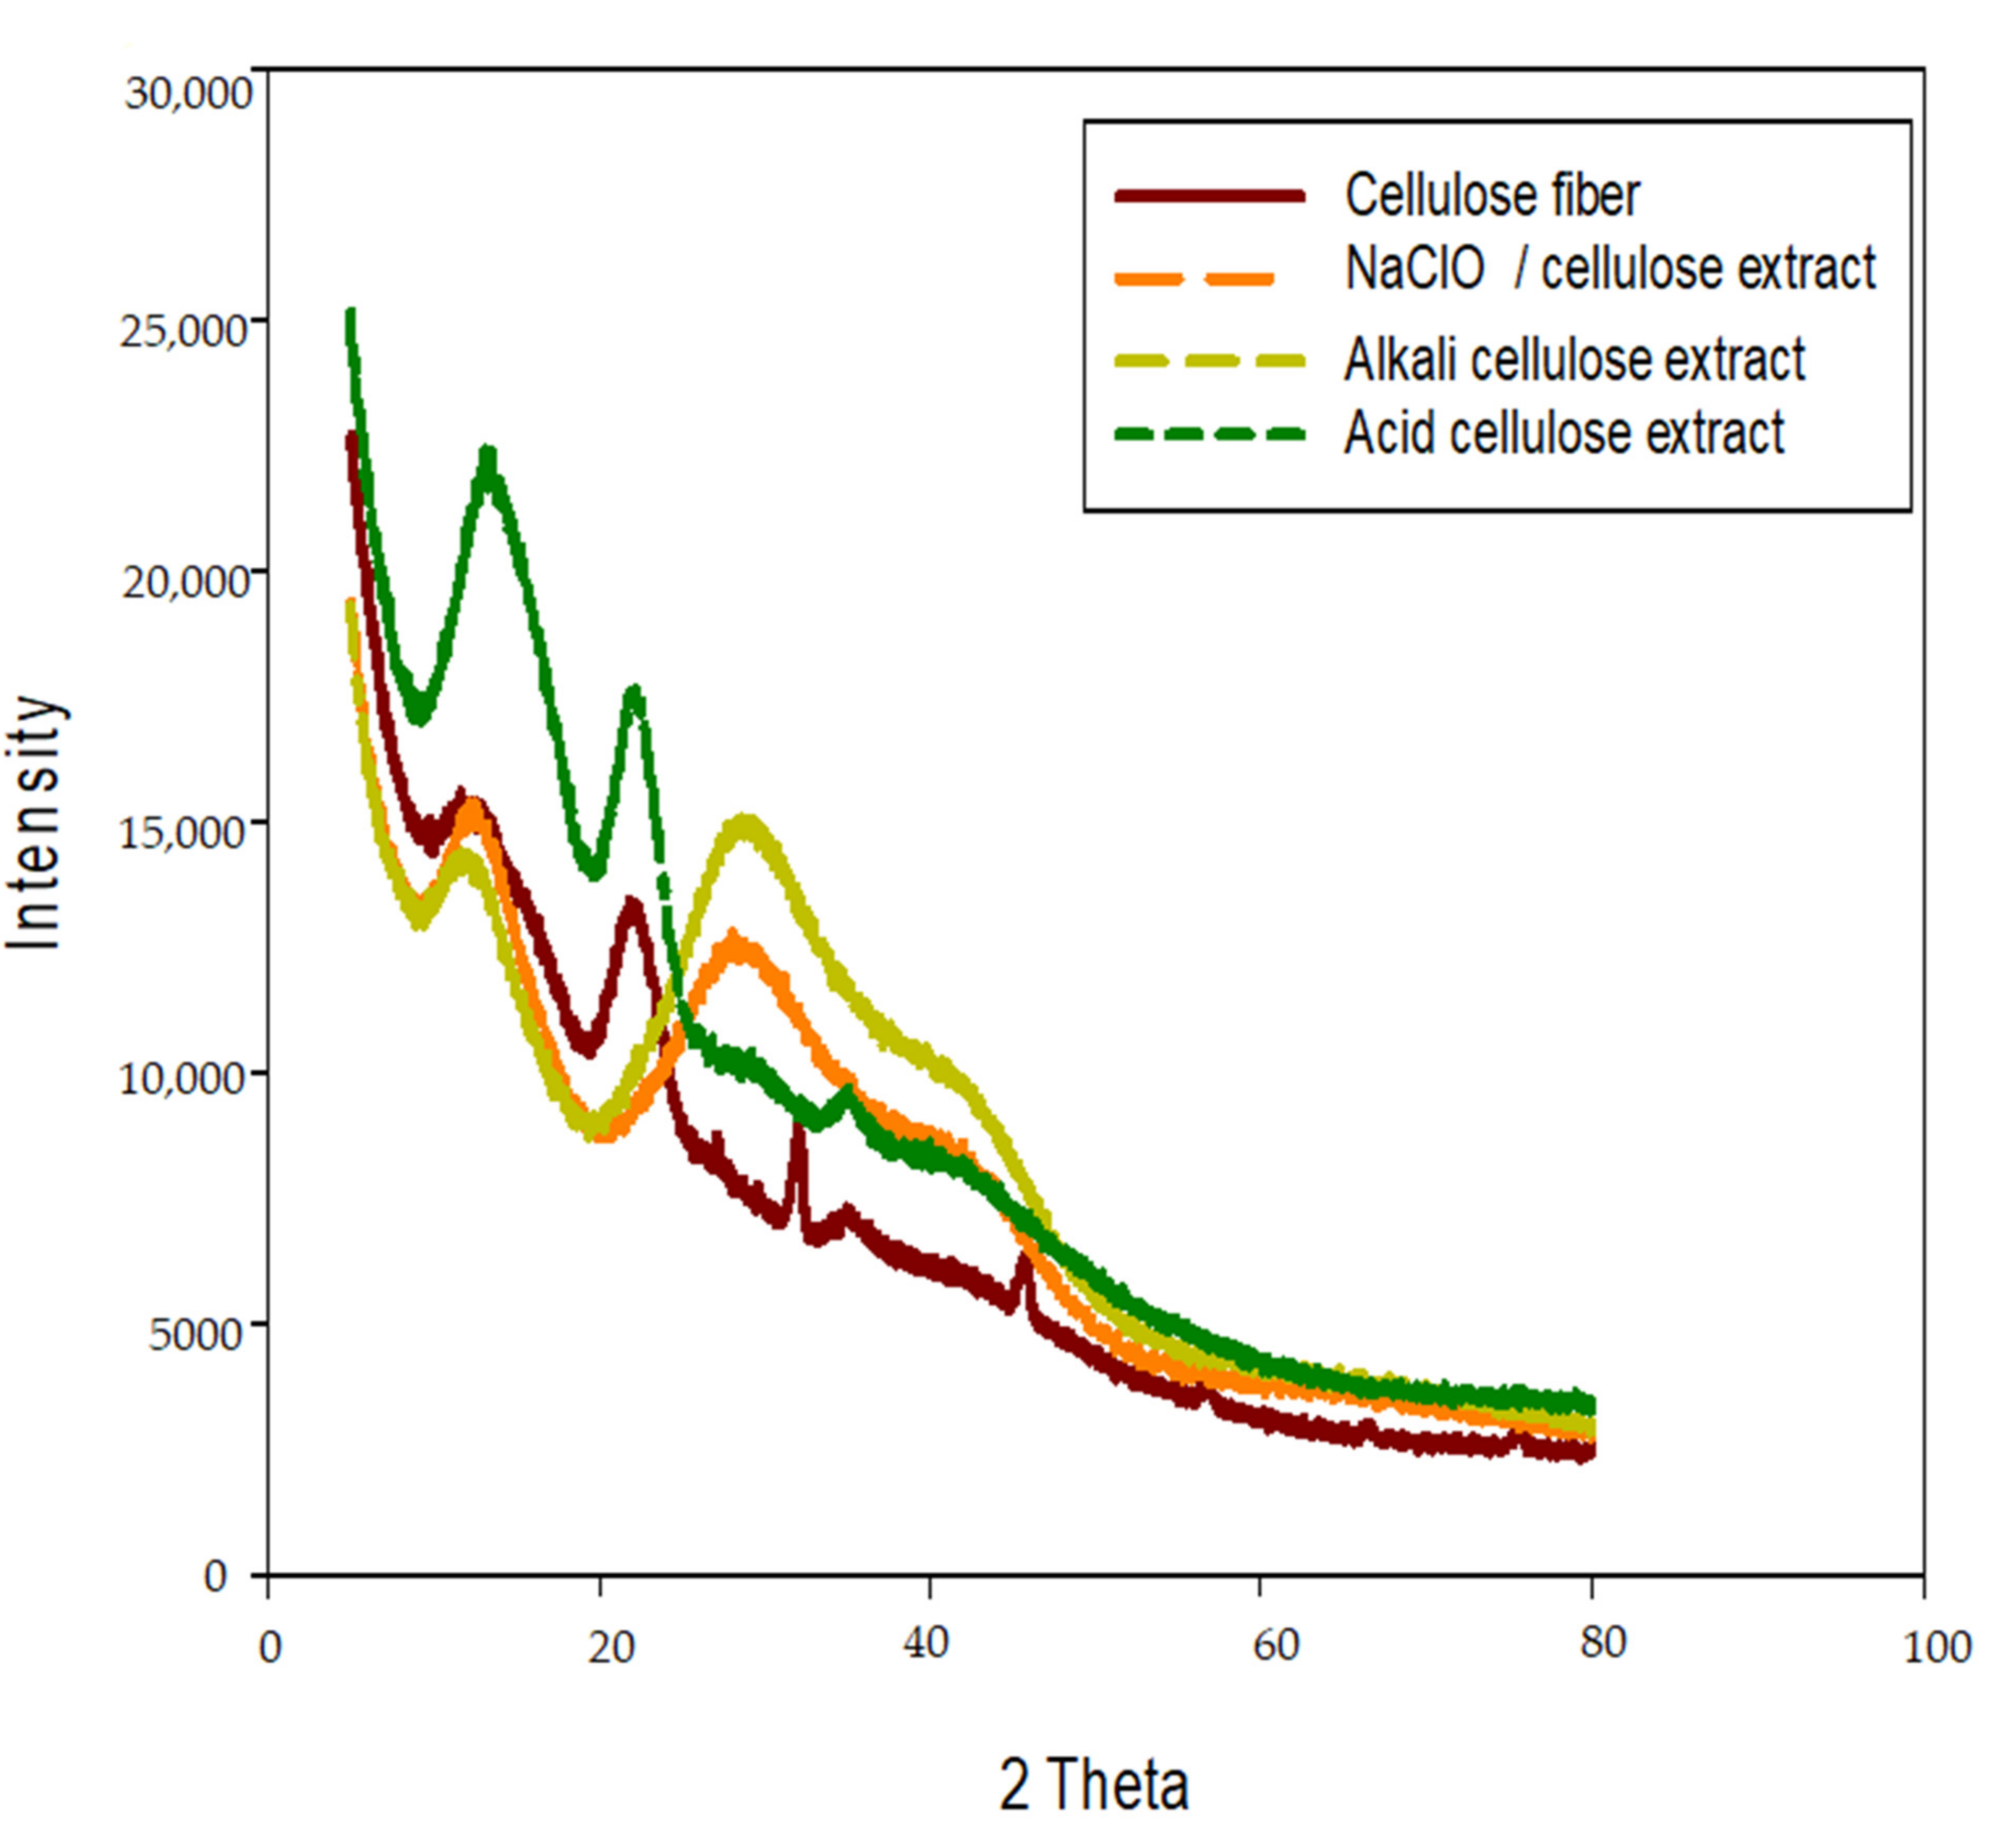
3.5. X-ray (XRD) Diffraction Patterns Analysis

The XRD diffractogram profiles for all the test specimens are shown in Figure 4. It was clearly observed that the XRD patterns of the four specimens were similar and these slight shifts in angles and peaks proved the occurrence of cellulose in agreement with Chen et al. [8] and Maia et al. [47].

3.6. Effect of Additives on the Crystallinity Index (IC) of GNFC

The crystallinity index was analyzed using the diffraction pattern and computed according to the Segal empirical method (method A) [48] and the sum of the area under the crystalline adjusted peaks method (method B) [35]; their results are presented in Table 1 and Table 2. The effect of temperature on the crystallinity index of Real Sample (RSNFC) was found to range from 23.205% to 40.705% and 19.724% to 34.559% for method A and B, respectively, while the effect of reaction time on the crystallinity index of Real Sample (RSNFC) was found to range from 21.401% to 39.701 and 17.763 to 32.952 for methods A and B, respectively. This proves that the temperature effect is higher compared to the reaction time and that the IC values based on method A are over that obtained by method B, in agreement with the previous investigators [11,12,38]. Furthermore, Table 1 and Table 2 indicate the crystallinity increment due to the dissolving of hemicellulose and lignin that causes the chemical purification increment [1,49,50]. Khukutapan et al. [15] and Cherian et al. [50] concluded that the alkali hydrolysis and bleaching causes the separation of the structural linkages between lignin and carbohydrates that leads to significant lignin and the GNFC crystallinity index increment to around 70.29%. However, Hu et al. [16] showed that the crystallinity was not significantly affected by post chemical modification of bamboo fiber at a low degree of substitution carboxymethylation (CM) stage. Barbash et al. [18] concluded that the hydrolysed and sonicated methods of cellulose increased the package ordering of the macromolecules due to the decreament of amorphous cellulose parts ratio which results in the increment of the IC of the initial cellulose from 75.00%, 78.30%, and 79.80%, respectively. Both Barbash et al. [19] and Sánchez et al. [51] used the organosolv straw pulp (OSP) but Barbash et al. [19] had higher IC which was 72.50%. Chen et al. [8] and Chen et al. [52] found that IC for native cellulose, GNFC/H2SO4, and CNC Cr(NO) were 65.70%, 81.40%, and 86.50%, respectively. Zhang et al. [22] found that acid treatment causes the hydrogen ions enter into the amorphous area of cellulose and destroy the amorphous area which result in the cellulose IC increment in agreement with Bodin et al. [53]. The IC of the cellulose isolated from oil palm (Elaeis guineensis) empty fruit bunch (OPEFB)was 73.20% [28], while their values for pineapple leaves [54], indus-trial kelp (Laminaria japonica) [55], soy hulls [56], sisal, curaua, bamboo, and eucalyptus [57] and sugar palm (Arenga Pinnata) [58] were 54.00%, 69.40%, 73.50%, 78.00%, 87.00%, 87.00%, 89.00% and 85.90% respectively.

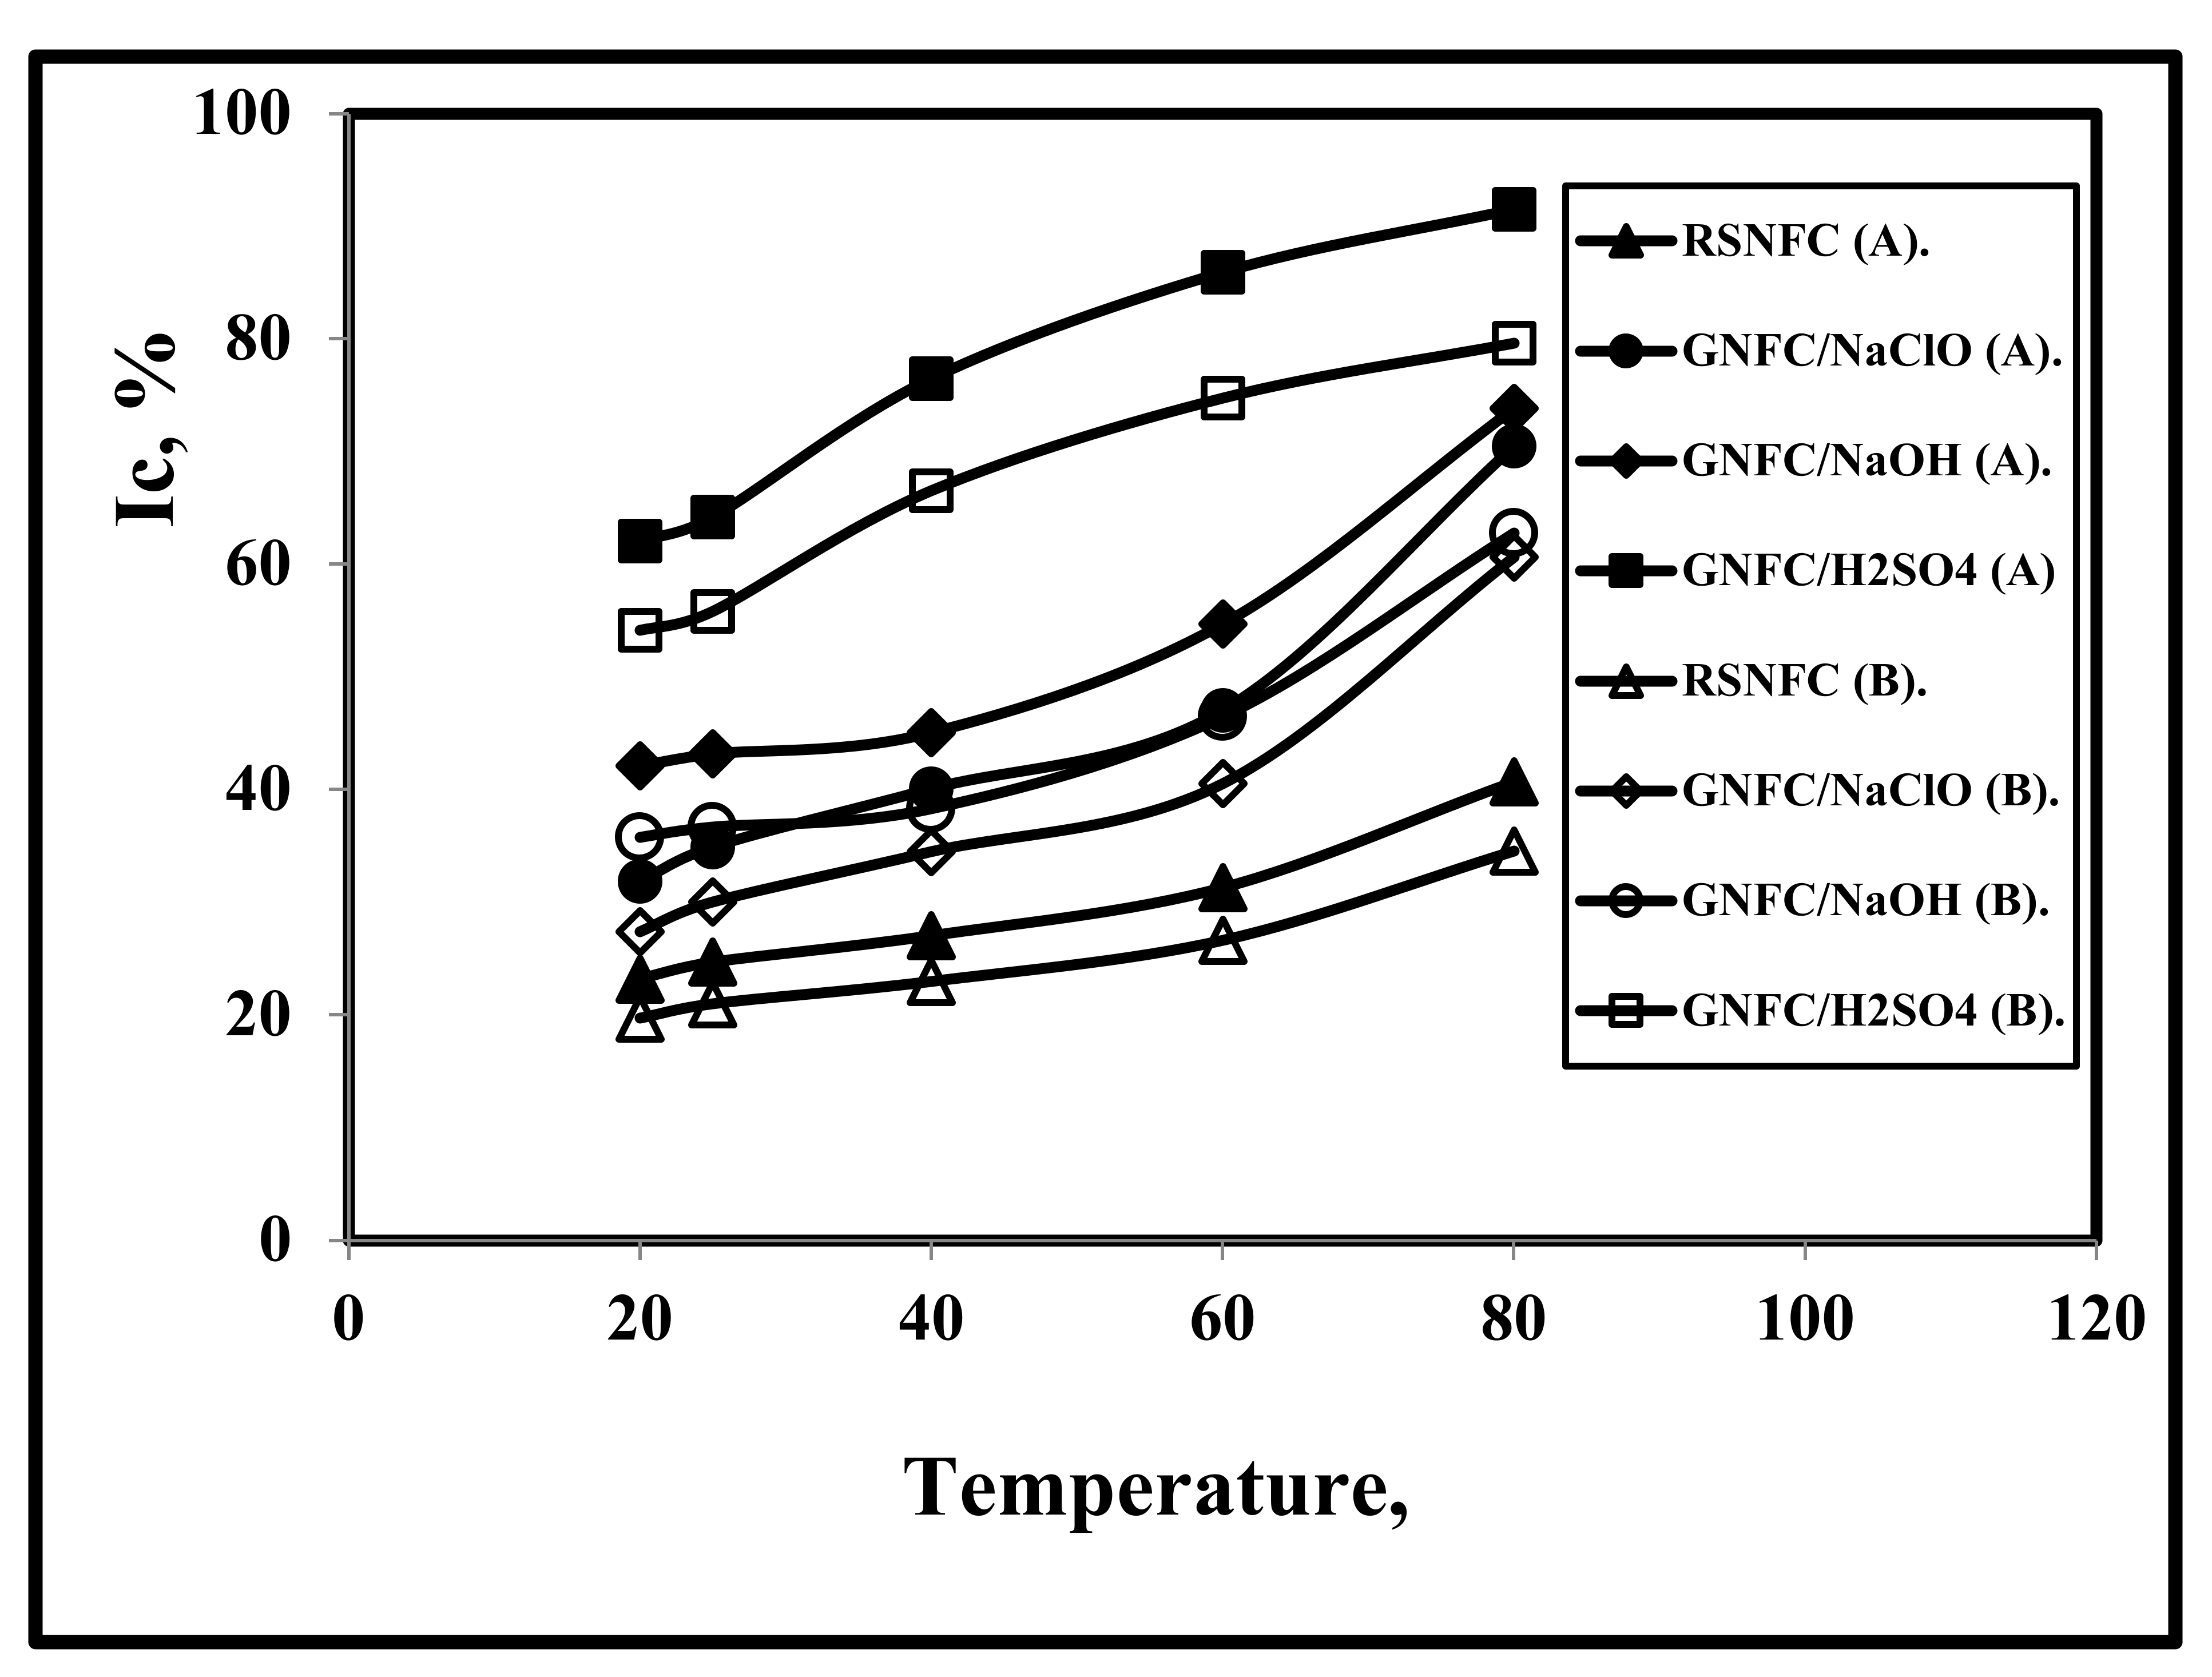
3.7. Effect of Test Temperature on IC

Figure 5 and Table 1 show that with increasing temperature, IC increased for all nanocellulose types. It is shown that IC for GNFC/H2SO4 was the highest followed by GNFC/NaOH, GNFC/NaClO, and RSNFC, in that order. Although Kusmono et al. [5] concluded that the crystallinity decreased as a result of the hydrolytic cleavage of the glycosidic bonds that caused due to the removed amorphous components and some crystalline parts at both the higher temperature and acid hydrolysis [59,60], Barbash et al. [18] found that upon temperature increment to 130 °C, IC significantly increased from 30.94% to 59.30% due to the exerted homogenizer shear force exerted on the amorphous region of the cellulose fibers according to Zhao et al. [46]. Samir et al. [61] concluded that IC increased to around 70.29% after alkaline hydrolysis and bleaching due to the significant decrement in the lignin content.

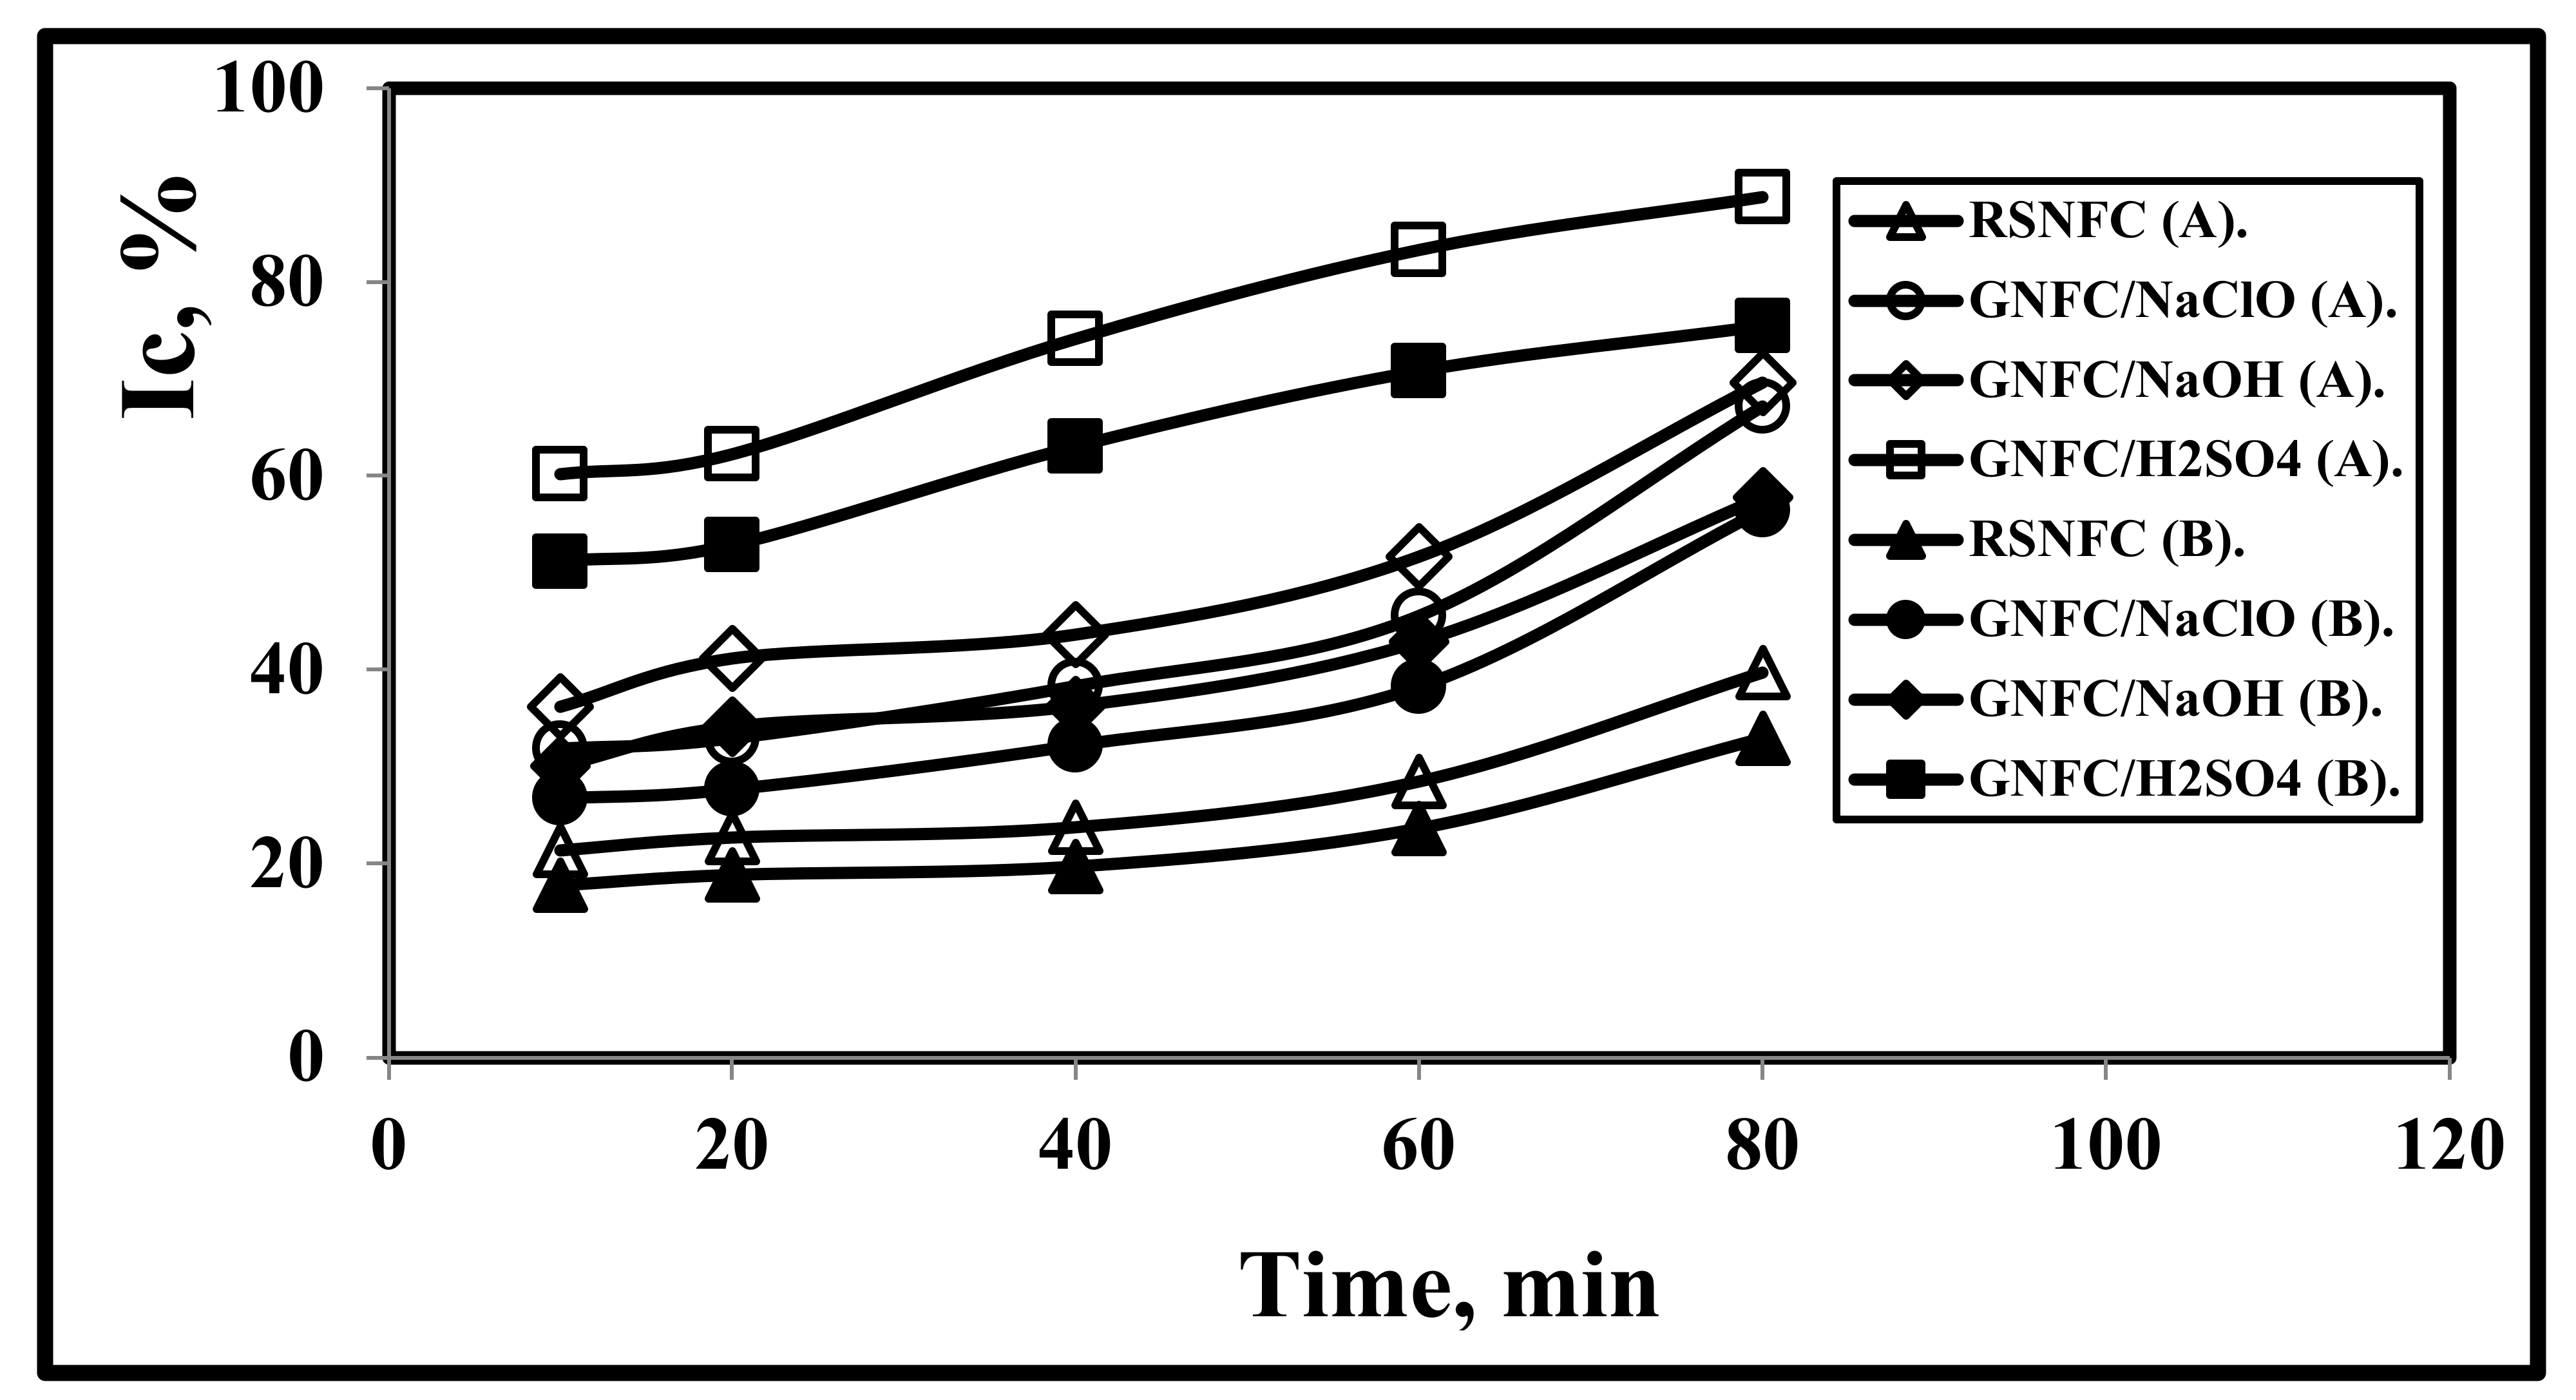
3.8. Effect of Reaction Time on IC

Figure 6 and Table 2 show that with increasing time, IC increased for all nanocellulose types. The effect of the test periods on the values of IC was lower for all specimen types compared to the effect of test temperatures in agreement with [5,18,49]. As Kargarzadeh et al. [59] and Kian et al. [62] concluded, a reaction time of more than 30 min resulted in crystallinity reduction, while Kargarzadeh et al. [59] found that for kenaf bast fibers NC production, the optimal reaction time was achieved at 40 min, 45 °C, and 65.00% sulfuric acid. But, the optimum hydrolysis time was achieved at 80 min with 58.00% sulfuric acid concentration according to Al-Dulaimi and Wanrosli [63].

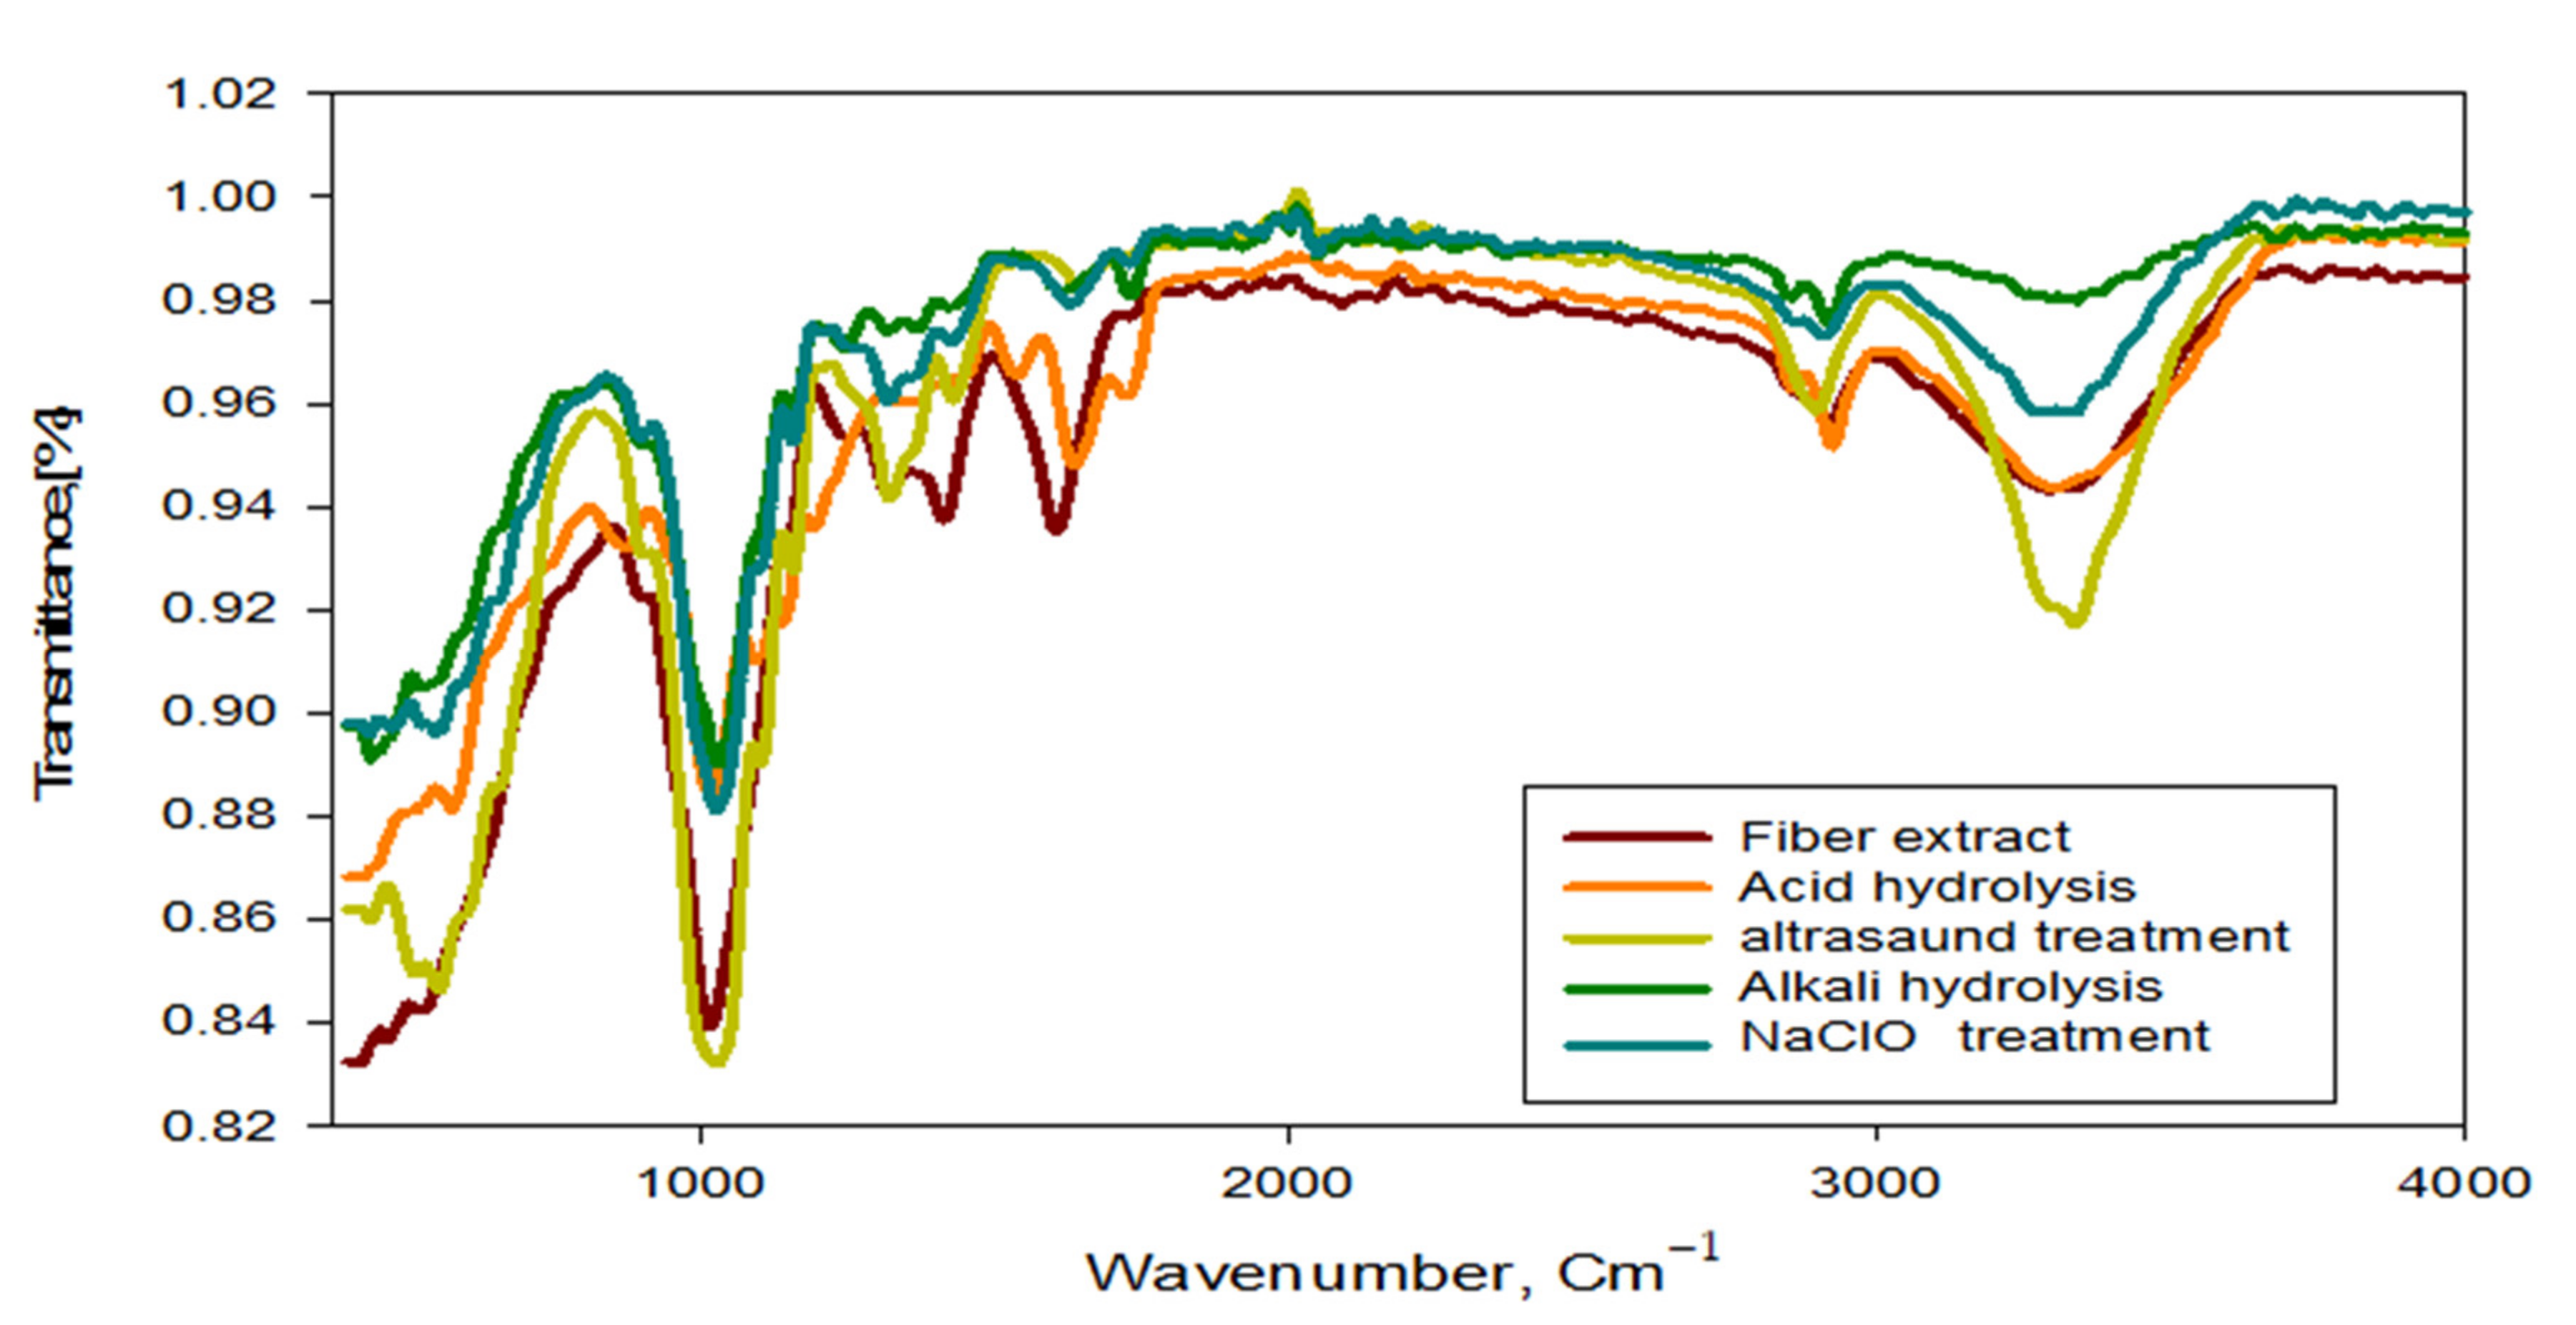
3.9. Spectroscopic Analyses

Typical FT-IR spectra of RSNFC, GNFC/NaOH, GNFC/NaClO, and GNFC/H2SO4 are shown in Figure 7. Stretch - OH absorption peak at 3500 cm−1, associated - CH absorption peak at 2915 cm−1 and at 2850 cm−1 an overlapping of – CH had found in all samples. These peaks are only found in cellulosic feed stocks, while due to the amorphous cellulose chain termination RSNFC peaks have been lost in agreement with Zulnazri et al. [1].
Due to both the absorption of water and the strong interaction between the cellulose and air, a small absorption peaks at the range 1600–1650 cm−1 indicated that the cellulose samples no longer bind to O-H in agreement with Johar and Ahmad [64]. Associated with an aromatic ring polysaccharide, an absorption vibration band peak found at the range 1300–1350 cm−1 in agreement with that analyzed by Nacos et al. [65]. In addition, at region 1100 cm−1–1160 cm−1, absorption peaks were seen in agreement with Kagarzadeh et al. [59]. An intensity increment in the bands 1025 cm−1 due to the pyranose ring stretching occurred for all GNFCs treated types in agreement with Corrêa et al. [66] and absorption peaks 890 cm−1 related to C-H vibration of the lowest cellulose
All types of treated GNFCs showed increased intensity in the bands 1025 cm−1 due to the pyranose ring stretching in agreement with Corrêa et al. [66]. According to Li [67], absorption peaks of 890 cm−1 at C-H vibration band due to the lowest cellulose vibration anomeric, specifically to β-glucosides bonds that exist between the glucose units of cellulose/hemicellulose nanofibers in the GNFC spectra, [68]. According to the infrared spectral features, the functional types of cellulose nanofibers showed that there were no distinct changes at different conditions in agreement with [69].

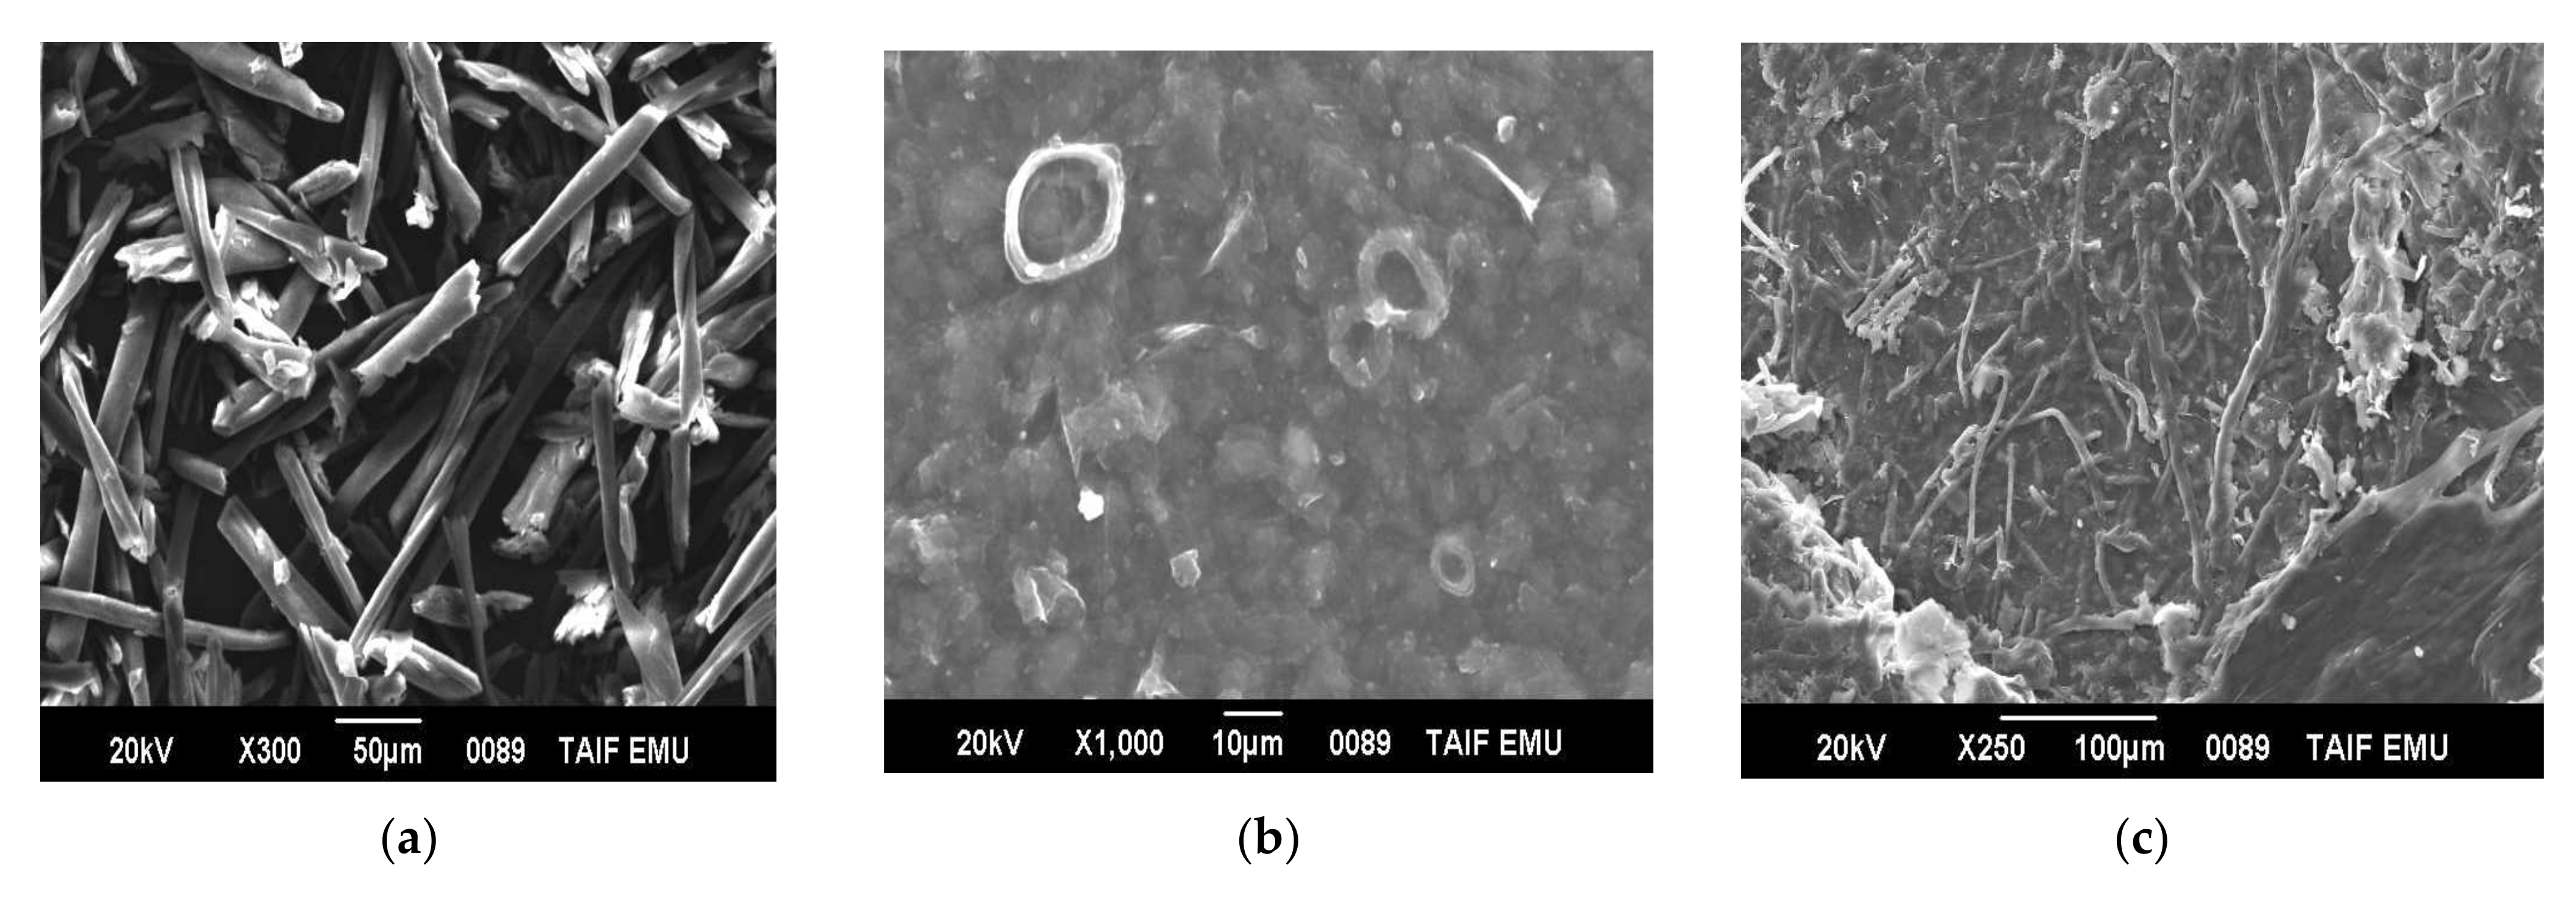
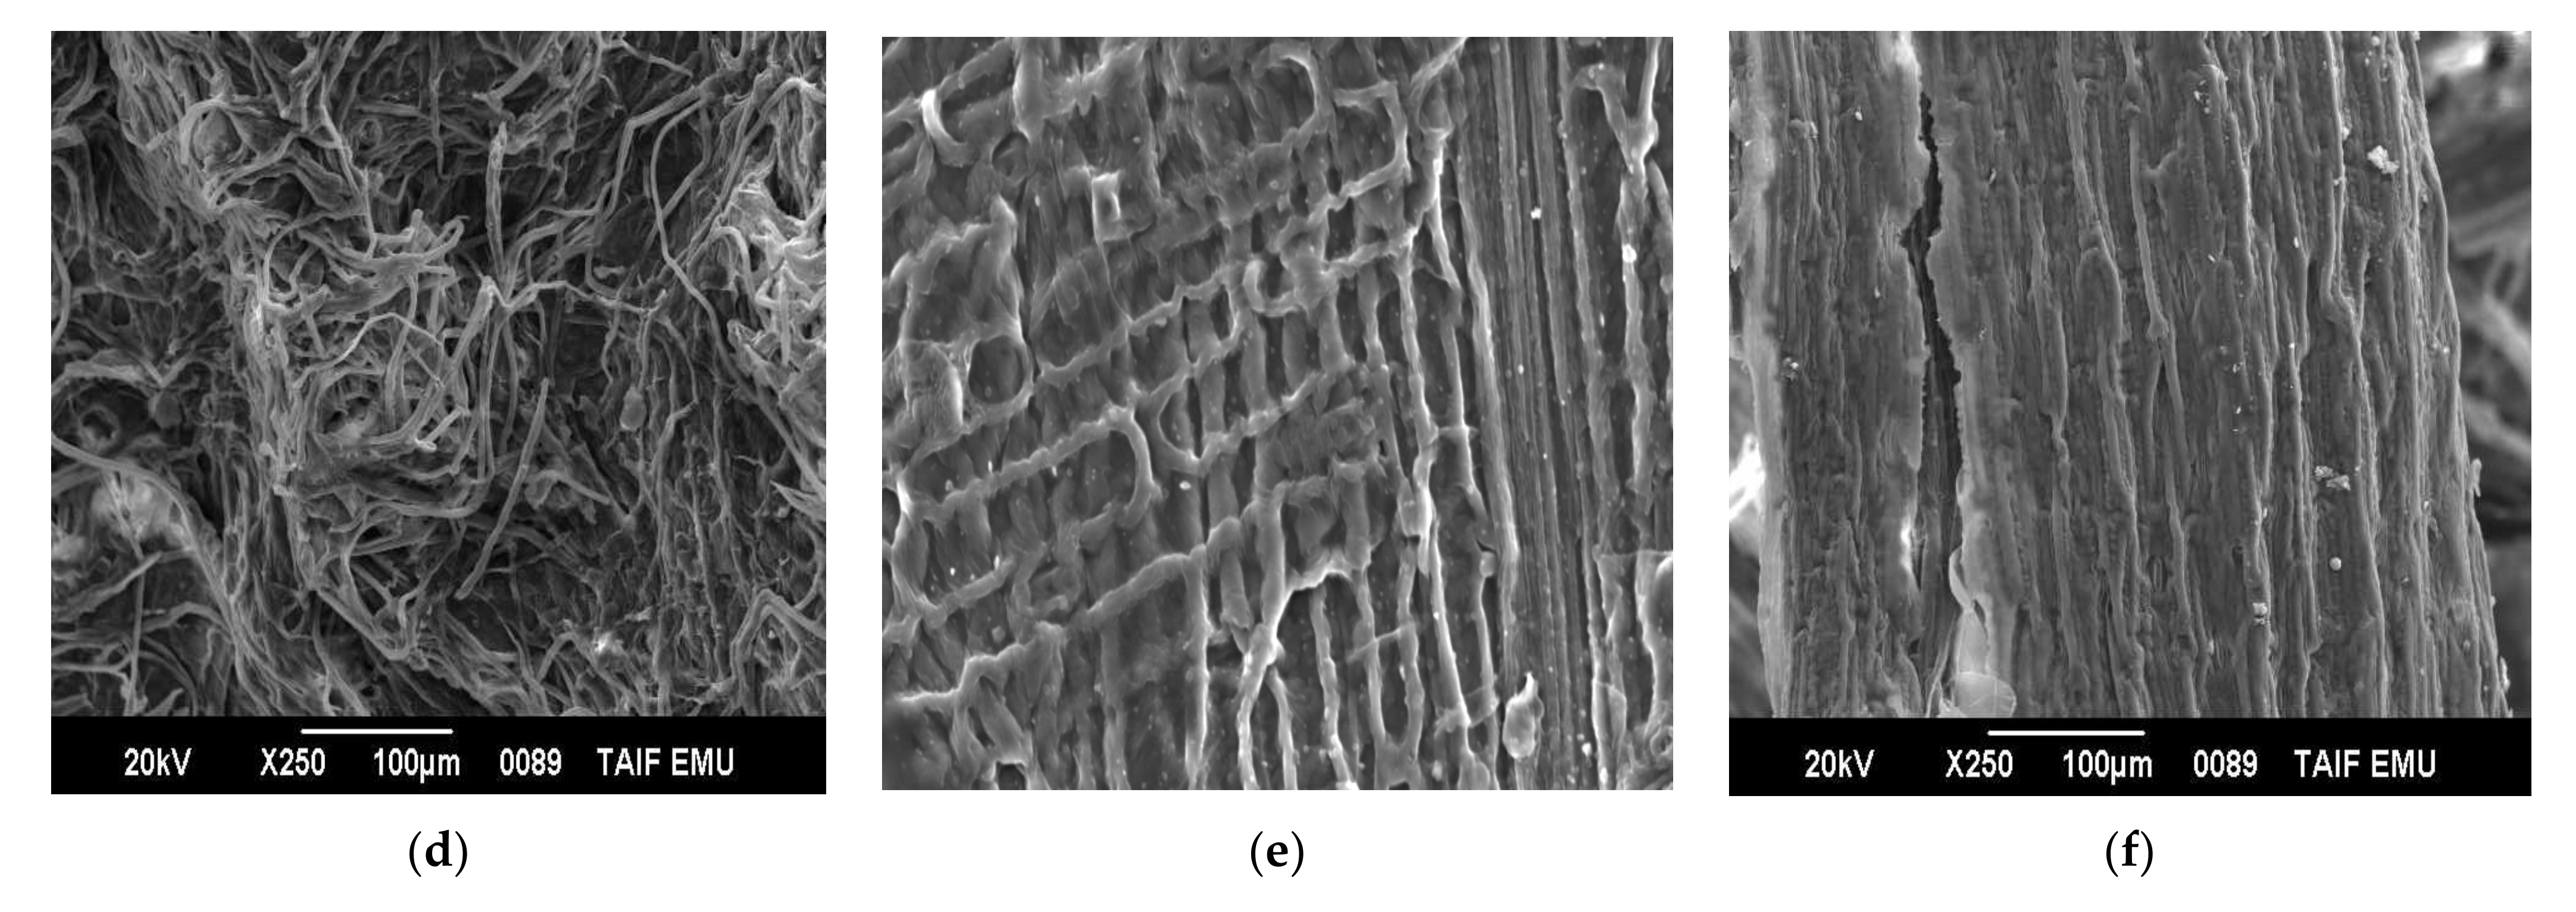
3.10. Morphological Investigations of Untreated and Treated Fibers

The morphological changes of different types of different treated GNFC before and after sonication are shown in Figure 8. Due to the removal of hemicellulose and lignin and eliminating the cementing material around the fibers bundle, uniform fibers formed (Figure 8a). Thomas [26] concluded that acid hydrolysis removed the rest of the binding materials and highly ordered crystallites were formed. The fibrils formed aggregated and with rough surface morphology due to the effect H2SO4 acid hydrolysis in removing the cellulose amorphous components holding the cellulose crystal region that producing smoother GNFCs, (Figure 8b). Acid hydrolysis facilitates defibrillation of the fibers on a nanoscale level [60]. Figure 8c shows the morphology of the alkali-treated fibers on which the reduction of fibers diameters owing to the removing of some of the cementing material parts in agreement with [26].
Figure 8d shows the morphology of the alkaline sonicated GNFC. The sonication process causes further defibrillation due to the removal of the most lignin present in the GNFC fibers and the smaller of the bleached fibers compared to the untreated alkali fibers [61]. There are very distinct cellulose fiber bundles that exhibited a rough wood surface structure, Leite et al. [70] which proving that the acidic treatment is very effective for the lignin removal as well as the individual cellulose fibers separation.
Figure 8e shows GNFC/NaClO morphology before treatment by ultrasonic waves with lignin degradation which in turn facilitated the solubilization of lignin medium and separation according to Cherian et al. [54].
Figure 8f showed the morphology of GNFC/NaClO after sonication leading to further defibrillation, on which web-like nanostructure observed in most fibers exhibited web-like nanostructure with some bundles still existed [15,52].

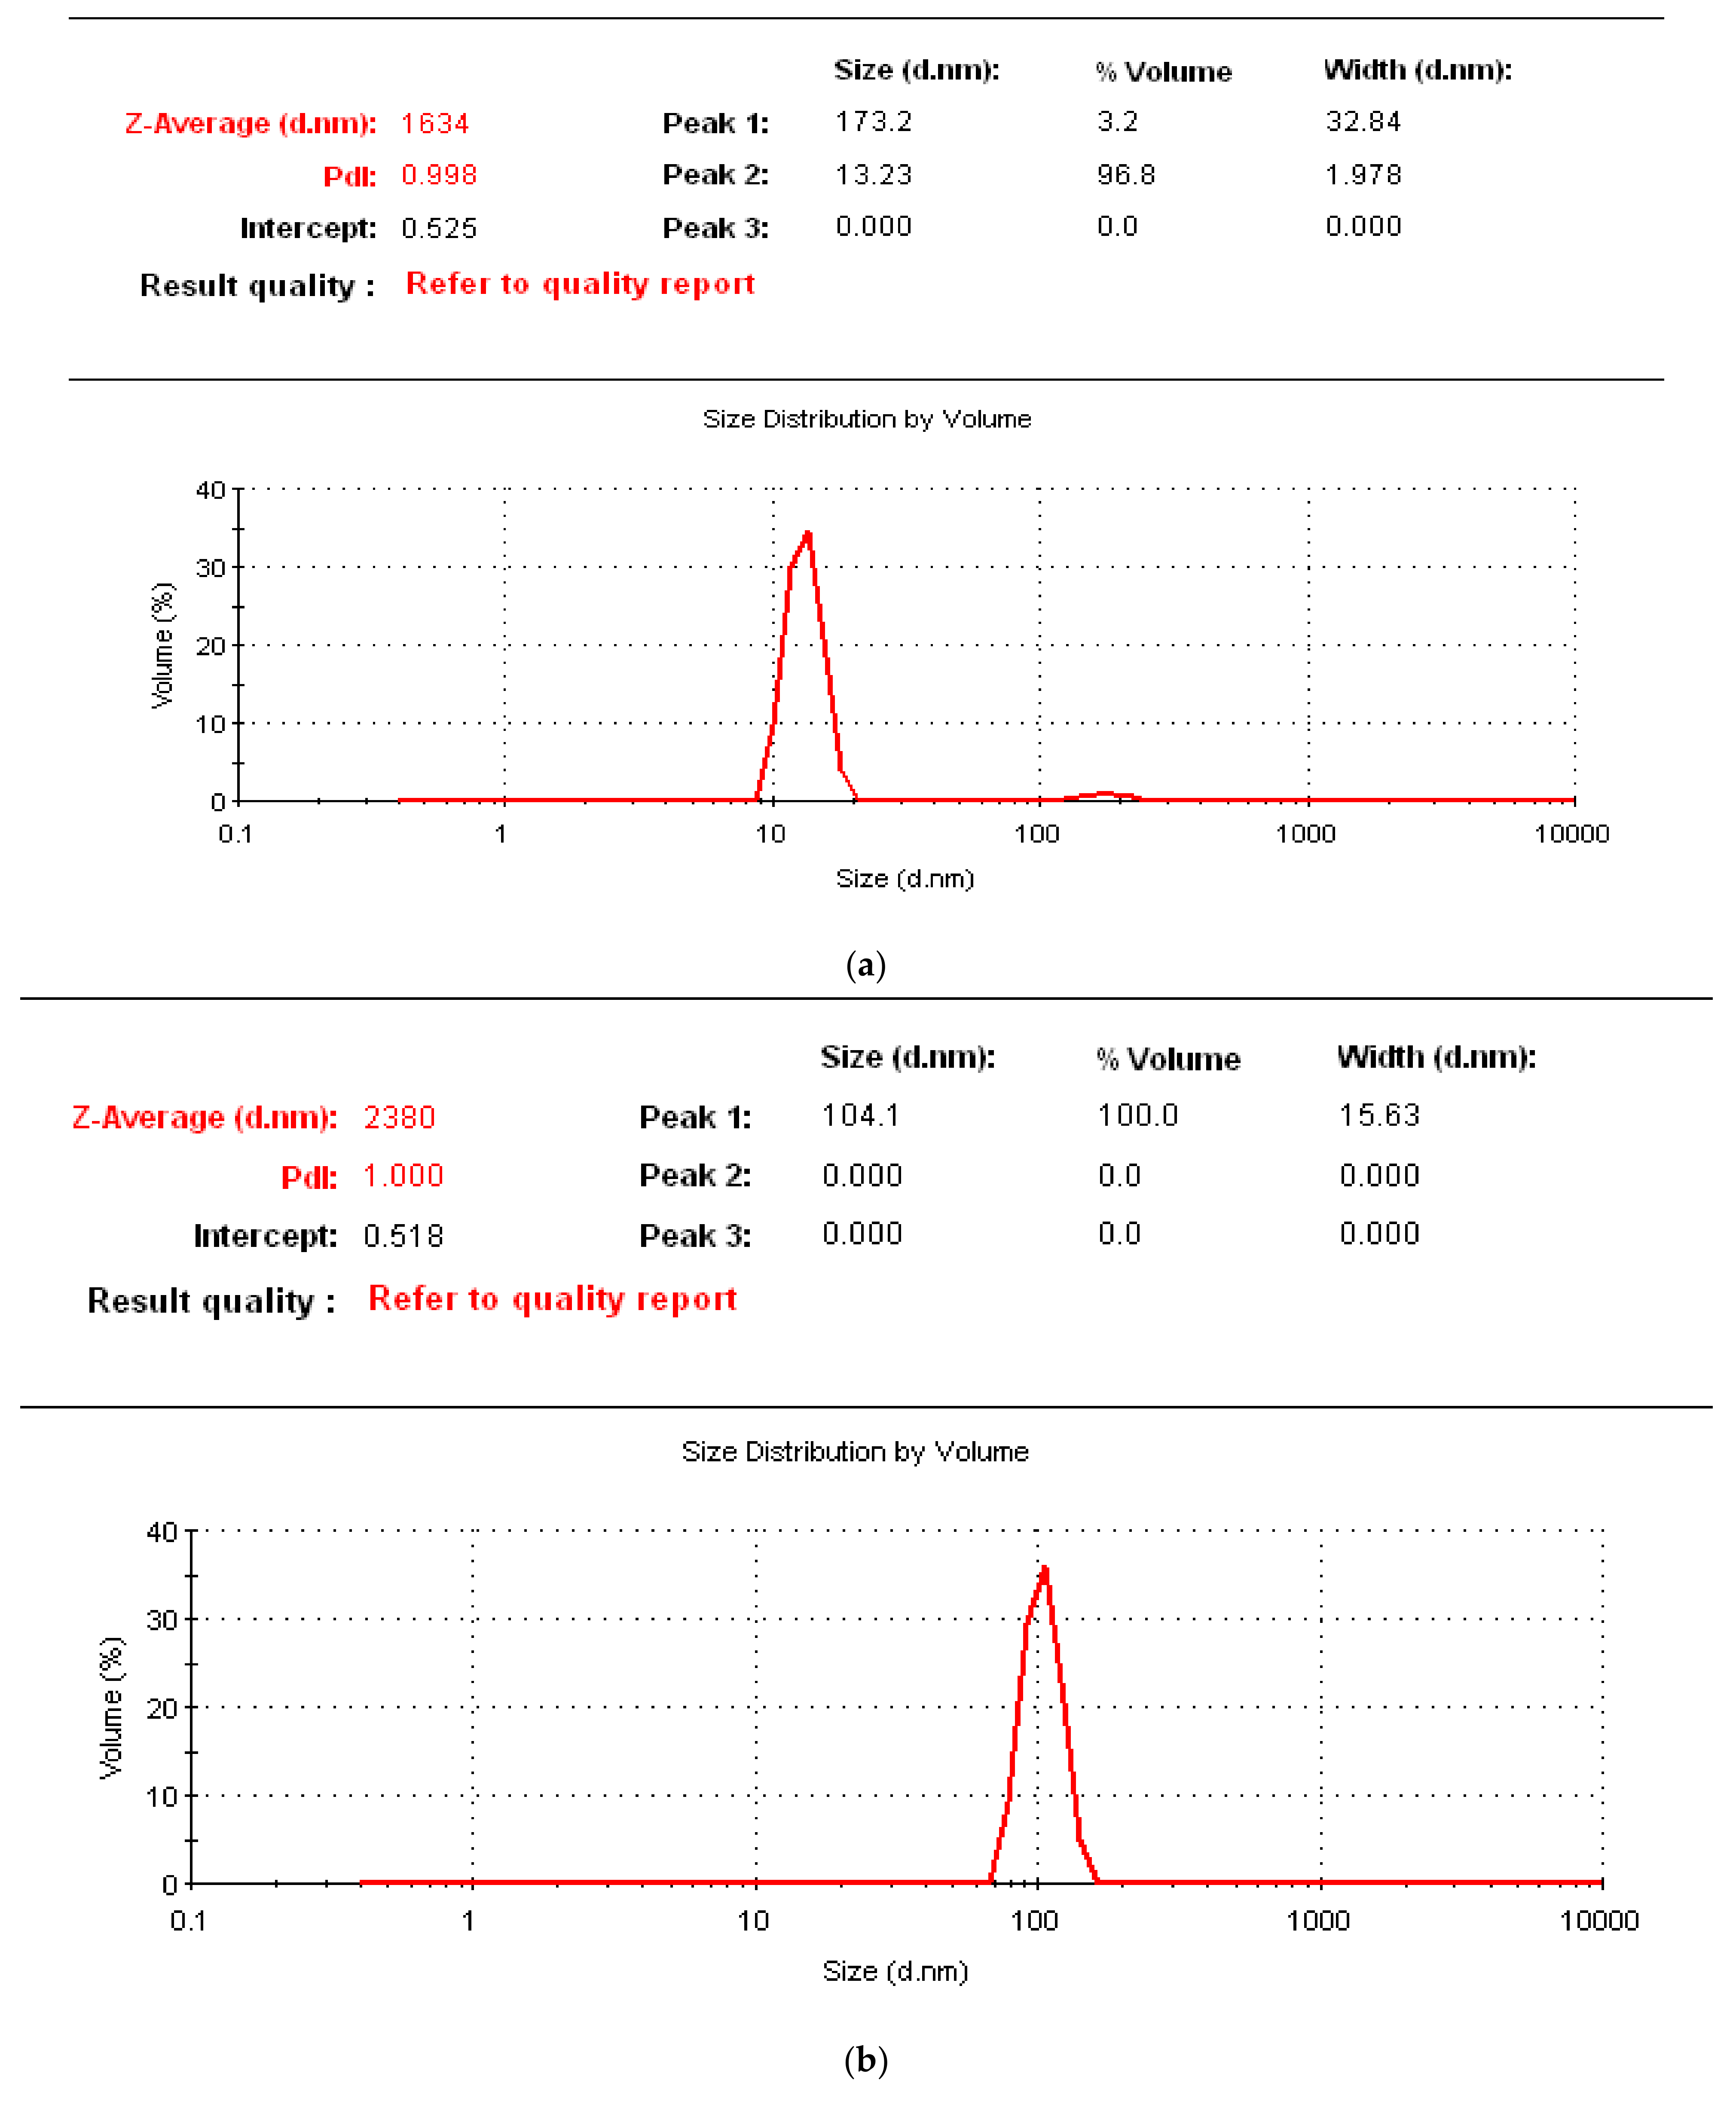
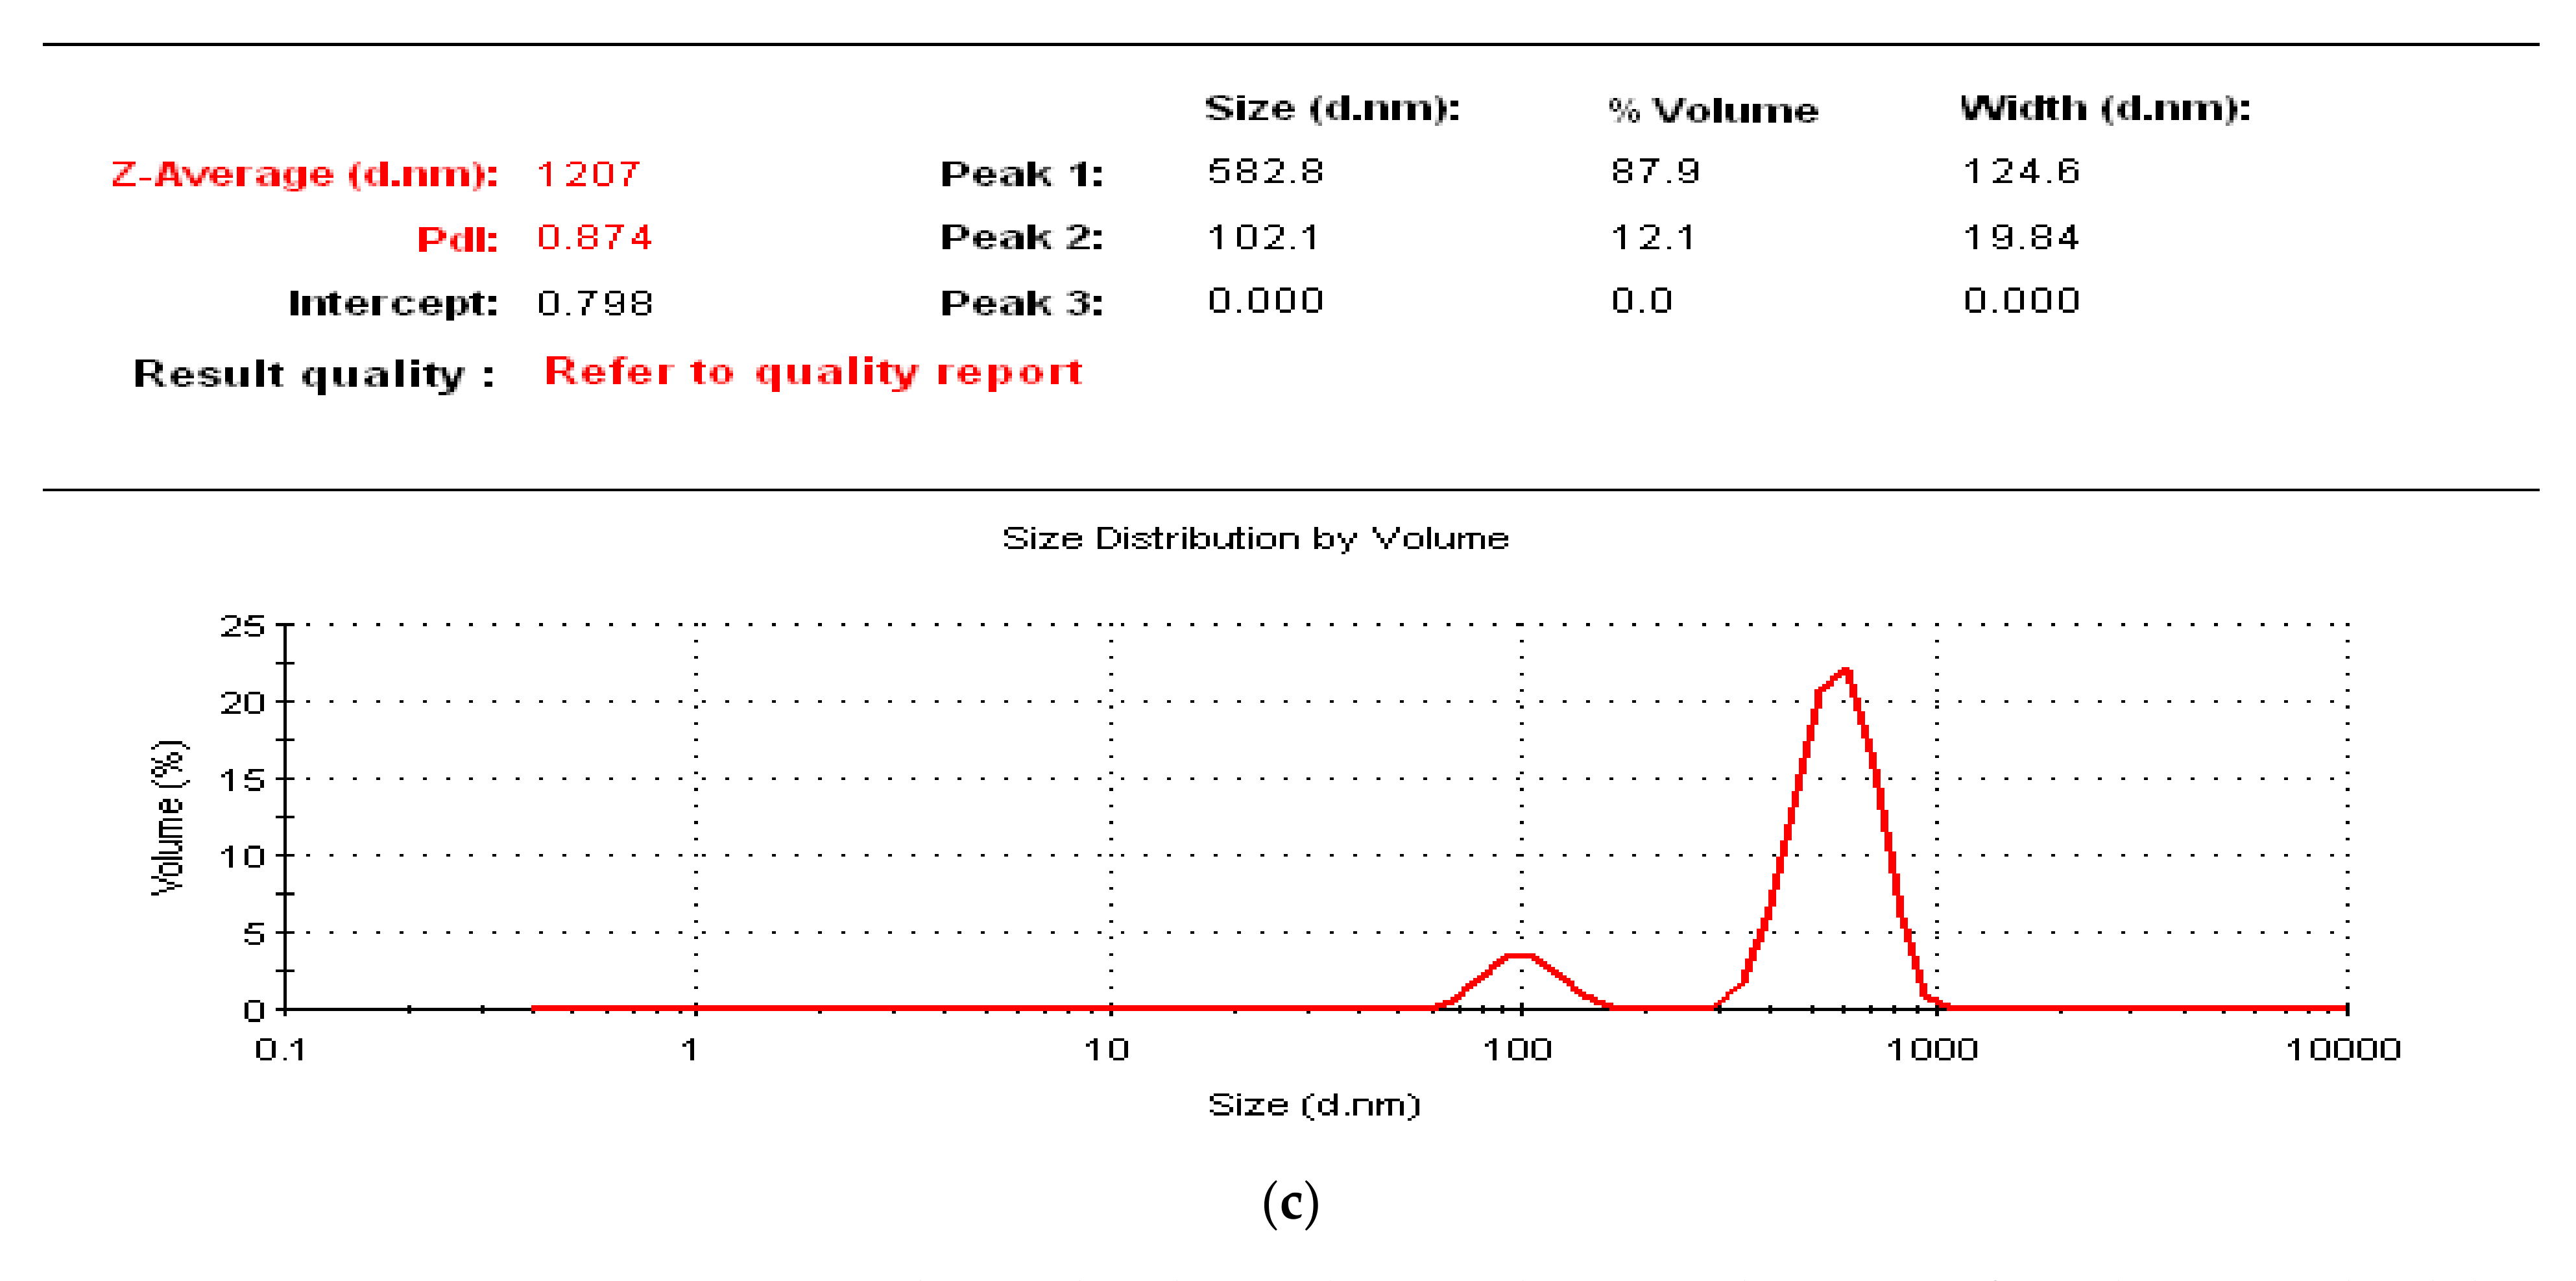
3.11. Particle Size Measurement

Figure 9a–c showed the size distribution of GNFC/NaClO, GNFC/NaOH, and GNFC/H2SO4 measured by particle size analysis. The size distribution by volume of GNFC/NaClO as detected by laser diffraction shown in Figure 9a. There were two peaks; minor peak (1) with mean values of volume %, size (d·nm), and width of 3.20%, 173.20 d·nm, and 32.84 d·nm, respectively, and major peak (2) with a mean values of 96.80%, 13.23 d·nm, and 1.987 d·nm, respectively. Figure 9b shows GNFC/NaOH with only one peak with mean values of 100%, 104.1 d·nm, and 15.63 d·nm, while Figure 9c shows two peaks: the minor peak (1) with mean values of 87.9%, 582.8 d·nm, and 127.6 d·nm and with mean values of the major peak (2) of 12.1%, 102.1 d·nm, and 19.84 d·nm. The results showed that the produced weighted distribution volume contained different particle size measurements while that using image analysis resulted in the most accurate results according to [68,69,70,71]. Based on the given results, GNFC/NaClO produced better size distribution data compared to GNFC/NaOH and GNFC/H2SO4. Furthermore, the particle size distribution data proved that low acid concentration hydrolysis was not sufficient to obtain GNFC/H2SO4 in agreement with Mahardika et al. [72].

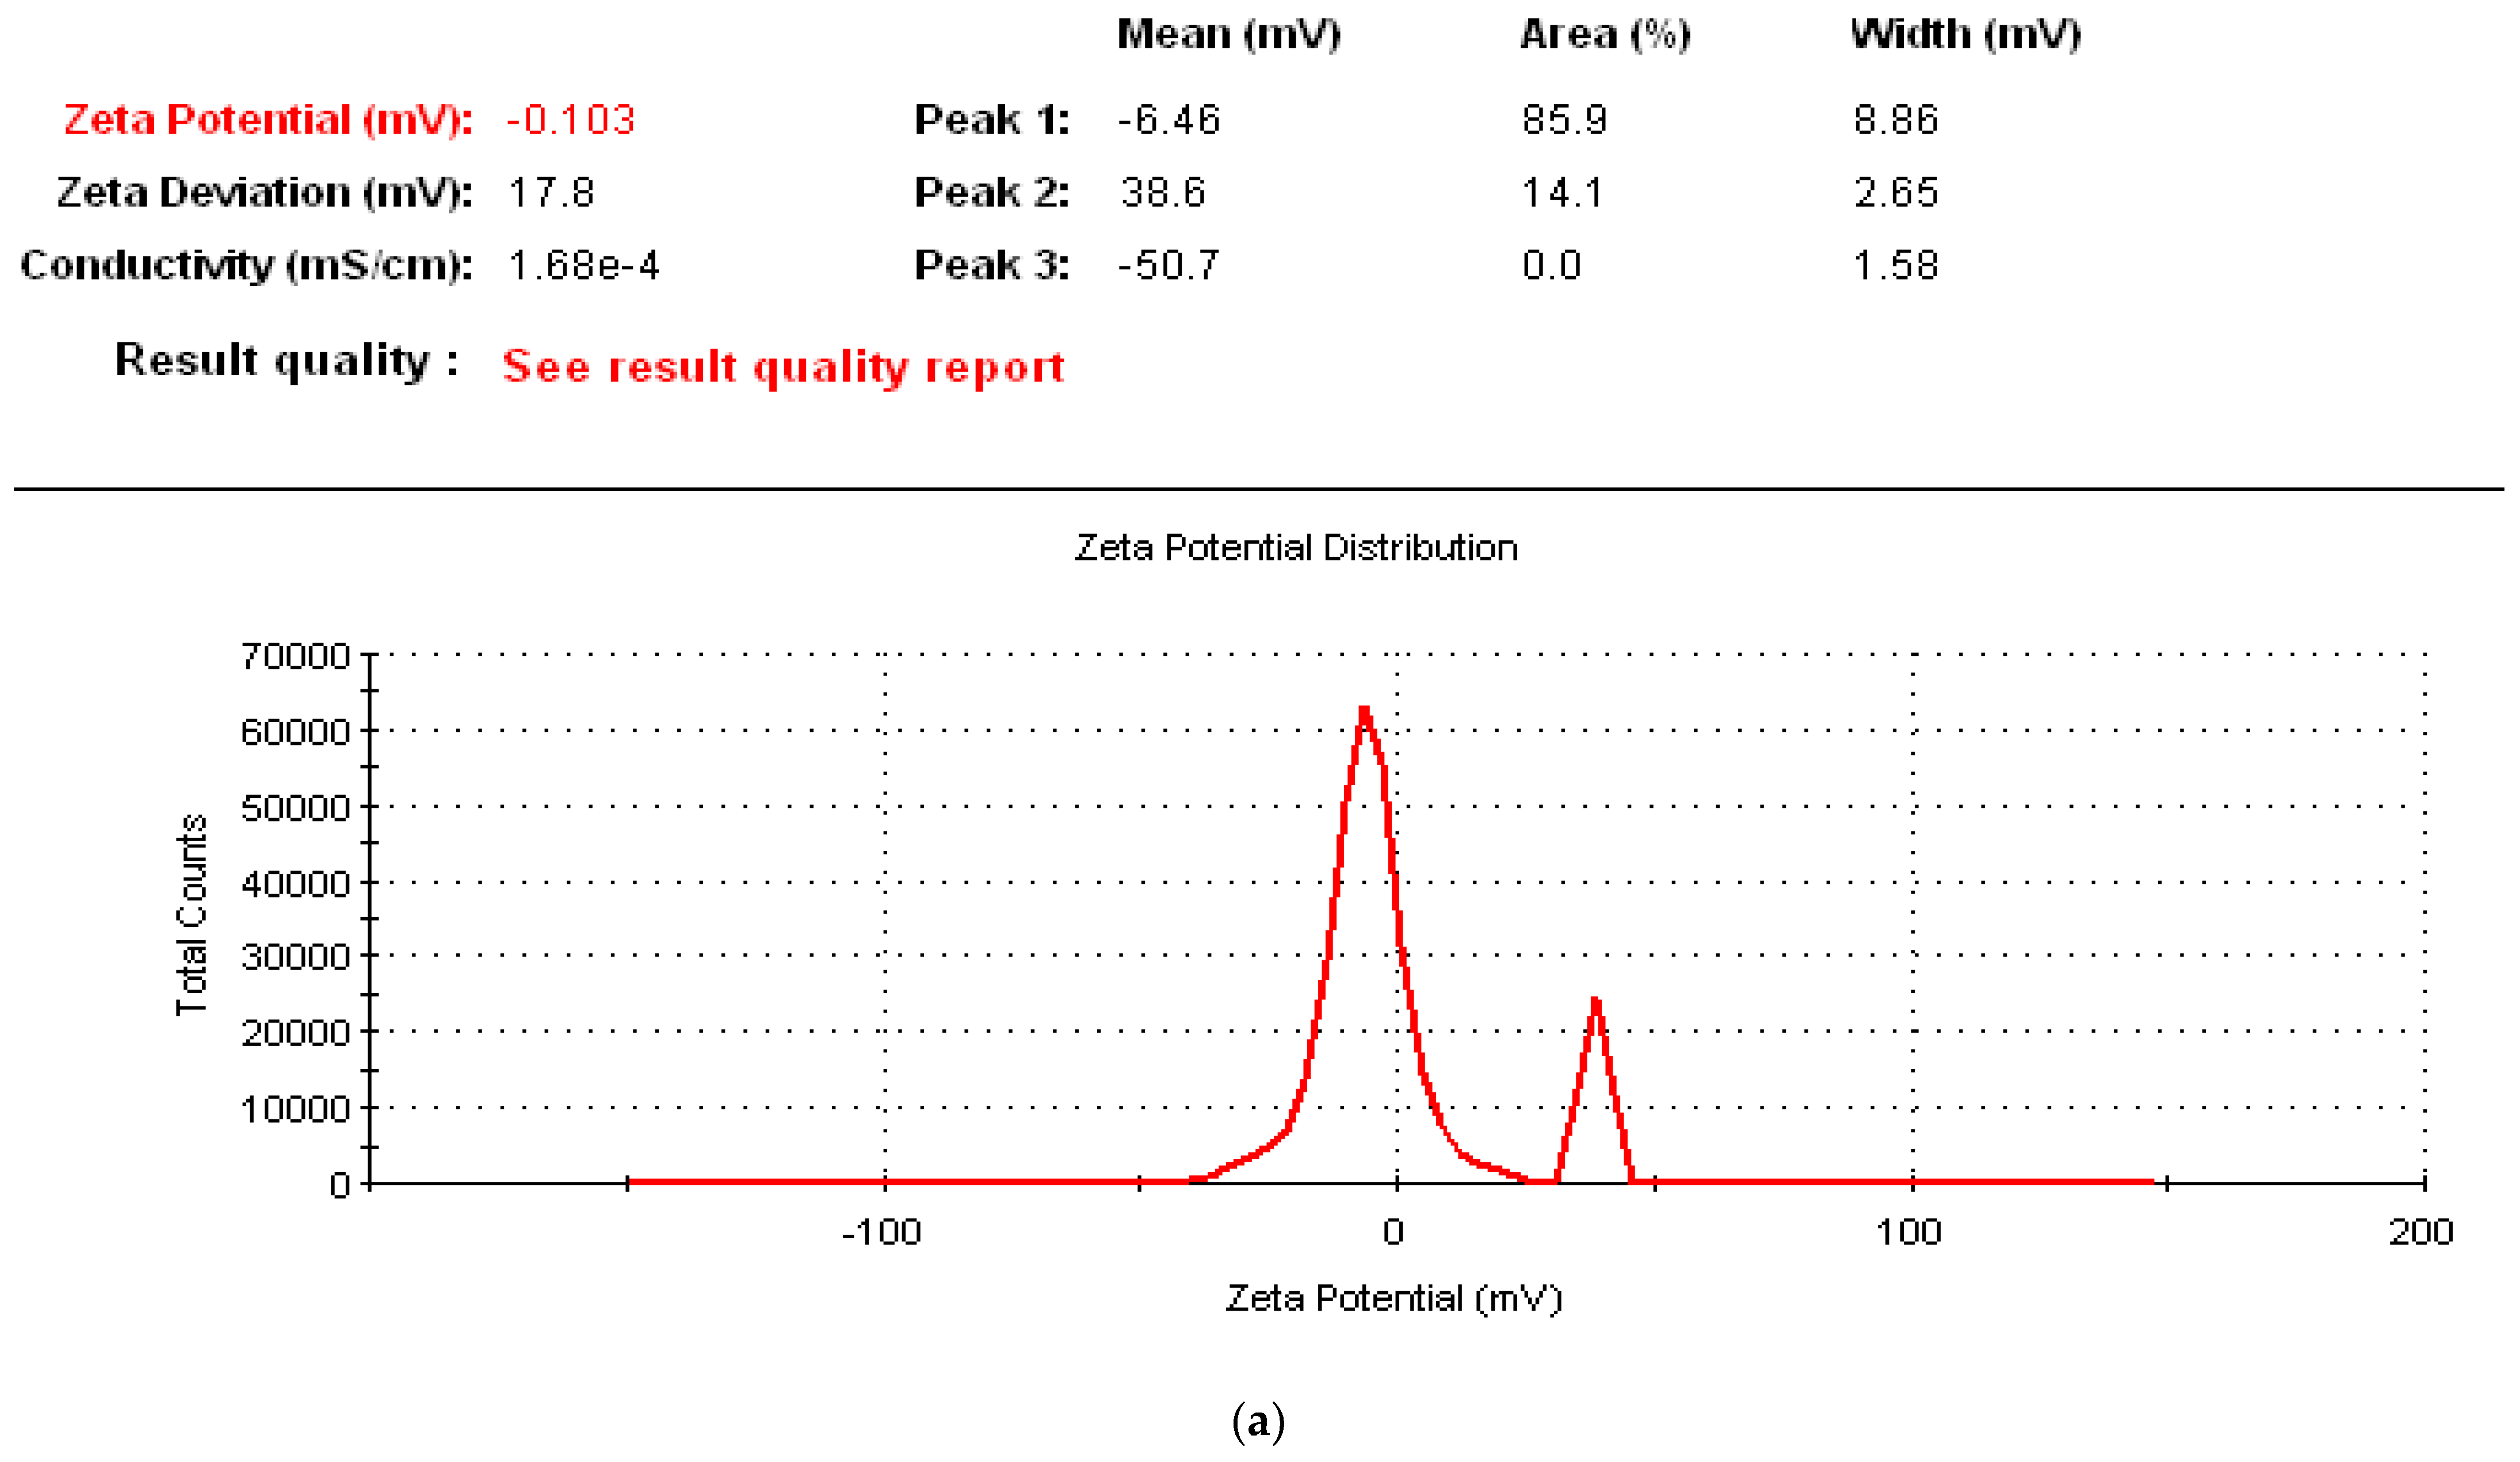
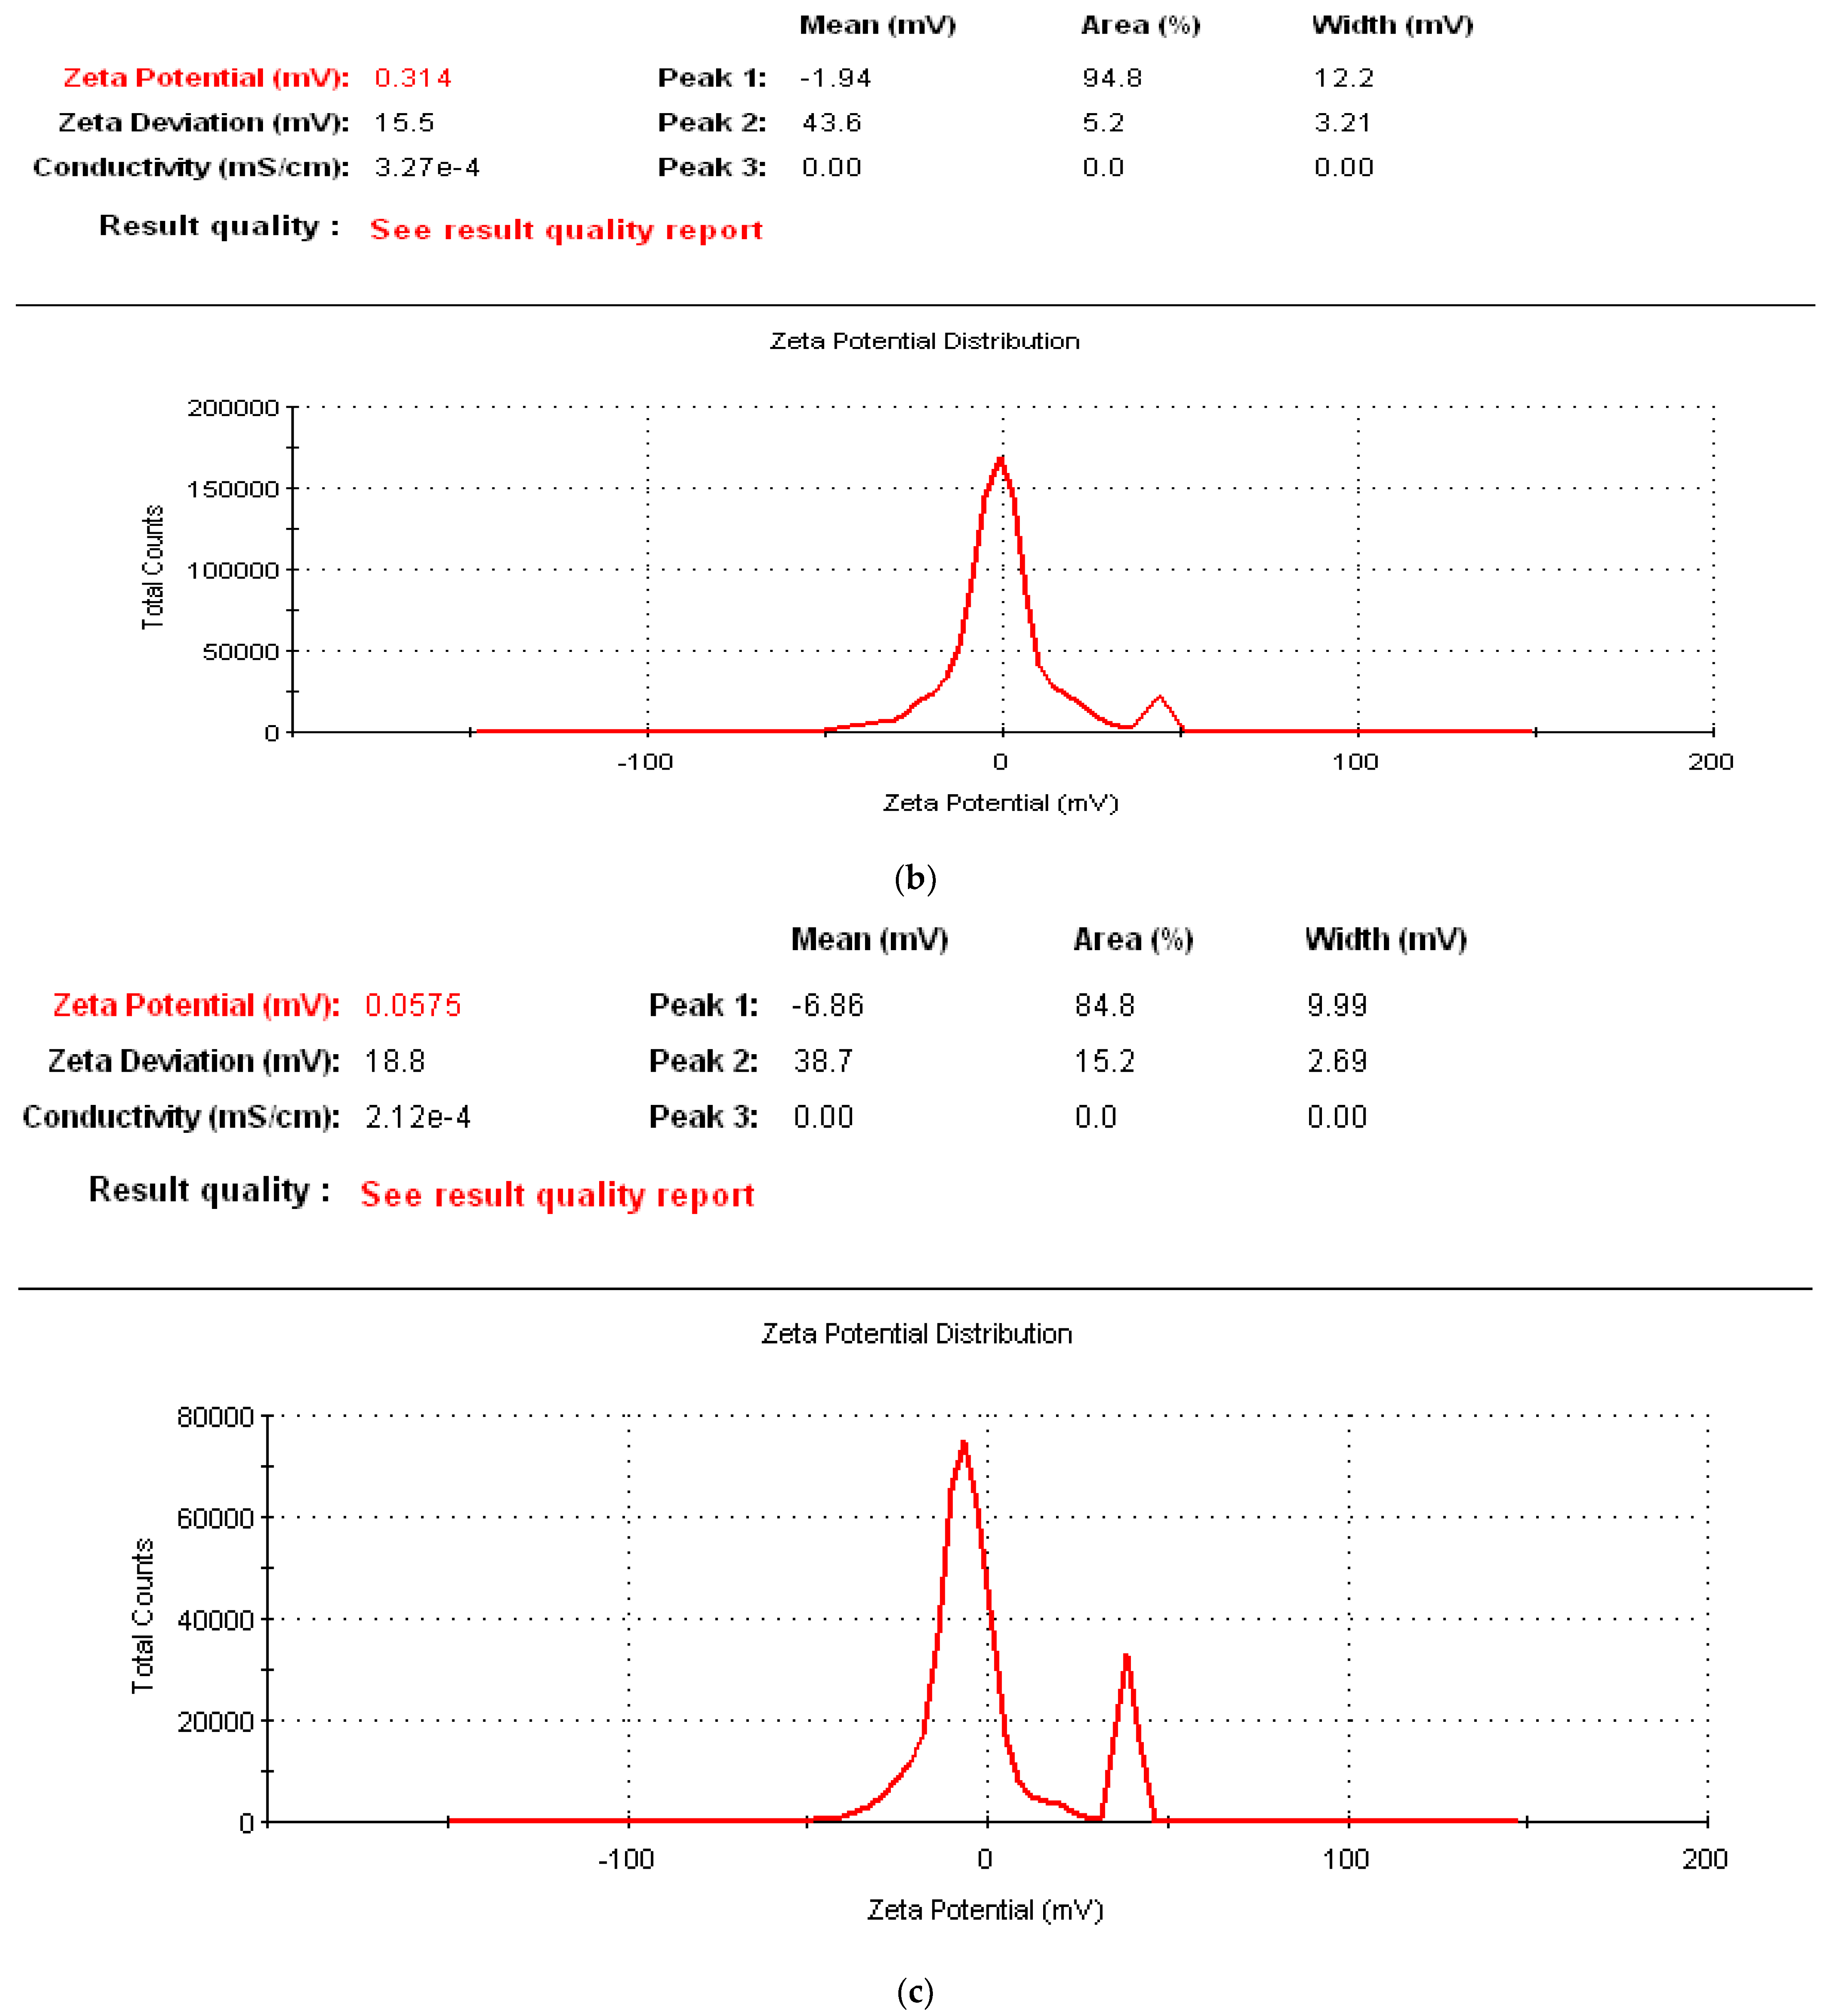
3.12. Zeta Potential Measurement

The Zeta potentials of the sonicated GNFC/NaClO, GNFC/NaOH, and GNFC/H2SO4 were measured and plotted in Figure 10. All specimen types showed a negative Zeta potential taking into consideration that the values lower than −15 mV represent the particle agglomeration starting and values higher than −30 mV indicated that sufficient mutual repulsion, resulting in a colloidal stability [73,74].
Figure 10 lists that the mean lowest negative value (−1.94 mv) was related to the sonicated GNFC/NaClO, while the mean highest value (−50.9 mv) was related to the sonicated GNFC/H2SO4 and sonicated GNFC/NaOH had a mean value of (−6.94 mv). Due to the presence of negatively charged sulfate groups on the cellulose nanocrystals surface, the sonicated GNFC/H2SO4 had a higher mean negative value according to Bondeson et al. [75]; Roman and Winter [76]. An aggregate form occurred due to the lack of electrostatic repulsive forces among the crystalline particles of the The sonicated GNFC prepared by NaClO hydrolysis in agreement with Araki et al. [77] and Angellier et al. [78]. Also, in aqueous media the use of H2SO4 reduces the starch nanocrystals agglomeration possibility and limits their flocculation.
Moreover, it was found that the conductivity values (mS/cm) for GNFC/NaClO, GNFC/NaOH, and GNFC/H2SO4 were 3.27 × 10⁻⁴, 2.12 × 10⁻⁴, and 1.68 × 10⁻⁴, respectively. As the lower conductivity leads to lower current values and lower stability [79,80], among the three suspensions, the Zeta potential was higher (GNFC/H2SO4 > GNFC/NaOH > GNFC/NaClO), indicating the higher acid concentration effect on the suspensions stability and the consequent colloidal suspension formation.

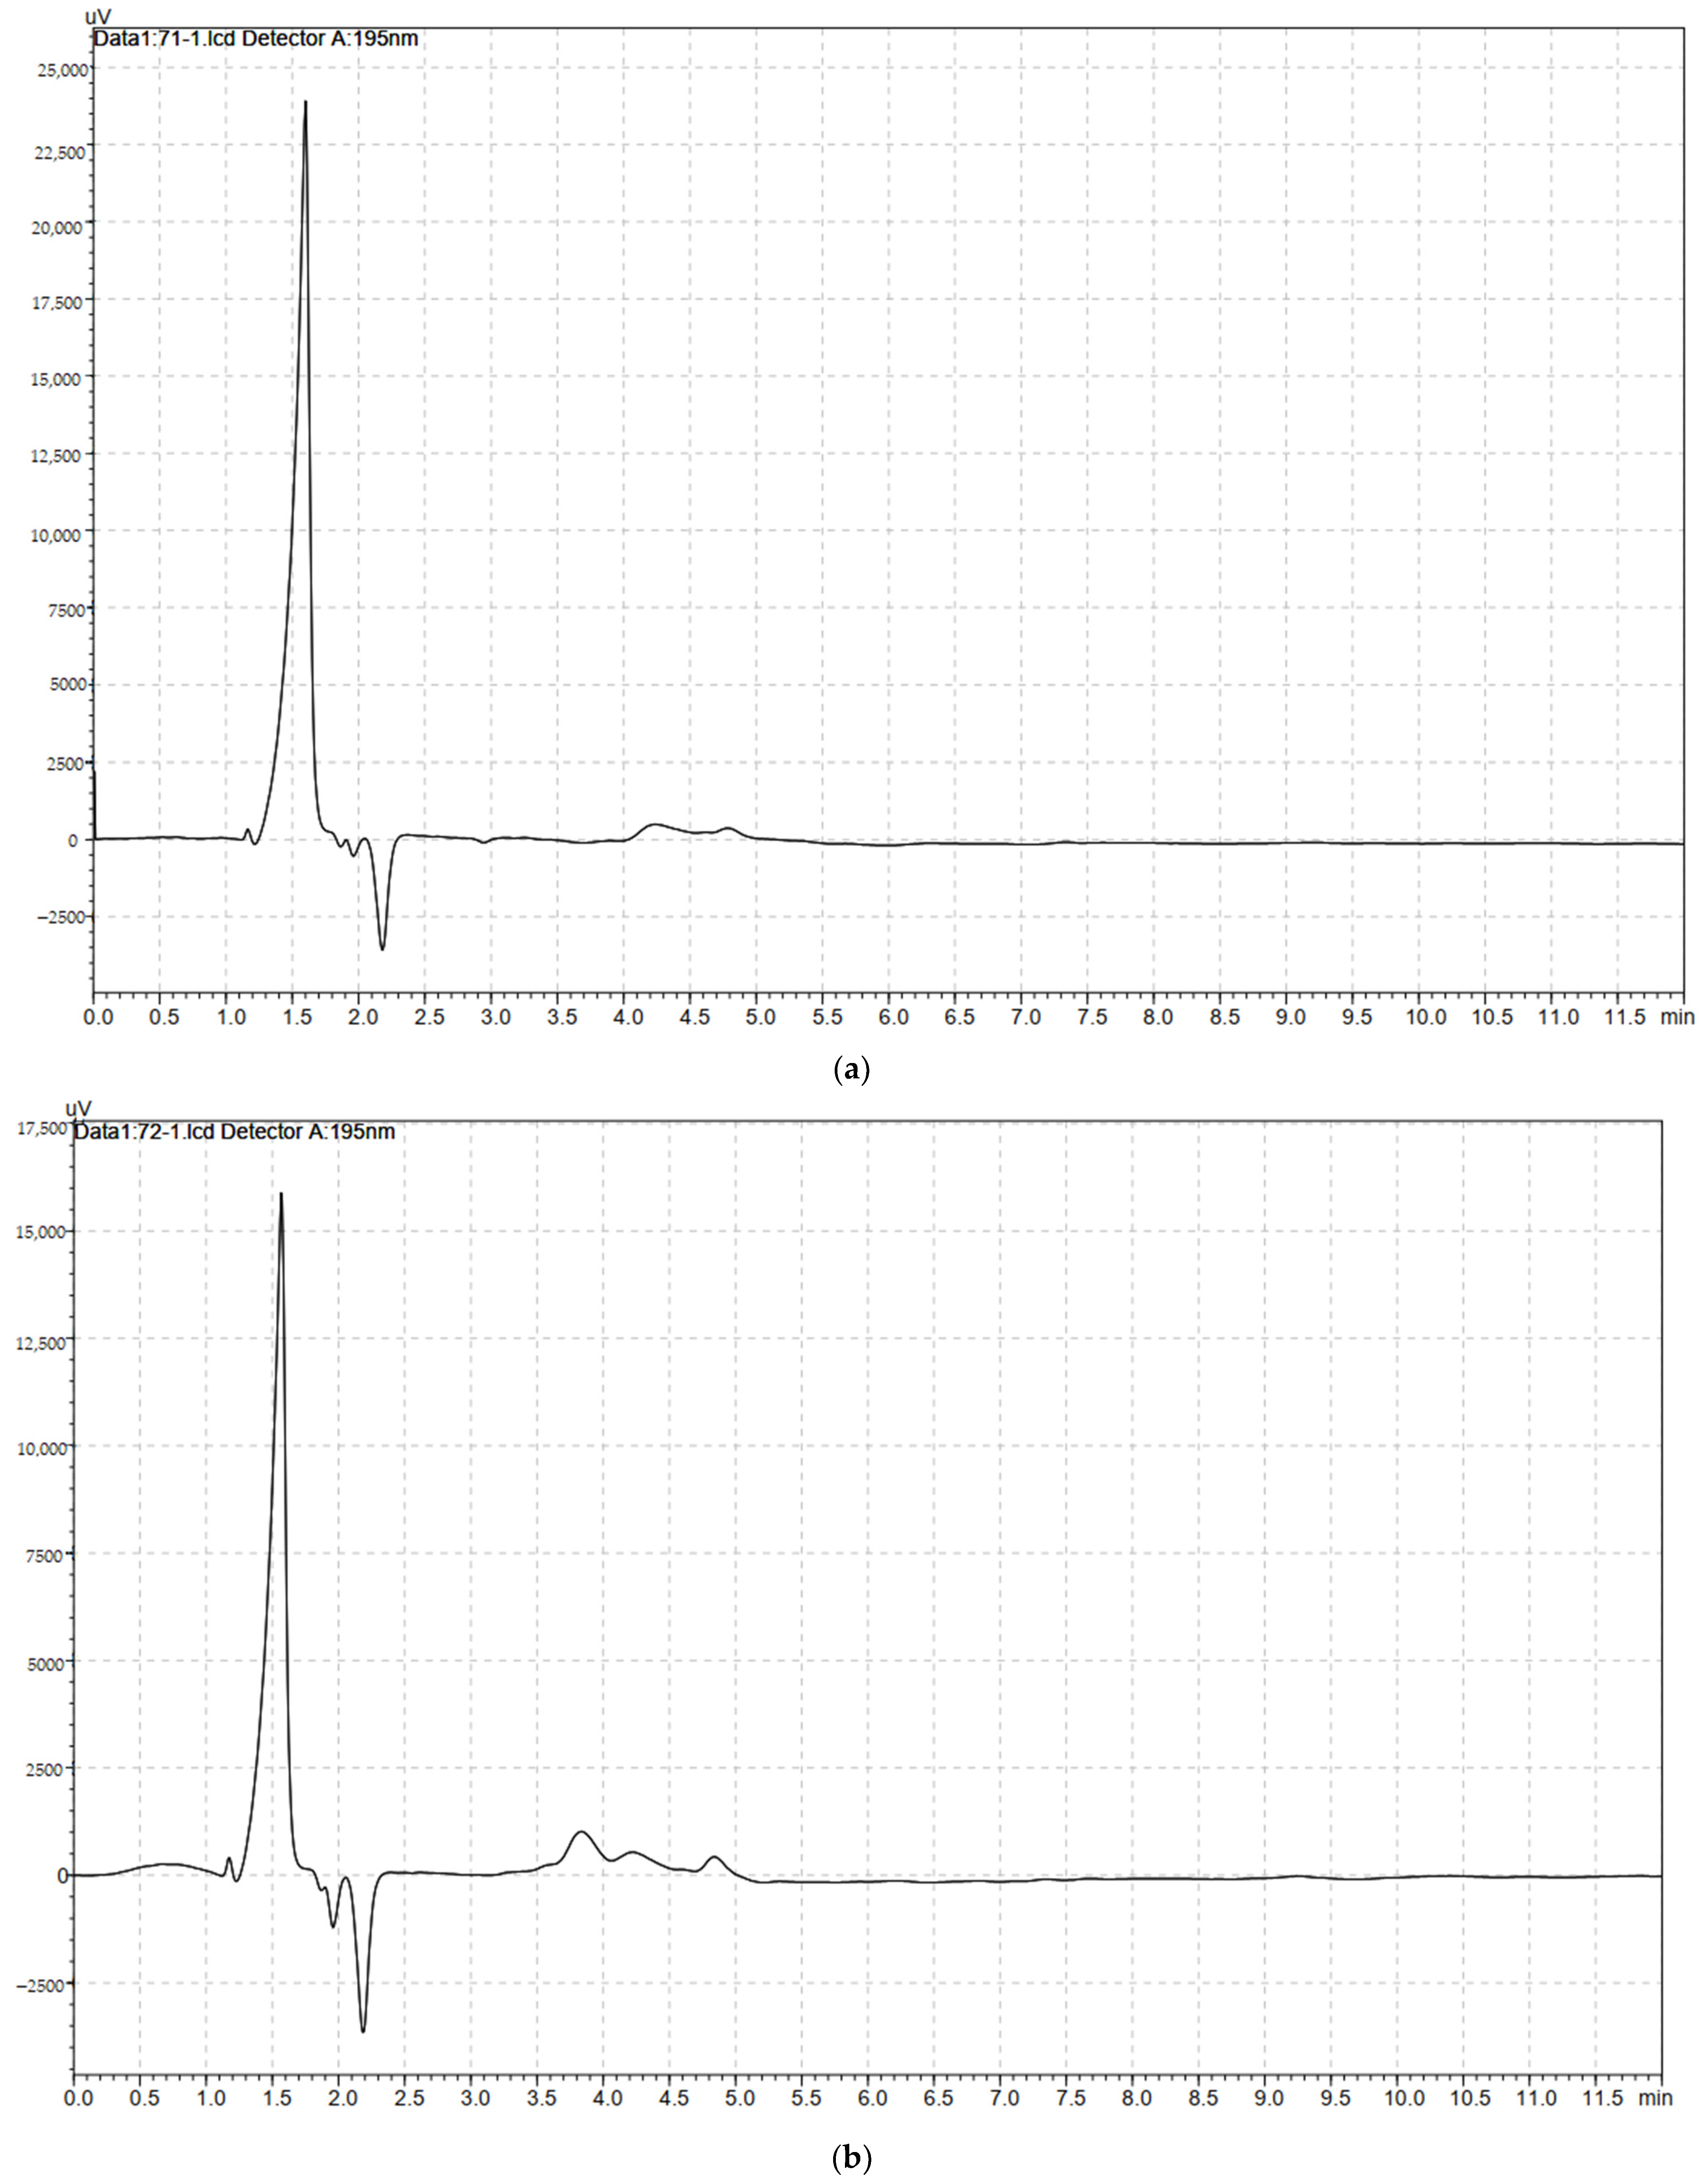
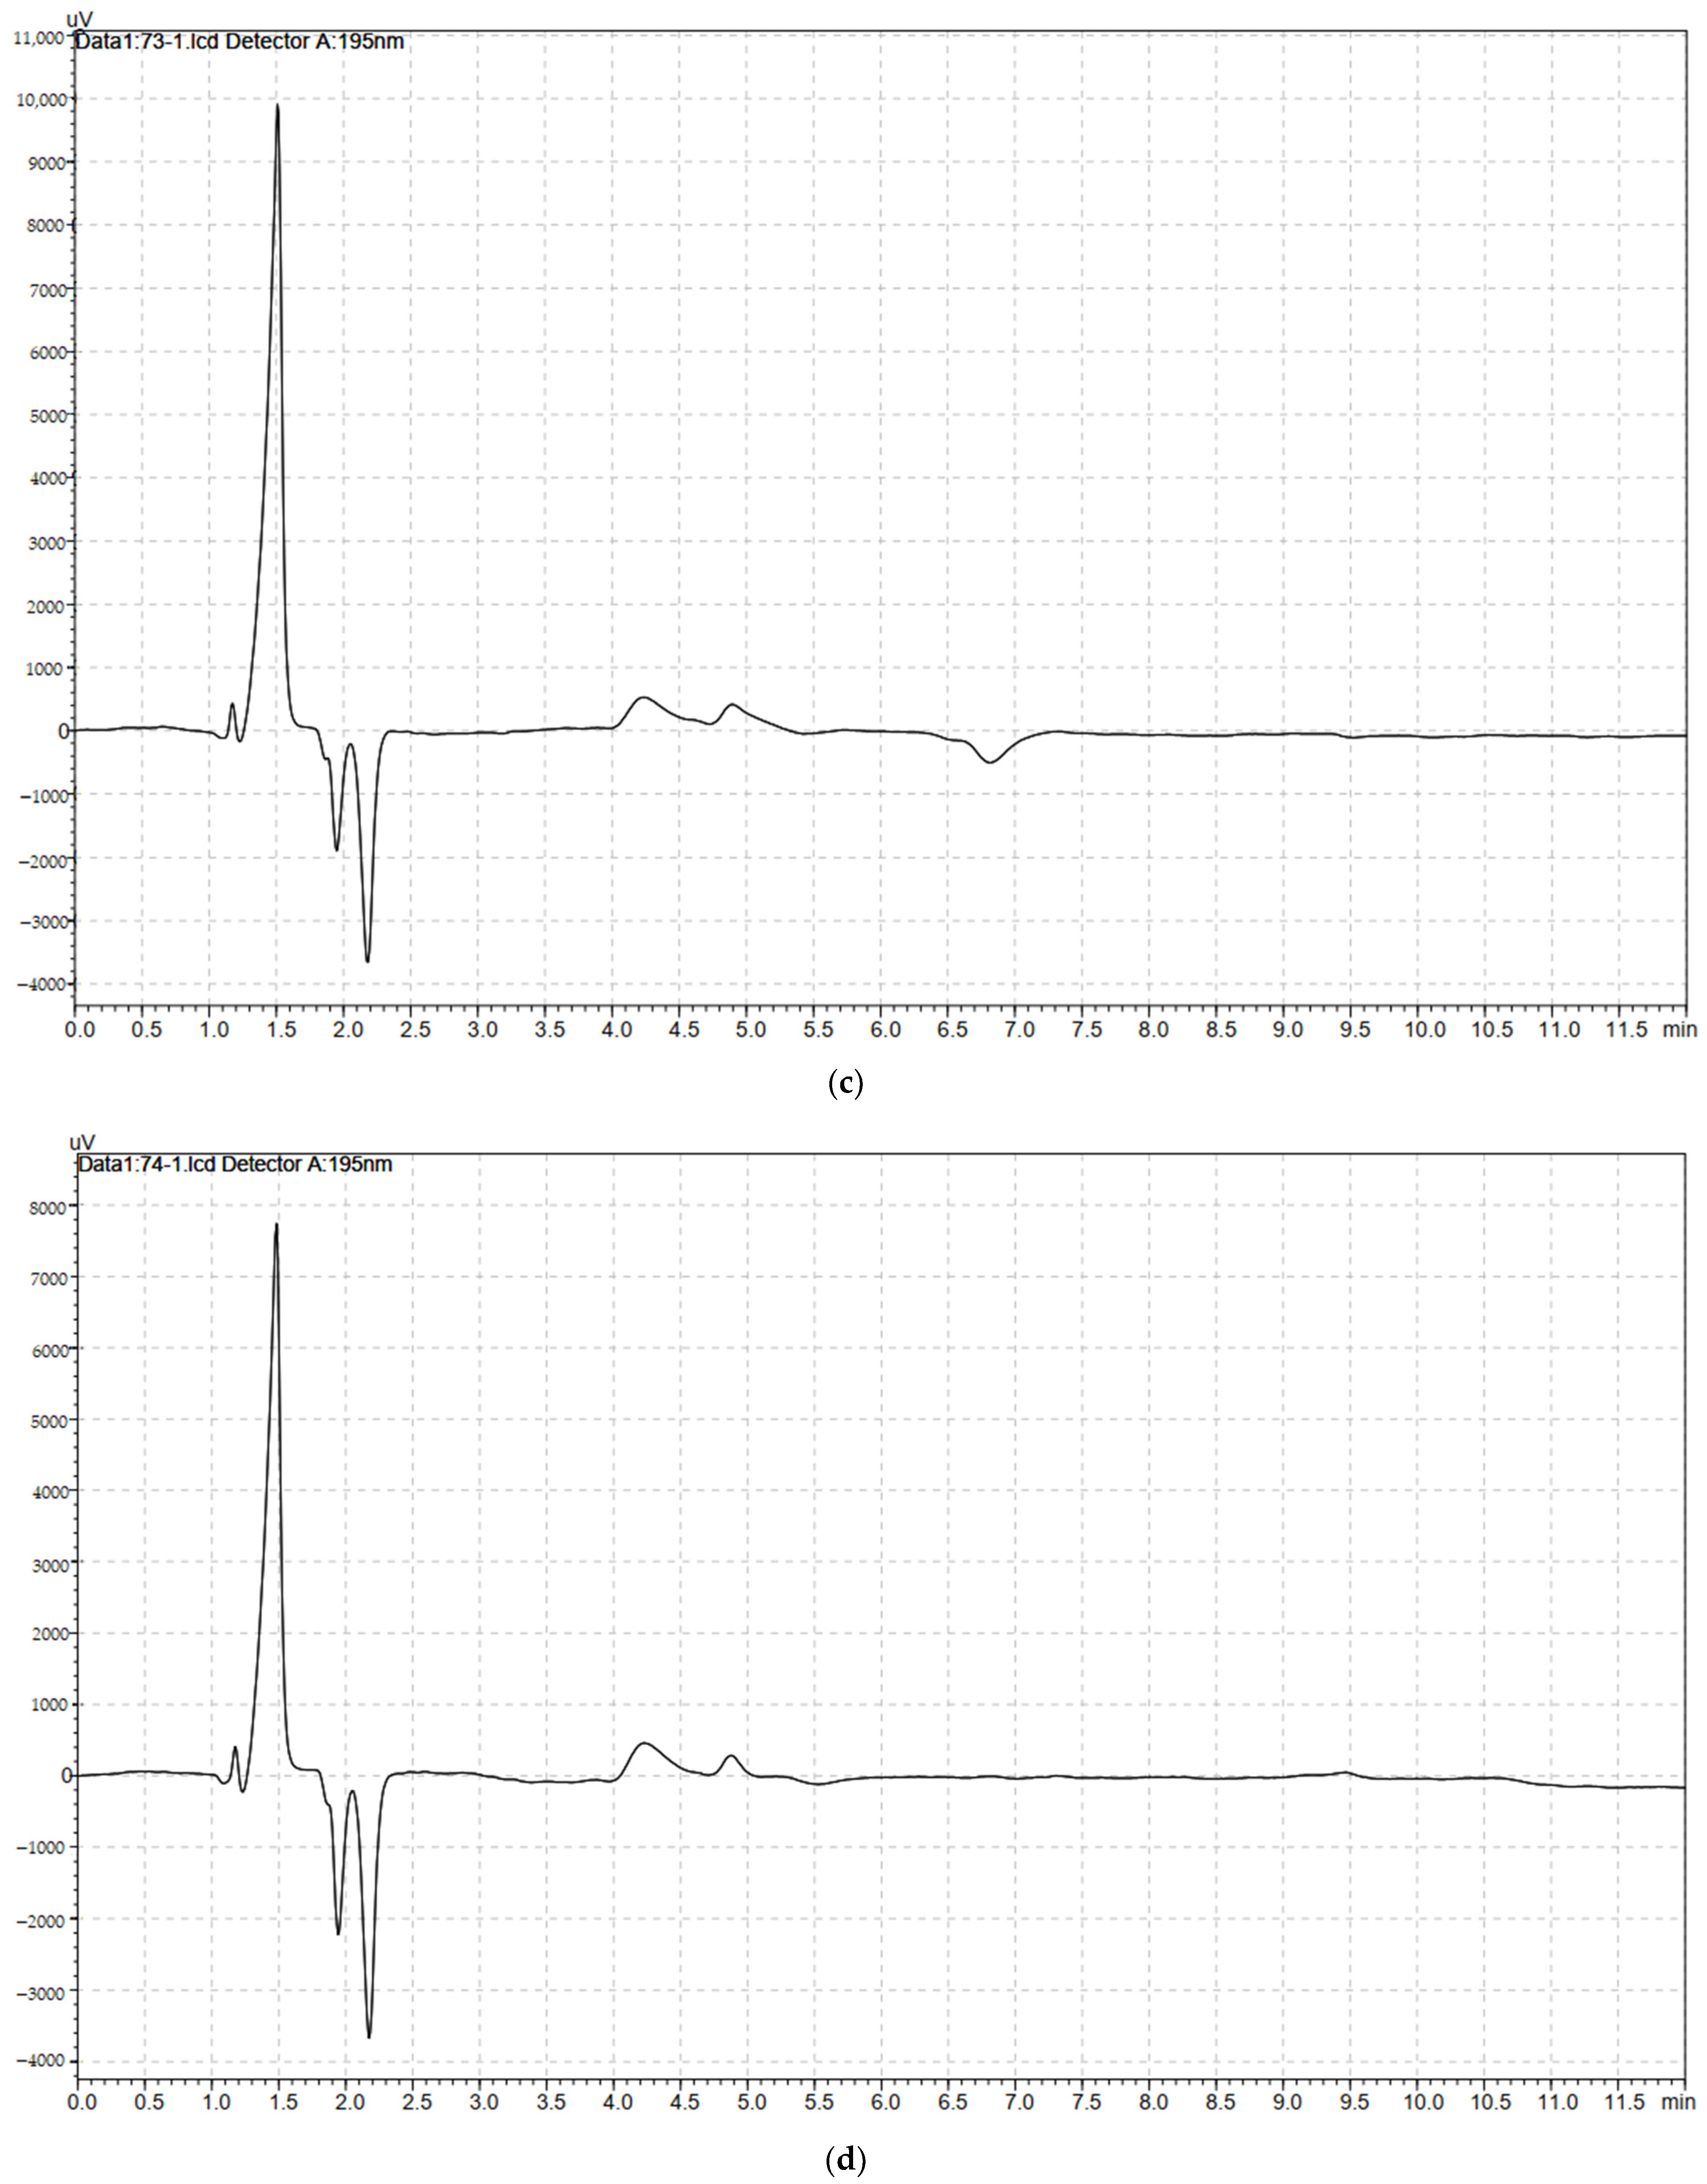
3.13. HPLC Nanocellulose Measurement

The nanocellulose samples prepared by the three methods were measured and compared with the Real Sample (RSNFC), shown in Figure 11a–d. They were found almost similar and at the same separation time.

4. Conclusions

Using three techniques: innovative method, acid, and alkaline hydrolysis carried out. GNFCs were produced from grass wastes via pretreatments using three treating mediums, NaClO, NaOH, and H2SO4, with optimum yield values of 95%, 90%, and 87%, respectively, at 25 °C, 20 min, and 5% concentration for each medium. The crystallinity index analyzed using the diffraction pattern and computed according to the Segal empirical method and the sum of the area under the crystalline adjusted peaks method. Both reaction temperature and time played an important role in the yielding and crystallinity index of GNFC. Reaction temperatures had a prominent effect on crystallinity index with optimum values of 40.705%, 70.489, 73.841, and 91.521 for sonicated RSNFC and sonicated GNFC treated with NaClO, NaOH, and H2SO4, respectively, at 80 °C, 20 min, and 5% concentration for each medium. Further augmentation of the GNFC surface charge occurred due to the ultrasonic homogenization. Both the morphological investigations of SEM and FT-IR resulted in untreated GNFC and treated GNFC with the three mediums found matched and in good consistence. The GNFCs were characterized for their size and surface by Zeta potential and HPLC. The isolated cellulose from the three treatment mediums compared with the standard sample (RSNFC) exhibited similar characteristics to those reported in the literature.

Funding

Taif University supported this work under grant number (TURSP-2020/266), of Taif University, Taif, Saudi Arabia.

Institutional Review Board Statement

The author confirms Institutional Review Board Statement.

Informed Consent Statement

The author confirms the Informed Consent Statement.

Data Availability Statement

The author confirms that the data of this study are available within the article.

Acknowledgments

The author acknowledged the Taif University Researchers Supporting Program for supporting this work under grant number (TURSP-2020/266), of Taif university, ksa.

Conflicts of Interest

The authors declare no conflict of interest.

Appendix A

Germany patant number 20 2022 100 310.

References

  1. Nazri, Z.; Roesyadi, A.; Sumarno, F.I. Effects of hydrolysis conditions on the crystallinity, chemical structure, morphology, and thermal stability of cellulose nanocrystals extracted from oil palm biomass residue. Int. J. Chem. Tech. Res. 2016, 9, 456–464. [Google Scholar]
  2. Blessy, J.; Sagarika, V.K.; Chinnu, S.; Nandakumar, K.; Sabu, T. Cellulose nanocomposites: Fabrication and biomedical applications. J. Bioresour. Bioprod. 2020, 5, 223–237. [Google Scholar]
  3. Zou, Y.; Zhao, J.; Jinyao Zhu, J.; Guo, X.; Peng Chen, P.; Duan, G.; Xianhu Liu, X.; Li, Y. A Mussel-Inspired Polydopamine-Filled Cellulose Aerogel for Solar-Enabled Water Remediation. ACS Appl. Mater. Interfaces 2021, 13, 7617–7624. [Google Scholar] [CrossRef]
  4. Xia, Z.; Li, J.; Zhang, J.; Zhang, X.; Zheng, X.; Zhang, J. Processing and valorization of cellulose, lignin and lignocellulose using ionic liquids. J. Bioresour. Bioprod. 2020, 5, 79–95. [Google Scholar] [CrossRef]
  5. Kusmono Listyanda, R.F.; Wildan, M.W.; Ilman, M.N. Preparation and characterization of cellulose nanocrystal extracted from ramie fibers by sulfuric acid hydrolysis. Heliyon 2020, 6, e05486. [Google Scholar] [CrossRef] [PubMed]
  6. Lu, Z.; Fan, L.; Zheng, H.; Lu, Q.; Liao, Y.; Huang, B. Preparation, characterization and optimization of nanocellulose whiskers by simultaneously ultrasonic wave and microwave assisted. Bioresour. Technol. 2013, 146, 82–88. [Google Scholar] [CrossRef] [PubMed]
  7. Syafri, E.; Sudirman Mashadi Yulianti, E.; Deswita Asrofic, M.; Abral, H.; Sapuane, S.M.; Ilyase, R.A.; Fudholig, A. Effect of sonication time on the thermal stability, moisture absorption, and biodegradation of water hyacinth (Eichhornia crassipes) nanocellulose-filled bengkuang (Pachyrhizus erosus) starch biocomposites. J. Mater. Res. Technol. 2019, 8, 6223–6231. [Google Scholar] [CrossRef]
  8. Chen, Y.W.; Tan, T.H.; Lee, H.V.; Abd Hamid, S.B. Easy fabrication of highly thermal-stable cellulose nanocrystals using Cr(No3)3 catalytic hydrolysis system: A feasibility study from macroto nano-dimensions. Materials 2017, 10, 42. [Google Scholar] [CrossRef]
  9. Sangeetha, V.H.; Varghese, T.O.; Nayak, S.K. Isolation and characterization of nanofibrillated cellulose from waste cotton: Effects on thermo -mechanical properties of polylactic acid/MA-g-SEBS blends. Iran. Polym. J. 2019, 28, 673–683. [Google Scholar] [CrossRef]
  10. Garvey, C.J.; Parker, I.H.; Simon, G.P. On the Interpretation of X-ray Diffraction Powder Patterns in Terms of the Nanostructure of Cellulose I Fibers. Macromol. Chem. Phys. 2005, 206, 1568–1575. [Google Scholar] [CrossRef]
  11. Ju, X.; Bowden, M.; Brown, E.E.; Zhang, X. An Improved X-ray Diffraction Method for Cellulose 1 Crystallinity Measurement; Elsevier: Amsterdam, The Netherlands, 2019; pp. 1–21. [Google Scholar]
  12. Yazdani, A.; Höhne, G.W.H.; Misture, S.T.; Graeve, O.A. A method to quantify crystallinity in amorphous metal alloys: A differential scanning calorimetry study. PLoS ONE 2020, 15, e0234774. [Google Scholar] [CrossRef] [PubMed]
  13. Agarwal, U.P.; Ralph, S.A.; Reiner, R.S.; Baez, C. Probing crystallinity of never-dried wood cellulose with Raman spectroscopy. Cellulose 2016, 23, 125–144. [Google Scholar] [CrossRef]
  14. Segal, L.; Creely, J.J.; Martin, A.E., Jr.; Conrad, C.M. An empirical method for estimating the degree of crystallinity of native cellulose using the X-ray Diffractometer. Text. Res. J. 1959, 29, 786–794. [Google Scholar] [CrossRef]
  15. Khukutapan, D.; Chiewchan, N.; Devahastin, S. Characterization of nanofibrillated cellulose produced by different methods from cabbage outer leaves. J. Food Sci. 2018, 83, 1660–1667. [Google Scholar] [CrossRef] [PubMed]
  16. Hu, Z.; Zhai, R.; Li, J.; Zhang, Y.; Lin, J. Preparation and characterization of nanofibrillated cellulose from bamboo fiber via ultrasonication assisted by repulsive effect. Int. J. Polym. Sci. 2017, 2017, 9850814. [Google Scholar] [CrossRef]
  17. Barbash, V.A.; Yaschenko, O.V.; Alushkin, S.V.; Kondratyuk, A.S.; Posudievsky, O.Y.; Koshechko, V.G. The effect of mechanochemical treatment of the cellulose on characteristics of nanocellulose films. Nanoscale Res. Lett. 2016, 11, 410. [Google Scholar] [CrossRef] [Green Version]
  18. Barbash, V.A.; Yaschenko, O.V.; Shniruk, O.M. Preparation and properties of nanocellulose from organosolv straw pulp. Nanoscale Res. Lett. 2017, 12, 241. [Google Scholar] [CrossRef] [Green Version]
  19. Thakur, V.; Guleria, A.; Kumar, S.; Sharmad, S.; Singh, K. Recent advances in nanocellulose processing, functionalization and applications: A review. Mater. Adv. 2021, 2, 1872–1895. [Google Scholar] [CrossRef]
  20. Sharma, A.; Thakur, M.; Bhattacharya, M.; Mandal, T.; Goswami, S. Commercial application of cellulose nano-composites—A review. Biotechnol. Rep. 2019, 21, e00316. [Google Scholar] [CrossRef]
  21. Mazela, B.; Perdoch, W.; Peplińska, B.; Zieliński, M. Influence of chemical pre-treatments and ultrasonication on the dimensions and appearance of cellulose fibers. Materials 2020, 13, 5274. [Google Scholar] [CrossRef]
  22. Zhang, B.; Huang, C.H.; Zhao, H.; Wang, J.; Yin, C.; Zhang, L.; Zhao, Y. Effects of cellulose nanocrystals and cellulose nanofibers on the structure and properties of polyhydroxybutyrate nanocomposites. Polymers 2019, 11, 2063. [Google Scholar] [CrossRef] [PubMed] [Green Version]
  23. Park, S.; Baker, J.O.; Himmel, M.E.; Parilla, P.A.; Johnson, D.K. Cellulose crystallinity index: Measurement techniques and their impact on interpreting cellulose performance. Biotechnol. Biofuels 2010, 3, 10. [Google Scholar] [CrossRef] [PubMed] [Green Version]
  24. Szymańska-Chargot, M.; Cieśla, J.; Chylińska, M.; Gdula, K.; Pieczywek, P.M.; Kozioł, A.; Cieślak, K.J.; Zdunek, A. Effect of ultrasonication on physicochemical properties of apple based nanocellulose-calcium carbonate composites. Cellulose 2018, 25, 4603–4621. [Google Scholar] [CrossRef] [Green Version]
  25. Trache, D.; Tarchoun, A.F.; Derradji, M.; Hamidon, T.S.; Masruchin, N.; Brosse, N.; Hussin, M.H. Nanocellulose: From fundamentals to advanced applications. Front. Chem. 2020, 8, 392. [Google Scholar] [CrossRef] [PubMed]
  26. Thomas, S.K.; Begum, P.M.S.; Dominic, C.D.M.; Salim, N.V.; Hameed, N.; Rangappa, S.M.; Siengchin, S.; Parameswaranpillai, J. Isolation and characterization of cellulose nanowhiskers from Acacia caesia plant. J. Appl. Polym. Sci. 2021, 138, e50213. [Google Scholar] [CrossRef]
  27. Barbash, V.A.; Yashchenko, O.V.; Vasylieva, O.A. Preparation and properties of nanocellulose from Miscanthus × giganteus. J. Nanomater. 2019, 2019, 3241968. [Google Scholar] [CrossRef] [Green Version]
  28. Yahya, M.; Chen, Y.W.; Lee, H.V.; Hock, C.C.; Wan, H.W.H. A new protocol for efficient and high yield preparation of nanocellulose from Elaeis guineensis biomass: A response surface methodology (rsm) study. J. Polym. Environ. 2019, 27, 678–702. [Google Scholar] [CrossRef]
  29. Duan, L.; Yu, W. Review of recent research in nano cellulose preparation and application from jute fibers. In Proceedings of the 3rd International Conference on Materials Engineering, Manufacturing Technology and Control (ICMEMTC 2016), Taiyuan, China, 27–28 February 2016; pp. 1–7. [Google Scholar]
  30. Ma, N.; Liu, D.; Liu, Y.; Sui, G. Extraction and characterization of nanocellulose from xanthoceras sorbifolia husks. Int. J. Nanosci. Nanoeng. 2015, 2, 43–50. [Google Scholar]
  31. Shahnaz, T.; Priyan, T.V.V.; Pandian, S.; Narayanasamy, S. Use of Nanocellulose extracted from grass for adsorption abatement of Ciprofloxacin and Diclofenac removal with phyto, and fish toxicity Studies. Environ. Pollut. 2021, 268, 115494. [Google Scholar] [CrossRef]
  32. Mostafa, N.A.; Farag, A.A.; Abodief, H.M.; Tayeb, A.M. Production of biodegradable plastic from agricultural wastes. Arab. J. Chem. 2018, 11, 546–553. [Google Scholar] [CrossRef] [Green Version]
  33. Le Normand, M.; Moriana, R.; Ek, M. Isolation and characterization of cellulose nanocrystals from spruce bark in a biorefinery perspective. Carbohydr. Polym. 2014, 111, 979–987. [Google Scholar] [CrossRef] [PubMed]
  34. Du, H.; Liu, W.; Zhang, M.; Si, C.; Zhang, X.; Li, B. Cellulose anocrystals and cellulose nanofibrils based hydrogels for biomedical applications. Carbohydr. Polym. 2019, 209, 130–144. [Google Scholar] [CrossRef] [PubMed]
  35. Ling, Z.; Wang, T.; Makarem, M.; Cintrón, M.S.; Cheng, H.N.; Kang, X.; Bacher, M.; Potthast, A.; Rosenau, T.; King, H.; et al. Effects of ball milling on the structure of cotton cellulose. Cellulose 2019, 26, 305–328. [Google Scholar] [CrossRef]
  36. Peñaloza, E.M.C.; Casanova, L.M.; Leal, I.C.R.; Paula de Aguiarc, P.F.; Costa, S.S. Metabolite fingerprinting and profiling of the medicinal grass Eleusine indica based on HPLC-DAD, UPLC-DAD-MS/MS and NMR analyses. J. Braz. Chem. Soc. 2018, 29, 2522–2534. [Google Scholar] [CrossRef]
  37. Moradeeya, P.G.; Kumar, M.A.; Thorat, R.B.; Rathod, M.; Khambhaty, Y.; Basha, S. Nanocellulose for biosorption of chlorpyrifos from water: Chemometric optimization, kinetics and equilibrium. Cellulose 2017, 24, 1319–1332. [Google Scholar] [CrossRef]
  38. Lunardi, C.N.; Gomes, A.J.; Rocha, F.S.; Tommaso, J.D.; Gregory, S. Patience, Experimental methods in chemical engineering: Zeta Potential. Can. J. Chem. Eng. 2021, 99, 627–639. [Google Scholar] [CrossRef]
  39. Li, Y.; Zhu, H.; Xu, M.; Zhuang, Z.; Xu, M.; Dai, H. High yield preparation method of thermally stable cellulose Nanofibers. BioResources 2014, 9, 1986–1997. [Google Scholar] [CrossRef]
  40. Winarsih, S. The Effect of NaOH Concentration and Microwave Exposure Time to the Content of Cellulose, Hemicellulose and Lignin of Corn Cob, Research Article. 2018. Available online: Ejournal.umm.ac.id/index.php/fths/about (accessed on 22 November 2021).
  41. Rambabu, N.; PAnthapulakkal, S.; Sain, M.; Dalai, A.K. Production of nanocellulose fibers from pinecone biomass: Evaluation and optimization of chemical and mechanical treatment conditions on mechanical properties of nanocellulose films. Ind. Crops Prod. 2016, 83, 746–754. [Google Scholar] [CrossRef]
  42. Denoyelle, T. Mechanical Properties of Materials Made of Nano-Cellulose; KTH Engineering Sciences: Stockholm, Sweden, 2011; pp. 1–74. [Google Scholar]
  43. Owonubi, S.J.; Agwuncha, S.C.; Malima, N.M.; Shombe, G.B.; Makhatha, E.M.; Revaprasadu, N. Non-woody biomass as sources of nanocellulose particles: A review of extraction procedures. Front. Energy Res. 2021, 9, 608825. Available online: www.frontiersin.org (accessed on 22 November 2021). [CrossRef]
  44. Kandhola, G.; Djioleu, A.; Rajan, K.; Labbé, N.; Sakon, J.; Julie Carrier, D.J.; Kim, J.W. Maximizing production of cellulose nanocrystals and nanofibers from pre-extracted loblolly pine kraft pulp: A response surface approach. Bioresour. Bioprocess. 2020, 7, 1–16. [Google Scholar] [CrossRef]
  45. Benini, K.C.C.; Voorwalda, H.J.C.; Cioffia, M.O.H.; Rezendeb, M.C.; Arantesc, V. Preparation of nanocellulose from Imperata brasiliensis grass using Taguchi Method. Carbohydr. Polym. 2018, 192, 337–346. [Google Scholar] [CrossRef] [PubMed]
  46. Zhao, J.; Zhang, W.; Zhang, X.; Zhang, X.; Lu, C.; Deng, Y. Extraction of cellulose nanofibrils from dry softwood pulp using high shear homogenization. Carbohydr. Polym. 2013, 97, 695–702. [Google Scholar] [CrossRef] [PubMed]
  47. Maia, G.S.; Andrade, J.R.; Silva, M.G.C.; Vieira, M.G.A. Adsorption of diclofenac sodium onto commercial organoclay: Kinetic, equilibrium and thermodynamic study. Powder Technol. 2019, 345, 140–150. [Google Scholar] [CrossRef]
  48. Alemdar, A.; Sain, M. Isolation and characterization of nanofibers from agricultural residues—Wheat straw and soy hulls. Bioresour. Technol. 2008, 99, 1664–1671. [Google Scholar] [CrossRef]
  49. French, A.D. Idealized powder diffraction patterns for cellulose polymorphs. Cellulose 2014, 21, 885–896. [Google Scholar] [CrossRef]
  50. Cherian, M.; Pothan, L.A.; Nguyen-Chung, T.; Mennig, G.; Kottaisamy, M.; Thomas, S. A novel method for the synthesis of cellulose nanofibril whiskers from banana fibers and characterization. J. Agric. Food Chem. 2008, 56, 5615627. [Google Scholar] [CrossRef]
  51. Sánchez, R.; Espinosaa, E.; Domínguez-Roblesa, J.; Mauricio Loaiza, J.; Rodrígueza, A. Isolation and characterization of lignocellulose nanofibers from different wheat straw pulps. Int. J. Biol. Macromol. 2016, 92, 1025–1033. [Google Scholar] [CrossRef]
  52. Chen, Y.; Wu, Q.; Huang, B.; Huang, M.; Ai, X. Isolation and characteristics of cellulose and nanocellulose from lotus leaf stalk agro-wastes. BioResources 2014, 10, 684–696. [Google Scholar] [CrossRef] [Green Version]
  53. Bodin, A.; Backdah, H.; Risberg, B.; Gatenholm, P. Nano cellulose as a scaold for tissue engineered blood vessels. Tissue Eng. 2007, 13, 885. [Google Scholar]
  54. Cherian, B.M.; Leão, A.L.; De Souza, S.F.; Thomas, S.; Pothan, L.A.; Kottaisamy, M. Isolation of nanocellulose from pineapple leaf fibers by steam explosion. Carbohydr. Polym. 2010, 81, 720–725. [Google Scholar] [CrossRef]
  55. Liu, Z.; Li, X.; Xie, W.; Deng, H. Extraction, isolation and characterization of nanocrystalline cellulose from industrial kelp (Laminaria japonica) waste. Carbohydr. Polym. 2017, 173, 353–359. [Google Scholar] [CrossRef] [PubMed]
  56. Flauzino, N.W.; Pasquini DSilvério, H.A.; Dantas, N.O. Extraction and characterization of cellulose nanocrystals from agro-industrial residue—Soy hulls. Ind. Crops Prod. 2013, 42, 480–488. [Google Scholar] [CrossRef]
  57. Brito, B.L.; Pereira, F.V.; Putaux, J.L.; Jean, B. Preparation, morphology and Structure of cellulose nanocrystals from bamboo fibers. Cellulose 2012, 19, 1527–1536. [Google Scholar] [CrossRef]
  58. Ilyas, R.; Sapuan, S.; Ishak, M. Isolation and characterization of nanocrystalline cellulose from sugar palm fibers (Arenga pinnata). Carbohydr. Polym. 2018, 181, 1038–1051. [Google Scholar] [CrossRef]
  59. Kagarzadeh, H.; Ahmad, I.; Abdullah, I.; Dufrense, A.; Zainuddin, S.; Sheltami, R. Effects of hydrolysis condition on the morphology, crystalinity and thermal stability of cellulose nanocrystals extracted from kenal bast fibers. Cellulose 2012, 19, 855–866. [Google Scholar] [CrossRef]
  60. Lu, P.; Hsieh, Y. Preparation and characterization of cellulose nanocrystals from rice straw. Carbohydr. Polym. 2012, 87, 564–573. [Google Scholar] [CrossRef] [PubMed]
  61. Saïd Azizi Samir, M.A.; Alloin, F.; Paillet, M.; Dufresne, A. Tangling effect in fibrillated cellulose reinforced nanocomposites. Macromolecules 2004, 37, 4313–4316. [Google Scholar] [CrossRef]
  62. Kian, L.K.; Jawaid, M.; Arif, H.; Karim, Z. Isolation and characterization of nanocrystalline cellulose from roselle-derived microcrystalline cellulose. Int. J. Biol. Macromol. 2018, 114, 54–63. [Google Scholar] [CrossRef]
  63. Al-Dulaimi, A.A.; Wanrosli, W.D. Isolation and characterization of nanocrystalline cellulose from totally chlorine free oil palm empty fruit bunch pulp. J. Polym. Environ. 2017, 25, 192–202. [Google Scholar] [CrossRef]
  64. Johar, N.; Ahmad, I.; Dufresne, A. Extraction, preparation and characterization of cellulose fibers and nanocrystals from rice husk. Ind. Crops Prod. 2012, 37, 93–99. [Google Scholar] [CrossRef]
  65. Nacos, M.; Katapodis, P.; Parppas, C.; Daferera, D.; Tarantilis, P.A.; Christakopoulos, P. Kenaf xylan-A source of biologically active acidic oligosaccharides. Carbohydr. Polym. 2006, 66, 126–134. [Google Scholar] [CrossRef]
  66. Corrêa, A.C.; de Morais Teixeira, E.; Pessan, L.A.; Mattoso, L.H.C. Cellulose nanofibers from curaua fibers. Cellulose 2010, 17, 1183–1192. [Google Scholar] [CrossRef]
  67. Li, R.; Fei, J.; Cai, Y.; Li, Y.; Feng, J.; Yao, J. Cellulose whiskers extracted from mulberry: A novel biomass production. Carbohydr. Polym. 2009, 76, 94–99. [Google Scholar] [CrossRef]
  68. Radakisnin, R.; Abdul Majid, M.S.; Jamir, M.R.M.; Jawaid, M.; Sultan, M.T.H.; Tahir, M.F.M. Structural, Morphological and thermal properties of cellulose nanofibers from Napier fiber (Pennisetum purpureum). Materials 2020, 13, 4125. [Google Scholar] [CrossRef]
  69. Chieng, B.W.; Lee, S.H.; Ibrahim, N.A.; Then, Y.Y.; Loo, Y.Y. Isolation and characterization of cellulose nanocrystals from oil palm mesocarp fiber. Polymers 2017, 9, 355. [Google Scholar] [CrossRef]
  70. Leite, A.L.M.P.; Zanon, C.D.; Menegalli, F.C. Isolation and characterization of cellulose nanofibers from cassava root bagasse and peelings. Carbohydr. Polym. 2017, 157, 962–970. [Google Scholar] [CrossRef]
  71. Muhamad, M.; Hornsby, P.; Carmichael, E.; Zakaria, M.; Seok, Y.B.; Mohamed, S.; Sharma, S. Characterisation of cellulose nanofibres derived from chemical and mechanical treatments. MATECWeb Conf. 2019, 253, 01002. [Google Scholar] [CrossRef] [Green Version]
  72. Mahardika, M.; Abral, H.; Kasim, A.; Arief, S.; Asrofi, M. Production of nanocellulose from pineapple leaf fibers via high-shear homogenization and ultrasonication. Fibers 2018, 6, 28. [Google Scholar] [CrossRef] [Green Version]
  73. Teodoro, K.B.R.; Teixeir, E.D.M.; Corrêa, A.C.; Campos, A.; De Marconcini, J.M.; Mattoso, L.H.C. Whiskers de fibra de sisal obtidos sob diferentes condições de hidrólise ácida: Efeito do tempo e da temperatura de extração. Polímeros 2011, 21, 280–285. [Google Scholar] [CrossRef] [Green Version]
  74. Zhou, Y.M.; Fu, S.Y.; Zheng, L.M.; Zhan, H.Y. Effect of nanocellulose isolation techniques on the formation of reinforced poly (vinyl alcohol) nanocomposite films. Express Polym. Lett. 2012, 6, 794–804. [Google Scholar] [CrossRef]
  75. Bondeson, D.; Mathew, A.; Oksman, K. Optimization of the isolation of nanocrystal from microcrystalline cellulose by acid hydrolysis. Cellulose 2006, 13, 171–180. [Google Scholar] [CrossRef]
  76. Roman, M.; Winter, W.T. Effect of sulphated groups from sulphuric acid hydrolysis on the thermal degradation behavior of bacterial cellulose. Biomacromolecules 2004, 5, 1048–1054. [Google Scholar] [CrossRef] [PubMed]
  77. Araki, J.; Wada, M.; Kuga, S.; Okano, T. Low properties of microcrystalline cellulose suspension prepared by acid treatment of native cellulose. Colloid Surf. A 1998, 142, 75–82. [Google Scholar] [CrossRef]
  78. Angellier, H.; Putaux, J.L.; Molina-Boisseau, S.; Dupeyre, D.; Dufresne, A. Starch nanocrystal fillers in a acrylic polymer matrix. Macromol. Symp. 2005, 221, 95–104. [Google Scholar] [CrossRef]
  79. Muryani, B.Y.; Sarifah, N.; Kusumawardani, D.R.; Nurosyid, F. Effect concentration of dye solution binahong leaves to the efficiency of dye-sensitized solar cell (DSSC). In Proceedings of the International Conference on Science and Applied Science (ICSAS), Surakarta, Indonesia, 20 July 2019; pp. 020122-1–020122-4. [Google Scholar]
  80. Alanazi, A.K. Effect of ZnO nanomaterial and red and green cabbage dyes on the performance of dye-sensitised solar cells. Coatings 2021, 11, 1057. [Google Scholar] [CrossRef]
Figure 1. Preparation of cellulose from grass by sodium hypochlorite. (a) Type of grass, (b) mechanical cutting with NaClO, (c) after treatment, (d) after dying, and (e) after treatment by ultrasound waves.
Polymers 14 01930 g001
Figure 2. Effect of reaction time and NaClO concentration on the yield % at different test temperatures.
Polymers 14 01930 g002aPolymers 14 01930 g002b
Figure 3. Effect of test temperatures and reaction times on the yield % of GNFC/5% NaClO, GNFC/5% NaOH, and GNFC/5% H2SO4.
Polymers 14 01930 g003
Figure 4. X-ray diffractions of cellulose fiber and nanocellulose after treatment by ultrasonic waves.
Polymers 14 01930 g004
Figure 5. Effect of test temperature on the crystallinity of RSNFC, GNFC/5%NaClO, GNFC/5%NaOH, and GNFC/5%H2SO4 using both method A and method B.
Polymers 14 01930 g005
Figure 6. Effect of reaction time on the crystallinity of RSNFC, GNFC/5%NaClO, GNFC/5%NaOH, and GNFC/5%H2SO4 using both method A and method B.
Polymers 14 01930 g006
Figure 7. FTIR spectra of GNFC/5%NaClO, GNFC/5%NaOH and GNFC/5%H2SO4.
Polymers 14 01930 g007
Figure 8. SEM of RSNFC; (a,b) acid hydrolysis before and after treatment by ultrasonic waves, (c,d) alkali hydrolysis before and after treatment by ultrasonic waves, and (e,f) for sodium hypochlorite before and after treatment by ultrasonic waves.
Polymers 14 01930 g008aPolymers 14 01930 g008b
Figure 9. %Volume/size distribution of sonicated (a) GNFC/NaClO, (b) GNFC/NaOH, and (c) GNFC/H2SO4 using the particle size analysis (PSA).
Polymers 14 01930 g009aPolymers 14 01930 g009b
Figure 10. Surface Zeta potential of nanocellulose GNFC/H2SO4, GNFC/NaClO, and GNFC/NaOH hydrolysis. (a) Surface Zeta potential of nanocellulose GNFC/H2SO4 hydrolysis. (b) Surface Zeta potential of GNFC/NaClO hydrolysis. (c) Surface Zeta potential of GNFC/NaOH hydrolysis.
Polymers 14 01930 g010aPolymers 14 01930 g010b
Figure 11. HPLC (a) standard nanocellulose (RSNFC), (b) nanocellulose GNFC/H2SO4, (c) GNFC/NaClO, and (d) GNFC/NaOH hydrolysis.
Polymers 14 01930 g011aPolymers 14 01930 g011b
Table 1. Variation of IC for RSCNFC (Real Sample Commercial Nanofiber Cellulose), GNFC/NaClO, GNFC/NaOH, and GNFC/H2SO4 with test temperature using both method A and method B.
Temp. °CMethod (A)Method (B)
IC%
RSNFC
IC%
(GNFC/NaClO)
IC%
(GNFC/NaOH)
IC%
(GNFC/H2SO4)
IC%
RSNFC
IC%
(GNFC/NaClO)
IC%
(GNFC/NaOH)
IC%
(GNFC/H2SO4)
2023.20531.85342.09562.08319.72427.39435.78154.122
2524.6934.9343.1664.1720.98730.03936.68655.828
4027.05640.09545.07476.47722.99834.48238.31366.535
6031.30347.0454.68985.89926.60840.54446.48674.732
8040.70570.48973.84191.52134.55960.62162.76579.623
Table 2. Variation of IC for RSCNFC (Real Sample Commercial Nanofiber Cellulose), GNFC/NaClO, GNFC/NaOH, and GNFC/H2SO4 with reaction time using both method A and method B.
TimeminMethod (A)Method (B)
IC%
RSNFC
IC%
(GNFC/NaClO)
IC%
(GNFC/NaOH)
IC%
(GNFC/H2SO4)
IC%
RSNFC
IC%
(GNFC/NaClO)
IC%
(GNFC/NaOH)
IC%
(GNFC/H2SO4)
1021.40131.85336.2260.22117.76326.75730.06351.188
2022.6932.9341.1662.24518.83327.66134.16352.908
4023.74538.3343.67574.18319.70832.19736.25063.056
6028.49445.58451.67883.32223.65038.29142.89370.824
8039.70167.19469.66188.77532.95256.44357.81975.459
Publisher’s Note: MDPI stays neutral with regard to jurisdictional claims in published maps and institutional affiliations.

