
Gelatin Methacryloyl Hydrogels for the Localized Delivery of Cefazolin

 , ,
, ,  , and
, and
Abstract
: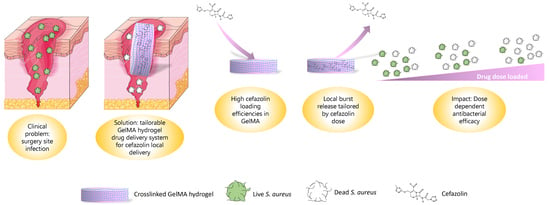
1. Introduction
2. Material and Methods
2.1. Drug Encapsulation and GelMA Crosslinking
2.2. Release Study
2.2.1. Drug Detection
2.2.2. Encapsulation Efficiency
2.2.3. Degradation Characterization
2.2.4. Release via Degradation
2.2.5. Equilibrium Mass Swelling Ratio and Mesh Size Calculation
Equilibrium Mass Swelling Ratio
2.2.6. Mesh Size Calculation
2.3. Mechanical and Physical Properties
2.3.1. Effective Mass Swelling
2.3.2. Mechanical Compression Test
2.3.3. Photorheology
2.4. Bacterial Culture
2.4.1. Maintenance
2.4.2. Zone of Inhibition Assay
2.4.3. Broth Inhibition Assay
2.5. Statistical Analysis
3. Results and Discussion
3.1. Drug Release
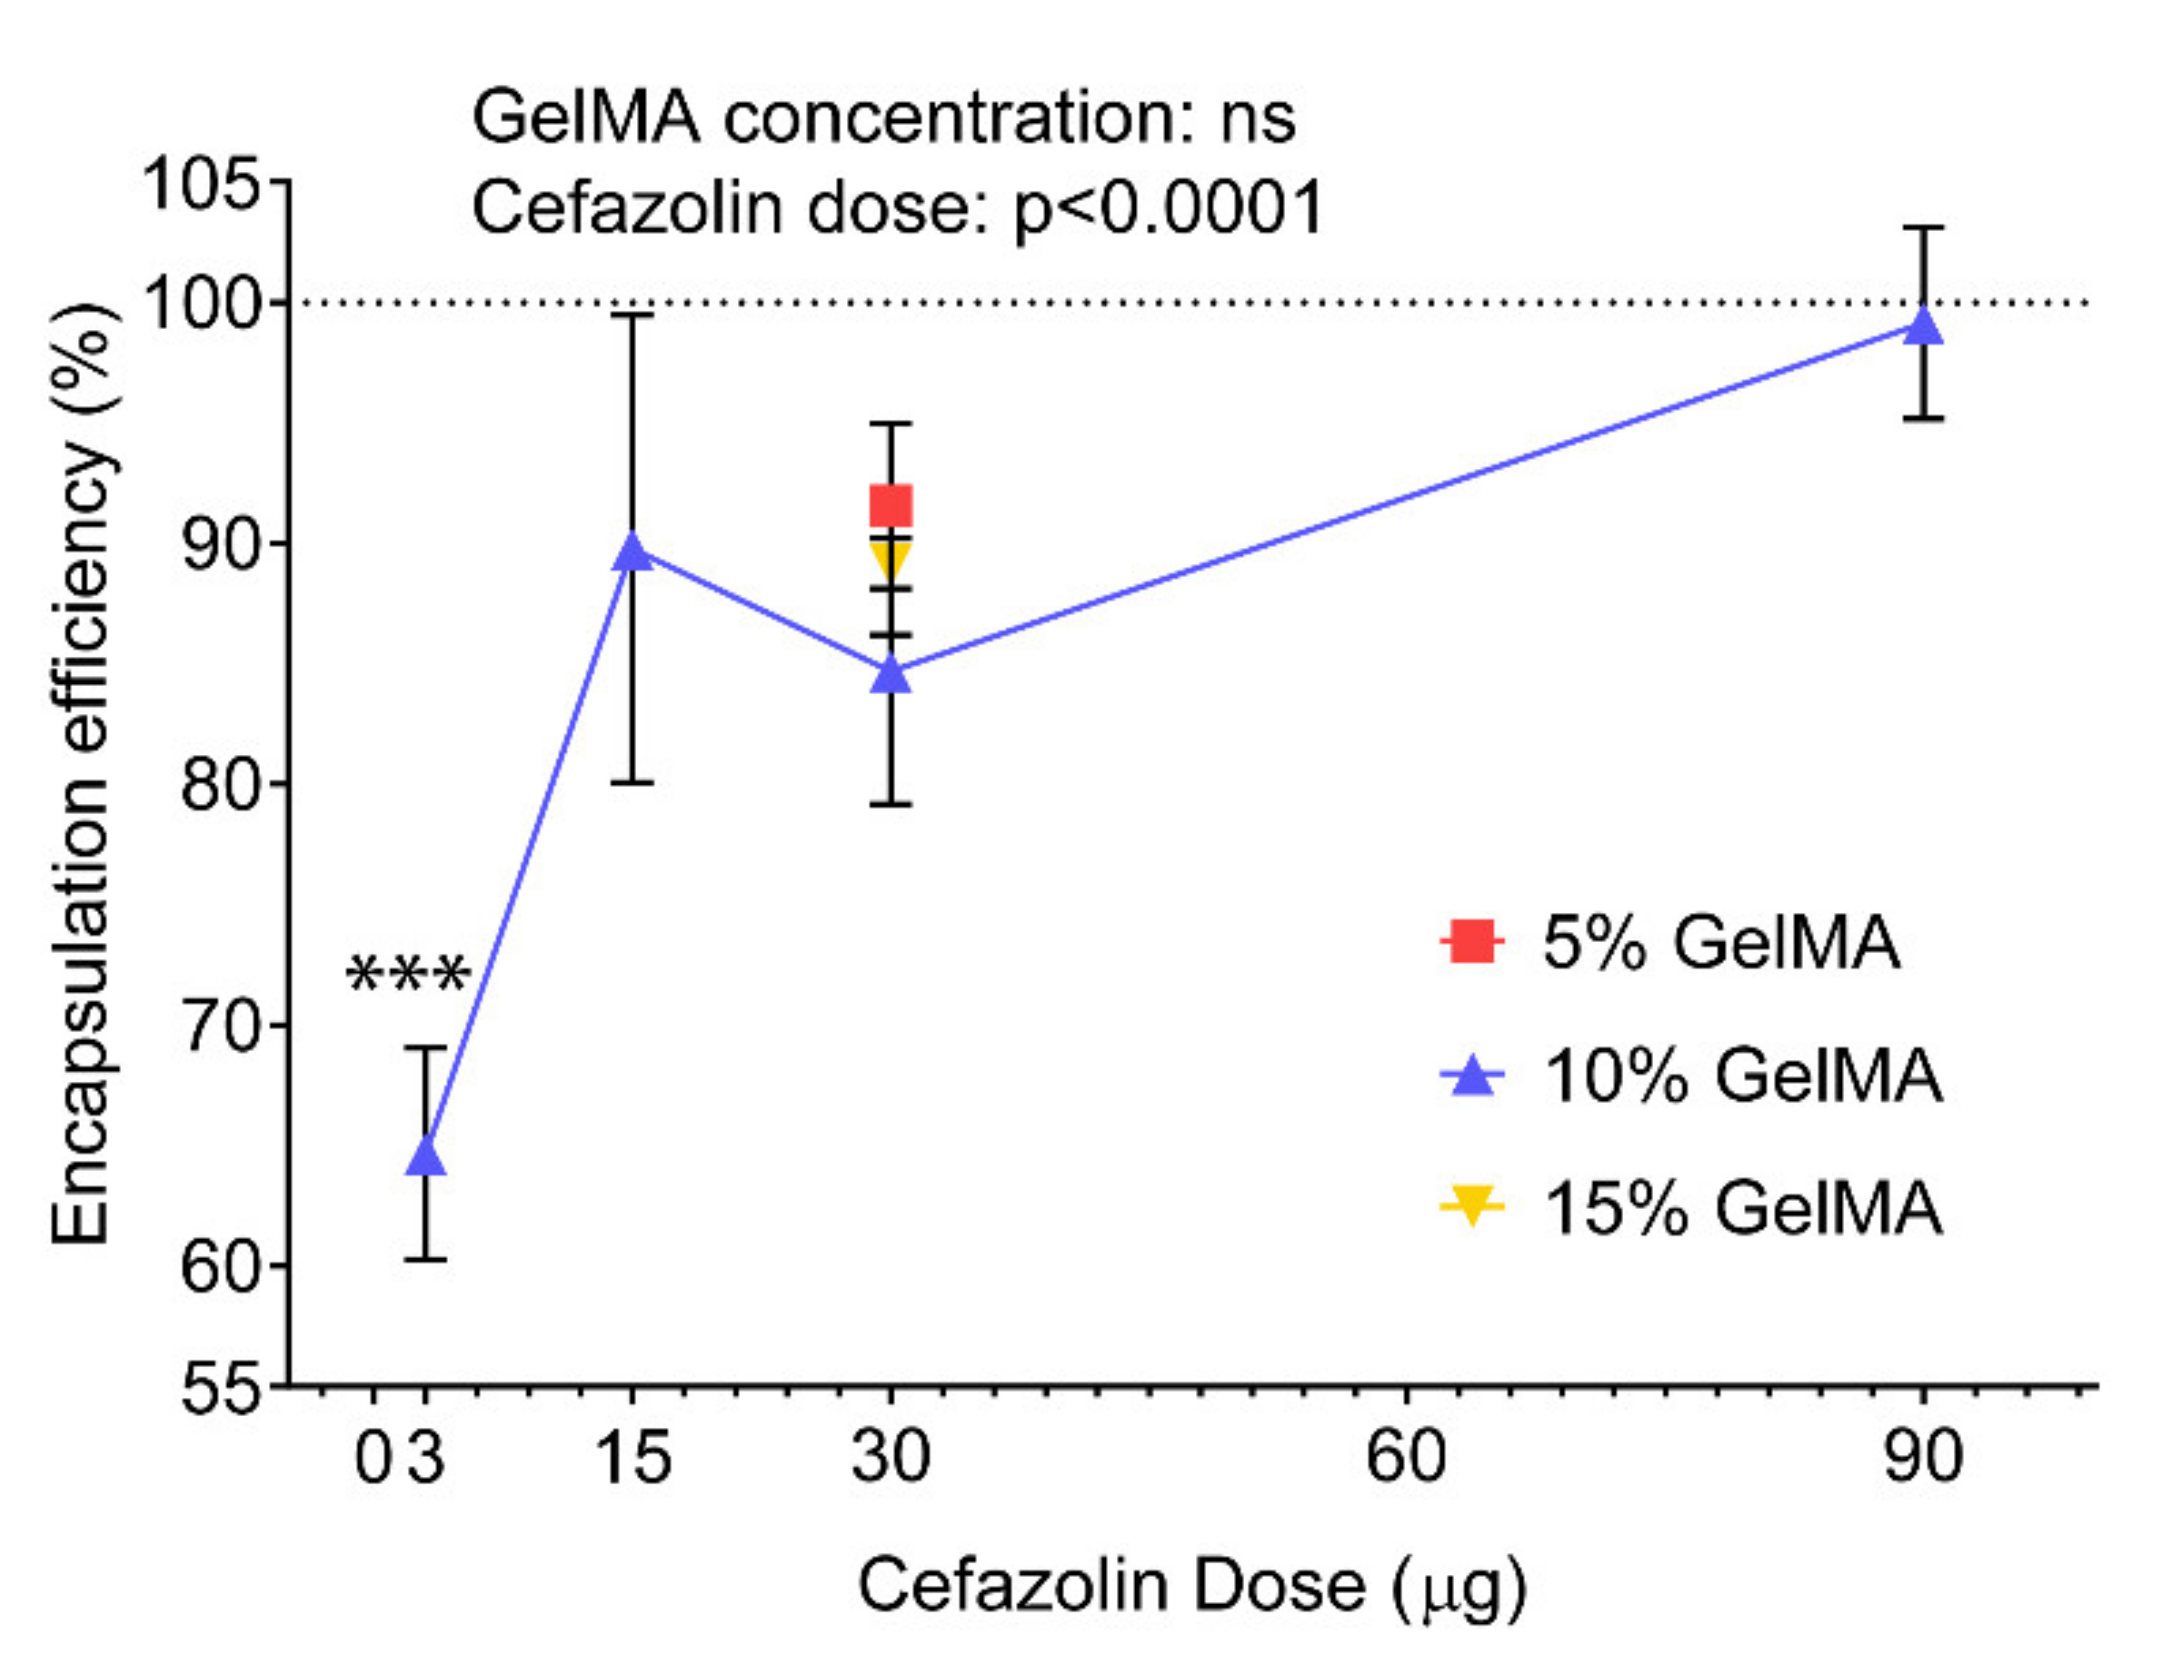
3.1.1. Encapsulation Efficiency
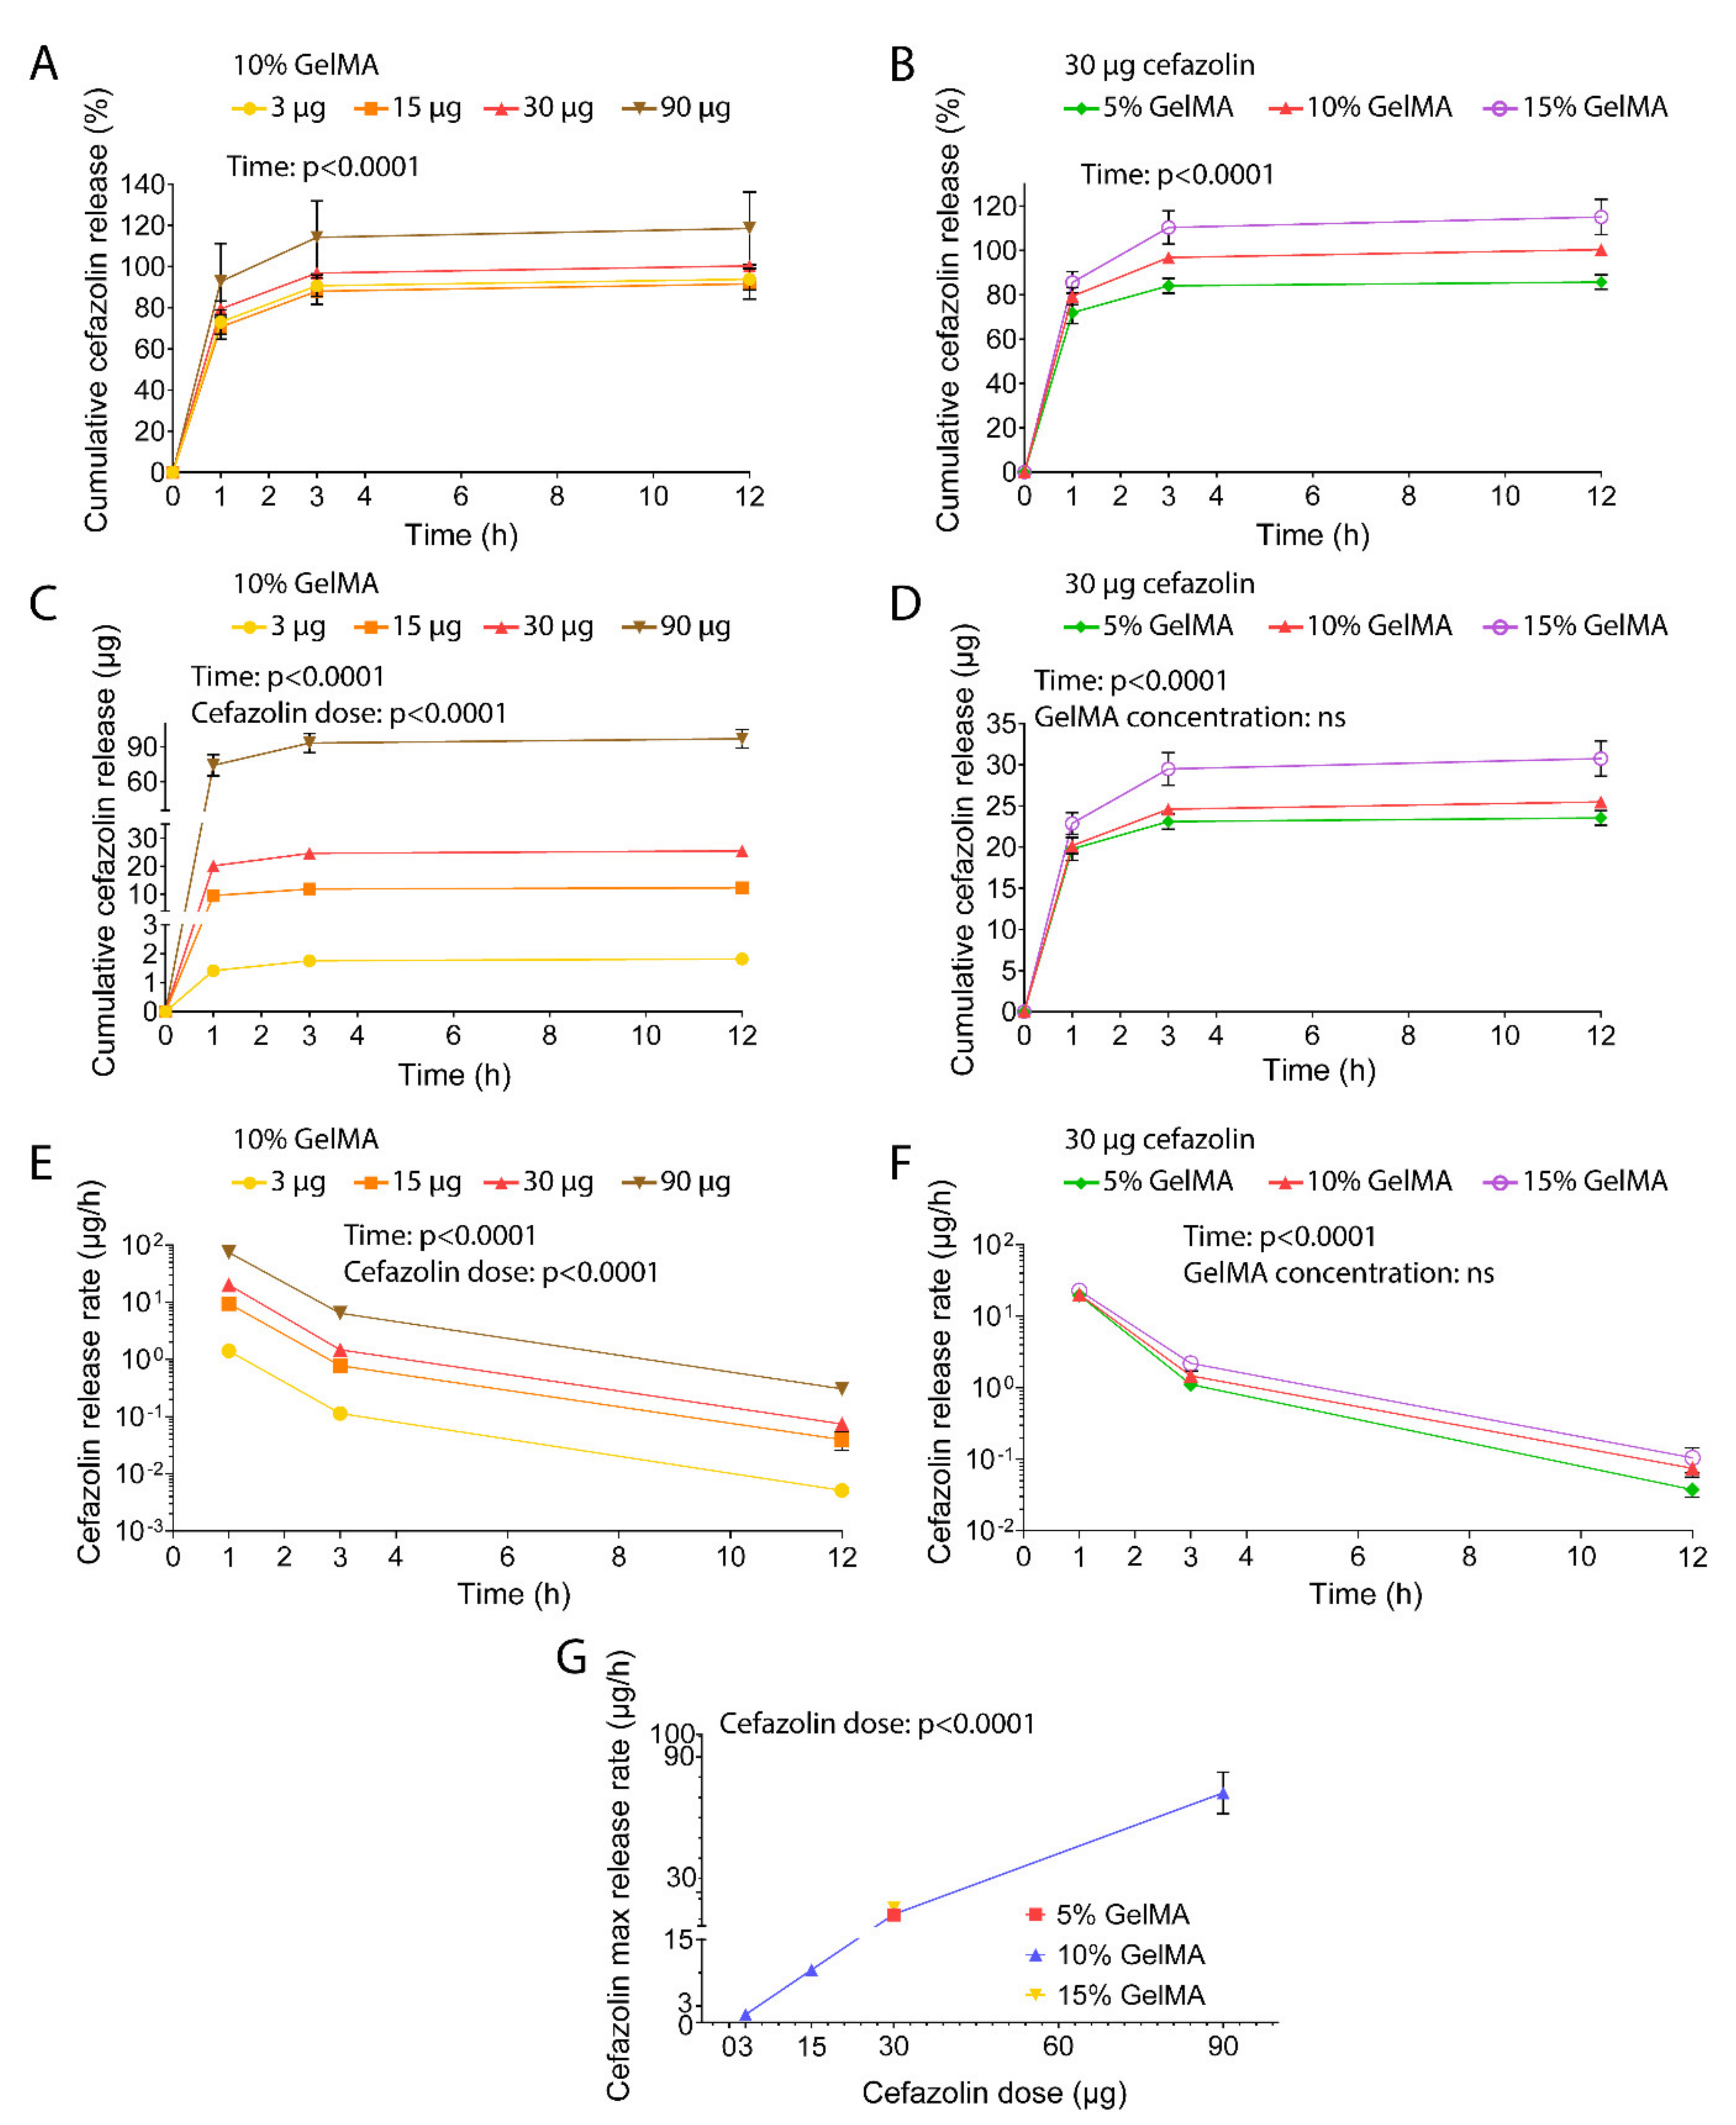
3.1.2. Diffusive Release
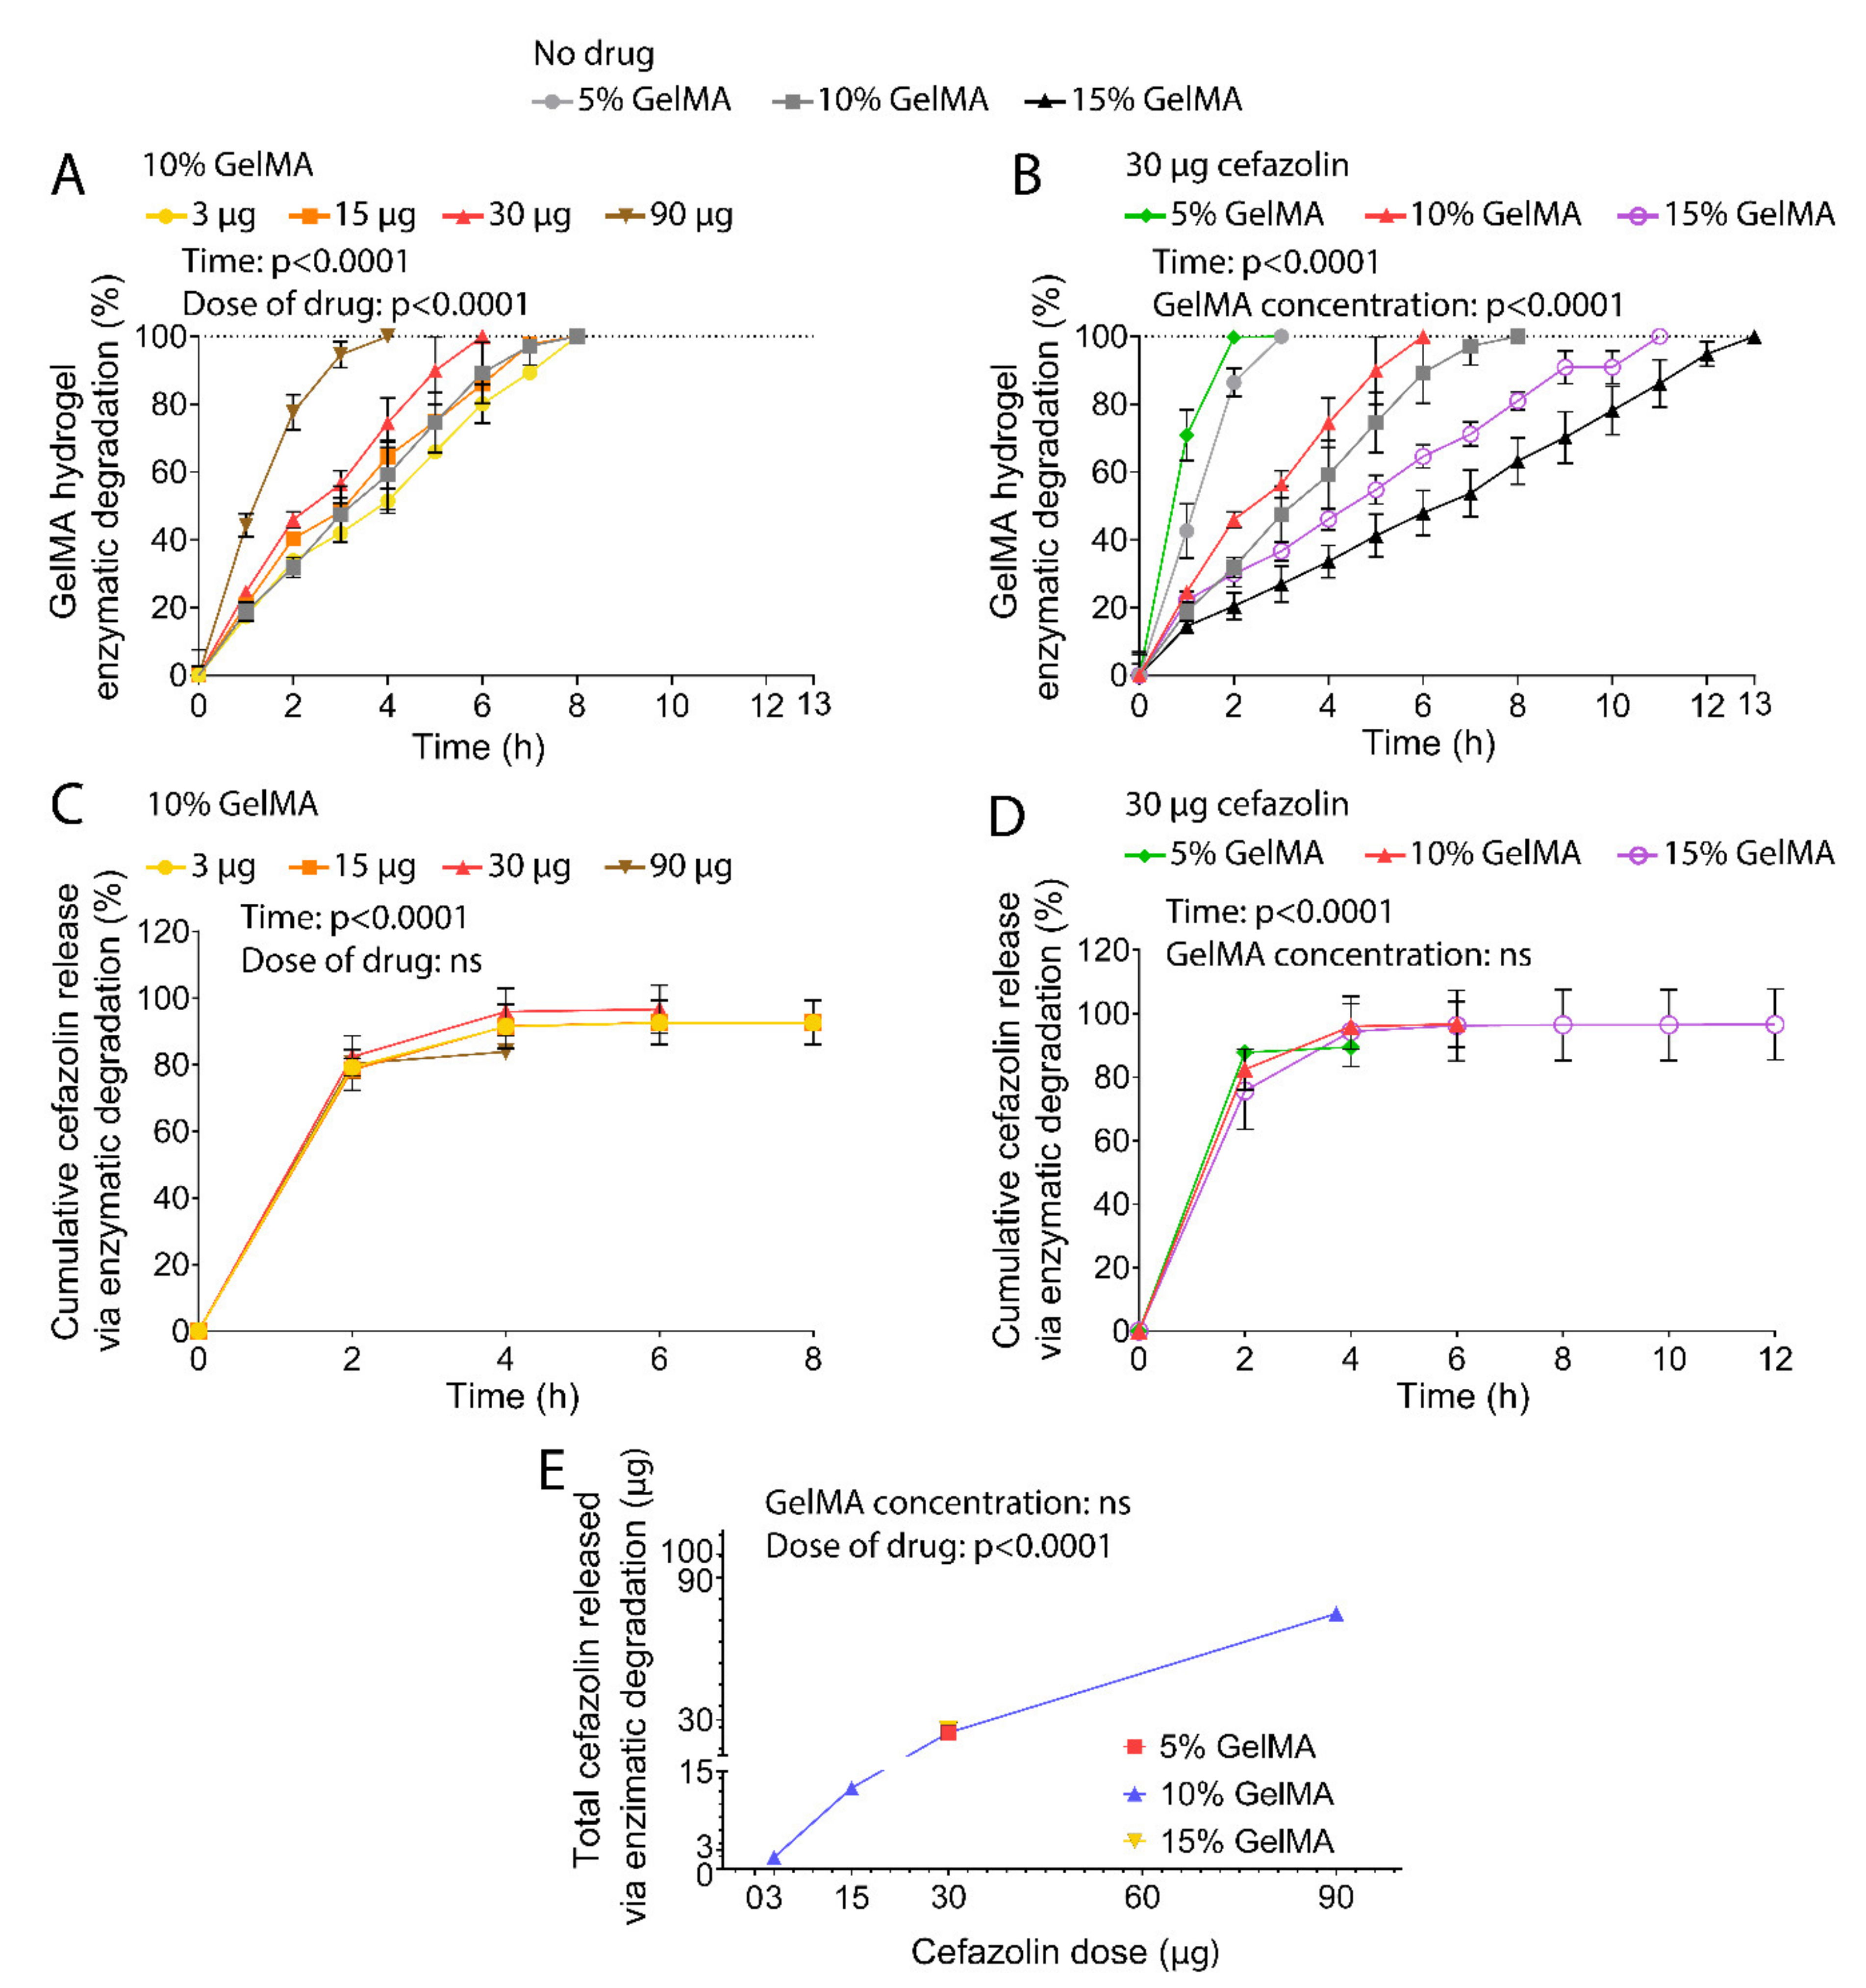
3.1.3. Release via Enzymatic Degradation
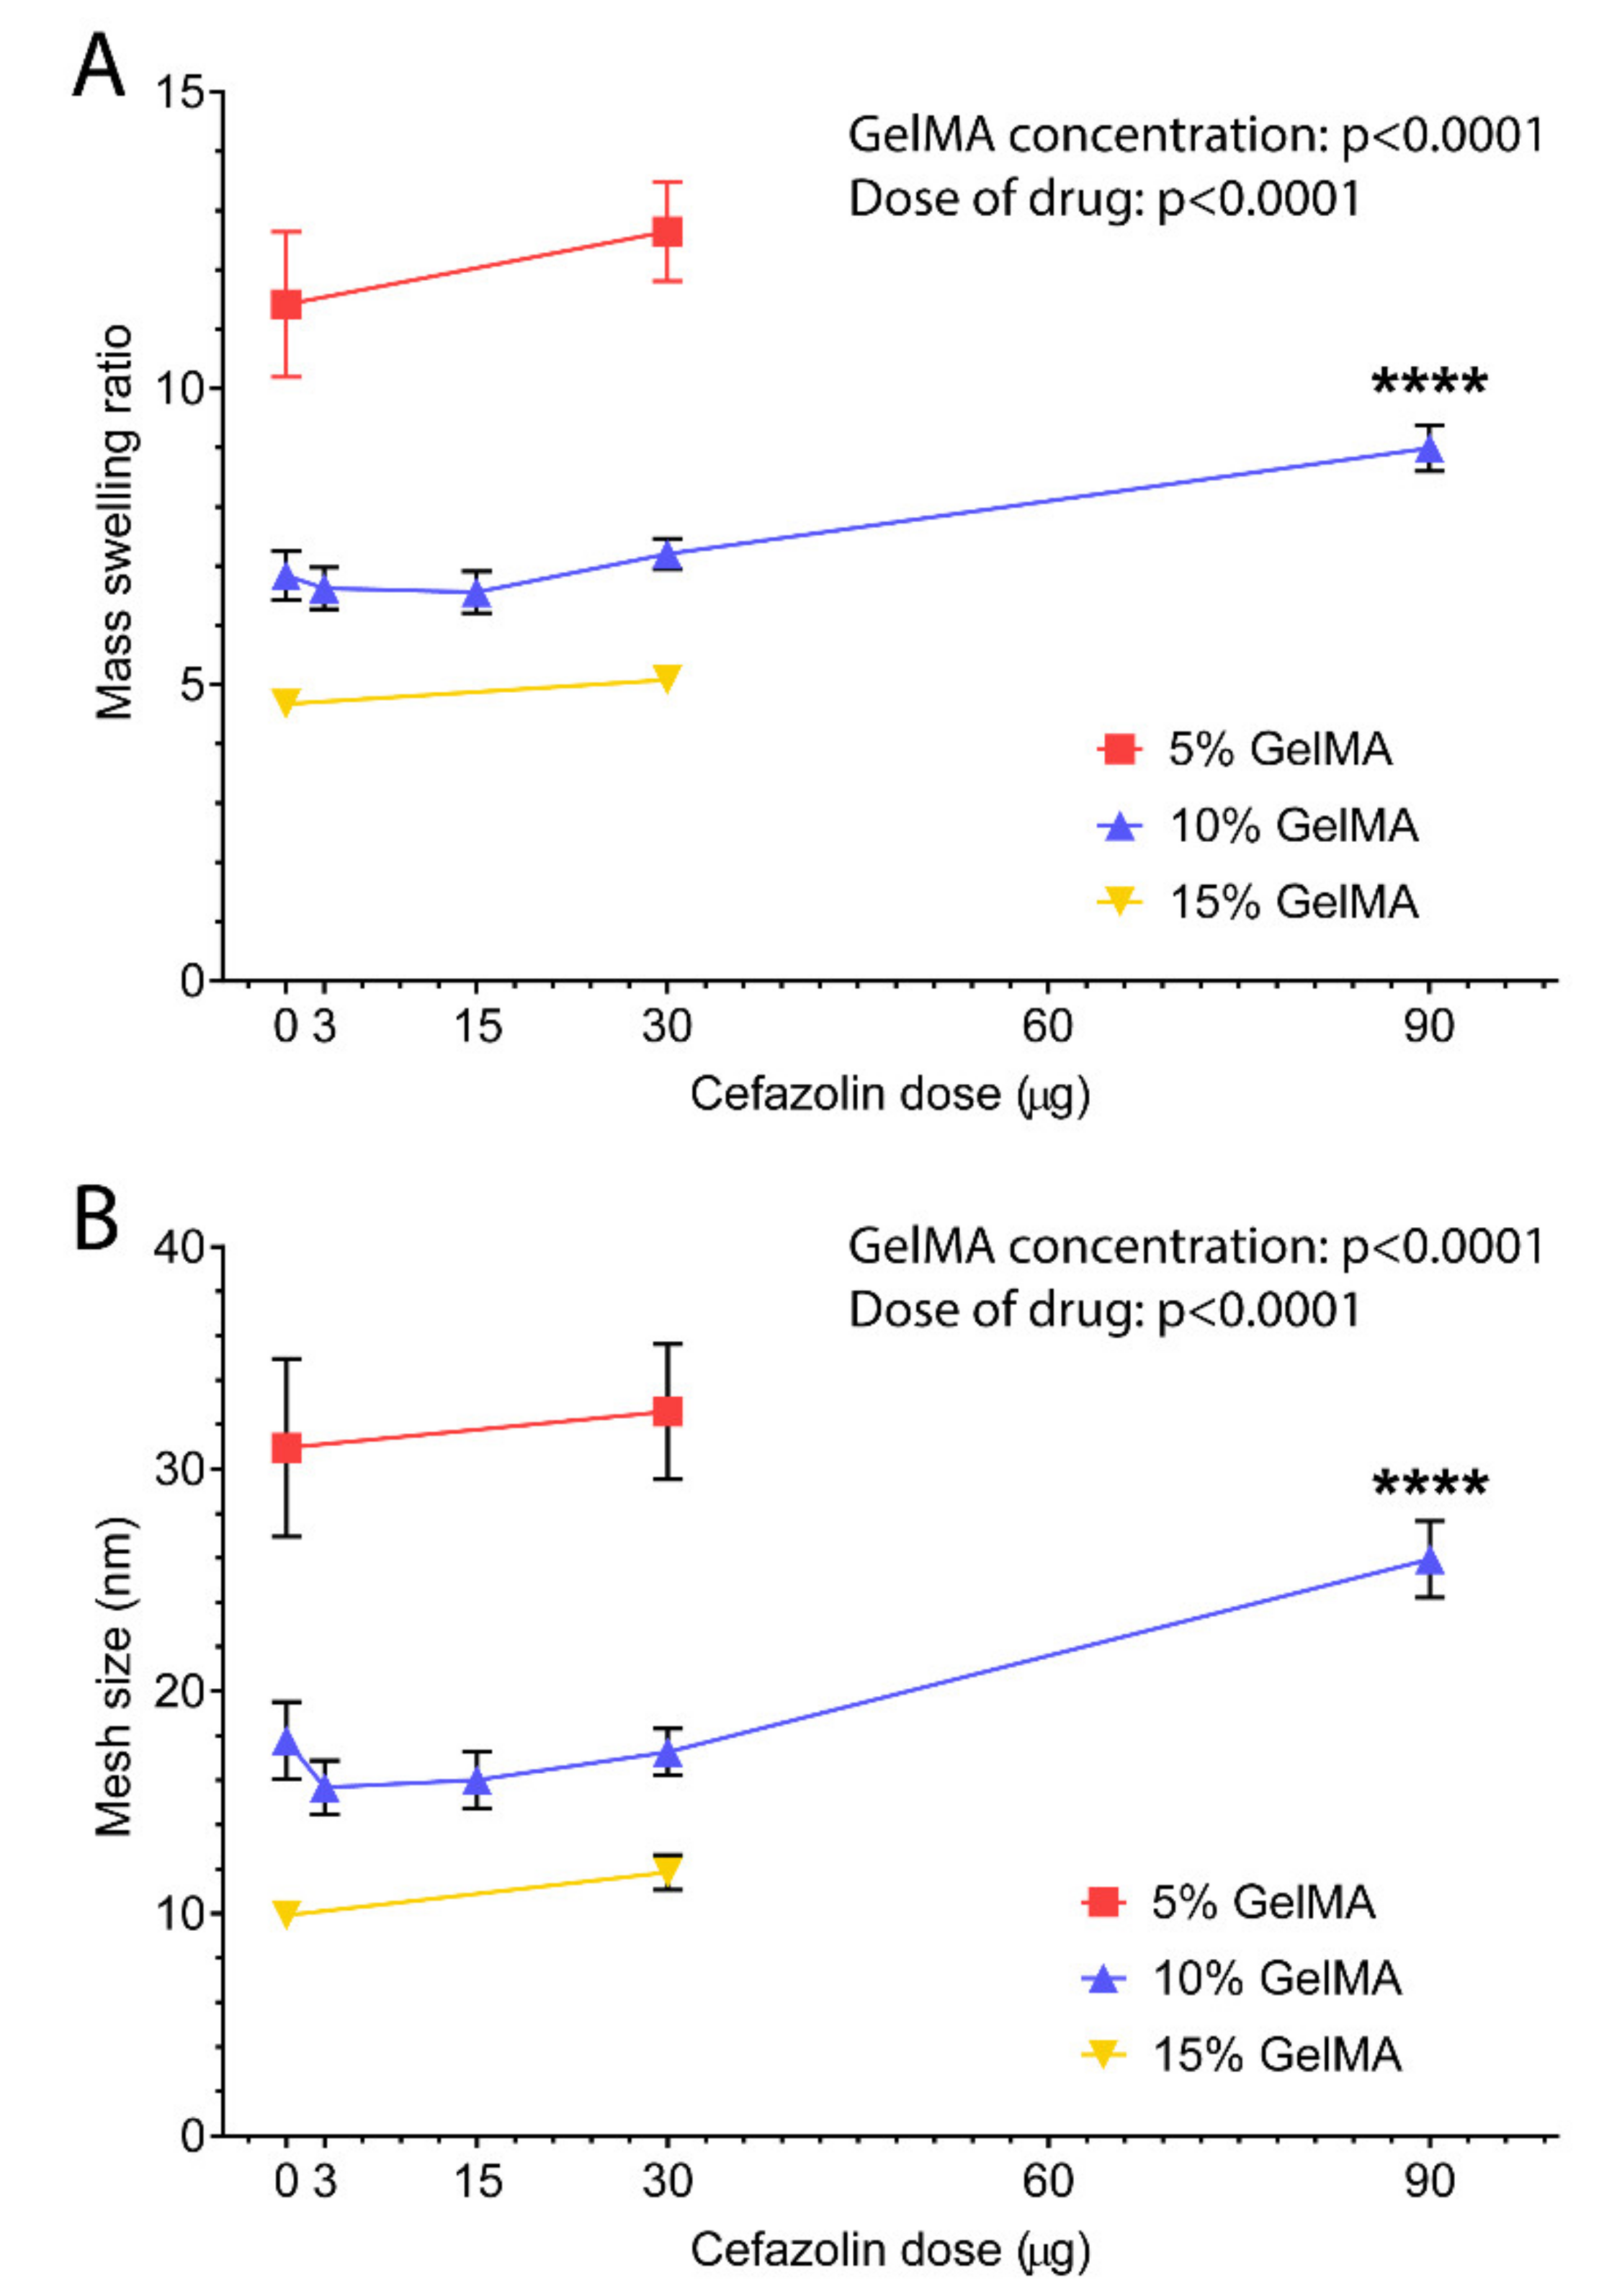
3.1.4. Mesh Size
3.2. Mechanical and Physical Properties of the Drug Delivery System
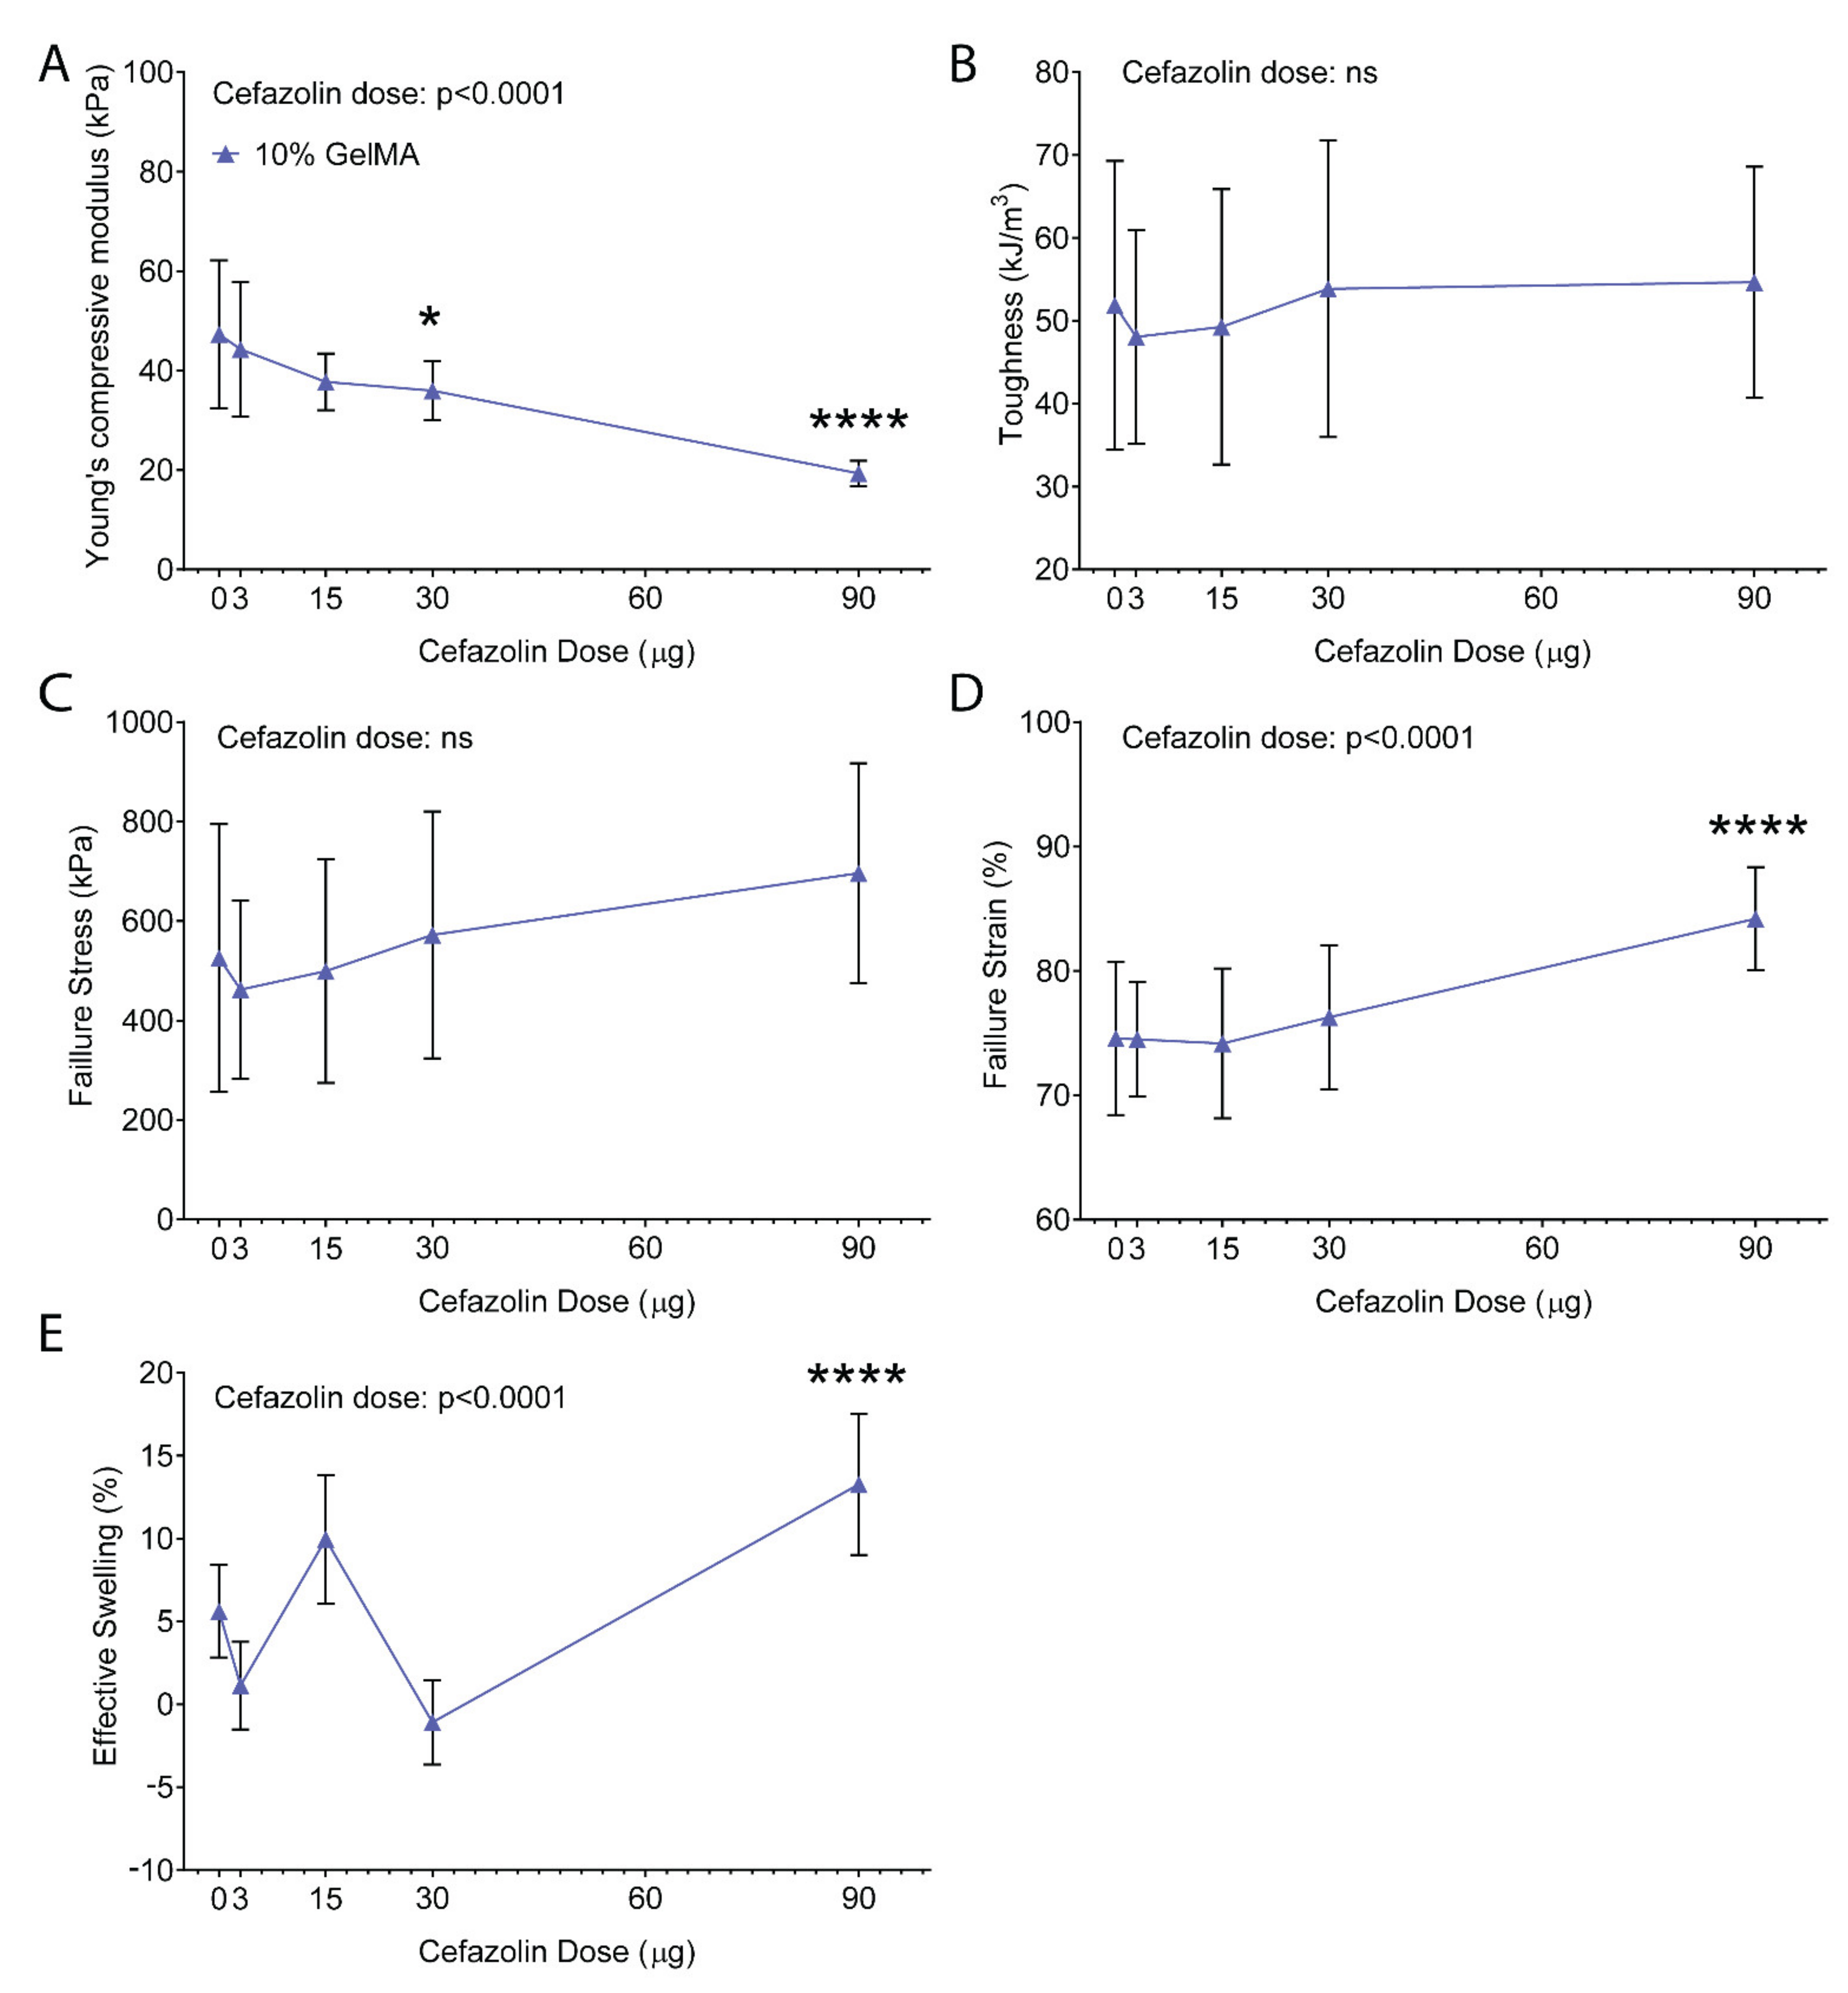
3.2.1. Mechanical Testing
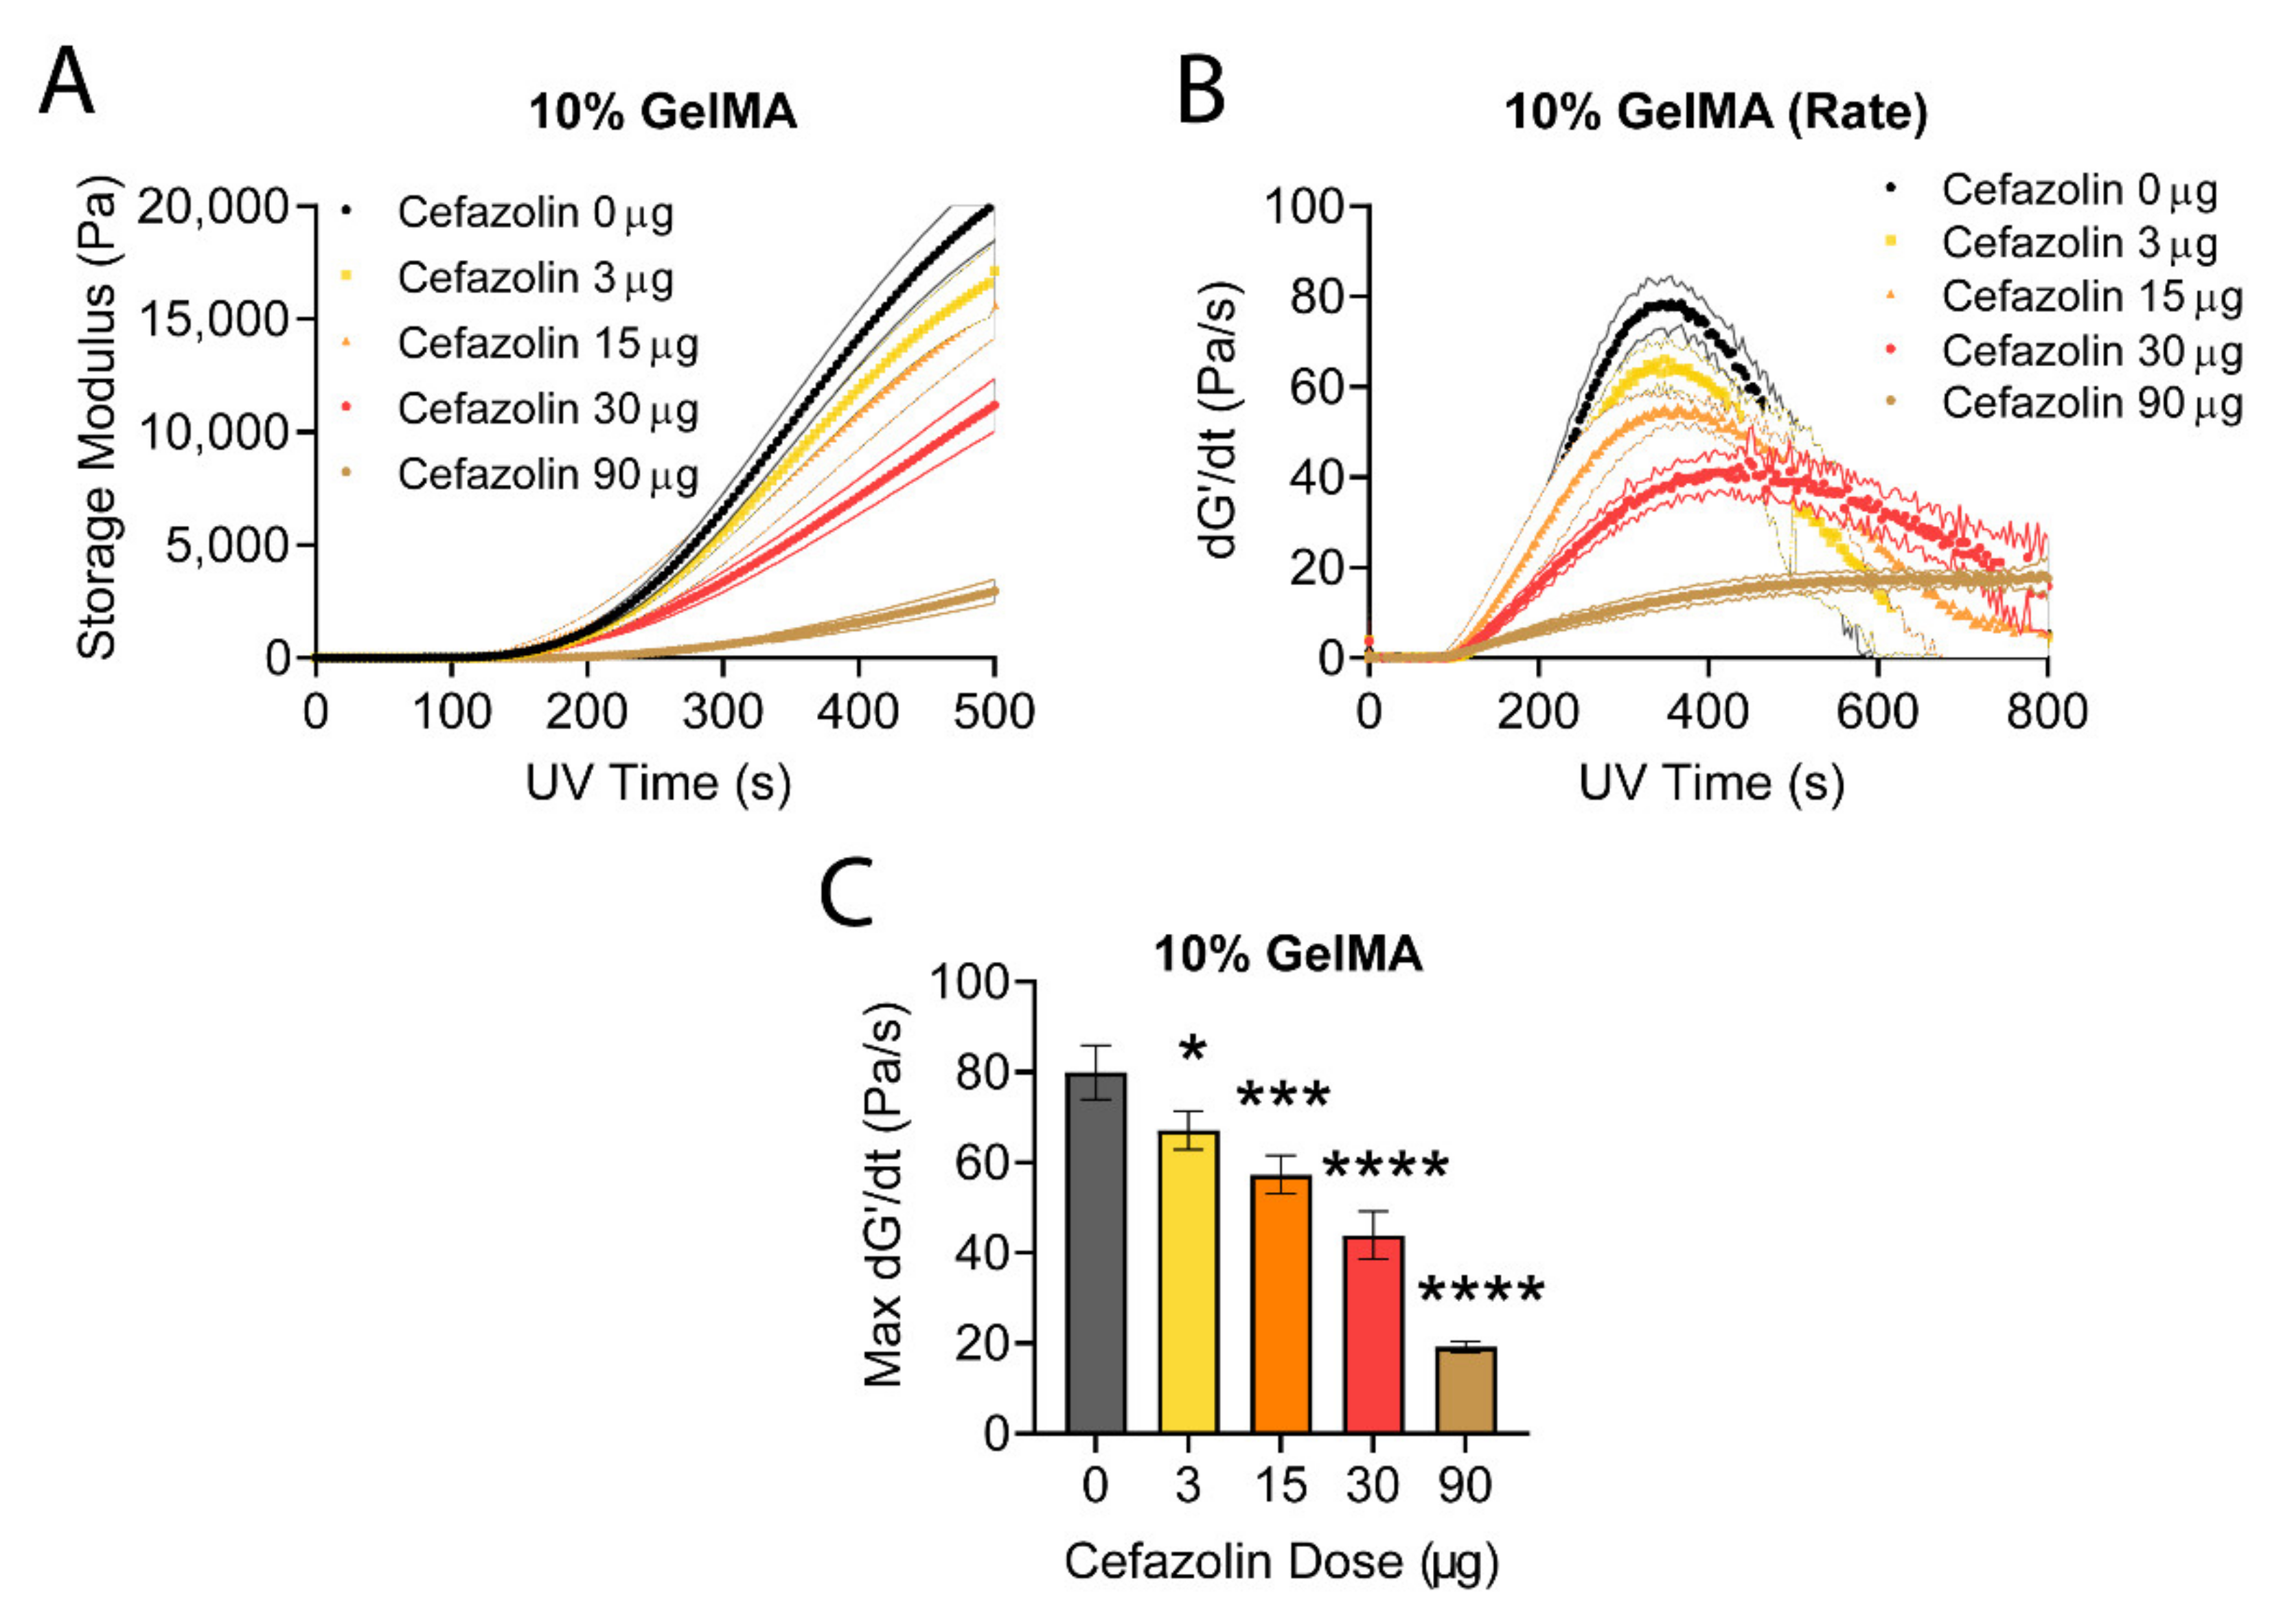
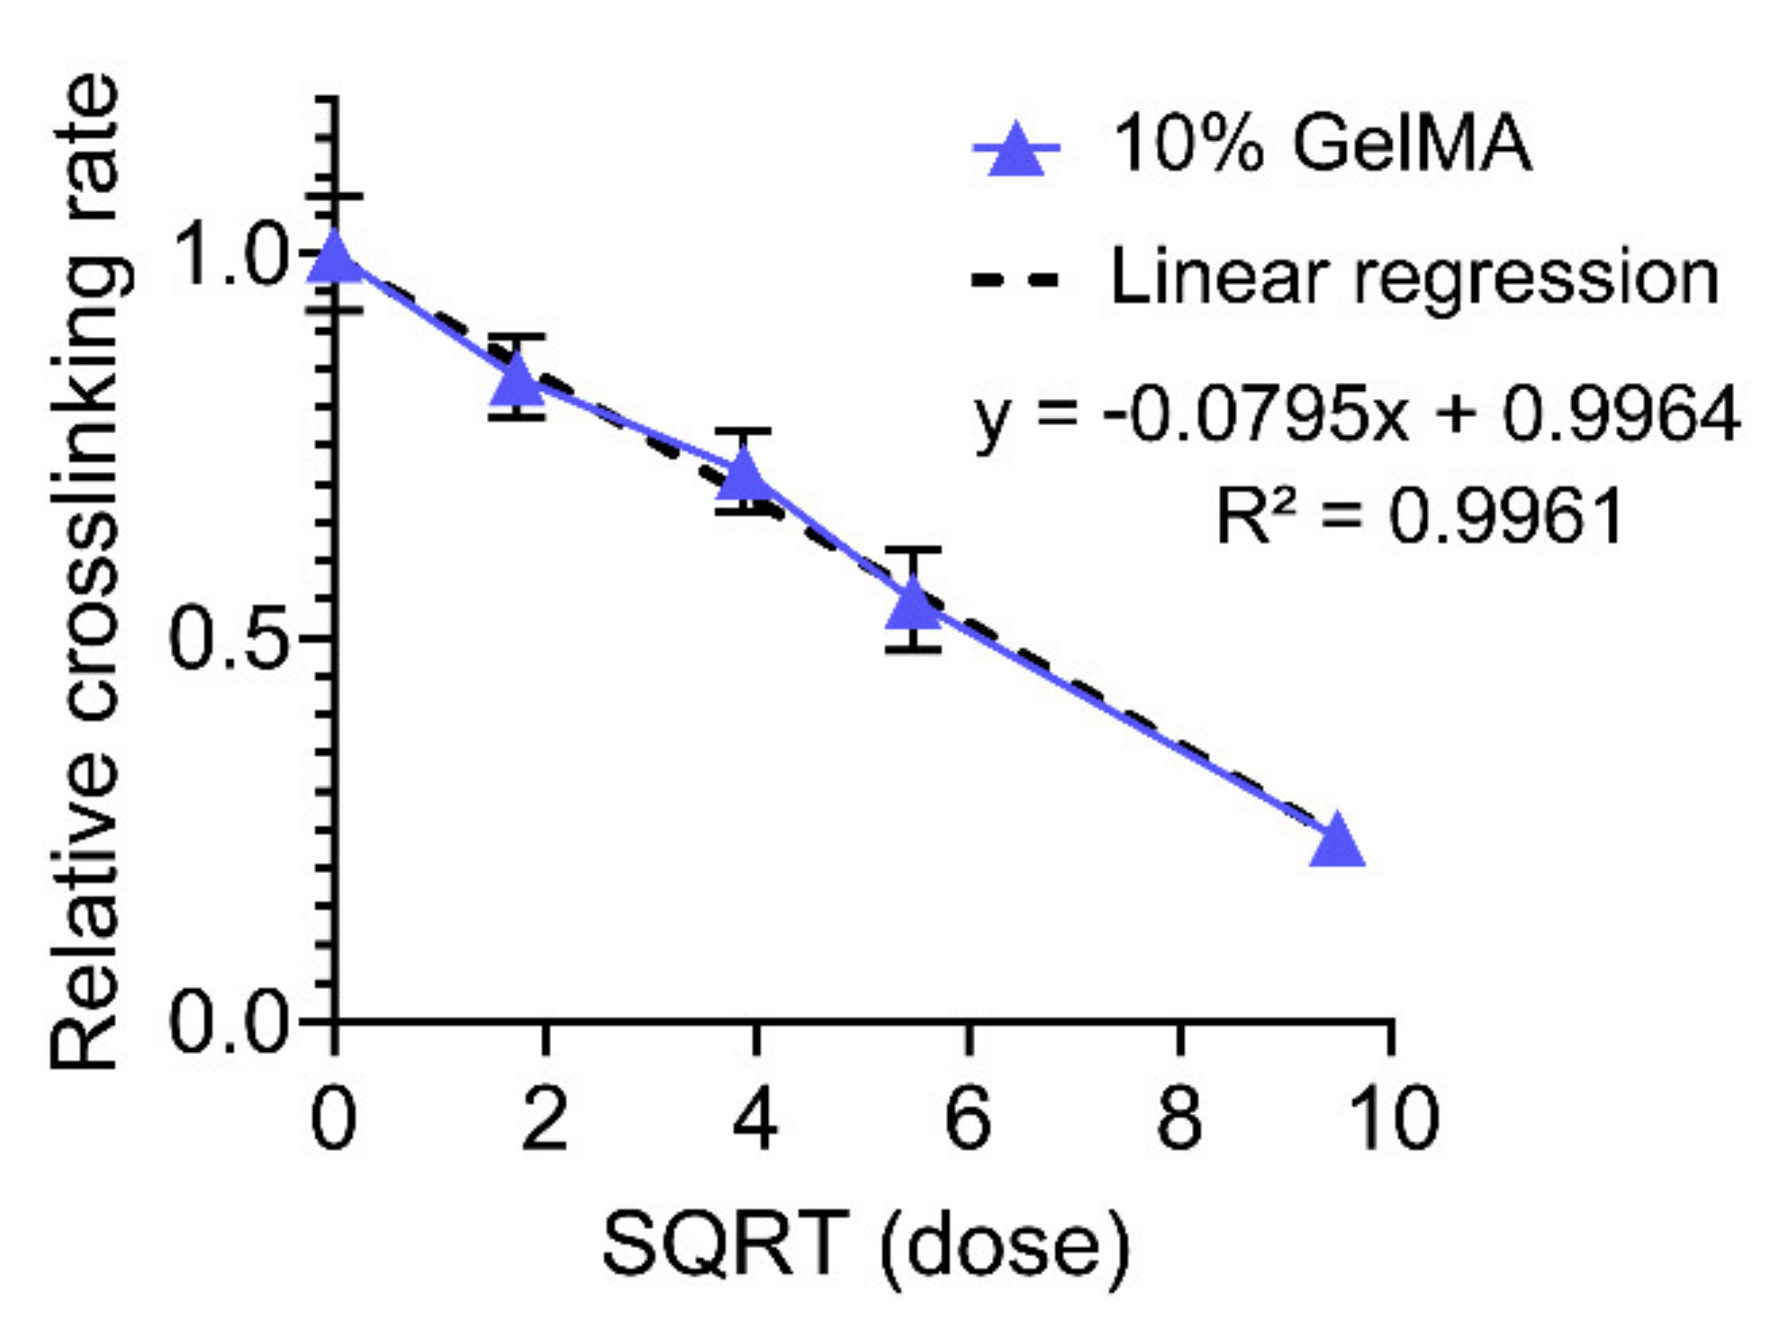
3.2.2. Photorheology
3.3. In Vitro Evaluation of GelMA-DDS
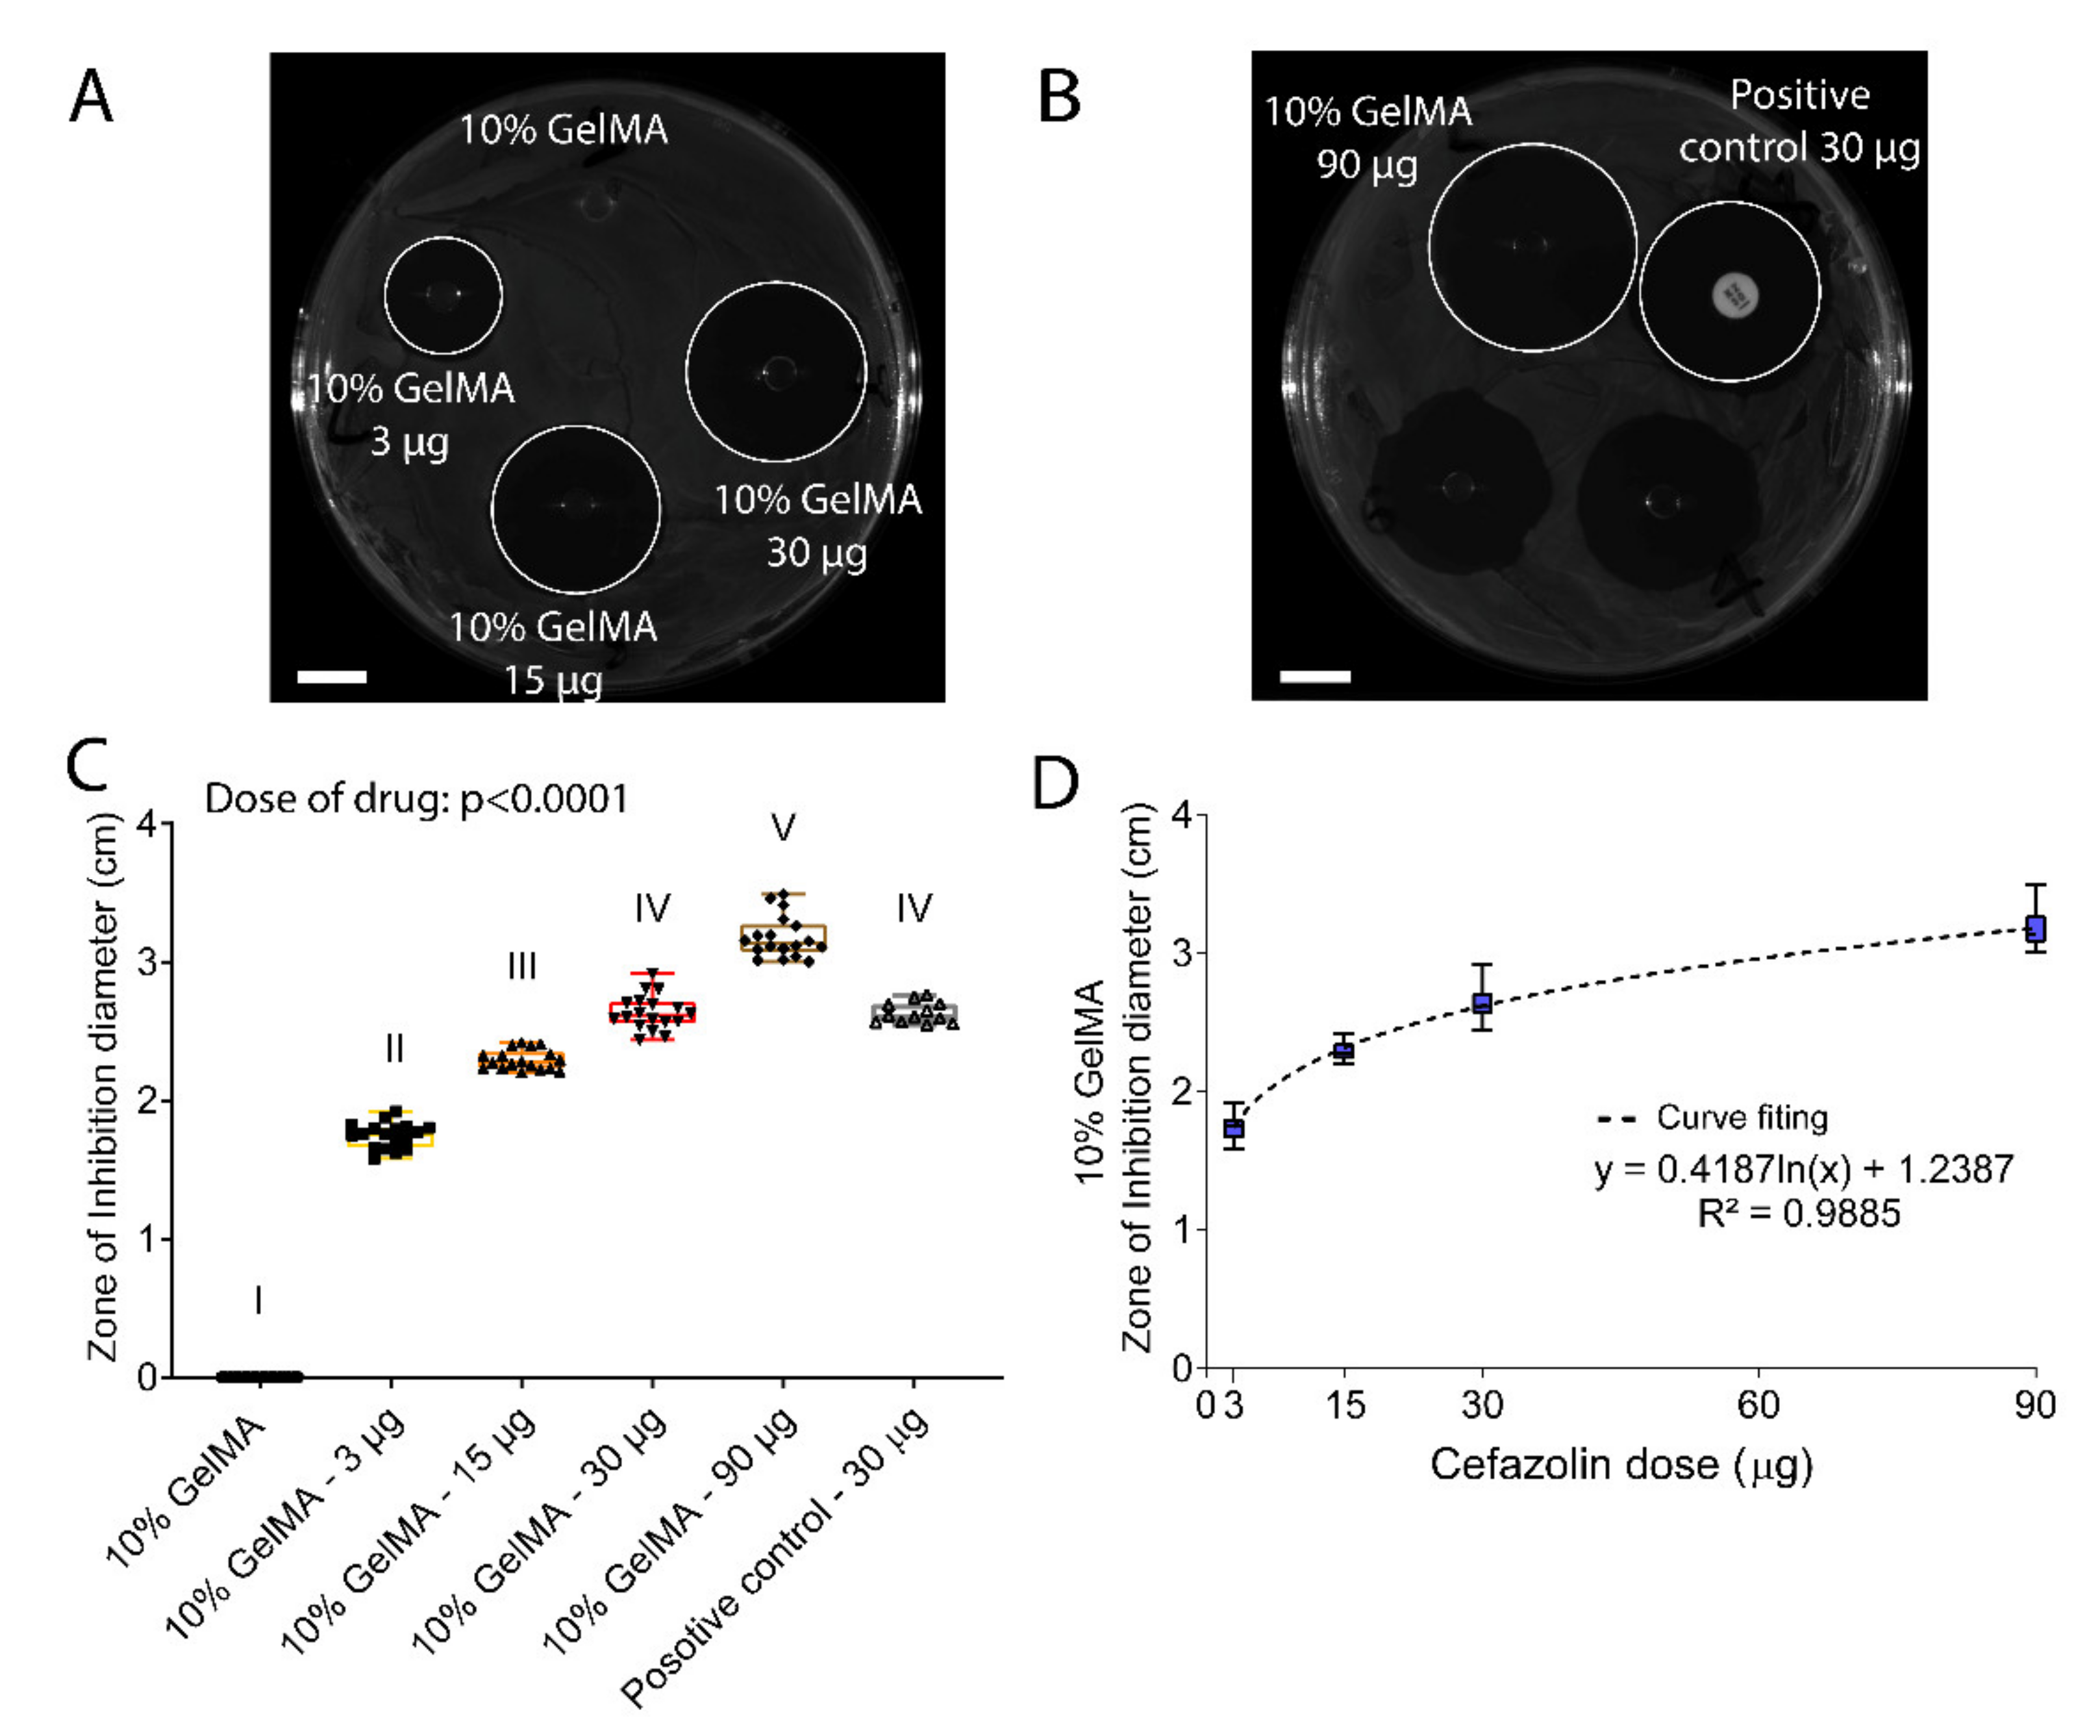
3.3.1. Diffusive Zone of Inhibition Assay
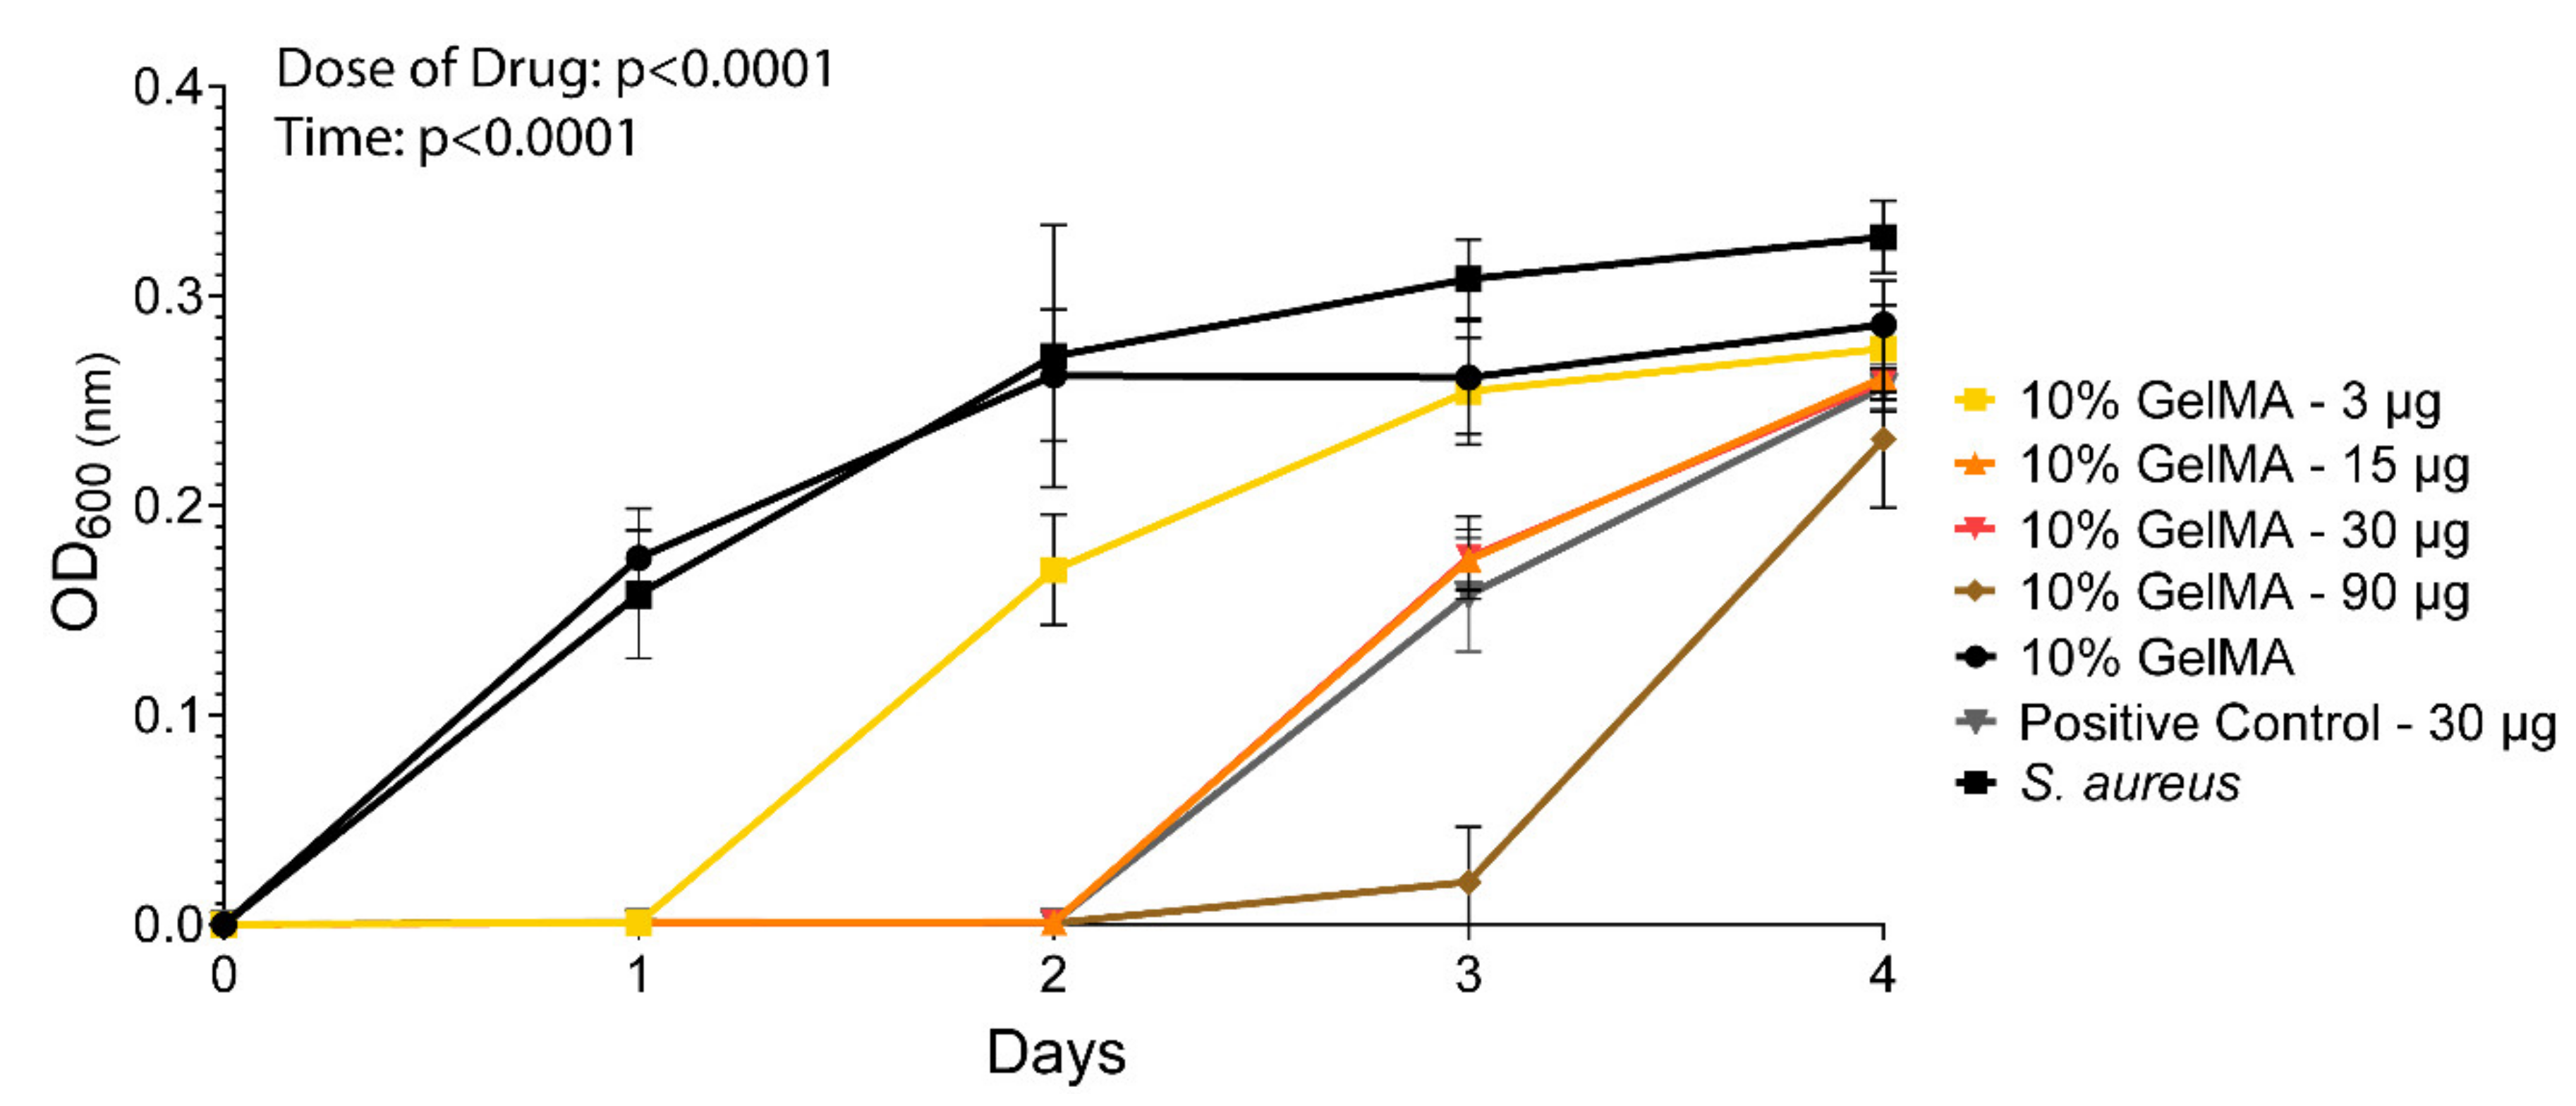
3.3.2. Broth Growth Inhibition Assay
4. Summary and Conclusions
Supplementary Materials
Author Contributions
Funding
Data Availability Statement
Conflicts of Interest
References
- Lamagni, T. Epidemiology and burden of prosthetic joint infections. J. Antimicrob. Chemother. 2014, 69, i5–i10. [Google Scholar] [CrossRef] [PubMed] [Green Version]
- Reichman, D.E.; A Greenberg, J. Reducing Surgical Site Infections: A Review. Rev. Obstet. Gynecol. 2009, 2, 212–221. [Google Scholar] [PubMed]
- Owens, C.; Stoessel, K. Surgical site infections: Epidemiology, microbiology and prevention. J. Hosp. Infect. 2008, 70, 3–10. [Google Scholar] [CrossRef]
- Weichman, K.E.; Levine, S.M.; Wilson, S.C.; Choi, M.; Karp, N. Antibiotic Selection for the Treatment of Infectious Complications of Implant-Based Breast Reconstruction. Ann. Plast. Surg. 2013, 71, 140–143. [Google Scholar] [CrossRef]
- Kusaba, T. Safety and Efficacy of Cefazolin Sodium in the Management of Bacterial Infection and in Surgical Prophylaxis. Clin. Med. Ther. 2009, 1, CMT.S2096. [Google Scholar] [CrossRef] [Green Version]
- Bratzler, D.W.; Houck, P.M. Antimicrobial prophylaxis for surgery: An advisory statement from the National Surgical Infection Prevention Project. Am. J. Surg. 2005, 189, 395–404. [Google Scholar] [CrossRef]
- Macdonald, D.J.; Gray, A.J.R. Methicillin-resistant Staphylococcus aureus in trauma and orthopaedic practice. J. Bone Jt. Surg. Br. Vol. 2006, 88, 137–138. [Google Scholar] [CrossRef]
- Yotsuji, A.; Mitsuyama, J.; Hori, R.; Yasuda, T.; Saikawa, I. Mechanism of Action of Cephalosporins and Resistance Caused by Decreased Affinity for Penicillin-Binding Proteins in Bacteroides fragilis. Antimicrob. Agents Chemother. 1988, 32, 1848–1853. [Google Scholar] [CrossRef] [Green Version]
- Oates, J.A.; Wood, A.J.; Donowitz, G.R.; Mandell, G.L. Beta-Lactam Antibiotics. N. Engl. J. Med. 1988, 318, 490–500. [Google Scholar] [CrossRef]
- Singh, R.; Sripada, L.; Singh, R. Side effects of antibiotics during bacterial infection: Mitochondria, the main target in host cell. Mitochondrion 2014, 16, 50–54. [Google Scholar] [CrossRef]
- Cunha, B.A. Antibiotic Side Effects. Med. Clin. N. Am. 2001, 85, 149–185. [Google Scholar] [CrossRef]
- Fair, R.J.; Tor, Y. Antibiotics and Bacterial Resistance in the 21st Century. Perspect. Med. Chem. 2014, 6, PMC–S14459. [Google Scholar] [CrossRef] [Green Version]
- Brooks, B.D.; Brooks, A.E. Therapeutic strategies to combat antibiotic resistance. Adv. Drug Deliv. Rev. 2014, 78, 14–27. [Google Scholar] [CrossRef]
- Kohrs, N.J.; Liyanage, T.; Venkatesan, N.; Najarzadeh, A.; Puleo, D.A. Drug Delivery Systems and Controlled Release. Biomed. Sci. 2019, 2, 316–329. [Google Scholar]
- Li, J.; Mooney, D.J. Designing hydrogels for controlled drug delivery. Nat. Rev. Mater. 2016, 1, 1–17. [Google Scholar] [CrossRef]
- Mazzeo, L.; Bianchi, M.; Cocchi, M.; Piemonte, V. Drug Delivery with Membranes Systems. In Current Trends and Future Developments on (Bio-) Membranes; Elsevier: Amsterdam, The Netherlands, 2019; pp. 291–309. [Google Scholar] [CrossRef]
- Abedini, F.; Ebrahimi, M.; Roozbehani, A.H.; Domb, A.J.; Hosseinkhani, H. Overview on natural hydrophilic polysaccharide polymers in drug delivery. Polym. Adv. Technol. 2018, 29, 2564–2573. [Google Scholar] [CrossRef]
- Sercombe, L.; Veerati, T.; Moheimani, F.; Wu, S.; Sood, A.K.; Hua, S. Advances and Challenges of Liposome Assisted Drug Delivery. Front. Pharmacol. 2015, 6, 286. [Google Scholar] [CrossRef] [Green Version]
- Zhang, Y.S.; Khademhosseini, A. Advances in engineering hydrogels. Science 2017, 356. [Google Scholar] [CrossRef]
- Loessner, D.; Meinert, C.; Kaemmerer, E.; Martine, L.; Yue, K.; Levett, P.A.; Klein, T.; Melchels, F.P.W.; Khademhosseini, A.; Hutmacher, D.W. Functionalization, preparation and use of cell-laden gelatin methacryloyl–based hydrogels as modular tissue culture platforms. Nat. Protoc. 2016, 11, 727–746. [Google Scholar] [CrossRef] [Green Version]
- Zhu, M.; Wang, Y.; Ferracci, G.; Zheng, J.; Cho, N.-J.; Lee, B.H. Gelatin methacryloyl and its hydrogels with an exceptional degree of controllability and batch-to-batch consistency. Sci. Rep. 2019, 9, 1–13. [Google Scholar] [CrossRef] [Green Version]
- Miri, A.K.; Hosseinabadi, H.G.; Cecen, B.; Hassan, S.; Zhang, Y.S. Permeability mapping of gelatin methacryloyl hydrogels. Acta Biomater. 2018, 77, 38–47. [Google Scholar] [CrossRef] [PubMed]
- Luo, Z.; Sun, W.; Fang, J.; Lee, K.; Li, S.; Gu, Z.; Dokmeci, M.R.; Khademhosseini, A. Biodegradable Gelatin Methacryloyl Microneedles for Transdermal Drug Delivery. Adv. Health Mater. 2018, 8, e1801054. [Google Scholar] [CrossRef] [PubMed]
- Peppas, N.A.; Merrill, E.W. Crosslinked poly(vinyl alcohol) hydrogels as swollen elastic networks. J. Appl. Polym. Sci. 1977, 21, 1763–1770. [Google Scholar] [CrossRef]
- Canal, T.; Peppas, N.A. Correlation between mesh size and equilibrium degree of swelling of polymeric networks. J. Biomed. Mater. Res. 1989, 23, 1183–1193. [Google Scholar] [CrossRef]
- Gilchrist, A.E.; Lee, S.; Hu, Y.; Harley, B.A.C. Mesenchymal stromal cell remodeling of a gelatin hydrogel microenvironment defines an artificial hematopoietic stem cell niche. BioRxiv 2018, 289553. [Google Scholar] [CrossRef] [Green Version]
- Berg, J.M.; Tymoczko, J.L.; Stryer, L. Primary Structure: Amino Acids Are Linked by Peptide Bonds to Form Polypeptide Chains. In Biochemistry, 5th ed.; W. H. Freeman: New York, NY, USA, 2002; p. 1100. [Google Scholar]
- Fels, I.G. Hydration and density of collagen and gelatin. J. Appl. Polym. Sci. 1964, 8, 1813–1824. [Google Scholar] [CrossRef]
- Fessler, J.; Hodge, A. Ultracentrifugal observation of phase transitions in density gradients: I. The collagen system. J. Mol. Biol. 1962, 5, 446–449. [Google Scholar] [CrossRef]
- Anjum, F.; Lienemann, P.S.; Metzger, S.; Biernaskie, J.; Kallos, M.S.; Ehrbar, M. Enzyme responsive GAG-based natural-synthetic hybrid hydrogel for tunable growth factor delivery and stem cell differentiation. Biomaterials 2016, 87, 104–117. [Google Scholar] [CrossRef] [Green Version]
- Schiel, J.E.; Hage, D.S. Density measurements of potassium phosphate buffer from 4 to 45 °C. Talanta 2005, 65, 495–500. [Google Scholar] [CrossRef]
- Flory, P.J.; Rehner, J. Statistical Mechanics of Cross-Linked Polymer Networks I. Rubberlike Elasticity. J. Chem. Phys. 1943, 11, 512–520. [Google Scholar] [CrossRef]
- Bray, J.C.; Merrill, E.W. Poly(vinyl alcohol) hydrogels. Formation by electron beam irradiation of aqueous solutions and subsequent crystallization. J. Appl. Polym. Sci. 1973, 17, 3779–3794. [Google Scholar] [CrossRef]
- Ofner, I.C.M.; Bubnis, W.A. Chemical and Swelling Evaluations of Amino Group Crosslinking in Gelatin and Modified Gelatin Matrices. Pharm. Res. 1996, 13, 1821–1827. [Google Scholar] [CrossRef]
- Kasapis, S.; Al-Marhoobi, I.M.; Mitchell, J.R. Molecular weight effects on the glass transition of gelatin/cosolute mixtures. Biopolymers 2003, 70, 169–185. [Google Scholar] [CrossRef]
- Kahl, M.; Schneidereit, D.; Bock, N.; Friedrich, O.; Hutmacher, D.W.; Meinert, C. MechAnalyze—An algorithm for standardization and automation of compression test analysis. Tissue Eng. Part C Methods 2021, 27, 529–542. [Google Scholar] [CrossRef]
- Hudzicki, J. Kirby-Bauer Disk Diffusion Susceptibility Test Protocol. Am. Soc. Microbiol. 2009, 66, 208. [Google Scholar]
- Nannini, E.; Stryjewski, M.; Singh, K.V.; Bourgogne, A.; Rude, T.H.; Corey, G.R.; Fowler, V.G.; Murray, B.E. Inoculum Effect with Cefazolin among Clinical Isolates of Methicillin-Susceptible Staphylococcus aureus: Frequency and Possible Cause of Cefazolin Treatment Failure. Antimicrob. Agents Chemother. 2009, 53, 3437–3441. [Google Scholar] [CrossRef] [Green Version]
- Chen, Y.-C.; Lin, R.-Z.; Qi, H.; Yang, Y.; Bae, H.; Melero-Martin, J.M.; Khademhosseini, A. Functional Human Vascular Network Generated in Photocrosslinkable Gelatin Methacrylate Hydrogels. Adv. Funct. Mater. 2012, 22, 2027–2039. [Google Scholar] [CrossRef] [Green Version]
- Shah, S.R.; Henslee, A.M.; Spicer, P.P.; Yokota, S.; Petrichenko, S.; Allahabadi, S.; Bennett, G.N.; Wong, M.E.; Kasper, F.; Mikos, A.G. Effects of Antibiotic Physicochemical Properties on Their Release Kinetics from Biodegradable Polymer Microparticles. Pharm. Res. 2014, 31, 3379–3389. [Google Scholar] [CrossRef] [Green Version]
- Shahzad, A.; Khan, A.; Afzal, Z.; Umer, M.F.; Khan, J.; Khan, G.M. Formulation development and characterization of cefazolin nanoparticles-loaded cross-linked films of sodium alginate and pectin as wound dressings. Int. J. Biol. Macromol. 2019, 124, 255–269. [Google Scholar] [CrossRef]
- Lai, P.-L.; Hong, D.-W.; Ku, K.-L.; Lai, Z.-T.; Chu, I.-M. Novel thermosensitive hydrogels based on methoxy polyethylene glycol-co-poly(lactic acid-co-aromatic anhydride) for cefazolin delivery. Nanomed. Nanotechnol. Biol. Med. 2014, 10, 553–560. [Google Scholar] [CrossRef]
- Mantripragada, V.P.; Jayasuriya, A.C. Effect of dual delivery of antibiotics (vancomycin and cefazolin) and BMP-7 from chitosan microparticles on Staphylococcus epidermidis and pre-osteoblasts in vitro. Mater. Sci. Eng. C 2016, 67, 409–417. [Google Scholar] [CrossRef] [Green Version]
- Arya, A.D.; Hallur, P.M.; Karkisaval, A.G.; Gudipati, A.; Rajendiran, S.; Dhavale, V.; Ramachandran, B.; Jayaprakash, A.; Gundiah, N.; Chaubey, A. Gelatin Methacrylate Hydrogels as Biomimetic Three-Dimensional Matrixes for Modeling Breast Cancer Invasion and Chemoresponse in Vitro. ACS Appl. Mater. Interfaces 2016, 8, 22005–22017. [Google Scholar] [CrossRef]
- National Center for Biotechnology Information. PubChem Compound Summary for CID 23675322, Cefazolin sodium. Retrieved 15 November 2021. 2021. Available online: https://pubchem.ncbi.nlm.nih.gov/compound/Cefazolin-sodium (accessed on 27 October 2021).
- National Center for Biotechnology Information. PubChem Compound Summary for CID 31703, Doxorubicin. Retrieved 15 November 2021. 2021. Available online: https://pubchem.ncbi.nlm.nih.gov/compound/Doxorubicin (accessed on 27 October 2021).
- Park, J.H.; Kwon, S.; Lee, M.; Chung, H.; Kim, J.-H.; Kim, Y.-S.; Park, R.-W.; Kim, I.-S.; Seo, S.B.; Kwon, I.C.; et al. Self-assembled nanoparticles based on glycol chitosan bearing hydrophobic moieties as carriers for doxorubicin: In vivo biodistribution and anti-tumor activity. Biomaterials 2006, 27, 119–126. [Google Scholar] [CrossRef]
- Calori, I.R.; Braga, G.; Jesus, P.D.C.C.D.; Bi, H.; Tedesco, A.C. Polymer scaffolds as drug delivery systems. Eur. Polym. J. 2020, 129, 109621. [Google Scholar] [CrossRef]
- Nichol, J.W.; Koshy, S.; Bae, H.; Hwang, C.M.; Yamanlar, S.; Khademhosseini, A. Cell-laden microengineered gelatin methacrylate hydrogels. Biomaterials 2010, 31, 5536–5544. [Google Scholar] [CrossRef] [Green Version]
- Vigata, M.; Meinert, C.; Pahoff, S.; Bock, N.; Hutmacher, D.W. Gelatin Methacryloyl Hydrogels Control the Localized Delivery of Albumin-Bound Paclitaxel. Polymers 2020, 12, 501. [Google Scholar] [CrossRef] [Green Version]
- Pepelanova, I.; Kruppa, K.; Scheper, T.; Lavrentieva, A. Gelatin-Methacryloyl (GelMA) Hydrogels with Defined Degree of Functionalization as a Versatile Toolkit for 3D Cell Culture and Extrusion Bioprinting. Bioengineering 2018, 5, 55. [Google Scholar] [CrossRef] [Green Version]
- Lee, B.H.; Shirahama, H.; Kim, M.H.; Lee, J.H.; Cho, N.-J.; Tan, L.P. Colloidal templating of highly ordered gelatin methacryloyl-based hydrogel platforms for three-dimensional tissue analogues. NPG Asia Mater. 2017, 9, e412. [Google Scholar] [CrossRef]
- Yoon, H.J.; Shin, S.R.; Cha, J.M.; Lee, S.-H.; Kim, J.-H.; Do, J.T.; Song, H.; Bae, H. Cold Water Fish Gelatin Methacryloyl Hydrogel for Tissue Engineering Application. PLoS ONE 2016, 11, e0163902. [Google Scholar] [CrossRef] [Green Version]
- Chiarappa, G.; Abrami, M.; Farra, R.; Dapas, B.; Grassi, G.; Grassi, M. Drug delivery from polymeric matrices. Comput. Aided Chem. Eng. 2018, 42, 325–356. [Google Scholar] [CrossRef]
- Lin, C.C.; Metters, A.T. Hydrogels in controlled release formulations: Network design and mathematical modeling. Adv Drug Deliv Rev. 2006, 58, 1379–1408. [Google Scholar] [CrossRef] [PubMed]
- Mäder, K.; Lehner, E.; Liebau, A.; Plontke, S.K. Controlled drug release to the inner ear: Concepts, materials, mechanisms, and performance. Hear. Res. 2018, 368, 49–66. [Google Scholar] [CrossRef]
- Van de Manakker, F.; Braeckmans, K.; el Morabit, N.; De Smedt, S.C.; van Nostrum, C.F.; Hennink, W.E. Protein-Release Behavior of Self-Assembled PEG-β-Cyclodextrin/PEG-Cholesterol Hydrogels. Adv. Funct. Mater. 2009, 19, 2992–3001. [Google Scholar] [CrossRef]
- Rehmann, M.S.; Skeens, K.M.; Kharkar, P.; Ford, E.M.; Maverakis, E.; Lee, K.H.; Kloxin, A.M. Tuning and Predicting Mesh Size and Protein Release from Step Growth Hydrogels. Biomacromolecules 2017, 18, 3131–3142. [Google Scholar] [CrossRef] [PubMed]
- Wisniewska, M.A.; Seland, J.G.; Wang, W. Determining the scaling of gel mesh size with changing crosslinker concentration using dynamic swelling, rheometry, and PGSE NMR spectroscopy. J. Appl. Polym. Sci. 2018, 135, 46695. [Google Scholar] [CrossRef]
- Aston, R.; Sewell, K.; Klein, T.; Lawrie, G.; Grøndahl, L. Evaluation of the impact of freezing preparation techniques on the characterisation of alginate hydrogels by cryo-SEM. Eur. Polym. J. 2016, 82, 1–15. [Google Scholar] [CrossRef] [Green Version]
- Ma, X.; Xu, T.; Chen, W.; Qin, H.; Chi, B.; Ye, Z. Injectable hydrogels based on the hyaluronic acid and poly (γ-glutamic acid) for controlled protein delivery. Carbohydr. Polym. 2018, 179, 100–109. [Google Scholar] [CrossRef] [PubMed]
- Wu, P.; Grainger, D.W. Drug/device combinations for local drug therapies and infection prophylaxis. Biomaterials 2006, 27, 2450–2467. [Google Scholar] [CrossRef]
- Mahdavinia, G.R.; Hosseini, R.; Darvishi, F.; Sabzi, M. The release of cefazolin from chitosan/polyvinyl alcohol/sepiolite nanocomposite hydrogel films. Iran. Polym. J. 2016, 25, 933–943. [Google Scholar] [CrossRef]
- Overstreet, D.J.; Huynh, R.; Jarbo, K.; McLemore, R.Y.; Vernon, B.L. In situforming, resorbable graft copolymer hydrogels providing controlled drug release. J. Biomed. Mater. Res. Part A 2013, 101A, 1437–1446. [Google Scholar] [CrossRef]
- Aiken, S.S.; Cooper, J.J.; Florance, H.; Robinson, M.; Michell, S. Local Release of Antibiotics for Surgical Site Infection Management Using High-Purity Calcium Sulfate: An In Vitro Elution Study. Surg. Infect. 2015, 16, 54–61. [Google Scholar] [CrossRef] [Green Version]
- Cooper, J.J.; Florance, H.; McKinnon, J.L.; Laycock, P.A.; Aiken, S.S. Elution profiles of tobramycin and vancomycin from high-purity calcium sulphate beads incubated in a range of simulated body fluids. J. Biomater. Appl. 2016, 31, 357–365. [Google Scholar] [CrossRef]
- Howlin, R.P.; Brayford, M.J.; Webb, J.; Cooper, J.J.; Aiken, S.S.; Stoodley, P. Antibiotic-Loaded Synthetic Calcium Sulfate Beads for Prevention of Bacterial Colonization and Biofilm Formation in Periprosthetic Infections. Antimicrob. Agents Chemother. 2014, 59, 111–120. [Google Scholar] [CrossRef] [Green Version]
- Sean Aiken. Assessing the Influence of Third Body Damage to Articulating Surfaces with Bone Void Fillers [Internet]. 2019 [cited 2021 Nov 16]. Available online: https://www.biocomposites.com/wp-content/uploads/2019/08/International-Assessing-the-influence-of-third-body-damage-to-articulating-surfaces-with-bone-void-fillers-paper-MA0175R2.pdf (accessed on 27 October 2021).
- Bergeron, M.G.; Brusch, J.L.; Barza, M.; Weinstein, L. Bactericidal Activity and Pharmacology of Cefazolin. Antimicrob. Agents Chemother. 1973, 4, 396–401. [Google Scholar] [CrossRef] [Green Version]
- Ficker, L.; Meredith, T.A.; Gardner, S.; Wilson, L.A. Cefazolin levels after intravitreal injection. Effects of inflammation and surgery. Investig. Ophthalmol. Vis. Sci. 1990, 31, 502–505. [Google Scholar]
- Bas, O.; Catelas, I.; De-Juan-Pardo, E.; Hutmacher, D.W. The quest for mechanically and biologically functional soft biomaterials via soft network composites. Adv. Drug Deliv. Rev. 2018, 132, 214–234. [Google Scholar] [CrossRef] [Green Version]
- Schuurman, W.; Levett, P.A.; Pot, M.W.; van Weeren, P.R.; Dhert, W.J.A.; Hutmacher, D.W.; Melchels, F.P.W.; Klein, T.J.; Malda, J. Gelatin-Methacrylamide Hydrogels as Potential Biomaterials for Fabrication of Tissue-Engineered Cartilage Constructs. Macromol. Biosci. 2013, 13, 551–561. [Google Scholar] [CrossRef]
- Berczyński, P.; Kładna, A.; Kruk, I.; Aboul-Enein, H.Y. Radical-scavenging activity of penicillin G, ampicillin, oxacillin, and dicloxacillin. Luminescence 2017, 32, 434–442. [Google Scholar] [CrossRef]
- Klotz, B.J.; Gawlitta, D.; Rosenberg, A.J.; Malda, J.; Melchels, F.P. Gelatin-Methacryloyl Hydrogels: Towards Biofabrication-Based Tissue Repair. Trends Biotechnol. 2016, 34, 394–407. [Google Scholar] [CrossRef] [Green Version]
- Andrzejewska, E. Photopolymerization kinetics of multifunctional monomers. Prog. Polym. Sci. 2001, 26, 605–665. [Google Scholar] [CrossRef]
- Liu, M.; Li, M.-D.; Xue, J.; Phillips, D.L. Time-Resolved Spectroscopic and Density Functional Theory Study of the Photochemistry of Irgacure-2959 in an Aqueous Solution. J. Phys. Chem. A 2014, 118, 8701–8707. [Google Scholar] [CrossRef] [PubMed]
- O’Connell, C.D.; Zhang, B.; Onofrillo, C.; Duchi, S.; Blanchard, R.; Quigley, A.; Bourke, J.; Gambhir, S.; Kapsa, R.; Di Bella, C.; et al. Tailoring the mechanical properties of gelatin methacryloyl hydrogels through manipulation of the photocrosslinking conditions. Soft Matter 2018, 14, 2142–2151. [Google Scholar] [CrossRef] [PubMed]
- Odian, G. Principles of polymerization, 4th ed.; John Wiley & Sons, Inc.: Hoboken, NJ, USA, 2004. [Google Scholar]
- Pedroso, T.M.; Salgado, H.R.N. Validation of Cefazolin Sodium by UV-Spectrophotometric Method. Phys. Chem. 2013, 3, 11–20. [Google Scholar] [CrossRef]
- Visscher, L.E.; Dang, H.P.; Knackstedt, M.A.; Hutmacher, D.W.; Tran, P.A. 3D printed Polycaprolactone scaffolds with dual macro-microporosity for applications in local delivery of antibiotics. Mater. Sci. Eng. C 2018, 87, 78–89. [Google Scholar] [CrossRef] [Green Version]
- Rotilie, C.A.; Fass, R.J.; Prior, R.B.; Perkins, R.L. Microdilution Technique for Antimicrobial Susceptibility Testing of Anaerobic Bacteria. Antimicrob. Agents Chemother. 1975, 7, 311–315. [Google Scholar] [CrossRef] [Green Version]
- Mohammed, I.; Said, D.G.; Nubile, M.; Mastropasqua, L.; Dua, H.S. Cathelicidin-Derived Synthetic Peptide Improves Therapeutic Potential of Vancomycin Against Pseudomonas aeruginosa. Front. Microbiol. 2019, 10, 2190. [Google Scholar] [CrossRef] [Green Version]
- Vigata, M.; Meinert, C.; Hutmacher, D.W.; Bock, N. Hydrogels as Drug Delivery Systems: A Review of Current Characterization and Evaluation Techniques. Pharmaceutics 2020, 12, 1188. [Google Scholar] [CrossRef]
- Kelm, J.; Regitz, T.; Schmitt, E.; Jung, W.; Anagnostakos, K. In Vivo and In Vitro Studies of Antibiotic Release from and Bacterial Growth Inhibition by Antibiotic-Impregnated Polymethylmethacrylate Hip Spacers. Antimicrob. Agents Chemother. 2006, 50, 332–335. [Google Scholar] [CrossRef] [Green Version]
- Welch, A.B. Antibiotics in acrylic bone cement.In vivo studies. J. Biomed. Mater. Res. 1978, 12, 843–855. [Google Scholar] [CrossRef]
- Seldes, R.M.; Winiarsky, R.; Jordan, L.C.; Baldini, T.; Brause, B.; Zodda, F.; Sculco, T.P. Liquid Gentamicin in Bone Cement. J. Bone Jt. Surg.-Am. Vol. 2005, 87, 268–272. [Google Scholar] [CrossRef]


| Group Denomination | GelMA Concentration (%) | Cefazolin Dose (µg) |
|---|---|---|
| 5% GelMA | 5 | 0 |
| 5% GelMA–30 µg | 5 | 30 |
| 10% GelMA | 10 | 0 |
| 10% GelMA–3 µg | 10 | 3 |
| 10% GelMA–15 µg | 10 | 15 |
| 10% GelMA–30 µg | 10 | 30 |
| 10% GelMA–90 µg | 10 | 90 |
| 15% GelMA | 15 | 0 |
| 15% GelMA–30 µg | 15 | 30 |
| Cefazolin Dose (µg) | Cefazolin Concentration (M) | Relative Crosslinking Rate (%) | Photoinitiator Efficiency f: | Effective Rate of Free Radical Generation (M/s) | Cumulative Consumed Radicals (M) at t = 1800s | Proportion of Drug Consumed | Mass of Drug Consumed (ng) |
|---|---|---|---|---|---|---|---|
| 0 | 0 | 1.00 | 1 | 3.33 × 10⁻⁸ | 0.0 | 0.00% | 0 |
| 3 | 1.89 × 10⁻⁴ | 0.81 | 0.9 | 3.00 × 10⁻⁸ | 5.9 × 10⁻⁶ | 3.14% | 94.20 |
| 15 | 9.43 × 10⁻⁴ | 0.69 | 0.8307 | 2.77 × 10⁻⁸ | 1.0 × 10⁻⁵ | 1.07% | 160.50 |
| 30 | 1.89 × 10⁻³ | 0.59 | 0.7681 | 2.56 × 10⁻⁸ | 1.4 × 10⁻⁵ | 0.72% | 216.00 |
| 90 | 5.66 × 10⁻³ | 0.24 | 0.4899 | 1.63 × 10⁻⁸ | 3.0 × 10⁻⁵ | 0.53% | 477.00 |
Publisher’s Note: MDPI stays neutral with regard to jurisdictional claims in published maps and institutional affiliations. |
© 2021 by the authors. Licensee MDPI, Basel, Switzerland. This article is an open access article distributed under the terms and conditions of the Creative Commons Attribution (CC BY) license (https://creativecommons.org/licenses/by/4.0/).
Share and Cite
Vigata, M.; O’Connell, C.D.; Cometta, S.; Hutmacher, D.W.; Meinert, C.; Bock, N. Gelatin Methacryloyl Hydrogels for the Localized Delivery of Cefazolin. Polymers 2021, 13, 3960. https://doi.org/10.3390/polym13223960
Vigata M, O’Connell CD, Cometta S, Hutmacher DW, Meinert C, Bock N. Gelatin Methacryloyl Hydrogels for the Localized Delivery of Cefazolin. Polymers. 2021; 13(22):3960. https://doi.org/10.3390/polym13223960
Chicago/Turabian StyleVigata, Margaux, Cathal D. O’Connell, Silvia Cometta, Dietmar W. Hutmacher, Christoph Meinert, and Nathalie Bock. 2021. "Gelatin Methacryloyl Hydrogels for the Localized Delivery of Cefazolin" Polymers 13, no. 22: 3960. https://doi.org/10.3390/polym13223960