
Long-Term Thermal Aging of Modified Sylgard 184 Formulations


Abstract
:
1. Introduction
2. Materials and Methods
2.1. Materials
2.2. Sylgard 184 Formulations
2.3. Thermal Accelerated Aging
2.4. Chemical Characterization Techniques
2.5. Mechanical Characterization Techniques
2.6. Thermal Characterization Techniques
3. Results and Discussion
3.1. Material Properties of Pristine Samples
3.2. Mechanisms for Aging under Nitrogen
3.3. Material Properties of Aged Samples
4. Conclusions
Author Contributions
Funding
Data Availability Statement
Acknowledgments
Conflicts of Interest
Appendix A


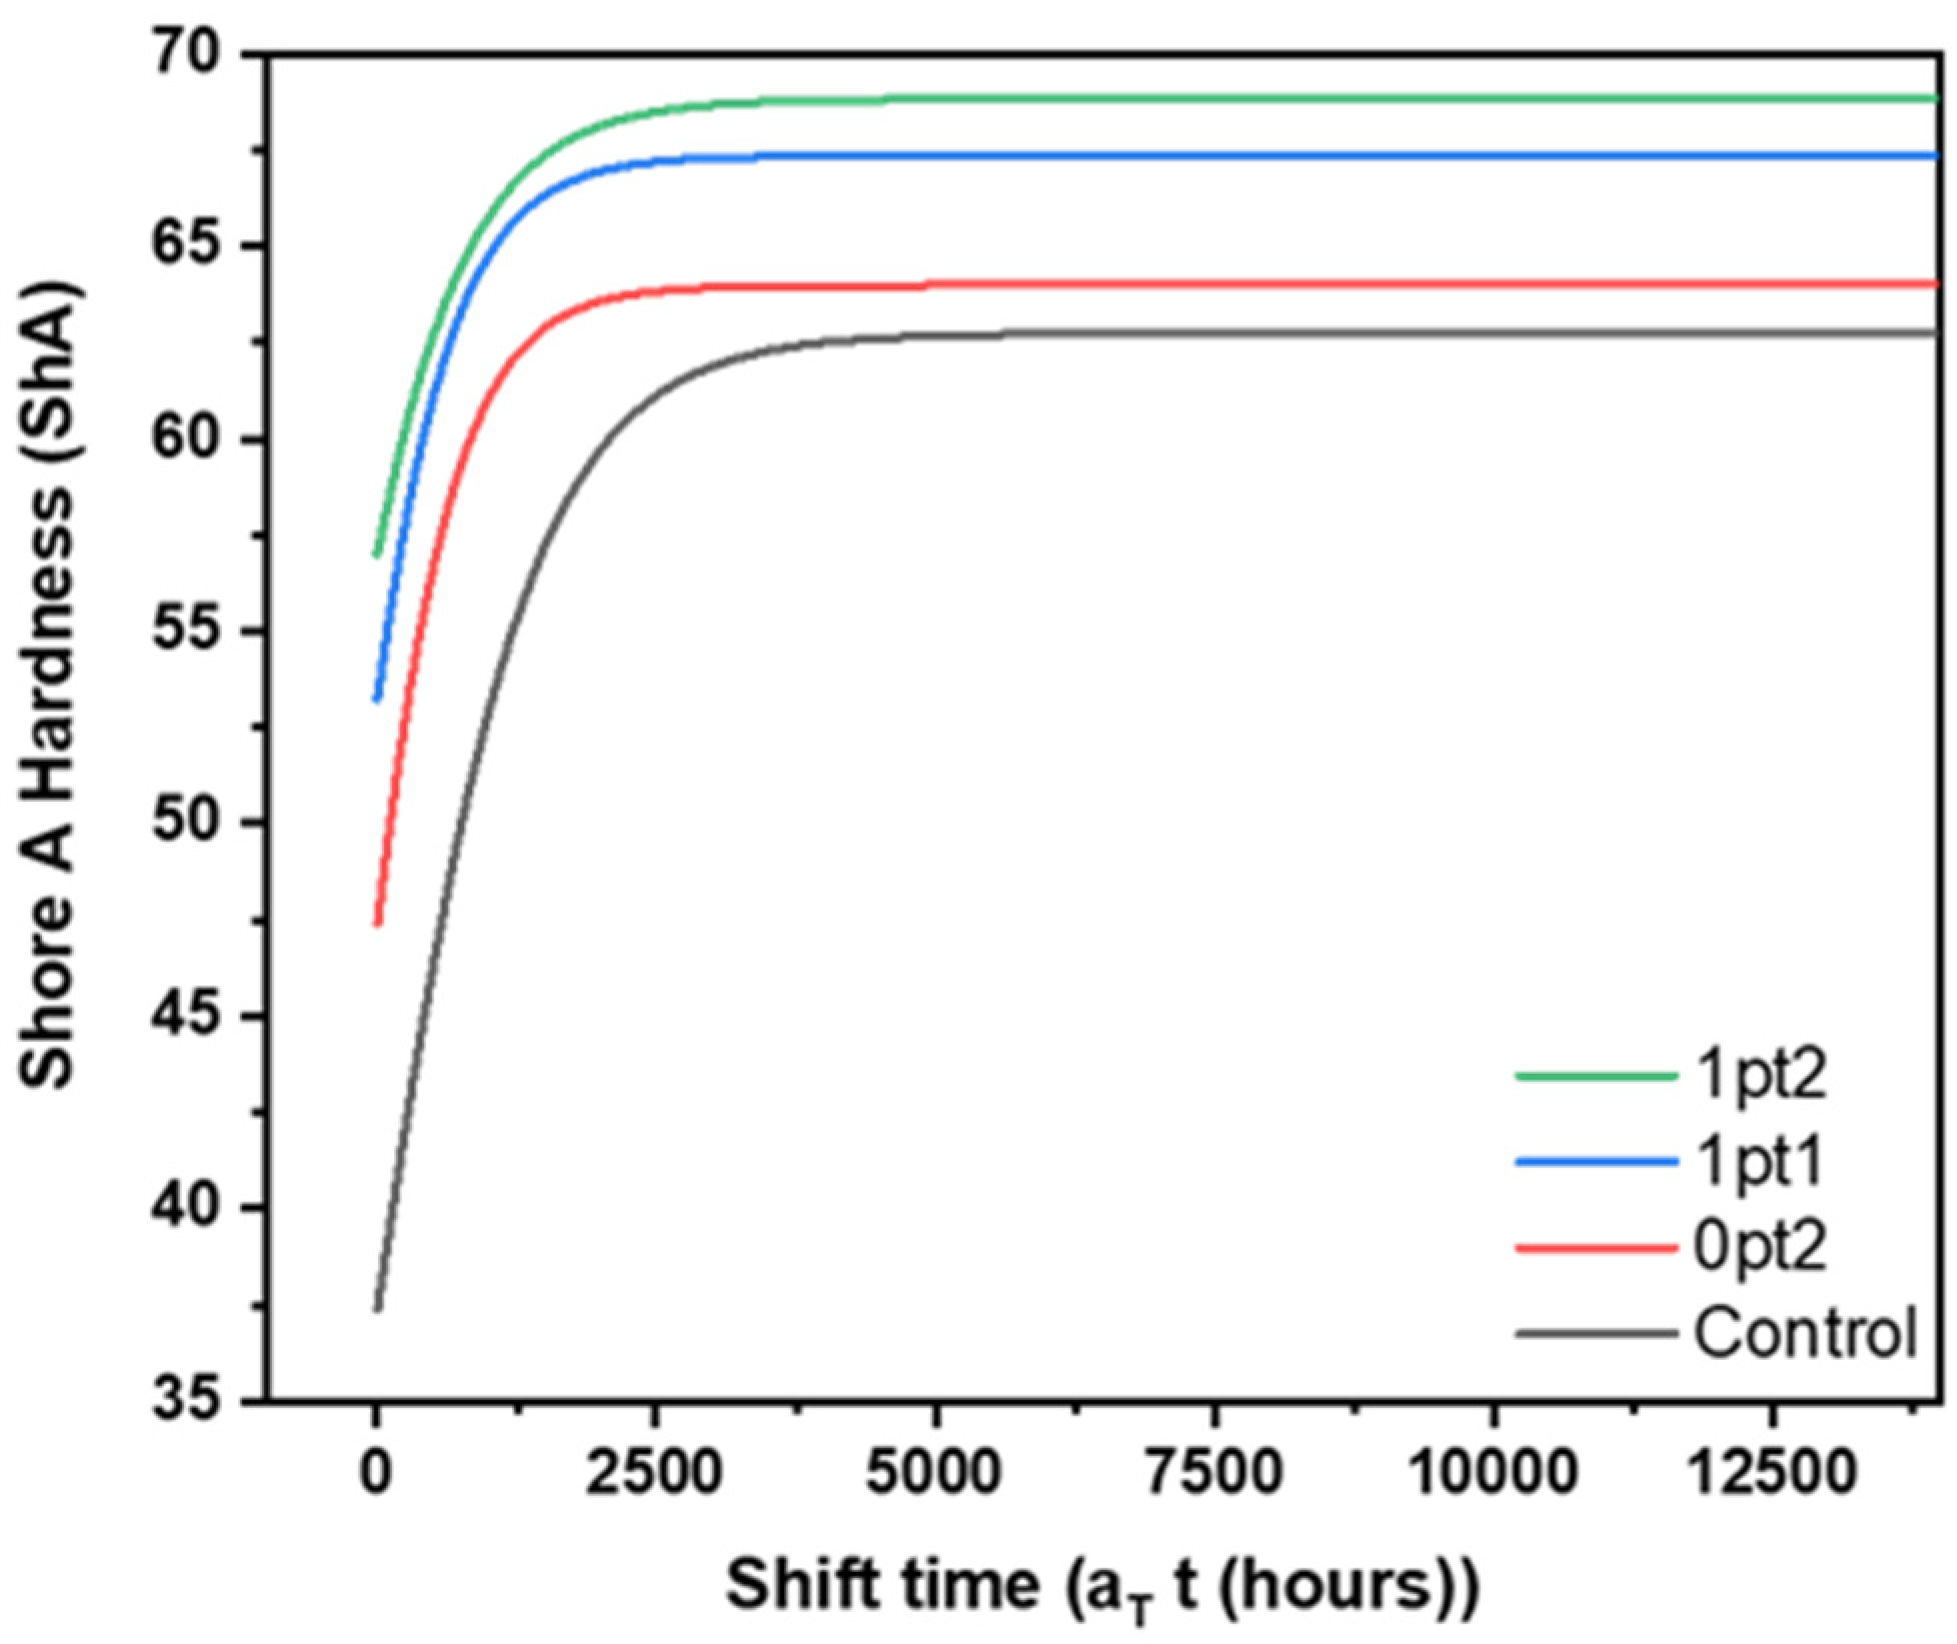
| Formulation | |||
|---|---|---|---|
| Control | 62.73 | 0.0013 | −300 |
| 0pt2 | 63.98 | 0.0020 | −525 |
| 1pt1 | 67.34 | 0.0019 | −700 |
| 1pt2 | 68.82 | 0.0015 | −1050 |

References
- Harley, S.J.; Glascoe, E.A.; Maxwell, R.S. Thermodynamic Study on Dynamic Water Vapor Sorption in Sylgard-184. J. Phys. Chem. B 2012, 116, 14183–14190. [Google Scholar] [CrossRef]
- Kendrick, T.; Parbhoo, B.; White, J. Appendix to ‘Siloxane polymers and copolymers’. In The Silicon–Heteroatom Bond; John Wiley & Sons Ltd. Baffins Lane: Chichester, UK, 1991; pp. 141–150. [Google Scholar]
- Olima, M. Mechanical Characterization of Polydimethylsiloxane. Master’s Thesis, The University of Oklahoma, Parrington Oval, Normal, OK, USA, 2017. [Google Scholar]
- Owen, M.J. Siloxane Surface Activity; American Chemical Society (ACS): Washington, DC, USA, 1989; pp. 705–739. [Google Scholar]
- Schneider, F.; Draheim, J.; Kamberger, R.; Wallrabe, U. Process and material properties of polydimethylsiloxane (PDMS) for Optical MEMS. Sens. Actuators A Phys. 2009, 151, 95–99. [Google Scholar] [CrossRef]
- Lee, J.N.; Park, A.C.; Whitesides, G.M. Solvent Compatibility of Poly(dimethylsiloxane)-Based Microfluidic Devices. Anal. Chem. 2003, 75, 6544–6554. [Google Scholar] [CrossRef]
- Henrey, M.; Tellez, J.; Wormnes, K.; Pambaguian, L.; Menon, C. Sticking in space: Manufacturing dry adhesives and testing their performance in space environments. In Proceedings of the 12th Symposium on Advanced Space Technologies in Robotics and Automation, Noordwijk, The Netherlands, 15–17 May 2013. [Google Scholar]
- Dow, SYLGARD™184 Silicone Elastomer Technical Data Sheet. 2017. Available online: https://www.dow.com/en-us/pdp.sylgard-184-silicone-elastomer-kit.01064291z.html (accessed on 12 September 2021).
- Ortiz-Acosta, D. Sylgard® Cure Inhibition Characterization; Los Alamos National Lab. (LANL): Los Alamos, NM, USA, 2012. [Google Scholar]
- Marciniec, B. Comprehensive Handbook on Hydrosilylation; Elsevier: Amsterdam, The Netherlands, 2013. [Google Scholar]
- Hammouch, S.O.; Beinert, G.; Herz, J. Contribution to a better knowledge of the crosslinking reaction of polydimethylsiloxane (PDMS) by end-linking: The formation of star-branched PDMS by the hydrosilylation reaction. Polymer 1996, 37, 3353–3360. [Google Scholar] [CrossRef]
- Marciniec, B. Hydrosilylation: A Comprehensive Review on Recent Advances; Springer: Dordrecht, The Netherlands, 2009. [Google Scholar]
- Murphy, E.; Dumont, J.H.; Park, C.H.; Kestell, G.; Lee, K.; Labouriau, A. Tailoring properties and processing of Sylgard 184: Curing time, adhesion, and water affinity. J. Appl. Polym. Sci. 2020, 137, 48530. [Google Scholar] [CrossRef]
- Gao, J.; Guo, D.; Santhanam, S.; Fedder, G.K. Material Characterization and Transfer of Large-Area Ultra-Thin Polydimethylsiloxane Membranes. J. Microelectromech. Syst. 2015, 24, 2170–2177. [Google Scholar] [CrossRef]
- Bello, M.; Welch, C.; Goodwin, L.; Keller, J. Sylgard® Mixing Study; Los Alamos National Lab. (LANL): Los Alamos, NM, USA, 2014. [Google Scholar]
- Eddington, D.T.; Crone, W.C.; Beebe, D.J. Development of process protocols to fine tune polydimethylsiloxane material properties. In Proceedings of the 7th International Conference on Miniaturized Chemical and Biochemical Analysis Systems, Squaw Valley, CA, USA, 5–9 October 2003. [Google Scholar]
- Barnes, S.; Riley, S.; Wolfe, S. Hydrogen evolution from silicone resins for primary coating applications. IEE Proc. J Optoelectron. 1985, 132, 169–171. [Google Scholar] [CrossRef]
- Liu, M.; Sun, J.; Chen, Q. Influences of heating temperature on mechanical properties of polydimethylsiloxane. Sens. Actuators A Phys. 2009, 151, 42–45. [Google Scholar] [CrossRef]
- Luo, X.; Mather, P.T. Preparation and Characterization of Shape Memory Elastomeric Composites. Macromolecules 2009, 42, 7251–7253. [Google Scholar] [CrossRef]
- Ko, Y.-I.; Kim, B.-S.; Bae, J.-S.; Kim, Y.A.; Kim, I.-S. Silicone-coated elastomeric polylactide nanofiber filaments: Mechanical properties and shape memory behavior. RSC Adv. 2013, 3, 20091–20098. [Google Scholar] [CrossRef]
- Robertson, J.M.; Torbati, A.H.; Rodriguez, E.D.; Mao, Y.; Baker, R.M.; Qi, H.J.; Mather, P.T. Mechanically programmed shape change in laminated elastomeric composites. Soft Matter 2015, 11, 5754–5764. [Google Scholar] [CrossRef]
- Wang, C.C.; Ding, Z.; Purnawali, H.; Huang, W.M.; Fan, H.; Sun, L. Repeated Instant Self-healing Shape Memory Composites. J. Mater. Eng. Perform. 2012, 21, 2663–2669. [Google Scholar] [CrossRef]
- Orellana, J.; Moreno-Villoslada, I.; Bose, R.; Picchioni, F.; Flores, M.; Araya-Hermosilla, R. Self-Healing Polymer Nanocomposite Materials by Joule Effect. Polymers 2021, 13, 649. [Google Scholar] [CrossRef]
- Cui, H.P.; Song, C.L.; Huang, W.M.; Wang, C.C.; Zhao, Y. Rubber-like electrically conductive polymeric materials with shape memory. Smart Mater. Struct. 2013, 22, 55024. [Google Scholar] [CrossRef]
- Hong, S.; Lee, H.; Lee, J.; Kwon, J.; Han, S.; Suh, Y.D.; Cho, H.; Shin, J.; Yeo, J.; Ko, S.H. Highly Stretchable and Transparent Metal Nanowire Heater for Wearable Electronics Applications. Adv. Mater. 2015, 27, 4744–4751. [Google Scholar] [CrossRef]
- Gong, S.; Lai, D.; Su, B.; Si, K.J.; Ma, Z.; Yap, L.W.; Guo, P.; Cheng, W. Highly Stretchy Black Gold E-Skin Nanopatches as Highly Sensitive Wearable Biomedical Sensors. Adv. Electron. Mater. 2015, 1, 1400063. [Google Scholar] [CrossRef]
- Lay, M.; Ramli, M.R.; Ramli, R.; Mang, N.C.; Ahmad, Z. Crosslink network and phenyl content on the optical, hardness, and thermal aging of PDMS LED encapsulant. J. Appl. Polym. Sci. 2019, 136, 47895. [Google Scholar] [CrossRef]
- Ghosh, D.; Khastgir, D. Degradation and Stability of Polymeric High-Voltage Insulators and Prediction of Their Service Life through Environmental and Accelerated Aging Processes. ACS Omega 2018, 3, 11317–11330. [Google Scholar] [CrossRef]
- Yeh, C.-H.; Dowland, M.; Schmidt, R.G.; Shull, K.R. Fracture and thermal aging of resin-filled silicone elastomers. J. Polym. Sci. Part B Polym. Phys. 2015, 54, 263–273. [Google Scholar] [CrossRef]
- Labouriau, A.; Robison, T.; Meincke, L.; Wrobleski, D.; Taylor, D.; Gill, J. Aging mechanisms in RTV polysiloxane foams. Polym. Degrad. Stab. 2015, 121, 60–68. [Google Scholar] [CrossRef] [Green Version]
- Labouriau, A.; Cox, J.D.; Schoonover, J.R.; Patterson, B.; Havrilla, G.; Stephens, T.; Taylor, D. Mössbauer, NMR and ATR-FTIR spectroscopic investigation of degradation in RTV siloxane foams. Polym. Degrad. Stab. 2007, 92, 414–424. [Google Scholar] [CrossRef]
- Labouriau, A.; Cady, C.; Gill, J.; Stull, J.; Ortiz-Acosta, D.; Henderson, K.; Hartung, V.; Quintana, A.; Celina, M. Gamma irradiation and oxidative degradation of a silica-filled silicone elastomer. Polym. Degrad. Stab. 2015, 116, 62–74. [Google Scholar] [CrossRef] [Green Version]
- Barnes, S.; Riley, S.; Wolfe, S. Hydrogen evolution behaviour of silicone-coated optical fibres. Electron. Lett. 1985, 21, 712–713. [Google Scholar] [CrossRef]
- Materials Handling Guide: Hydrogen-Bonded Silicon Compounds. Developed by the Operating Safety Committees of the Silicones Environmental, Health and Safety Center (SEHSC), CES-Silicones Europe (CES), in partnership with the Silicones Industry Association of Japan (SIAJ). July 2016. Available online: https://globalsilicones.org/wp-content/uploads/2020/10/Global-SiH-Manual.pdf (accessed on 12 September 2021).
- Manders, W.F.; Bellama, J.M. Multiphoton infrared laser-induced degradation of polydimethylsiloxane and hexamethyldisiloxane. J. Polym. Sci. Polym. Chem. Ed. 1985, 23, 351–357. [Google Scholar] [CrossRef]
- Grassie, N.; Macfarlane, I. The thermal degradation of polysiloxanes—I. Poly (dimethylsiloxane). Eur. Polym. J. 1978, 14, 875–884. [Google Scholar] [CrossRef]
- Camino, G.; Lomakin, S.; Lazzari, M. Polydimethylsiloxane thermal degradation Part 1. Kinetic aspects. Polymer 2001, 42, 2395–2402. [Google Scholar] [CrossRef]
- Thomas, T.H.; Kendrick, T.C. Thermal analysis of polysiloxanes. II. Thermal vacuum degradation of polysiloxanes with different substituents on silicon and in the main siloxane chain. J. Polym. Sci. Part A-2 Polym. Phys. 1970, 8, 1823–1830. [Google Scholar] [CrossRef]
- Camino, G.; Lomakin, S.; Lageard, M. Thermal polydimethylsiloxane degradation. Part 2. The degradation mechanisms. Polymer 2002, 43, 2011–2015. [Google Scholar] [CrossRef]
- Belot, V.; Corriu, R.J.P.; Leclercq, D.; Mutin, P.H.; Vioux, A. Thermal redistribution reactions in crosslinked polysiloxanes. J. Polym. Sci. Part A Polym. Chem. 1992, 30, 613–623. [Google Scholar] [CrossRef]
- Thomas, T.H.; Kendrick, T.C. Thermal analysis of polydimethylsiloxanes. I. Thermal degradation in controlled atmospheres. J. Polym. Sci. Part A-2 Polym. Phys. 1969, 7, 537–549. [Google Scholar] [CrossRef]
- Hukins, D.; Mahomed, A.; Kukureka, S. Accelerated aging for testing polymeric biomaterials and medical devices. Med. Eng. Phys. 2008, 30, 1270–1274. [Google Scholar] [CrossRef] [PubMed]
- Goliszek, M.; Podkościelna, B.; Sevastyanova, O.; Fila, K.; Chabros, A.; Pączkowski, P. Investigation of accelerated aging of lignin-containing polymer materials. Int. J. Biol. Macromol. 2019, 123, 910–922. [Google Scholar] [CrossRef]
- Celina, M.; Gillen, K.; Assink, R. Accelerated aging and lifetime prediction: Review of non-Arrhenius behaviour due to two competing processes. Polym. Degrad. Stab. 2005, 90, 395–404. [Google Scholar] [CrossRef]
- Celina, M.; Linde, E.; Brunson, D.; Quintana, A.; Giron, N. Overview of accelerated aging and polymer degradation kinetics for combined radiation-thermal environments. Polym. Degrad. Stab. 2019, 166, 353–378. [Google Scholar] [CrossRef]
- Celina, M.C. Review of polymer oxidation and its relationship with materials performance and lifetime prediction. Polym. Degrad. Stab. 2013, 98, 2419–2429. [Google Scholar] [CrossRef]
- Zheng, Z.; Xia, X.; Zeng, X.; Li, X.; Wu, Y.; Liu, J.; Zhang, L. Theoretical Model of Time-Temperature Superposition Principle of the Self-Healing Kinetics of Supramolecular Polymer Nanocomposites. Macromol. Rapid Commun. 2018, 39, e1800382. [Google Scholar] [CrossRef]
- Li, R. Time-temperature superposition method for glass transition temperature of plastic materials. Mater. Sci. Eng. A 2000, 278, 36–45. [Google Scholar] [CrossRef]
- Galliano, A.; Bistac, S.; Schultz, J. Adhesion and friction of PDMS networks: Molecular weight effects. J. Colloid Interface Sci. 2003, 265, 372–379. [Google Scholar] [CrossRef]
- Büyüktanir, E.A.N.; Küçükyavuz, Z. Solution properties of poly (dimethyl siloxane). J. Polym. Sci. Part B Polym. Phys. 2000, 38, 2678–2686. [Google Scholar] [CrossRef]
- Morariu, S.; Brunchi, C.E.; Cazacu, M.; Bercea, M. The Behavior of Poly(dimethylsiloxane-co-diphenylsiloxane)s in Good and Theta Solvents. J. Chem. Eng. Data 2011, 56, 1468–1475. [Google Scholar] [CrossRef]
- Chassé, W.; Lang, M.; Sommer, J.-U.; Saalwächter, K. Cross-Link Density Estimation of PDMS Networks with Precise Consideration of Networks Defects. Macromolecules 2012, 45, 899–912, Erratum in 2015, 48, 1267–1268. [Google Scholar] [CrossRef]
- Valentín, J.L.; González, J.C.; Mora-Barrantes, I.; Chassé, W.; Saalwächter, K. Uncertainties in the Determination of Cross-Link Density by Equilibrium Swelling Experiments in Natural Rubber. Macromolecules 2008, 41, 4717–4729. [Google Scholar] [CrossRef]
- Muramoto, A. Studies on the Interaction Parameter in Polysiloxane Solutions. Polym. J. 1970, 1, 450–456. [Google Scholar] [CrossRef] [Green Version]
- Horkay, F.; Hecht, A.-M.; Geissler, E. Thermodynamic interaction parameters in polymer solutions and gels. J. Polym. Sci. Part B Polym. Phys. 1995, 33, 1641–1646. [Google Scholar] [CrossRef]
- Bueche, A.M. Interaction of polydimethylsiloxanes with swelling agents. J. Polym. Sci. 1955, 15, 97–103. [Google Scholar] [CrossRef]
- Favre, E. Swelling of crosslinked polydimethylsiloxane networks by pure solvents: Influence of temperature. Eur. Polym. J. 1996, 32, 1183–1188. [Google Scholar] [CrossRef]
- Dimitriyev, M.S.; Chang, Y.-W.; Goldbart, P.M.; Fernández-Nieves, A. Swelling thermodynamics and phase transitions of polymer gels. Nano Futur. 2019, 3, 042001. [Google Scholar] [CrossRef] [Green Version]
- Pacios, I.E.; Molina, M.J.; Gómez-Antón, M.R.; Piérola, I.F. Correlation of swelling and crosslinking density with the composition of the reacting mixture employed in radical crosslinking copolymerization. J. Appl. Polym. Sci. 2006, 103, 263–269. [Google Scholar] [CrossRef]
- Oh, K.S.; Oh, J.S.; Choi, H.S.; Bae, Y.C. Effect of Cross-Linking Density on Swelling Behavior of NIPA Gel Particles. Macromolecules 1998, 31, 7328–7335. [Google Scholar] [CrossRef]
- Gwaily, S.; Badawy, M.; Hassan, H.; Madani, M. Influence of thermal aging on crosslinking density of boron carbide/natural rubber composites. Polym. Test. 2003, 22, 3–7. [Google Scholar] [CrossRef]
- Lampe, F.W.; Franklin, J.L.; Field, F.H. Cross Sections for Ionization by Electrons. J. Am. Chem. Soc. 1957, 79, 6129–6132. [Google Scholar] [CrossRef]
- Prabowo, F.; Wing-Keung, A.L.; Shen, H.H. Effect of Curing Temperature and Cross-Linker to Pre-Polymer Ratio on the Viscoelastic Properties of a PDMS Elastomer. Adv. Mater. Res. 2015, 1112, 410–413. [Google Scholar] [CrossRef]
- Johnston, I.; McCluskey, D.; Tan, C.K.L.; Tracey, M. Mechanical characterization of bulk Sylgard 184 for microfluidics and microengineering. J. Micromech. Microeng. 2014, 24, 035017. [Google Scholar] [CrossRef]
- Efimenko, K.; Wallace, W.E.; Genzer, J. Surface Modification of Sylgard-184 Poly(dimethyl siloxane) Networks by Ultraviolet and Ultraviolet/Ozone Treatment. J. Colloid Interface Sci. 2002, 254, 306–315. [Google Scholar] [CrossRef]
- Hanu, L.; Simon, G.; Cheng, Y.-B. Thermal stability and flammability of silicone polymer composites. Polym. Degrad. Stab. 2006, 91, 1373–1379. [Google Scholar] [CrossRef]
- Johnson, R., Jr.; Biefeld, R.; Sayre, J. High-temperature electrical conductivity and thermal decomposition of Sylgard® 184 and mixtures containing hollow microspherical fillers. Polym. Eng. Sci. 1984, 24, 435–441. [Google Scholar] [CrossRef]
- Rucigaj, A.; Krajnc, M.; Sebenik, U. Kinetic study of thermal degradation of polydimethylsiloxane: The effect of molecular weight on thermal stability in inert atmosphere. Polym. Sci. 2017, 3, 9. [Google Scholar]
- Planes, M.; Le Coz, C.; Soum, A.; Carlotti, S.; Rejsek-Riba, V.; Lewandowski, S.; Remaury, S.; Solé, S. Polydimethylsiloxane/Additive Systems for Thermal and Ultraviolet Stability in Geostationary Environment. J. Spacecr. Rocket. 2016, 53, 1128–1133. [Google Scholar] [CrossRef] [Green Version]
- Örn, A. Degradation Studies on Polydimethylsiloxane. Master’s Thesis, Åbo Akademi University, Turku, Finland, 2019. [Google Scholar]
- Liu, J.; Zong, G.; He, L.; Zhang, Y.; Liu, C.; Wang, L. Effects of Fumed and Mesoporous Silica Nanoparticles on the Properties of Sylgard 184 Polydimethylsiloxane. Micromachines 2015, 6, 855–864. [Google Scholar] [CrossRef] [Green Version]
- Müller, A.; Wapler, M.C.; Wallrabe, U. A quick and accurate method to determine the Poisson’s ratio and the coefficient of thermal expansion of PDMS. Soft Matter 2019, 15, 779–784. [Google Scholar] [CrossRef] [Green Version]
- Kong, K.; Mariatti, M.; A.Rashid, A.; Busfield, J. Enhanced conductivity behavior of polydimethylsiloxane (PDMS) hybrid composites containing exfoliated graphite nanoplatelets and carbon nanotubes. Compos. Part B Eng. 2014, 58, 457–462. [Google Scholar] [CrossRef]
- Rücker, C.; Kümmerer, K. Environmental Chemistry of Organosiloxanes. Chem. Rev. 2015, 115, 466–524. [Google Scholar] [CrossRef]
- Ducom, G.; Laubie, B.; Ohannessian, A.; Chottier, C.; Germain, P.; Chatain, V. Hydrolysis of polydimethylsiloxane fluids in controlled aqueous solutions. Water Sci. Technol. 2013, 68, 813–820. [Google Scholar] [CrossRef]
- West, J.K. Theoretical analysis of hydrolysis of polydimethylsiloxane (PDMS). J. Biomed. Mater. Res. 1997, 35, 505–511. [Google Scholar] [CrossRef]
- Venkatachalam, S.; Hourlier, D. Heat treatment of commercial Polydimethylsiloxane PDMS precursors: Part I. Towards conversion of patternable soft gels into hard ceramics. Ceram. Int. 2019, 45, 6255–6262. [Google Scholar] [CrossRef]
- Bahloul-Hourlier, D.; Latournerie, J.; Dempsey, P. Reaction pathways during the thermal conversion of polysiloxane precursors into oxycarbide ceramics. J. Eur. Ceram. Soc. 2005, 25, 979–985. [Google Scholar] [CrossRef]
- Antosik, A.K.; Bednarczyk, P.; Czech, Z. Aging of silicone pressure-sensitive adhesives. Polym. Bull. 2017, 75, 1141–1147. [Google Scholar] [CrossRef] [Green Version]
- McIntosh, K.; Cotsell, J.; Cumpston, J.; Norris, A.; Powell, N.; Ketola, B. The Effect of Accelerated Aging Tests on the Optical Properties of Silicone and EVA Encapsulants. In Proceedings of the 24th European Photovoltaic Solar Energy Conference, Hamburg, Germany, 21–25 September 2009; pp. 3475–3482. [Google Scholar]
- Cifter, E.D.; Ozdemir-Karatas, M.; Cinarli, A.; Sancakli, E.; Balik, A.; Evlioglu, G. In vitro study of effects of aging and processing conditions on colour change in maxillofacial silicone elastomers. BMC Oral Health 2019, 19, 122. [Google Scholar] [CrossRef]
- Gary, J.J.; Smith, C.T. Pigments and their application in maxillofacial elastomers: A literature review. J. Prosthet. Dent. 1998, 80, 204–208. [Google Scholar] [CrossRef]


| Formulation Name | wt% TDS | wt% Asbhy—Karstedt Catalyst |
|---|---|---|
| Control | 0 | 0 |
| 0pt2 | 0 | 0.2 |
| 1pt1 | 1 | 0.1 |
| 1pt2 | 1 | 0.2 |
| Formulation | Maximum Elongation (%) | Maximum Stress (MPa) | Young’s Modulus (MPa) | Shore A Hardness (ShA) |
|---|---|---|---|---|
| Control | 74 ± 3 | 10.4 ± 0.7 | 5.74 ± 0.27 | 64.3 ± 0.3 |
| 0pt2 | 65 ± 5 | 8.8 ± 1.4 | 6.23 ± 0.32 | 66.4 ± 0.5 |
| 1pt1 | 70 ± 3 | 10.8 ± 1.1 | 6.86 ± 0.23 | 67.3 ± 0.8 |
| 1pt2 | 63 ± 3 | 9.3 ± 1.2 | 6.91 ± 0.40 | 68.4 ± 0.7 |
Publisher’s Note: MDPI stays neutral with regard to jurisdictional claims in published maps and institutional affiliations. |
© 2021 by the authors. Licensee MDPI, Basel, Switzerland. This article is an open access article distributed under the terms and conditions of the Creative Commons Attribution (CC BY) license (https://creativecommons.org/licenses/by/4.0/).
Share and Cite
Brounstein, Z.; Zhao, J.; Geller, D.; Gupta, N.; Labouriau, A. Long-Term Thermal Aging of Modified Sylgard 184 Formulations. Polymers 2021, 13, 3125. https://doi.org/10.3390/polym13183125
Brounstein Z, Zhao J, Geller D, Gupta N, Labouriau A. Long-Term Thermal Aging of Modified Sylgard 184 Formulations. Polymers. 2021; 13(18):3125. https://doi.org/10.3390/polym13183125
Chicago/Turabian StyleBrounstein, Zachary, Jianchao Zhao, Drew Geller, Nevin Gupta, and Andrea Labouriau. 2021. "Long-Term Thermal Aging of Modified Sylgard 184 Formulations" Polymers 13, no. 18: 3125. https://doi.org/10.3390/polym13183125