
Numerical Methods in Studies of Liquid Crystal Elastomers

Abstract
:
1. Introduction
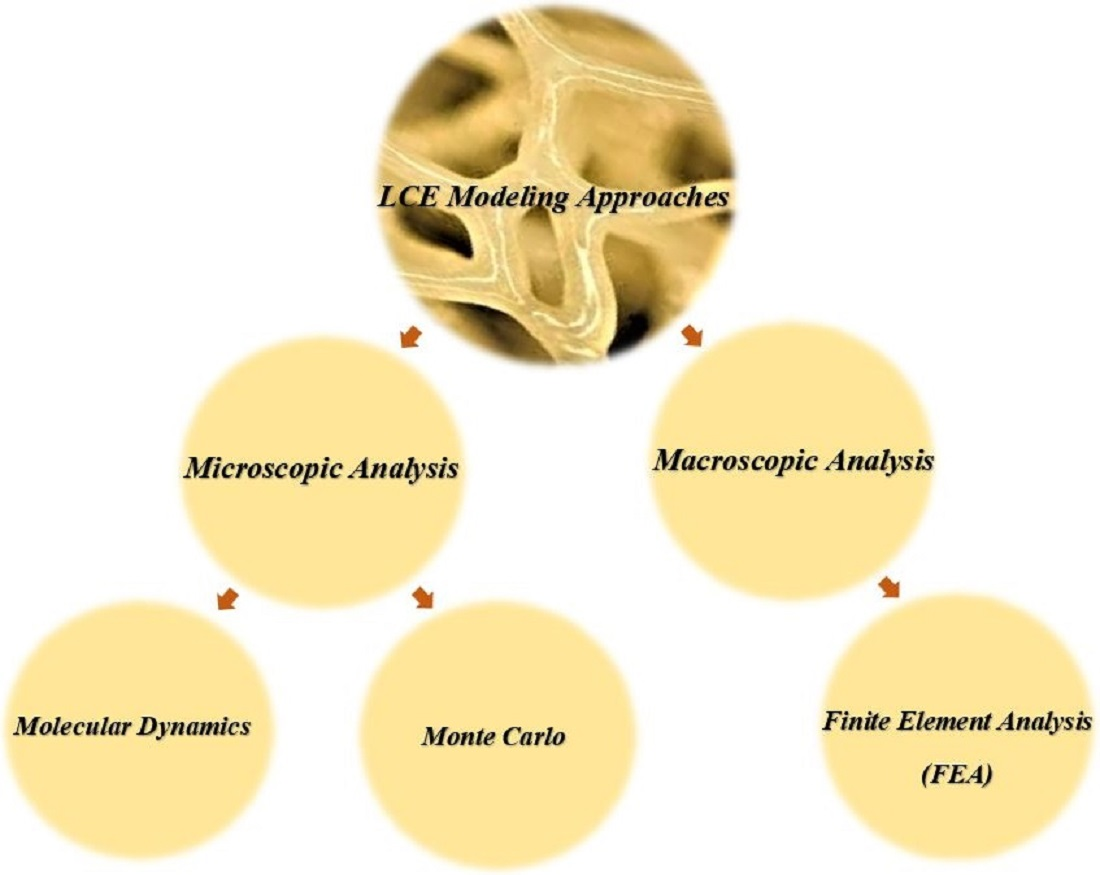
2. LCE Modeling Approaches
3. Finite Element Analysis (FEA)
3.1. Commercial Software
3.2. In-House Coding
4. Monte Carlo Simulations
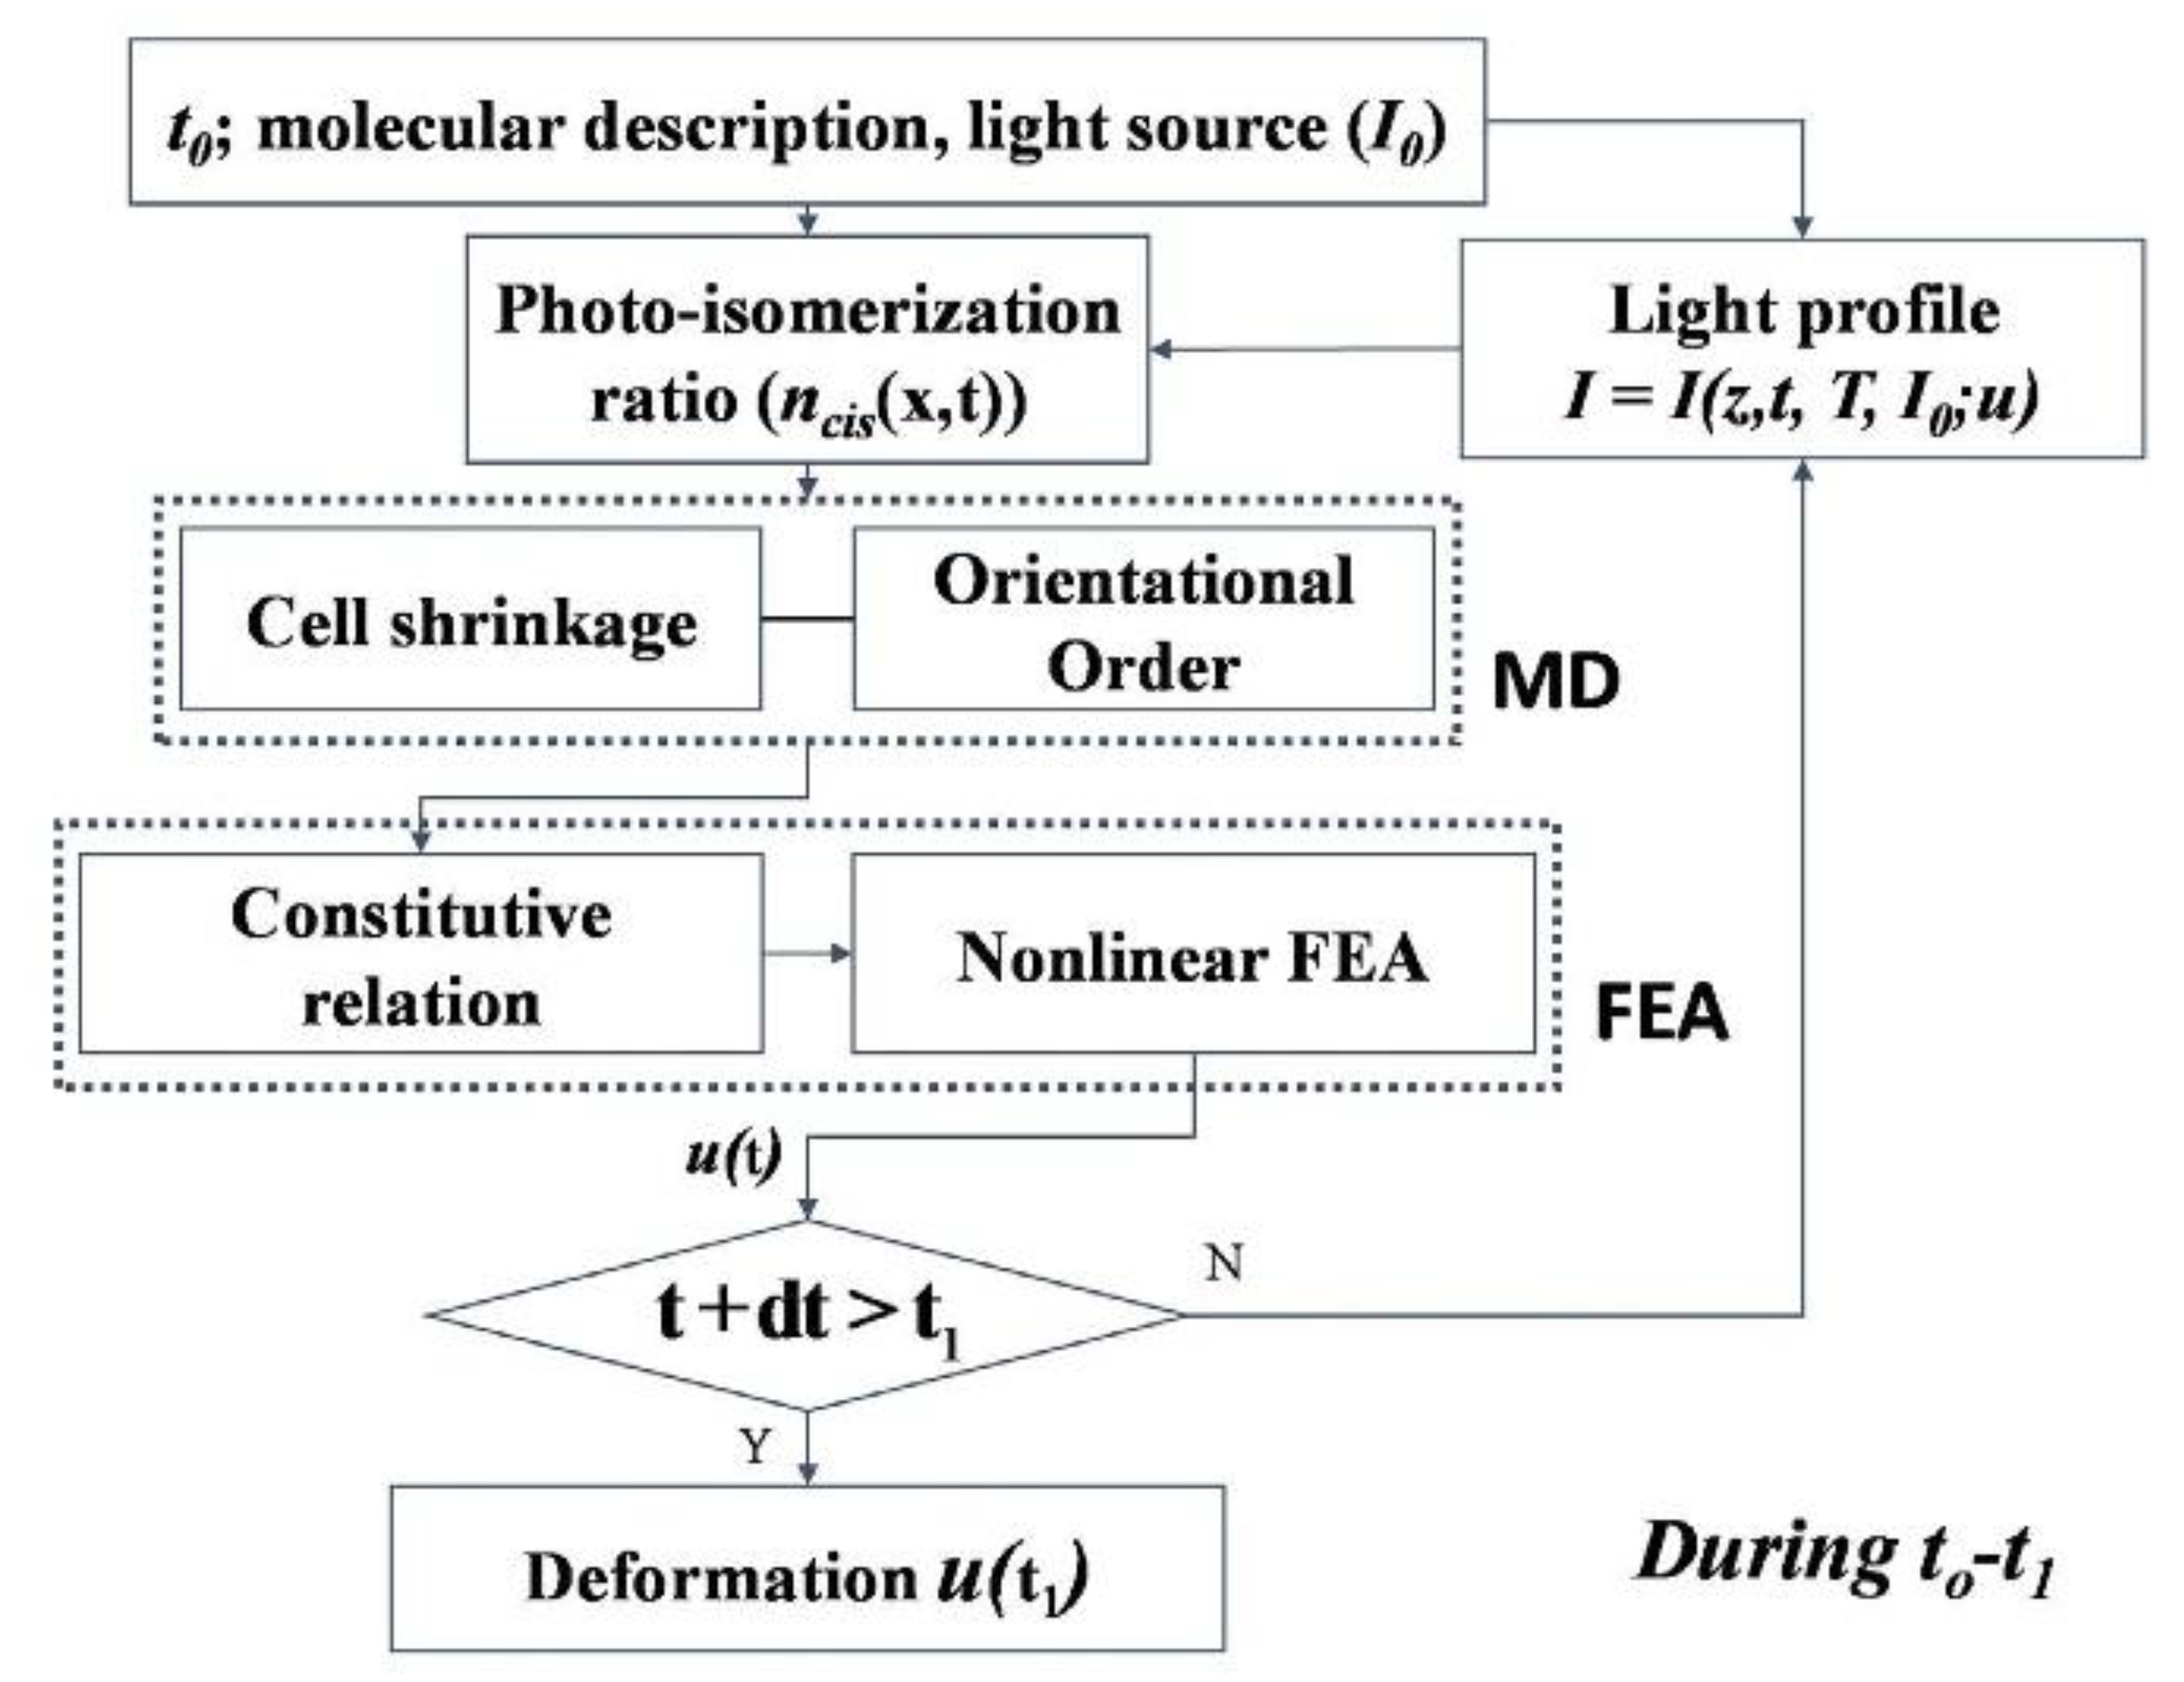
- The mechanism of a deformation of a thin LCE, under non-uniform illumination of visible light, can be understood in the framework of FG modeling. For such thin LCE, the temperature dependence of physical quantities can be evaluated.
- The second is the deformation of LCE under external electric fields. The variables σ is aligned, either along or vertical to an electric field, and deformation of LCE is expected to be independent of how σ is aligned. Finally, the J-shaped stress–strain diagram of biological materials, e.g., blood vessels and skin, can also be considered in the scope of FG modeling.
5. Molecular Dynamics Simulations
- Crosslinking led to a 5 °C increase in the smectic–isotropic temperature.
- In a creep experiment, elastomers in the isotropic phase were observed to have high elasticity.
- When the elastomer undergoes the smectic–isotropic transition, memory effects in LC sample were observed.
6. Other Numerical Methods
7. Discussion and Summary Remarks
- -
- FEM: Usable for macroscale problems for solving a set of partial differential equations based on the consideration of the continuum medium. A good option for analysis of macroscopic behavior of LCEs, mechanical deformation, bending, and stretching when exposed to external stimuli for macroscale actuators and devices such as beams, pumps, and modules with locomotive motion. Providing an opportunity of monitoring and optimizing their performance whenever needed.
- -
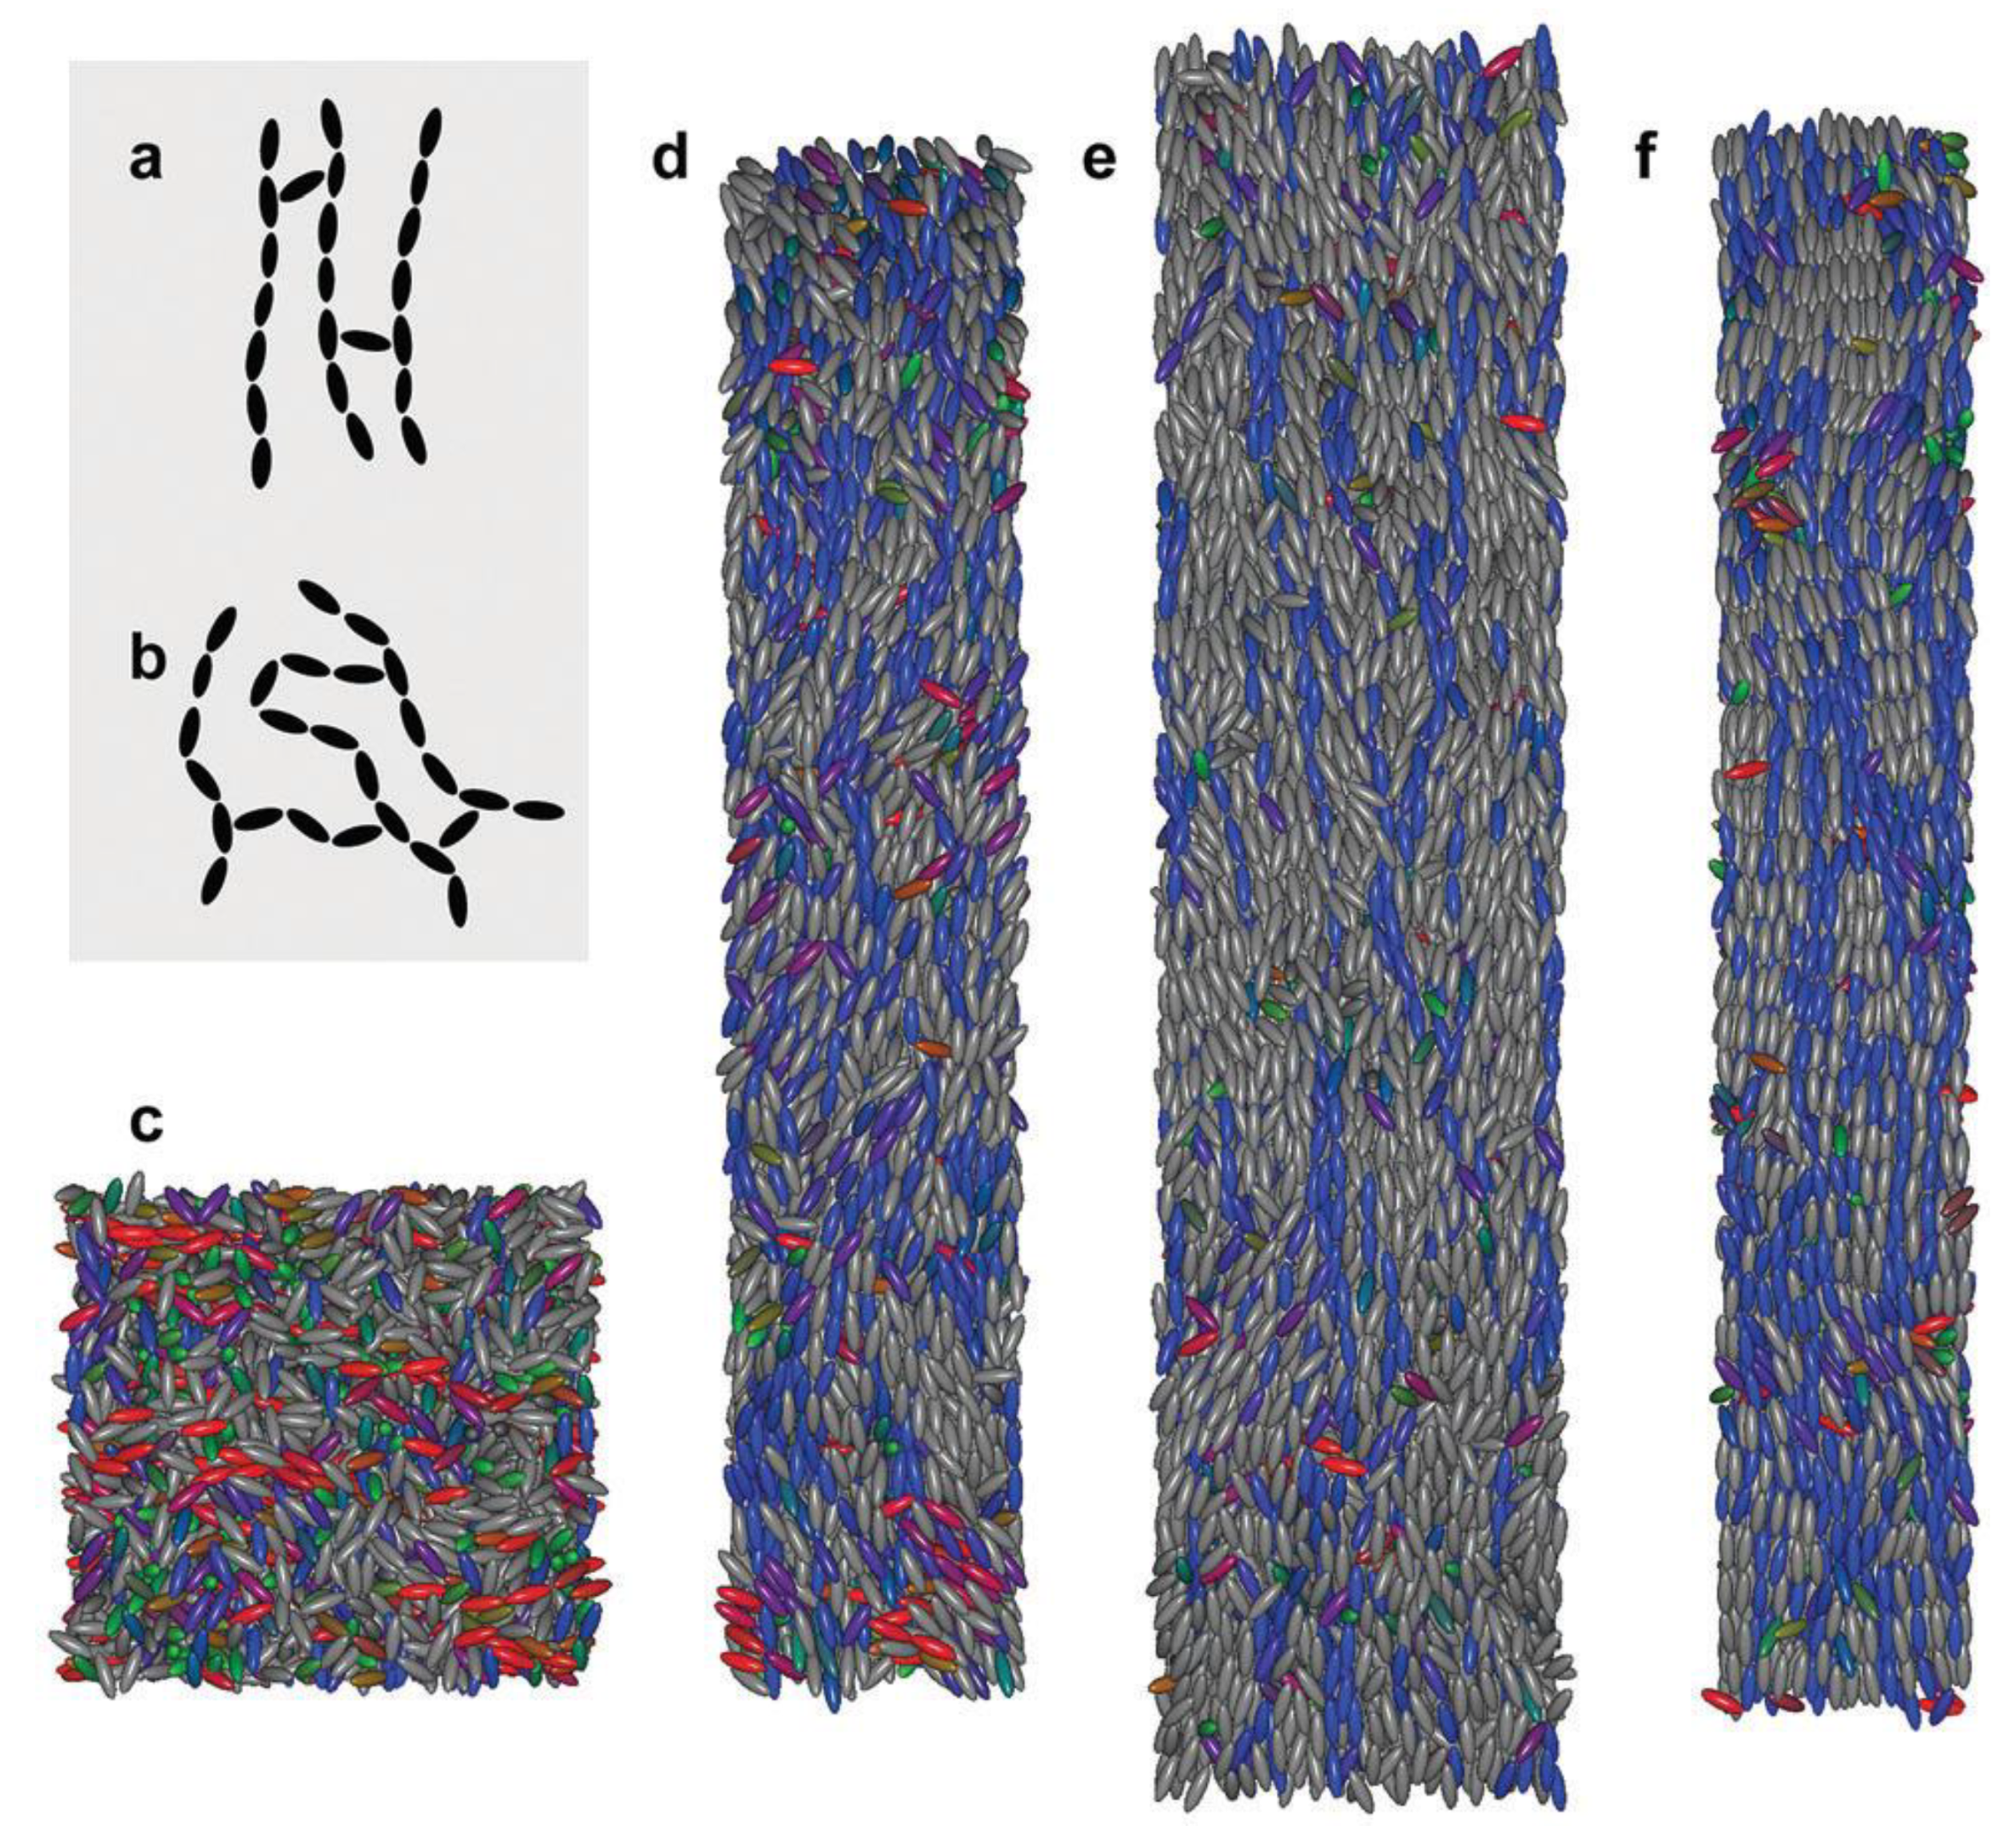
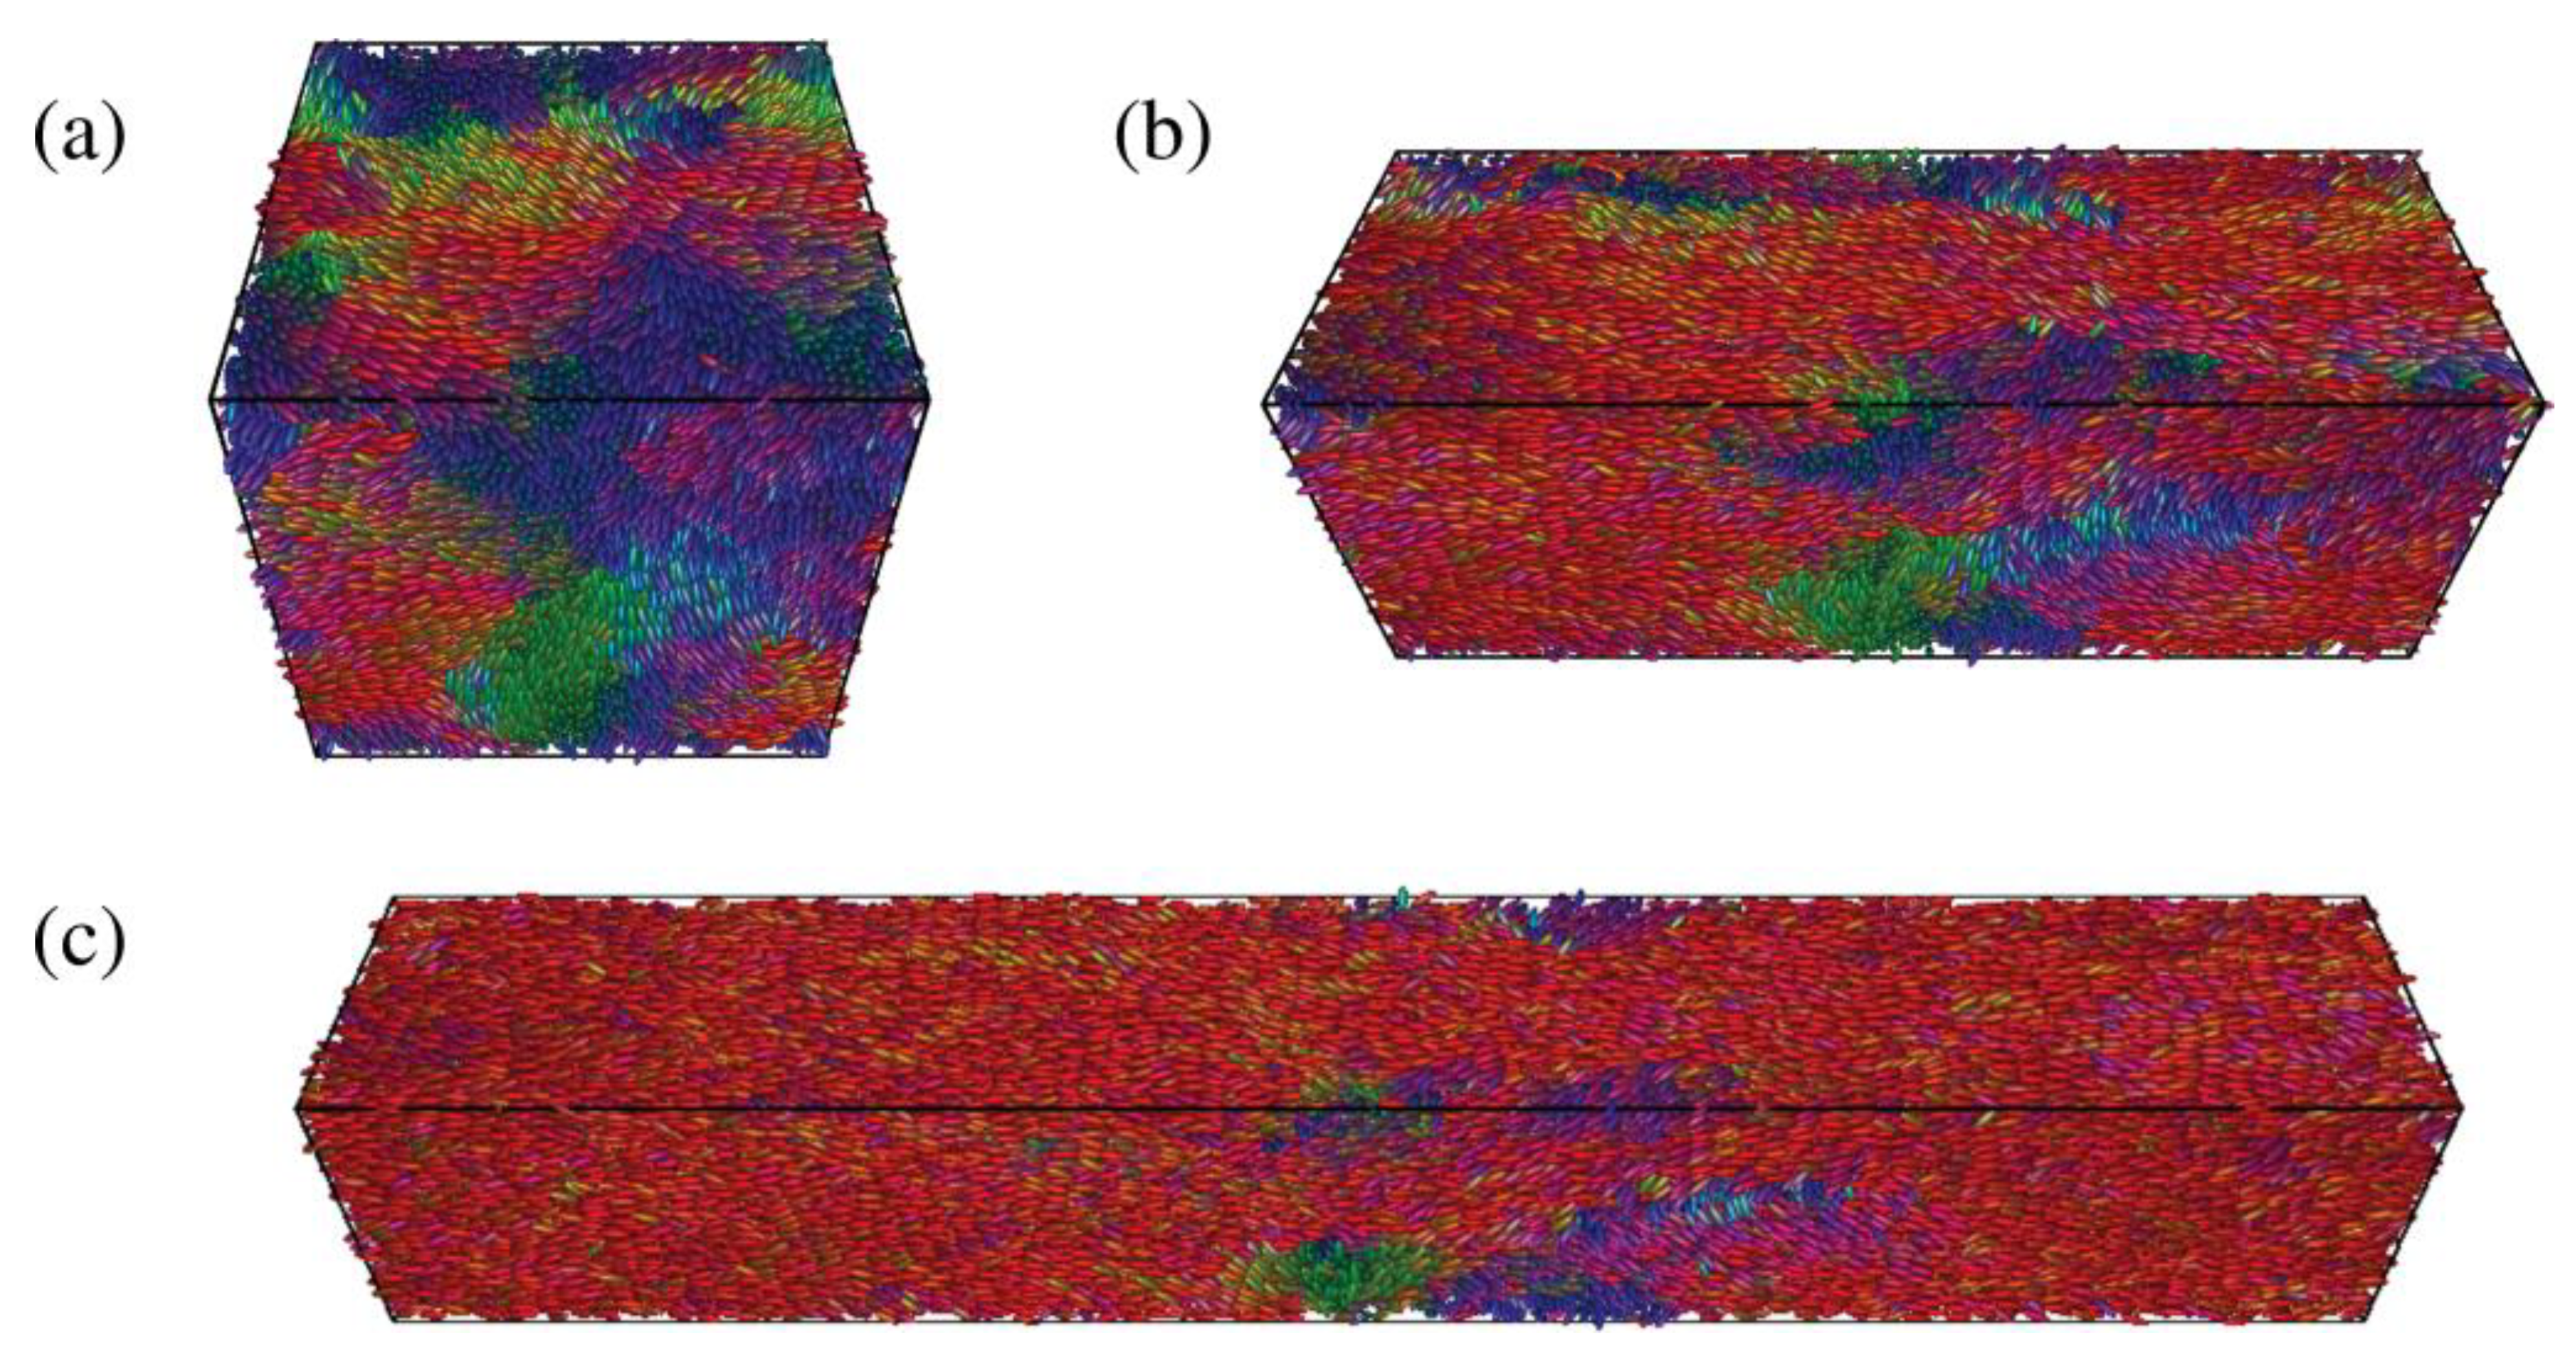
- MC: Creating a connection between molecular structures, microscopic scale and macroscopic properties of LCE phases. Developing the simulation studies in a large time and space scale in comparison to MD. As this method is not deterministic, this feature makes it a good option for simulation of the systems which are in thermodynamic equilibrium state.
- -
- MD: Capability of demonstration of how small changes at molecular scale alter the macroscopic features. A good choice for both equilibrium and time dependent studies. Since this is a deterministic method, the trajectories of molecules can be determined, so it leads this method to be a good option for understanding the interactions between small molecules. The main drawback that can be ascribed to this method is its high computational cost of modeling the behavior of molecules.
8. Conclusions
Author Contributions
Funding
Conflicts of Interest
References
- Jiang, H.; Li, C.; Huang, X. Actuators based on liquid crystalline elastomer materials. Nanoscale 2013, 5, 5225–5240. [Google Scholar] [CrossRef]
- Yamada, M.; Kondo, M.; Mamiya, J.i.; Yu, Y.; Kinoshita, M.; Barrett, C.J.; Ikeda, T. Photomobile polymer materials: Towards light-driven plastic motors. Angew. Chem. 2008, 120, 5064–5066. [Google Scholar] [CrossRef]
- Torras, N.; Zinoviev, K.; Camargo, C.; Campo, E.M.; Campanella, H.; Esteve, J.; Marshall, J.; Terentjev, E.; Omastová, M.; Krupa, I. Tactile device based on opto-mechanical actuation of liquid crystal elastomers. Sens. Actuators A Phys. 2014, 208, 104–112. [Google Scholar] [CrossRef]
- Sánchez-Ferrer, A.; Fischl, T.; Stubenrauch, M.; Albrecht, A.; Wurmus, H.; Hoffmann, M.; Finkelmann, H. Liquid-crystalline elastomer microvalve for microfluidics. Adv. Mater. 2011, 23, 4526–4530. [Google Scholar] [CrossRef] [PubMed]
- De Gennes, P.G.; Hébert, M.; Kant, R. Artificial muscles based on nematic gels. In Macromolecular Symposia; Hüthig & Wepf Verlag: Basel, Switzerland, 1997; Volume 113, pp. 39–49. [Google Scholar]
- De Gennes, P.-G.; Prost, J. The Physics of Liquid Crystals. Oxford University Press: New York, NY, USA, 1993; Volume 83. [Google Scholar]
- Skacej, G.; Zannoni, C. Molecular simulations shed light on supersoft elasticity in polydomain liquid crystal elastomers. Macromolecules 2014, 47, 8824–8832. [Google Scholar] [CrossRef]
- Whitmer, J.K.; Roberts, T.F.; Shekhar, R.; Abbott, N.L.; De Pablo, J.J. Modeling the polydomain-monodomain transition of liquid crystal elastomers. Phys. Rev. E 2013, 87, 020502. [Google Scholar] [CrossRef] [PubMed] [Green Version]
- Naciri, J.; Srinivasan, A.; Jeon, H.; Nikolov, N.; Keller, P.; Ratna, B.R. Nematic elastomer fiber actuator. Macromolecules 2003, 36, 8499–8505. [Google Scholar] [CrossRef]
- Ye, F.; Mukhopadhyay, R.; Stenull, O.; Lubensky, T.C. Semisoft nematic elastomers and nematics in crossed electric and magnetic fields. Phys. Rev. Lett. 2007, 98, 147801. [Google Scholar] [CrossRef] [Green Version]
- Stephen, M.J.; Straley, J.P. Physics of liquid crystals. Rev. Mod. Phys. 1974, 46, 617. [Google Scholar] [CrossRef]
- Li, M.-H.; Keller, P. Artificial muscles based on liquid crystal elastomers. Philos. Trans. R. Soc. A Math. Phys. Eng. Sci. 2006, 364, 2763–2777. [Google Scholar] [CrossRef] [PubMed]
- Li, C.; Liu, Y.; Huang, X.; Jiang, H. Direct sun-driven artificial heliotropism for solar energy harvesting based on a photo-thermomechanical liquid-crystal elastomer nanocomposite. Adv. Funct. Mater. 2012, 22, 5166–5174. [Google Scholar] [CrossRef]
- Yang, D.-K.; Wu, S.-T. Fundamentals of Liquid Crystal Devices; John Wiley & Sons: Chichester, West Sussex, UK, 2014. [Google Scholar]
- Shahsavan, H.; Salili, S.M.; Jákli, A.; Zhao, B. Thermally Active Liquid Crystal Network Gripper Mimicking the Self-Peeling of Gecko Toe Pads. Adv. Mater. 2017, 29, 1604021. [Google Scholar] [CrossRef]
- Prévôt, M.; Andro, H.; Alexander, S.; Ustunel, S.; Zhu, C.; Nikolov, Z.; Rafferty, S.; Brannum, M.; Kinsel, B.; Korley, L. Liquid crystal elastomer foams with elastic properties specifically engineered as biodegradable brain tissue scaffolds. Soft Matter 2018, 14, 354–360. [Google Scholar] [CrossRef]
- Zannoni, C. Computer simulation and molecular design of model liquid crystals. In Chemistry at the Beginning of the Third Millennium; Springer: Berlin/Heidelberg, Germany, 2000; pp. 329–342. [Google Scholar]
- Stelzer, J.; Berardi, R.; Zannoni, C. Flexoelectric effects in liquid crystals formed by pear-shaped molecules. A computer simulation study. Chem. Phys. Lett. 1999, 299, 9–16. [Google Scholar] [CrossRef]
- NEAL, B.M.; Parker, A.; Care, C. A molecular dynamics study of a steric multipole model of liquid crystal molecular geometry. Mol. Phys. 1997, 91, 603–624. [Google Scholar] [CrossRef]
- Wilson, M.R. Molecular dynamics simulations of flexible liquid crystal molecules using a Gay-Berne/Lennard-Jones model. J. Chem. Phys. 1997, 107, 8654–8663. [Google Scholar] [CrossRef] [Green Version]
- Bates, M.; Luckhurst, G. Computer simulation studies of anisotropic systems XXIX. Quadrupolar Gay-Berne discs and chemically induced liquid crystal phases. Liq. Cryst. 1998, 24, 229–241. [Google Scholar] [CrossRef]
- Berardi, R.; Fehervari, M.; Zannoni, C. A Monte Carlo simulation study of associated liquid crystals. Mol. Phys. 1999, 97, 1173–1184. [Google Scholar] [CrossRef]
- Konya, A.; Gimenez-Pinto, V.; Selinger, R.L. Modeling defects, shape evolution, and programmed auto-origami in liquid crystal elastomers. Front. Mater. 2016, 3, 24. [Google Scholar] [CrossRef] [Green Version]
- Keip, M.A.; Bhattacharya, K. A phase-field approach for the modeling of nematic liquid crystal elastomers. PAMM 2014, 14, 577–578. [Google Scholar] [CrossRef]
- An, N.; Li, M.; Zhou, J. Instability of liquid crystal elastomers. Smart Mater. Struct. 2015, 25, 015016. [Google Scholar] [CrossRef]
- Selinger, R.L.; Mbanga, B.L.; Selinger, J.V. Modeling liquid crystal elastomers: Actuators, pumps, and robots. In Emerging Liquid Crystal Technologies; III; International Society for Optics and Photonics: Bellingham, WA, USA, 2008; p. 69110A. [Google Scholar]
- Mbanga, B.L.; Ye, F.; Selinger, J.V.; Selinger, R.L. Modeling elastic instabilities in nematic elastomers. Phys. Rev. E 2010, 82, 051701. [Google Scholar] [CrossRef] [Green Version]
- Skačej, G.; Zannoni, C. Main-chain swollen liquid crystal elastomers: A molecular simulation study. Soft Matter 2011, 7, 9983–9991. [Google Scholar] [CrossRef]
- Li, H.; Li, J.; Yuan, H. A review of the extended finite element method on macrocrack and microcrack growth simulations. Theor. Appl. Fract. Mech. 2018, 97, 236–249. [Google Scholar] [CrossRef]
- Jagota, V.; Sethi, A.P.S.; Kumar, K. Finite element method: An overview. Walailak J. Sci. Technol. (WJST) 2013, 10, 1–8. [Google Scholar]
- Öchsner, A. Partial Differential Equations of Classical Structural Members: A Consistent Approach; Springer Nature: Cham, Switzerland, 2019. [Google Scholar]
- Liu, M.; Liu, G.; Zhou, L.; Chang, J. Dissipative particle dynamics (DPD): An overview and recent developments. Arch. Comput. Methods Eng. 2015, 22, 529–556. [Google Scholar] [CrossRef] [Green Version]
- Nikishkov, G. Introduction to the Finite Element Method; University of Aizu: Aizu, Japan, 2004; pp. 1–70. [Google Scholar]
- Lin, Y.; Jin, L.; Huo, Y. Quasi-soft opto-mechanical behavior of photochromic liquid crystal elastomer: Linearized stress–strain relations and finite element simulations. Int. J. Solids Struct. 2012, 49, 2668–2680. [Google Scholar] [CrossRef] [Green Version]
- Corbett, D.; Warner, M. Bleaching and stimulated recovery of dyes and of photocantilevers. Phys. Rev. E 2008, 77, 051710. [Google Scholar] [CrossRef] [Green Version]
- Jin, L.; Zeng, Z.; Huo, Y. Thermomechanical modeling of the thermo-order–mechanical coupling behaviors in liquid crystal elastomers. J. Mech. Phys. Solids 2010, 58, 1907–1927. [Google Scholar] [CrossRef]
- De Luca, M.; DeSimone, A.; Petelin, A.; Čopič, M. Sub-stripe pattern formation in liquid crystal elastomers: Experimental observations and numerical simulations. J. Mech. Phys. Solids 2013, 61, 2161–2177. [Google Scholar] [CrossRef]
- Warner, M.; Terentjev, E.M. Liquid Crystal Elastomers. Oxford University Press: Cambridge, UK, 2007; Volume 120. [Google Scholar]
- de Luca, M.; De Simone, A. Mathematical and numerical modeling of liquid crystal elastomer phase transition and deformation. Mrs Online Proc. Libr. 2012, 1403, 37–42. [Google Scholar] [CrossRef]
- Petelin, A.; Čopič, M. Observation of a soft mode of elastic instability in liquid crystal elastomers. Phys. Rev. Lett. 2009, 103, 077801. [Google Scholar] [CrossRef] [PubMed]
- Camargo, C.J.; Campanella, H.; Zinoviev, K.; Torras, N.; Campo, E.M.; Marshall, J.E.; Terentjev, E.M.; Esteve, J. Mechanical modeling of thermally actuated LCE-CNT composite. In Nano-Opto-Mechanical Systems; International Society for Optics and Photonics: San Diego, CA, USA, 2011; p. 81070J. [Google Scholar]
- Hon, K.; Corbett, D.; Terentjev, E. Thermal diffusion and bending kinetics in nematic elastomer cantilever. Eur. Phys. J. E 2008, 25, 83–89. [Google Scholar] [CrossRef] [Green Version]
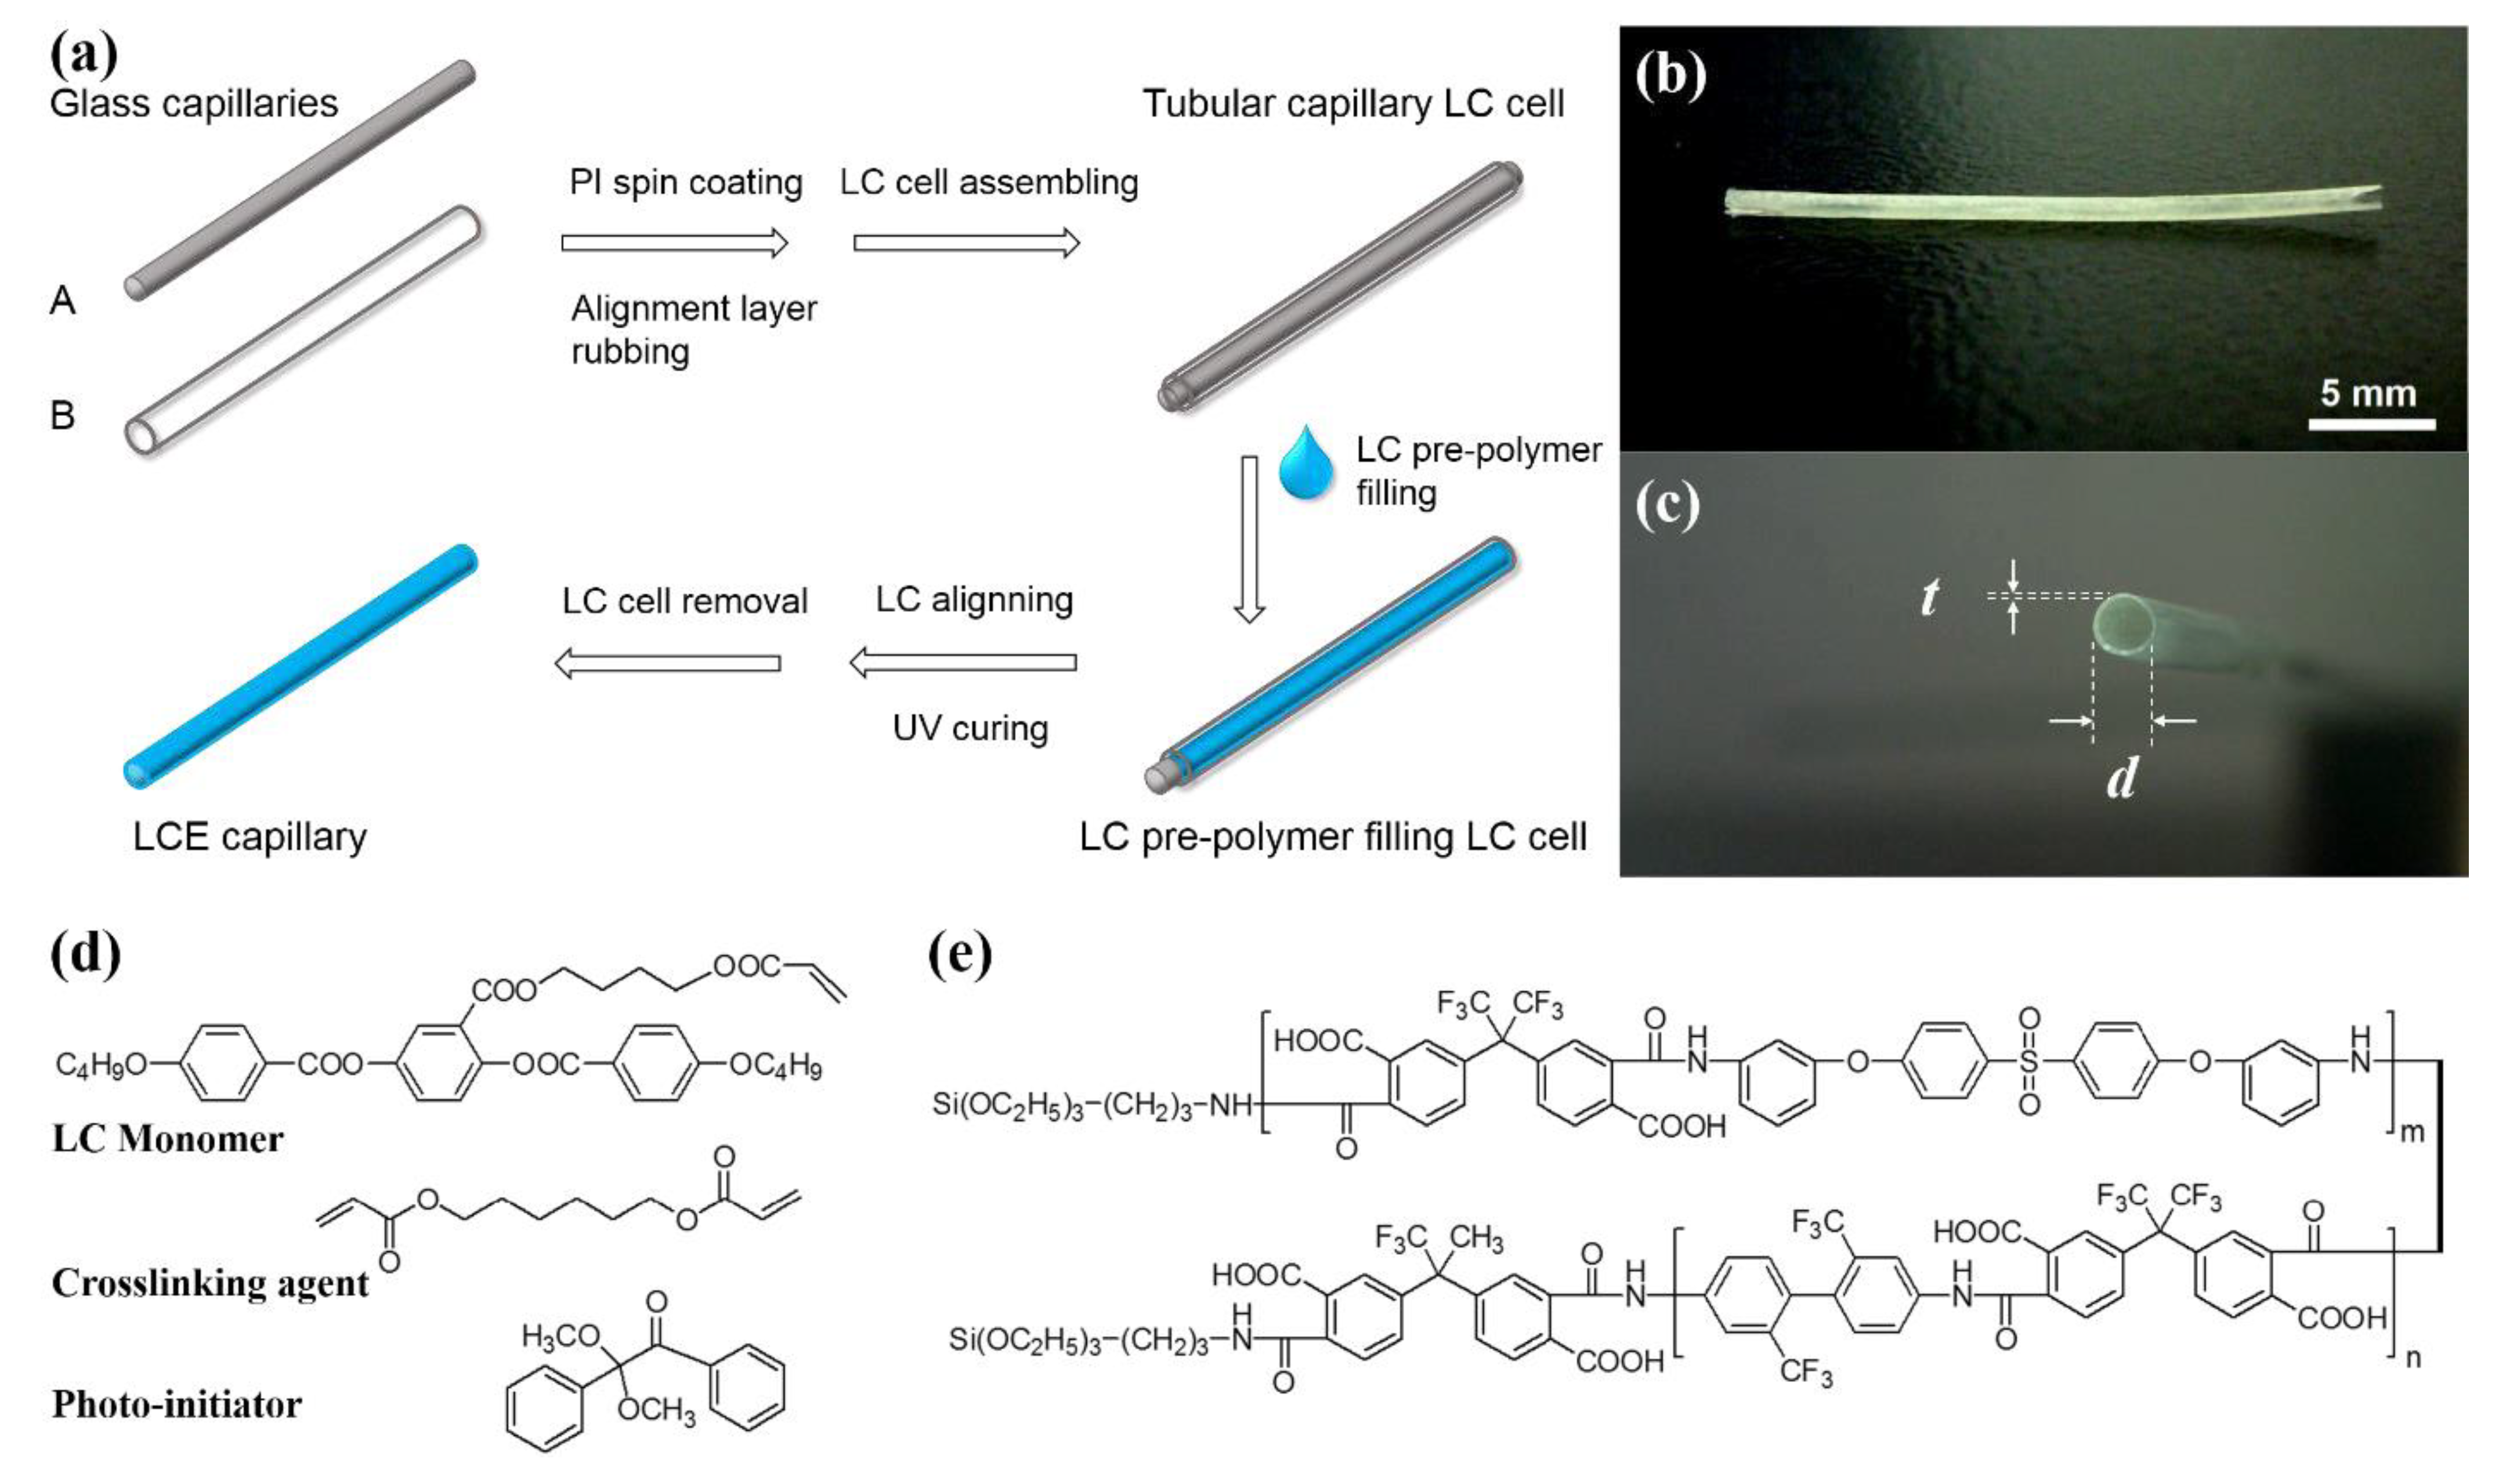
- Liu, X.; Kim, S.-K.; Wang, X. Thermomechanical liquid crystalline elastomer capillaries with biomimetic peristaltic crawling function. J. Mater. Chem. B 2016, 4, 7293–7302. [Google Scholar] [CrossRef]
- Oates, W.; Wang, H. A new approach to modeling liquid crystal elastomers using phase field methods. Model. Simul. Mater. Sci. Eng. 2009, 17, 064004. [Google Scholar] [CrossRef] [Green Version]
- Plucinsky, P.; Bhattacharya, K. Microstructure-enabled control of wrinkling in nematic elastomer sheets. J. Mech. Phys. Solids 2017, 102, 125–150. [Google Scholar] [CrossRef] [Green Version]
- Nayyar, V.; Ravi-Chandar, K.; Huang, R. Stretch-induced stress patterns and wrinkles in hyperelastic thin sheets. Int. J. Solids Struct. 2011, 48, 3471–3483. [Google Scholar] [CrossRef] [Green Version]
- Taylor, M.; Bertoldi, K.; Steigmann, D.J. Spatial resolution of wrinkle patterns in thin elastic sheets at finite strain. J. Mech. Phys. Solids 2014, 62, 163–180. [Google Scholar] [CrossRef]
- Wong, W.; Pellegrino, S. Wrinkled membranes III: Numerical simulations. J. Mech. Mater. Struct. 2006, 1, 63–95. [Google Scholar] [CrossRef] [Green Version]
- DeSimone, A.; Dolzmann, G. Macroscopic Response of¶ Nematic Elastomers via Relaxation of a Class of SO (3)-Invariant Energies. Arch. Ration. Mech. Anal. 2002, 161, 181–204. [Google Scholar] [CrossRef]
- Kundler, I.; Finkelmann, H. Strain-induced director reorientation in nematic liquid single crystal elastomers. Macromol. Rapid Commun. 1995, 16, 679–686. [Google Scholar] [CrossRef]
- Ribes, A.; Caremoli, C. Salome platform component model for numerical simulation. In Proceedings of the 31st Annual International Computer Software and Applications Conference (COMPSAC 2007), Beijing, China, 24–27 July 2007; pp. 553–564. [Google Scholar]
- Gimenez-Pinto, V.; Ye, F. Patterning order and disorder with an angle: Modeling single-layer dual-phase nematic elastomer ribbons. RSC Adv. 2019, 9, 8994–9000. [Google Scholar] [CrossRef] [Green Version]
- Brighenti, R.; McMahan, C.G.; Cosma, M.P.; Kotikian, A.; Lewis, J.A.; Daraio, C. A micromechanical-based model of stimulus responsive liquid crystal elastomers. Int. J. Solids Struct. 2021, 219, 92–105. [Google Scholar] [CrossRef]
- Kotikian, A.; McMahan, C.; Davidson, E.C.; Muhammad, J.M.; Weeks, R.D.; Daraio, C.; Lewis, J.A. Untethered soft robotic matter with passive control of shape morphing and propulsion. Sci. Robot. 2019, 4. [Google Scholar] [CrossRef] [PubMed]
- Agostiniani, V.; DeSimone, A. Rigorous derivation of active plate models for thin sheets of nematic elastomers. Math. Mech. Solids 2020, 25, 1804–1830. [Google Scholar] [CrossRef]
- DeSimone, A. Multiscale Computational Model of Soft Elasticity and Director Reorientation in Nematic Gels. Mrs Online Proc. Libr. 2003, 785, 341–346. [Google Scholar] [CrossRef]
- Camacho-Lopez, M.; Finkelmann, H.; Palffy-Muhoray, P.; Shelley, M. Fast liquid-crystal elastomer swims into the dark. Nat. Mater. 2004, 3, 307–310. [Google Scholar] [CrossRef] [PubMed]
- Broughton, J.Q.; Abraham, F.F.; Bernstein, N.; Kaxiras, E. Concurrent coupling of length scales: Methodology and application. Phys. Rev. B 1999, 60, 2391. [Google Scholar] [CrossRef]
- Dunn, M.L.; Maute, K. Photomechanics of blanket and patterned liquid crystal elastomer films. Mech. Mater. 2009, 41, 1083–1089. [Google Scholar] [CrossRef]
- Fuchi, K.; Ware, T.H.; Buskohl, P.R.; Reich, G.W.; Vaia, R.A.; White, T.J.; Joo, J.J. Topology optimization for the design of folding liquid crystal elastomer actuators. Soft Matter 2015, 11, 7288–7295. [Google Scholar] [CrossRef]
- Svanberg, K. The method of moving asymptotes—a new method for structural optimization. Int. J. Numer. Methods Eng. 1987, 24, 359–373. [Google Scholar] [CrossRef]
- Gimenez-Pinto, V.; Ye, F.; Mbanga, B.; Selinger, J.V.; Selinger, R.L. Modeling out-of-plane actuation in thin-film nematic polymer networks: From chiral ribbons to auto-origami boxes via twist and topology. Sci. Rep. 2017, 7, 1–7. [Google Scholar] [CrossRef] [Green Version]
- Sawa, Y.; Ye, F.; Urayama, K.; Takigawa, T.; Gimenez-Pinto, V.; Selinger, R.L.; Selinger, J.V. Shape selection of twist-nematic-elastomer ribbons. Proc. Natl. Acad. Sci. USA 2011, 108, 6364–6368. [Google Scholar] [CrossRef] [PubMed] [Green Version]
- de Haan, L.T.; Schenning, A.P.; Broer, D.J. Programmed morphing of liquid crystal networks. Polymer 2014, 55, 5885–5896. [Google Scholar] [CrossRef] [Green Version]
- Neufeld, R.A.E.; Shahsavan, H.; Zhao, B.; Abukhdeir, N.M. Simulation-based design of thermally-driven actuators using liquid crystal elastomers. Liq. Cryst. 2018, 45, 1010–1022. [Google Scholar] [CrossRef]
- Sawa, Y.; Urayama, K.; Takigawa, T.; De Simone, A.; Teresi, L. Thermally driven giant bending of liquid crystal elastomer films with hybrid alignment. Macromolecules 2010, 43, 4362–4369. [Google Scholar] [CrossRef]
- DeSimone, A.; Teresi, L. Elastic energies for nematic elastomers. Eur. Phys. J. E 2009, 29, 191–204. [Google Scholar] [CrossRef]
- Alnæs, M.; Blechta, J.; Hake, J.; Johansson, A.; Kehlet, B.; Logg, A.; Richardson, C.; Ring, J.; Rognes, M.E.; Wells, G.N. The FEniCS project version 1.5. Arch. Numer. Softw. 2015, 3, 9–23. [Google Scholar]
- Cirak, F.; Long, Q.; Bhattacharya, K.; Warner, M. Computational analysis of liquid crystalline elastomer membranes: Changing Gaussian curvature without stretch energy. Int. J. Solids Struct. 2014, 51, 144–153. [Google Scholar] [CrossRef] [Green Version]
- Verwey, G.; Warner, M.; Terentjev, E. Elastic instability and stripe domains in liquid crystalline elastomers. J. Phys. II 1996, 6, 1273–1290. [Google Scholar] [CrossRef]
- Terentjev, E.; Warner, M. Linear hydrodynamics and viscoelasticity of nematic elastomers. Eur. Phys. J. E 2001, 4, 343–353. [Google Scholar] [CrossRef] [Green Version]
- Terentjev, E.; Kamotski, I.; Zakharov, D.; Fradkin, L. Propagation of acoustic waves in nematic elastomers. Phys. Rev. E 2002, 66, 052701. [Google Scholar] [CrossRef] [PubMed]
- Fradkin, L.; Kamotski, I.; Terentjev, E.; Zakharov, D. Low–frequency acoustic waves in nematic elastomers. Proc. R. Soc. Lond. Ser. A Math. Phys. Eng. Sci. 2003, 459, 2627–2641. [Google Scholar] [CrossRef]
- Singh, B. Reflection of homogeneous elastic waves from free surface of nematic elastomer half-space. J. Phys. D Appl. Phys. 2007, 40, 584. [Google Scholar] [CrossRef]
- Zakharov, D. Resonance phenomena in surface wave propagation in elastic bodies coated with nematic elastomers. Mech. Solids 2013, 48, 659–672. [Google Scholar] [CrossRef]
- Yang, S.; Liu, Y.; Gu, Y.; Yang, Q. Rayleigh wave propagation in nematic elastomers. Soft Matter 2014, 10, 4110–4117. [Google Scholar] [CrossRef]
- Yang, S.; Liu, Y.; Liang, T. Band structures in the nematic elastomers phononic crystals. Phys. B Condens. Matter 2017, 506, 55–64. [Google Scholar] [CrossRef]
- Yang, S.; Liu, Y. Effects of thermo-order-mechanical coupling on band structures in liquid crystal nematic elastomer porous phononic crystals. Ultrasonics 2018, 88, 193–206. [Google Scholar] [CrossRef]
- Paquet, E.; Viktor, H.L. Molecular dynamics, monte carlo simulations, and langevin dynamics: A computational review. Biomed Res. Int. 2015, 2015. [Google Scholar] [CrossRef] [PubMed] [Green Version]
- Ebrahimi, D. Multiscale Modeling of Clay-Water Systems; Massachusetts Institute of Technology: Cambridge, MA, USA, 2013. [Google Scholar]
- Pasini, P.; Zannoni, C. Advances in the Computer Simulations of Liquid Crystals; Springer Science & Business Media: Amsterdam, The Netherlands, 2013; Volume 545. [Google Scholar]
- Xu, J.; Selinger, R.L.; Selinger, J.V.; Shashidhar, R. Monte Carlo simulation of liquid-crystal alignment and chiral symmetry-breaking. J. Chem. Phys. 2001, 115, 4333–4338. [Google Scholar] [CrossRef] [Green Version]
- Skačej, G.; Zannoni, C. Molecular simulations elucidate electric field actuation in swollen liquid crystal elastomers. Proc. Natl. Acad. Sci. USA 2012, 109, 10193–10198. [Google Scholar] [CrossRef] [PubMed] [Green Version]
- Corbett, D.; Warner, M. Deformation and rotations of free nematic elastomers in response to electric fields. Soft Matter 2009, 5, 1433–1439. [Google Scholar] [CrossRef]
- Pasini, P.; Skačej, G.; Zannoni, C. A microscopic lattice model for liquid crystal elastomers. Chem. Phys. Lett. 2005, 413, 463–467. [Google Scholar] [CrossRef]
- Skačej, G.; Zannoni, C. Biaxial liquid-crystal elastomers: A lattice model. Eur. Phys. J. E 2008, 25, 181–186. [Google Scholar] [CrossRef] [PubMed]
- Straley, J.P. Ordered phases of a liquid of biaxial particles. Phys. Rev. A 1974, 10, 1881. [Google Scholar] [CrossRef]
- Skačej, G. Sample preparation affects the nematic–isotropic transition in liquid crystal elastomers: Insights from molecular simulation. Soft Matter 2018, 14, 1408–1416. [Google Scholar] [CrossRef] [PubMed]
- Berardi, R.; Zannoni, C.; Lintuvuori, J.S.; Wilson, M.R. A soft-core Gay–Berne model for the simulation of liquid crystals by Hamiltonian replica exchange. J. Chem. Phys. 2009, 131, 174107. [Google Scholar] [CrossRef] [PubMed]
- Osari, K.; Koibuchi, H. Finsler geometry modeling and Monte Carlo study of 3D liquid crystal elastomer. Polymer 2017, 114, 355–369. [Google Scholar] [CrossRef]
- Helfrich, W. Elastic properties of lipid bilayers: Theory and possible experiments. Z. Für Nat. C 1973, 28, 693–703. [Google Scholar] [CrossRef]
- Polyakov, A. Fine structure of strings. Nucl. Phys. B 1986, 268, 406–412. [Google Scholar] [CrossRef]
- Domenici, V. 2H NMR studies of liquid crystal elastomers: Macroscopic vs. molecular properties. Prog. Nucl. Magn. Reson. Spectrosc. 2011, 63, 1–32. [Google Scholar] [CrossRef] [PubMed]
- Terentjev, E.M. Liquid-crystalline elastomers. J. Phys. Condens. Matter 1999, 11, R239. [Google Scholar] [CrossRef]
- Greve, A.; Finkelmann, H. Nematic elastomers: The dependence of phase transformation and orientation processes on crosslinking topology. Macromol. Chem. Phys. 2001, 202, 2926–2946. [Google Scholar] [CrossRef]
- Koibuchi, H.; Sekino, H. Monte Carlo studies of a Finsler geometric surface model. Phys. A Stat. Mech. Its Appl. 2014, 393, 37–50. [Google Scholar] [CrossRef] [Green Version]
- Egorov, V.; Maksimova, O.; Okumura, M.; Noro, S.; Koibuchi, H. Modeling shape and volume transitions in liquid crystal elastomers. J. Phys. Conf. Ser. 2021, 1730, 012038. [Google Scholar] [CrossRef]
- Proutorov, E.; Matsuyama, N.; Koibuchi, H. Finsler geometry modeling and Monte Carlo study of liquid crystal elastomers under electric fields. J. Phys. Condens. Matter 2018, 30, 405101. [Google Scholar] [CrossRef] [Green Version]
- Hospital, A.; Goñi, J.R.; Orozco, M.; Gelpí, J.L. Molecular dynamics simulations: Advances and applications. Adv. Appl. Bioinform. Chem. Aabc 2015, 8, 37. [Google Scholar]
- Zhang, J.; Xu, F.; Hong, Y.; Xiong, Q.; Pan, J. A comprehensive review on the molecular dynamics simulation of the novel thermal properties of graphene. RSC Adv. 2015, 5, 89415–89426. [Google Scholar] [CrossRef]
- Ilnytskyi, J.M.; Saphiannikova, M.; Neher, D.; Allen, M.P. Modelling elasticity and memory effects in liquid crystalline elastomers by molecular dynamics simulations. Soft Matter 2012, 8, 11123–11134. [Google Scholar] [CrossRef]
- Clarke, S.; Nishikawa, E.; Finkelmann, H.; Terentjev, E. Light-scattering study of random disorder in liquid crystalline elastomers. Macromol. Chem. Phys. 1997, 198, 3485–3498. [Google Scholar] [CrossRef]
- Chung, H.; Choi, J.; Yun, J.-H.; Cho, M. Nonlinear photomechanics of nematic networks: Upscaling microscopic behaviour to macroscopic deformation. Sci. Rep. 2016, 6, 1–9. [Google Scholar] [CrossRef] [Green Version]
- Yu, Y.; Nakano, M.; Ikeda, T. Directed bending of a polymer film by light. Nature 2003, 425, 145. [Google Scholar] [CrossRef]
- Choi, J.; Chung, H.; Yun, J.-H.; Cho, M. Photo-isomerization effect of the azobenzene chain on the opto-mechanical behavior of nematic polymer: A molecular dynamics study. Appl. Phys. Lett. 2014, 105, 221906. [Google Scholar] [CrossRef]
- Hogan, P.; Tajbakhsh, A.; Terentjev, E. UV manipulation of order and macroscopic shape in nematic elastomers. Phys. Rev. E 2002, 65, 041720. [Google Scholar] [CrossRef] [Green Version]
- Tagashira, K.; Takahashi, K.Z.; Fukuda, J.-I.; Aoyagi, T. Development of coarse-grained liquid-crystal polymer model with efficient electrostatic interaction: Toward molecular dynamics simulations of electroactive materials. Materials 2018, 11, 83. [Google Scholar] [CrossRef] [PubMed] [Green Version]
- Aoyagi, T.; Sawa, F.; Shoji, T.; Fukunaga, H.; Takimoto, J.-i.; Doi, M. A general-purpose coarse-grained molecular dynamics program. Comput. Phys. Commun. 2002, 145, 267–279. [Google Scholar] [CrossRef]
- Fukunaga, H.; Takimoto, J.-i.; Doi, M. Molecular dynamics simulation study on the phase behavior of the Gay–Berne model with a terminal dipole and a flexible tail. J. Chem. Phys. 2004, 120, 7792–7800. [Google Scholar] [CrossRef]
- Prathumrat, P.; Sbarski, I.; Hajizadeh, E.; Nikzad, M. A comparative study of force fields for predicting shape memory properties of liquid crystalline elastomers using molecular dynamic simulations. J. Appl. Phys. 2021, 129, 155101. [Google Scholar] [CrossRef]
- Zhu, W.; Shelley, M.; Palffy-Muhoray, P. Modeling and simulation of liquid-crystal elastomers. Phys. Rev. E 2011, 83, 051703. [Google Scholar] [CrossRef] [Green Version]
- Zhu, W. Simulation of liquid crystal elastomers using Chebyshev spectral method with a new preconditioner. Adv. Comput. Math. 2015, 41, 853–879. [Google Scholar] [CrossRef]
- Ascher, U.M.; Ruuth, S.J.; Wetton, B.T. Implicit-explicit methods for time-dependent partial differential equations. Siam J. Numer. Anal. 1995, 32, 797–823. [Google Scholar] [CrossRef]
- Gustafsson, B.; Kreiss, H.-O.; Oliger, J. Time Dependent Problems and Difference Methods; John Wiley & Sons: New York, NY, USA, 1995; Volume 24. [Google Scholar]
- Peyret, R. Spectral Methods for Incompressible Viscous Flow; Springer Science & Business Media: New York, NY, USA, 2013; Volume 148. [Google Scholar]
- Saad, Y.; Schultz, M.H. GMRES: A generalized minimal residual algorithm for solving nonsymmetric linear systems. Siam J. Sci. Stat. Comput. 1986, 7, 856–869. [Google Scholar] [CrossRef] [Green Version]
- Cui, Y.; Wang, C.; Sim, K.; Chen, J.; Li, Y.; Xing, Y.; Yu, C.; Song, J. A simple analytical thermo-mechanical model for liquid crystal elastomer bilayer structures. AIP Adv. 2018, 8, 025215. [Google Scholar] [CrossRef]
- Greco, F.; Domenici, V.; Desii, A.; Sinibaldi, E.; Zupančič, B.; Zalar, B.; Mazzolai, B.; Mattoli, V. Liquid single crystal elastomer/conducting polymer bilayer composite actuator: Modelling and experiments. Soft Matter 2013, 9, 11405–11416. [Google Scholar] [CrossRef]
- Boothby, J.; Ware, T. Dual-responsive, shape-switching bilayers enabled by liquid crystal elastomers. Soft Matter 2017, 13, 4349–4356. [Google Scholar] [CrossRef]
- Zeng, X.; Li, S. Biomechanical cell model by liquid-crystal elastomers. J. Eng. Mech. 2014, 140, 04013003. [Google Scholar] [CrossRef]
- Fried, I.; Johnson, A.R. A note on elastic energy density functions for largely deformed compressible rubber solids. Comput. Methods Appl. Mech. Eng. 1988, 69, 53–64. [Google Scholar] [CrossRef]
- Fried, E.; Korchagin, V. Striping of nematic elastomers. Int. J. Solids Struct. 2002, 39, 3451–3467. [Google Scholar] [CrossRef] [Green Version]
- Sauer, R.A.; Li, S. A contact mechanics model for quasi-continua. Int. J. Numer. Methods Eng. 2007, 71, 931–962. [Google Scholar] [CrossRef]
- Cohen, N.; Bhattacharya, K. Electroclinic effect in chiral smectic—A liquid crystal elastomers. Phys. Rev. E 2017, 96, 032701. [Google Scholar] [CrossRef] [Green Version]
- Adams, J.M.; Warner, M. Elasticity of smectic-A elastomers. Phys. Rev. E 2005, 71, 021708. [Google Scholar] [CrossRef] [Green Version]
- Adams, J.; Warner, M.; Stenull, O.; Lubensky, T.C. Smectic—A elastomers with weak director anchoring. Phys. Rev. E 2008, 78, 011703. [Google Scholar] [CrossRef] [PubMed] [Green Version]
- Shu, Y.; Bhattacharya, K. Domain patterns and macroscopic behaviour of ferroelectric materials. Philos. Mag. B 2001, 81, 2021–2054. [Google Scholar] [CrossRef]
- Keip, M.A.; Nadgir, O. An electro-elastic phase-field model for nematic liquid crystal elastomers based on Landau-de-Gennes theory. GAMM-Mitt. 2017, 40, 102–124. [Google Scholar] [CrossRef]
- DeSimone, A.; DiCarlo, A.; Teresi, L. Critical voltages and blocking stresses in nematic gels. Eur. Phys. J. E 2007, 24, 303–310. [Google Scholar] [CrossRef] [PubMed]
- Fukunaga, A.; Urayama, K.; Takigawa, T.; DeSimone, A.; Teresi, L. Dynamics of electro-opto-mechanical effects in swollen nematic elastomers. Macromolecules 2008, 41, 9389–9396. [Google Scholar] [CrossRef]
- Zhang, J.; Chen, L. Phase-field microelasticity theory and micromagnetic simulations of domain structures in giant magnetostrictive materials. Acta. Mater. 2005, 53, 2845–2855. [Google Scholar] [CrossRef]
- Zhang, J.; Chen, L. Phase-field model for ferromagnetic shape-memory alloys. Philos. Mag. Lett. 2005, 85, 533–541. [Google Scholar] [CrossRef]
- Cui, Y.; Yin, Y.; Wang, C.; Sim, K.; Li, Y.; Yu, C.; Song, J. Transient thermo-mechanical analysis for bimorph soft robot based on thermally responsive liquid crystal elastomers. Appl. Math. Mech. 2019, 40, 943–952. [Google Scholar] [CrossRef]
- Zhang, Y.; Xuan, C.; Jiang, Y.; Huo, Y. Continuum mechanical modeling of liquid crystal elastomers as dissipative ordered solids. J. Mech. Phys. Solids 2019, 126, 285–303. [Google Scholar] [CrossRef]
- Kotikian, A.; Truby, R.L.; Boley, J.W.; White, T.J.; Lewis, J.A. 3D printing of liquid crystal elastomeric actuators with spatially programed nematic order. Adv. Mater. 2018, 30, 1706164. [Google Scholar] [CrossRef] [PubMed]
- Surjadi, J.U.; Gao, L.; Du, H.; Li, X.; Xiong, X.; Fang, N.X.; Lu, Y. Mechanical metamaterials and their engineering applications. Adv. Eng. Mater. 2019, 21, 1800864. [Google Scholar] [CrossRef] [Green Version]


| Method | Applications |
|---|---|
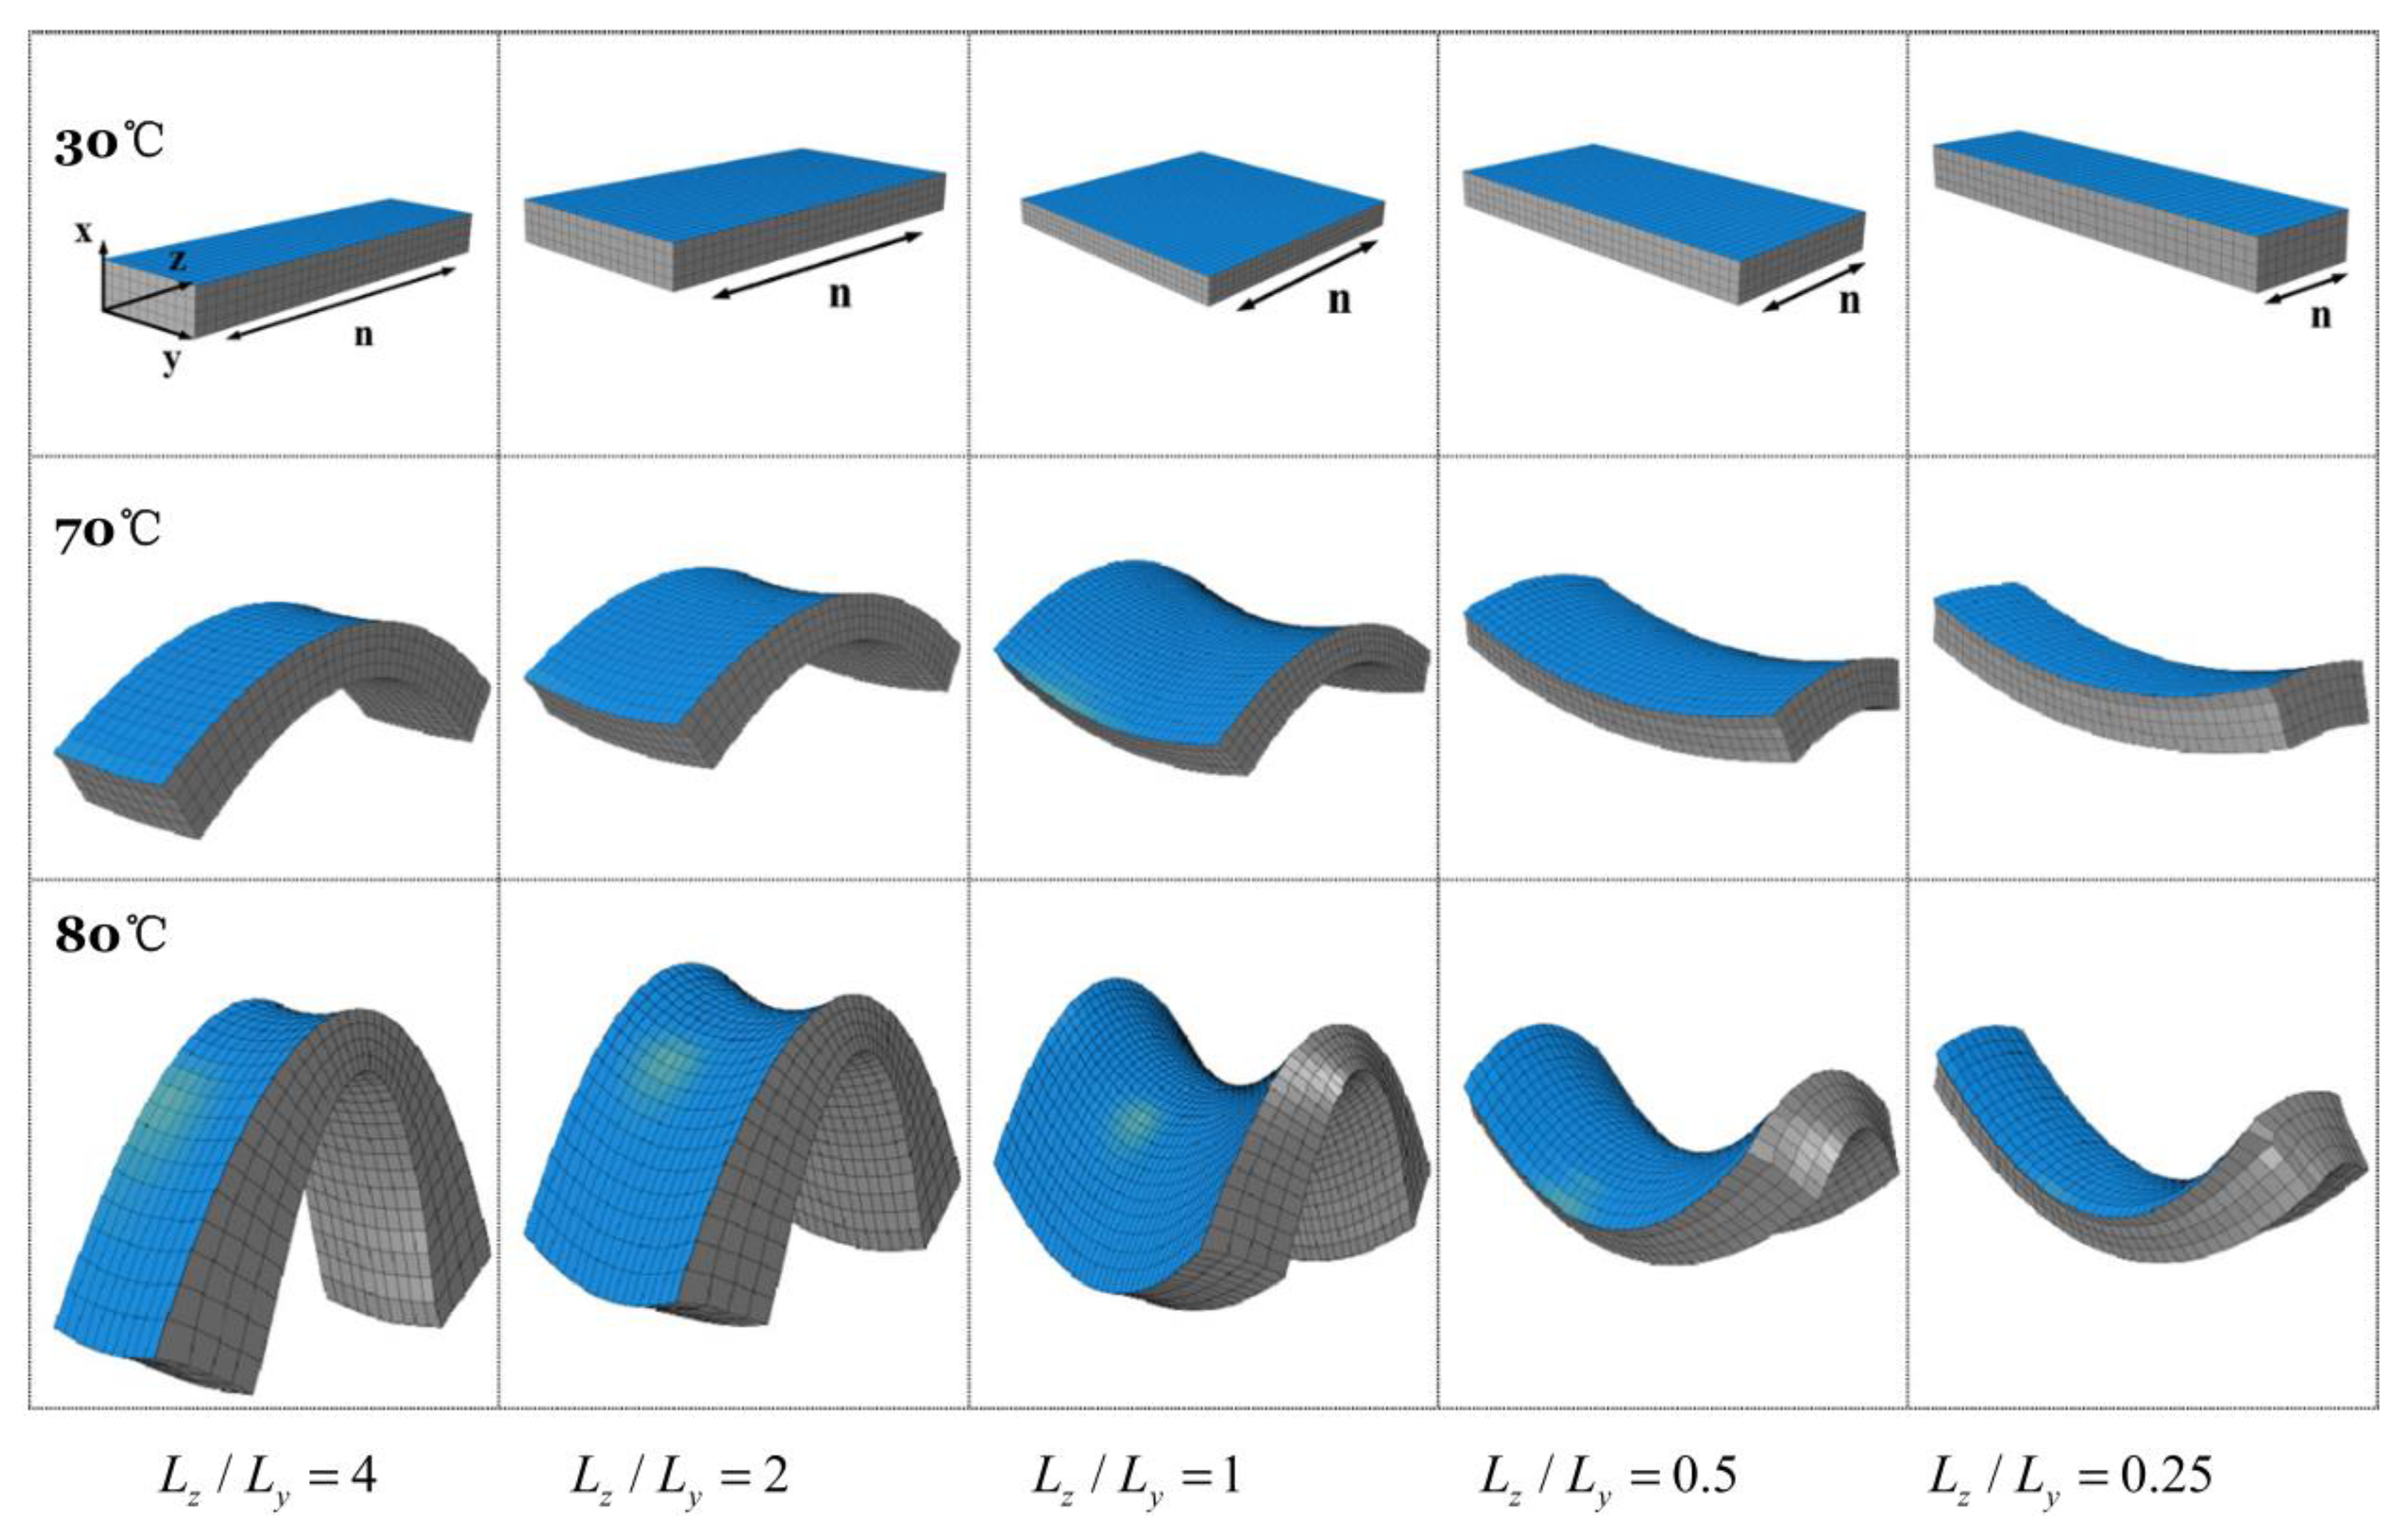
| FEM (software) | (1) studying the Quasi-soft opto-mechanical behavior of a two dimensional (2D) rectangular beam using commercial software, ABAQUS [34] (2) studying the appearance of sub-stripe patterns in sheets of nematic elastomers using COMSOL Multiphysics [37] (3) simulating cooling and stretching experiments to investigate the transitional behavior of nematic elastomers using COMSOL Multiphysics [38] (4) bridging the gap between elastomer physics and device engineering and design in LCE-NTs using ANSYS [41] (5) accurate modeling of non-uniform deformation and instability of a constrained LCE beam, used as a microfluidic valves, in addition to studying a nanoscale poly styrene (PS) film laminated piece of LCE using ABAQUS [25] (6) simulating peristaltic crawling locomotion of earthworms using COMSOL Multiphysics [43] (7) simulating the domain evolution of a square LCE sample clamped on one side and free on all other three sides, performed using FEAP software [24] (8) wrinkling behavior in sheets of stretched nematic elastomer using ABAQUS [45] (9) elastodynamics simulations on dual-phase elastic solids using SALOME [52] (10) evaluation of mechanical reaction of LCE based elements to thermal stimuli using FEM software [53] |
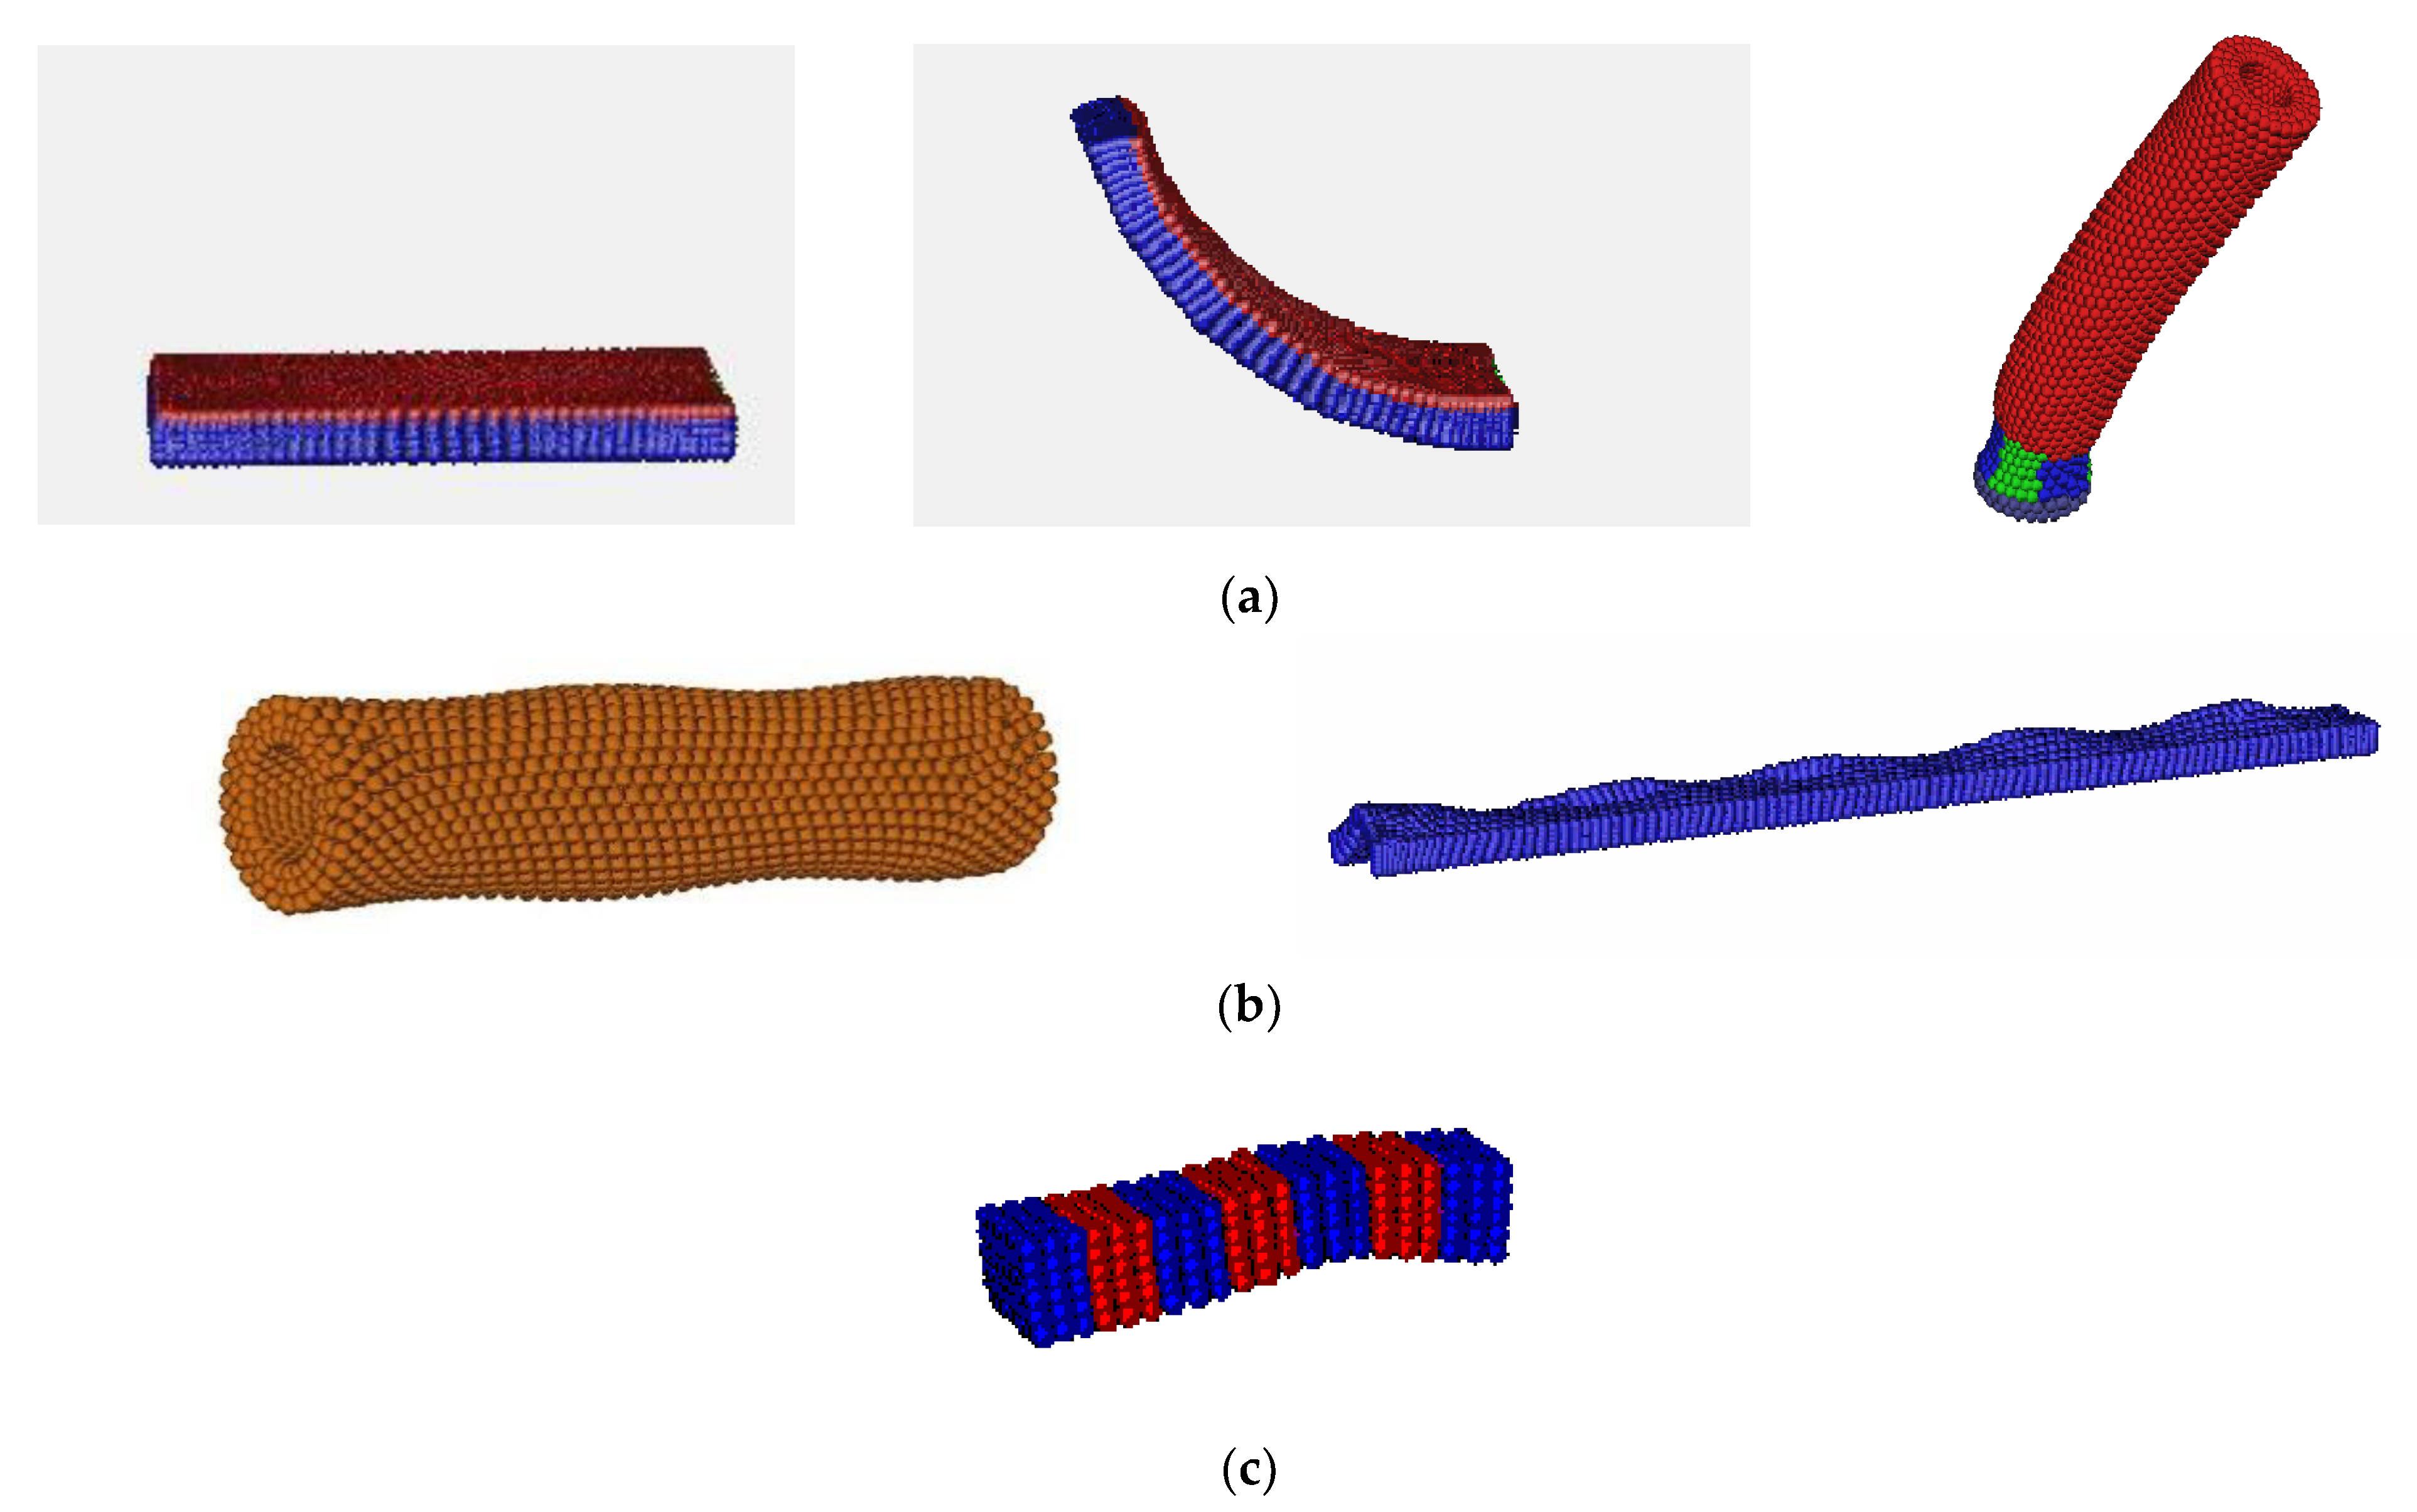
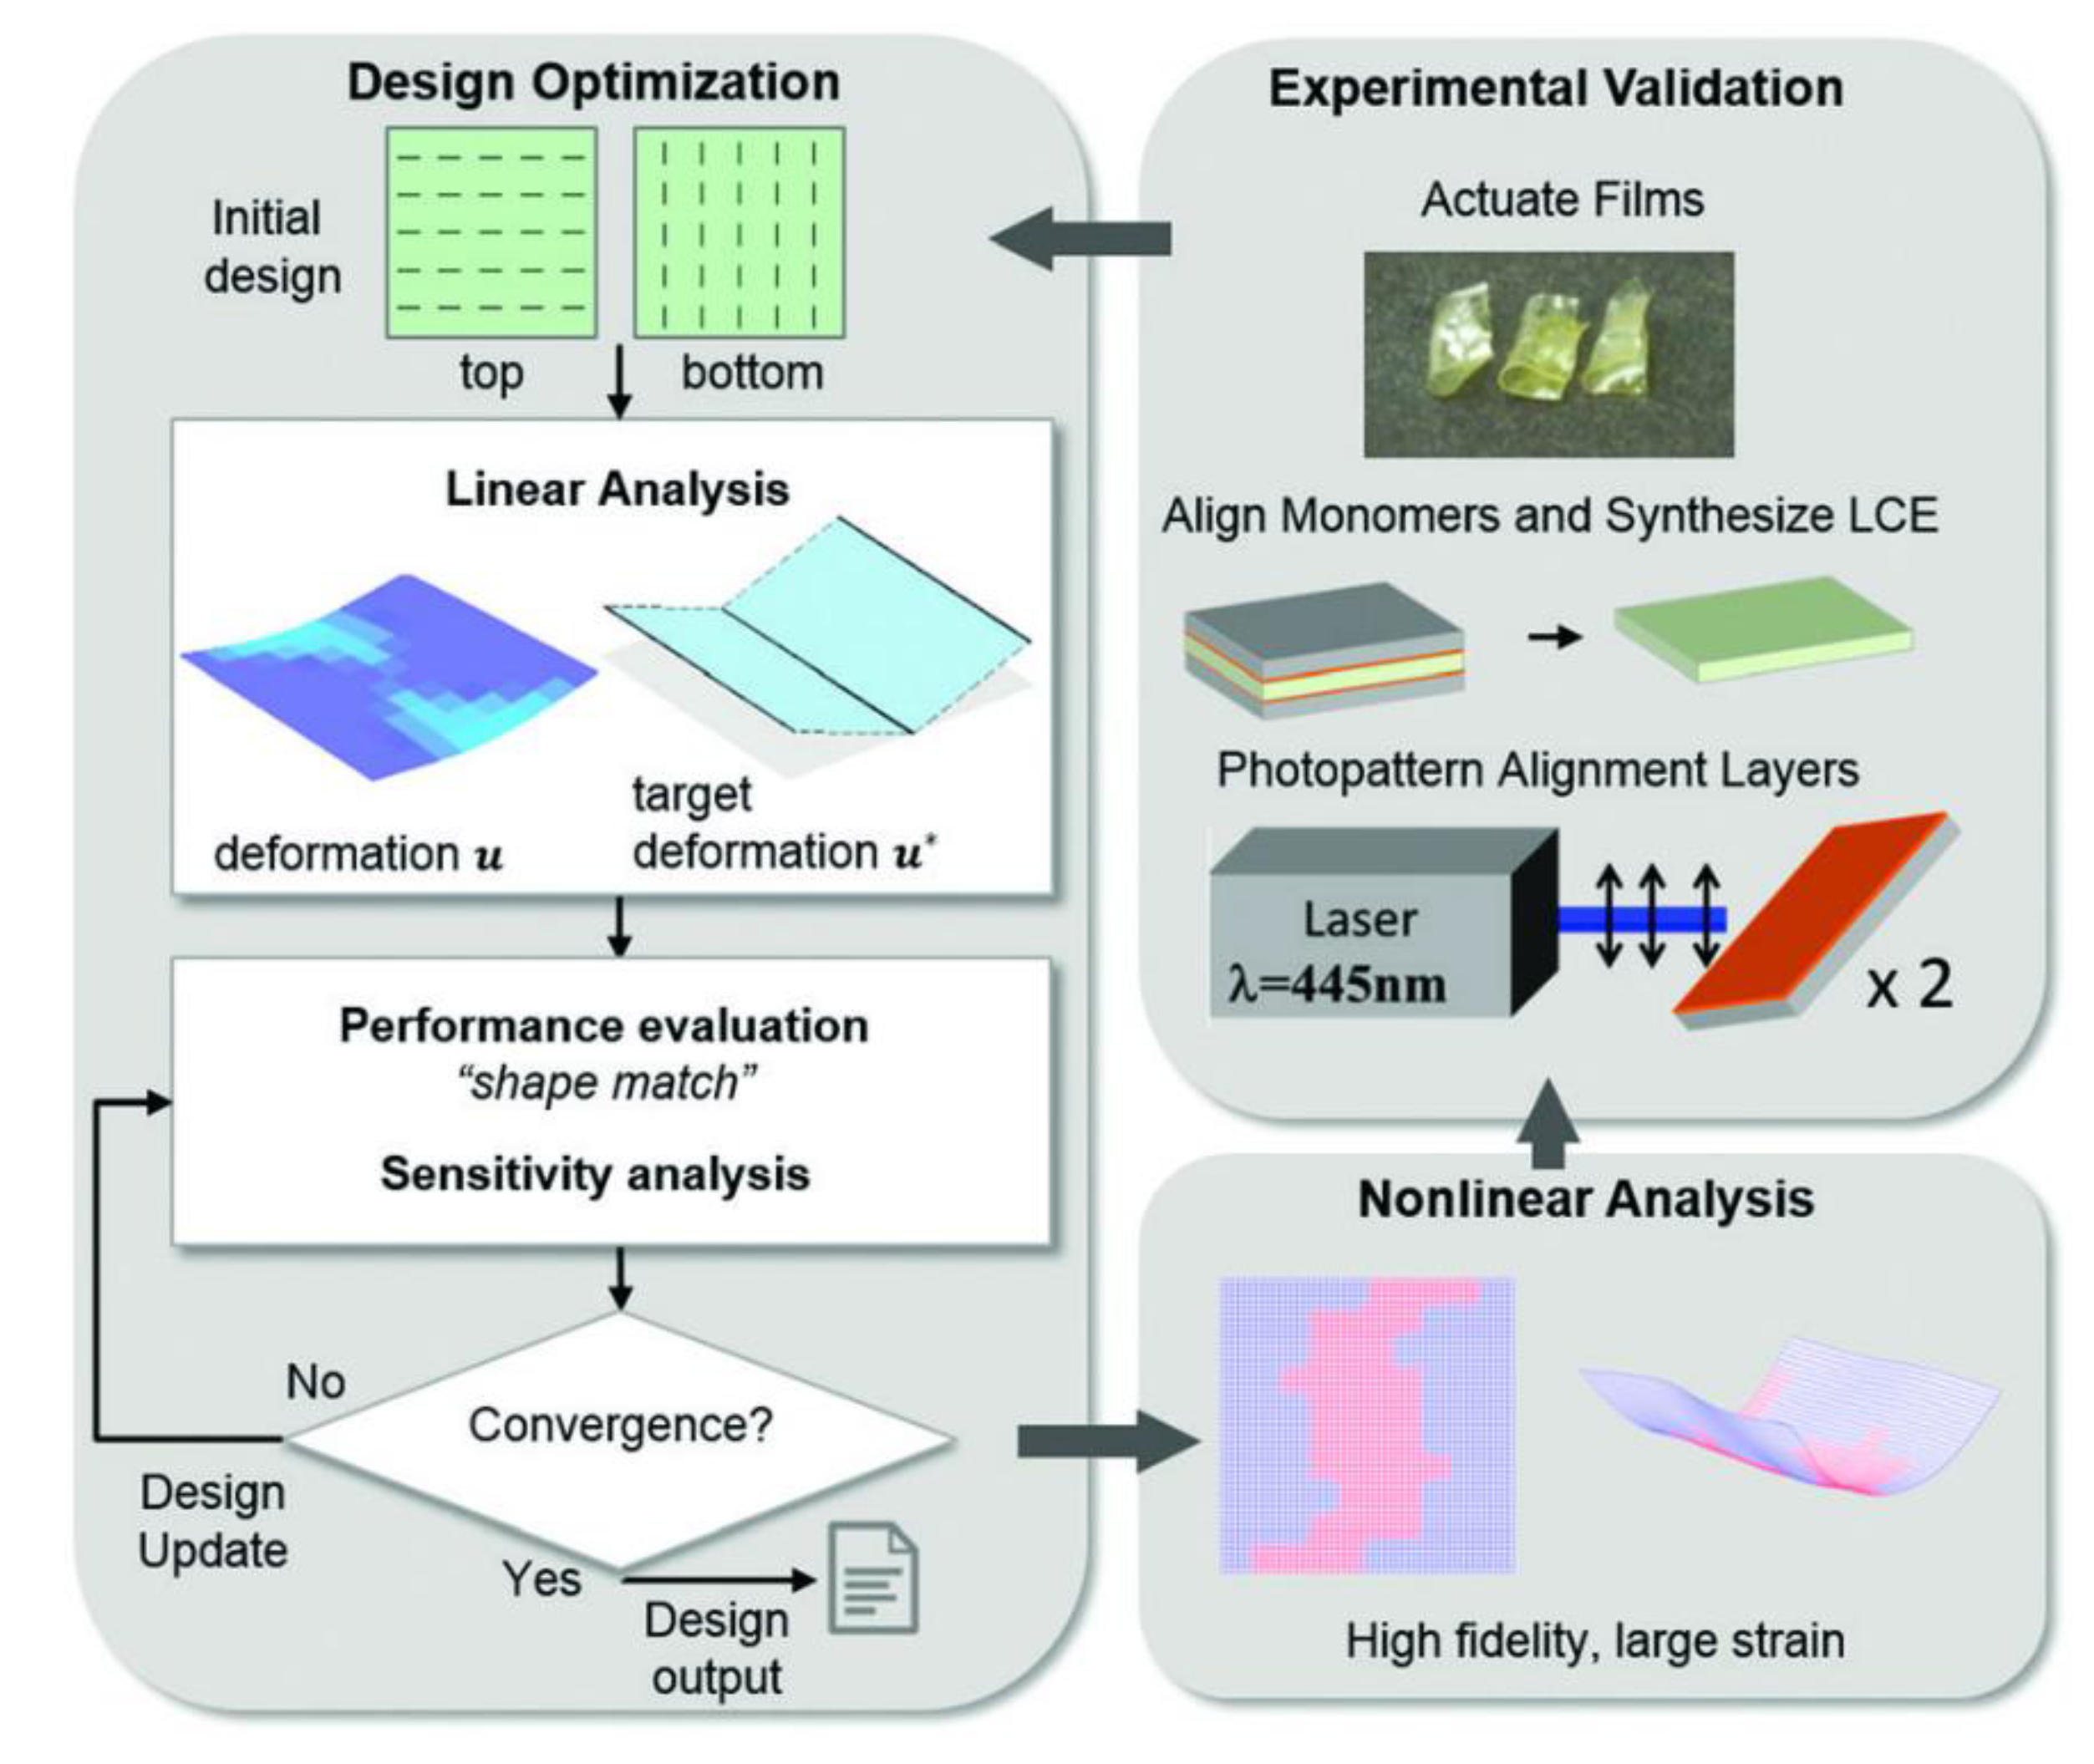
| FEM (in house codes) | (1) accurately modeling fine-scale oscillating behavior of nematic elastomers [56] (2) modeling elastodynamics of 3D devices made of nematic elastomers, including azo-doped nematic elastomer beam, peristaltic pumps and soft self-propelled robots [26] (3) studying the physics which govern the dynamic behavior of nematic elastomers by performing 3D elastodynamics simulations [27] (4) Topology optimization for generating reliable folding patterns in monolithic LCEs [60] (5) evaluation of the folding performance of various LCE sample designs [61] (6) studying director-encoded chiral shape actuation in thin-film nematic polymer networks, under the influence of external stimuli, namely via temperature [62] (7) studying the energetics of LCEs, when stress is utilized as a stimulant for reorienting the nematic directors [69] (8) analyzing and optimizing the performance of an LCN multi-legged gripper design [68] (9) study of acoustic properties and behavior of LCNEs [71,72,73] |
| MC | (1) performing large-scale computer simulations for studying the effect of electric field as an actuation tool, to clarify the operational behavior of the LCEs on a molecular level [83] (2) developing MD method that could capture and reproduce experimental results obtained from a variety of experiments including stress strain, order, light transmission and thermal effects [85] (3) studying biaxial LCEs and predicting calorimetry data and deuterium magnetic resonance spectra [86] (4) investigating how sample preparation affects the nematic-isotropic behavior in LCE samples with both regular and irregular polymer networks [88] (5) gaining a better understanding of the anisotropic phenomena exhibited by LCEs [90] (6) Investigation of Shape and volume phase transitions of LCEs for both swollen and non-swollen state [97] |
| MD | (1) predict the way the mechanical response of LCEs with side-chain architectures depends on their chemical structure [60] (2) studying how phase transition from monodomain to polydomain occurs in LCEs on a molecular scale [8] (3) developed a multiscale framework for studying the photomechanical behavior of photo-responsive polymer networks [103] (4) developed a coarse-grained model consisting of mesogenic molecules and smeared charges for the study of Liquid crystal polymers (LCPs) [107] (5) studying which force field among the three, Deriding, PCFF, and SciPCFF potentials should be applied to LCE modeling system [110] |
| Other numerical methods | (1) exploring the dynamical behavior of LCEs [111,112] (2) model thermal–order–mechanical coupling behaviors in LCEs [36] (3) modeling the mechanical procedure by which biological cells exchange information [120] (4) studying the mechanical behavior of Smectic-A LCEs, in response to electromechanical stimuli [124] (5) modeling the electro-elastic behavior of nematic LCEs [128] (6) studying the thermos-mechanical behavior of a soft robot [133] (7) developing a general frame work for studying the interactions between LCs and polymer backbones that constitute a LCE [134] |
| Method | Methodology and Formulation |
|---|---|
| FEM (software) | (1) the authors used an equation proposed by [35] and subsequently derived the linear stress strain relation for soft LCEs[34] (2) By using a non-linear theory developed by Warner and Terentjev [38], in conjunction with stretch test data, the authors were able to derive a linear model for carrying out their numerical analysis on nematic elastomers [37] (3) A modified linear version of the Warner and Terentjev [38] model was used by adding a spatially random temperature fluctuation term [38]. (4) The authors’ developed an empirical model, describing material deformation, using experimental actuation data [41]. (5) user-defined subroutines were developed [25]. (6) a shell conducting model with moving heat source was used [43]. (7) a phase-field model, for continuum-mechanical modeling of nematic LCEs, was implemented into the software [24] (8) A Koiter-type theory was developed, containing two terms: 2D or plane stress alleviation of the relaxed energy of DeSimone and Dolzmann [49] and bending [45] (9) a model first used by [26] was implemented, with two modifications: (a) defining the order parameter and nematic directors in each mesh element (tetrahedral in this case) used for discretizing the sample geometry, (b) insuring that enough number of mesh elements were used so that the directors transitioned smoothly [52]. (10) a statistical definition of microstructure nature of liquid crystal elastomers was presented then a quantitative, physics-based micromechanical model was used [53] |
| FEM (in house codes) | (1) a coarse-grain model was presented which used the definition of energy density[56]. (2) Hamiltonian FEM approach was utilized [26]. (3) instead of a linear strain tensor, a rotationally invariant Green-Lagrange strain tensor was used for deriving the Hamiltonian [27] (4) Linear brick elements were used to perform a low fidelity FE analysis [60] (5) the moving asymptotes (MMA) method was utilized [61] (6) Hybrid particle FE elastodynamics simulations, with tetrahedral meshes, were used [62] (7) based on the VWT energy description, two separate contributing terms for the elastic energy were considered, namely deformation of the nematic director and the other, representing elastic component [69] (8) hyper-elastic model was solved using mixed FEM [68] (9) a transient model was developed that could couple elasticity and hydrodynamics of nematic elastomers [71]. A theory for approximating the behavior of acoustic waves in nematic elastomers was developed [72] two approaches were implemented and tested: one was according to the linear continuum theory of nematic rubber elasticity and in the second, a constitutive relation for rubber behavior was obtained using interpolation of experimental master curve of regular material [73] |
| MC | (1) A semisoft deformation Monte Carlo method, in which the applied external field was perpendicular to the nematic director was used. all liquid crystal molecules were represented by uniaxial ellipsoids and The total interaction energy was obtained by summing up all non-bonded and bonded intermolecular contributions, using Soft-Core Gay–Berne Interaction [83]. (2) a simple coarse-grained lattice model was proposed. By obtaining the total Hamiltonian for LCE and through conducting constant-force Monte Carlo simulations, the simulations were carried out [85]. (3) a coarse-grain model was developed by summing of pseudo-Hamiltonians describing rubber elasticity, anisotropic interactions between biaxial mesogenic units, and the strain-orientational coupling of the polymeric chains [86] (4) main-chain systems were utilized. soft-core GB potential was used for the simulations. Uniaxial soft-core GB ellipsoids were utilized for modeling mesogenic molecules and for assembling LCE networks, and also to illustrate non-bonded swelling monomers [88] (5) Finsler geometry was used for the simulations [90]. A detailed description of Finsler geometry can be found in [91,92]. (6) the Finsler geometry was expanded by adding an Ising-like variable to account for both swollen and nonswollen LCE states [97] |
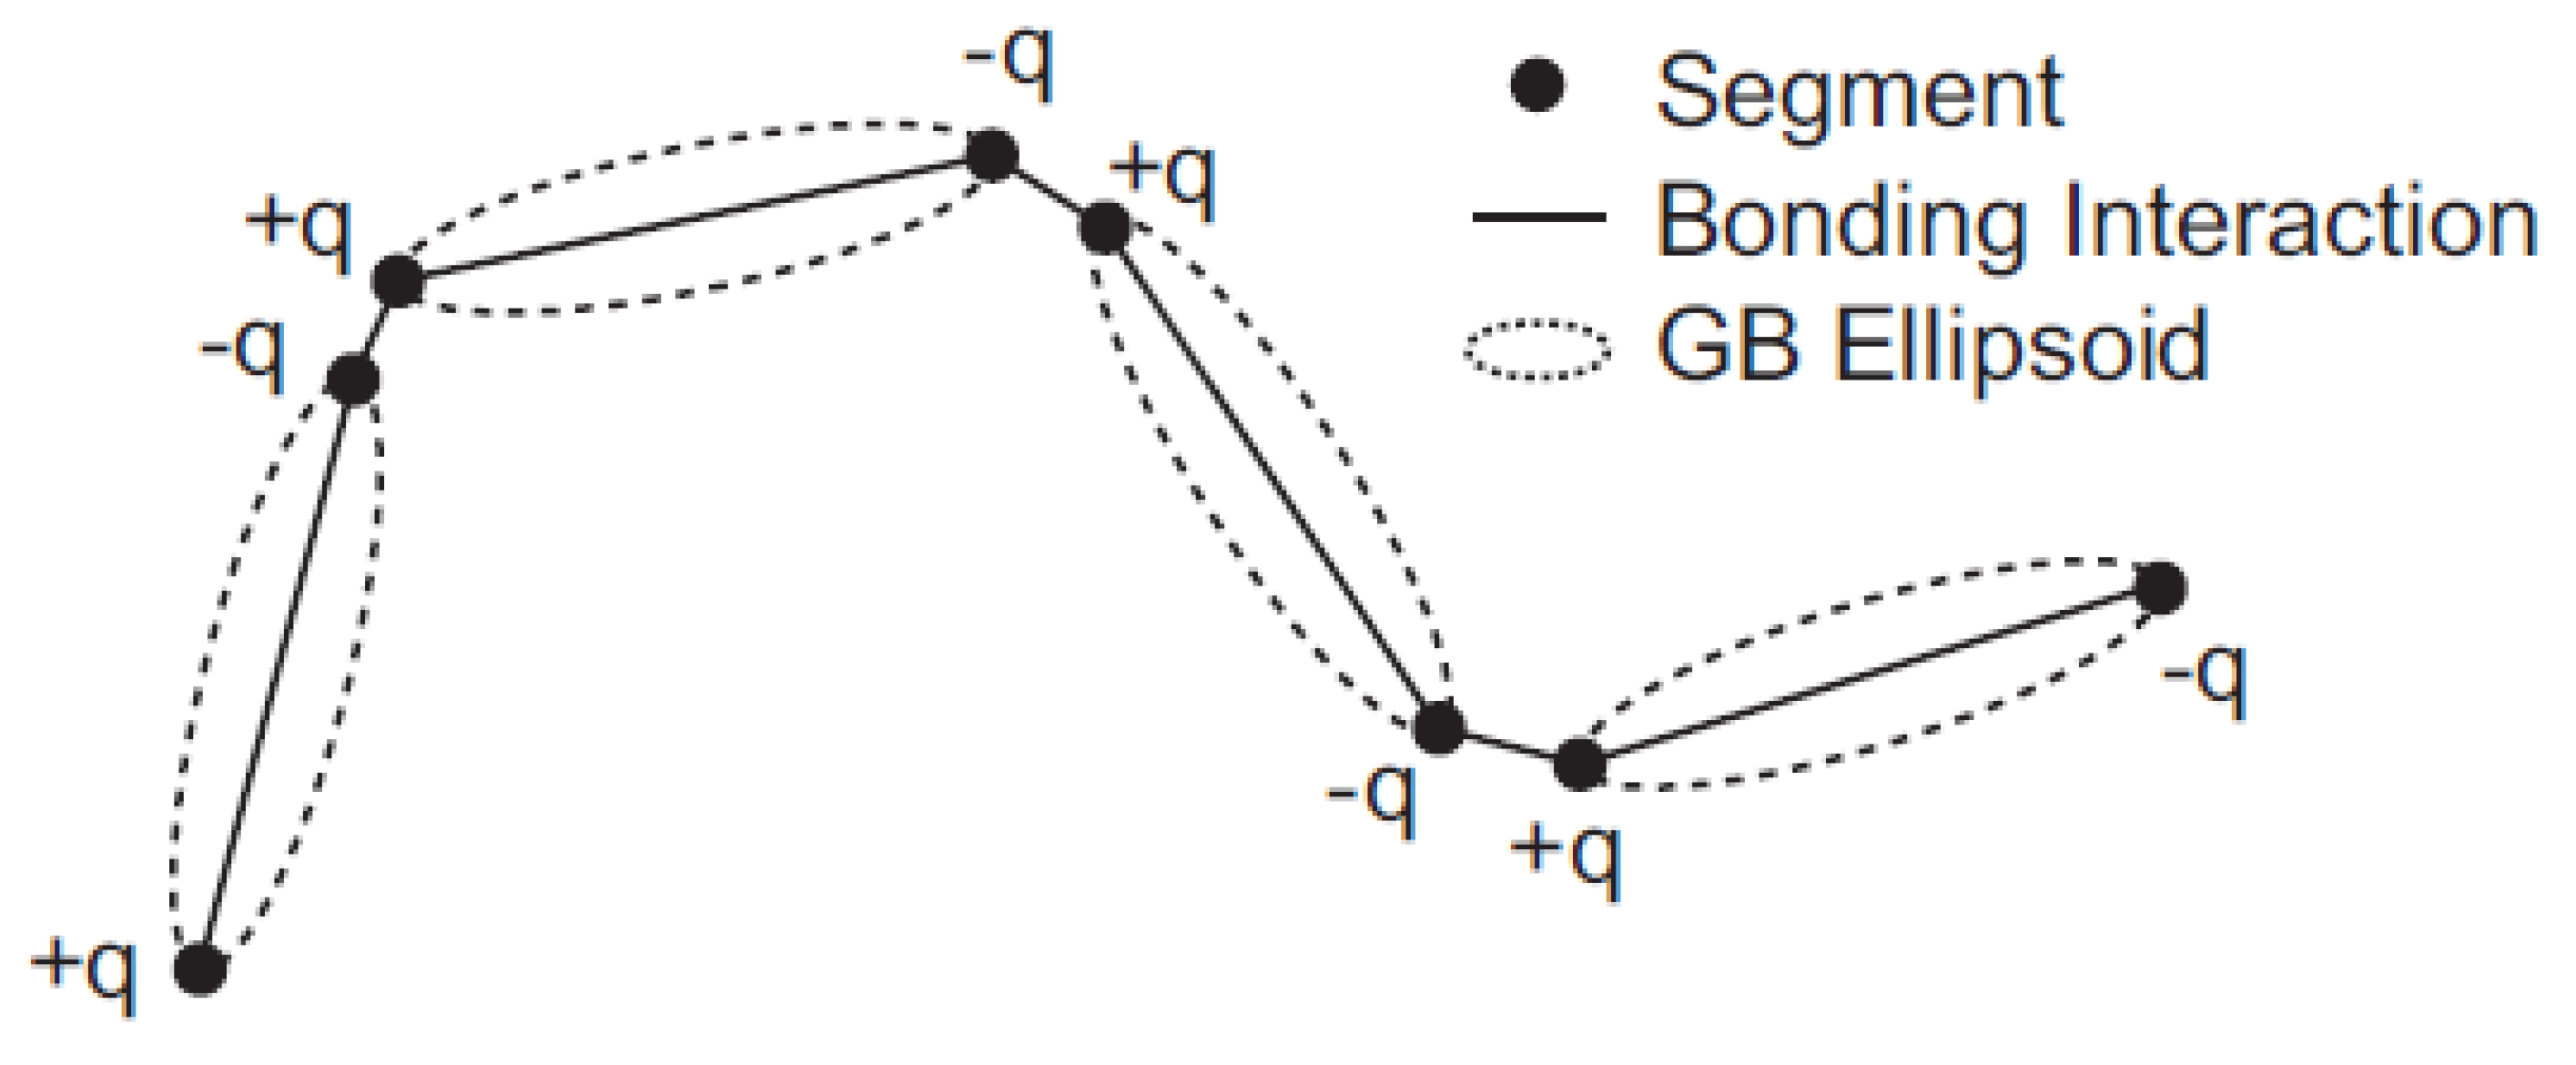
| MD | (1) The elastomer is formed by crosslinking of the melt in the smectic A phase [60] (2) a coarse grain model was used in which ellipsoidal shapes were used to describe the mesogens particles. In addition, Gay-Berne (GB) potential was used to describe the interactions between mesogens [8] (3) The MD method used, is based on the work of Choi et al. [105] and utilizes energetic relaxation and multi-step crosslinking. In order to fully take into effect, the influence of kinked cis- molecules, Landau expansion was substituted for Maier-Saupe phase transition [6] by using a modified heuristic equation [106]. (4) the intermolecular interaction between ellipsoids is modelled using the SCGB potential. Subsequently, for the calculation of the piezoelectric tensor, point charges were introduced. The simulations were done using a course-grained MD program COGNAC [108,109]. (5) LAMMPS was used to find the most appropriate force field for LCE modeling [110] |
| Other numerical methods | (1) non-local continuum model was developed using a novel preconditioner based on Chebyshev spectral collocation method [111,112] (2) total energy was a function of deformation gradient, director direction, order parameter and biaxiality. After deriving equations for mechanical and phase equilibrium, total free energy was considered to be a hybrid of the entropy-induced elastic energy and the Landau– de-Gennes nematic energy [36] (3) soft matter cell model based on Lagrange-type mesh-free Galerkin formulation was developed [120] (4) A free energy density function was obtained by summing contributions from (a) elastic free energy, (b) change in the layer thickness (c) variation in chirality, or equivalently the tilt (or rotation) of the director, (d) energetic contribution of the electrical sources to the total energy and (e) external mechanical loading [124] (5) a continuum-mechanical phase-field approach was adopted. A nemato-electro-elastic model is coupled with the fundamental Landau-de-Gennes theory for isotropic–nematic phase transition [128] (6) transient analytical solution consisting of a one dimensional heat transfer equation (solved using Green’s function) coupled with a bilayer beam model [133] (7) A continuum mechanics model was developed that in addition to taking into account the director or order tensors, along with their respective time derivatives, the deformation gradient and its derivative with respect to time was also considered [134] |
Publisher’s Note: MDPI stays neutral with regard to jurisdictional claims in published maps and institutional affiliations. |
© 2021 by the authors. Licensee MDPI, Basel, Switzerland. This article is an open access article distributed under the terms and conditions of the Creative Commons Attribution (CC BY) license (https://creativecommons.org/licenses/by/4.0/).
Share and Cite
Soltani, M.; Raahemifar, K.; Nokhosteen, A.; Kashkooli, F.M.; Zoudani, E.L. Numerical Methods in Studies of Liquid Crystal Elastomers. Polymers 2021, 13, 1650. https://doi.org/10.3390/polym13101650
Soltani M, Raahemifar K, Nokhosteen A, Kashkooli FM, Zoudani EL. Numerical Methods in Studies of Liquid Crystal Elastomers. Polymers. 2021; 13(10):1650. https://doi.org/10.3390/polym13101650
Chicago/Turabian StyleSoltani, Madjid, Kaamran Raahemifar, Arman Nokhosteen, Farshad Moradi Kashkooli, and Elham L. Zoudani. 2021. "Numerical Methods in Studies of Liquid Crystal Elastomers" Polymers 13, no. 10: 1650. https://doi.org/10.3390/polym13101650