Article

Electrospun Composites Made of Reduced Graphene Oxide and Polyacrylonitrile-Based Activated Carbon Nanofibers (rGO/ACNF) for Enhanced CO2 Adsorption

by
Faten Ermala Che Othman
1,
Norhaniza Yusof
1,
Javier González-Benito
2,*,
Xiaolei Fan
3 and
Ahmad Fauzi Ismail
1
1
Advanced Membrane Technology Research Centre (AMTEC), School of Chemical and Energy Engineering, Faculty of Engineering, Universiti Teknologi Malaysia, Johor Bahru 81310, Malaysia
2
Department of Materials Science and Engineering and Chemical Engineering, IQMAAB, Universidad Carlos III de Madrid, Avda. Universidad 15, Leganés, 28911 Madrid, Spain
3
Department of Chemical Engineering and Analytical Science, School of Engineering, The University of Manchester, Manchester M13 9PL, UK
*
Author to whom correspondence should be addressed.
Polymers 2020, 12(9), 2117; https://doi.org/10.3390/polym12092117
Submission received: 18 August 2020 / Revised: 9 September 2020 / Accepted: 14 September 2020 / Published: 17 September 2020
(This article belongs to the Special Issue Multifunctional Polymer Nanocomposites)

Abstract

:
In this work, we report the preparation of polyacrylonitrile (PAN)-based activated carbon nanofibers composited with different concentrations of reduced graphene oxide (rGO/ACNF) (1%, 5%, and 10% relative to PAN weight) by a simple electrospinning method. The electrospun nanofibers (NFs) were carbonized and physically activated to obtain activated carbon nanofibers (ACNFs). Texture, surface and elemental properties of the pristine ACNFs and composites were characterized using various techniques. In comparison to pristine ACNF, the incorporation of rGO led to changes in surface and textural characteristics such as specific surface area (SBET), total pore volume (Vtotal), and micropore volume (Vmicro) of 373 m2/g, 0.22 cm3/g, and 0.15 cm3/g, respectively, which is much higher than the pristine ACNFs (e.g., SBET = 139 m2/g). The structural and morphological properties of the pristine ACNFs and their composites were studied by Raman spectroscopy and X-ray diffraction (XRD), and field emission scanning electron microscopy (FE-SEM) respectively. Carbon dioxide (CO2) adsorption on the pristine ACNFs and rGO/ACNF composites was evaluated at different pressures (5, 10, and 15 bars) based on static volumetric adsorption. At 15 bar, the composite with 10% of rGO (rGO/ACNF0.1) that had the highest SBET, Vtotal, and Vmicro, as confirmed with BET model, exhibited the highest CO2 uptake of 58 mmol/g. These results point out that both surface and texture have a strong influence on the performance of CO2 adsorption. Interestingly, at p < 10 bar, the adsorption process of CO2 was found to be quite well fitted by pseudo-second order model (i.e., the chemisorption), whilst at 15 bar, physisorption prevailed, which was explained by the pseudo-first order model.

Graphical Abstract

1. Introduction

The massive emissions of anthropogenic carbon dioxide (CO2) gas into the atmosphere are considered as the main reason for the occurrence of global warming and climate change [1,2]. Human activities such as the combustion of fossil fuels in industry, especially in the power generation sector, are major emission sources of CO2 into the atmosphere [3,4]. In mid-August 2020, according to the latest update from Mouna Loa Observatory [5], the increment of CO2 concentration was recorded as 3.02 ppm from August 2019 to August 2020 and reached up to 412.97 ppm as compared to the previous year’s concentration, i.e., 409.95 ppm, which is an alarming rate, since CO2 concentration in the atmosphere at <350 ppm is considered safe [6]. There was a temporary reduction in daily global CO2 emissions during the COVID-19 forced confinement in April 2020 reported by Le Quéré et al. (2020), but this does not really reflect structural changes in the economic, transport or energy system [7]. Various agreements have been developed among nations worldwide, including the Kyoto Protocol and Paris Agreement, to face the challenges caused by carbon emission, especially CO2 emission. Accordingly, this has encouraged many research efforts around the world to develop advanced materials, techniques and strategies to address the problems associated with CO2 emission. Popular strategies have been explored and adopted, including the utilization of low carbon fuels and renewable energy sources, and CO2 capture, storage and utilization from their source points [8].
Carbon capture and storage (CCS) is a promising approach to mitigate anthropogenic CO2 with the capacity to reduce up to 22% of CO2 emissions in 2035 [3]. These past few decades, absorption is the common method in CCS for CO2 capture and separation from flue gases in power plants. However, CO2 absorption via amine scrubbing possesses apparent disadvantages, such as the release of toxic gases and chemicals, high energy requirement for regeneration, and extensive corrosion of the equipment, which limit the practical application of this technology. Although amine-scrubbing has been widely employed in industrial applications, due to their disadvantages, the development of practical yet sustainable alternatives is still highly desired [9,10]. Consequently, other alternative and effective methods, such as adsorption, have been suggested, due to its simplicity in operation [2], low energy requirement, ease of regeneration, environmental-friendly, and cost-effective [11]. Adsorption employs solid porous adsorbents such as silica [12], zeolites [13], activated carbon [11], metal organic frameworks (MOF) [14,15,16], carbon nanotubes (CNT) [17], metal oxides [18], and graphene [19], to adsorb adsorbate molecules, especially CO2, onto the porous structures. Amongst the available adsorbents being investigated, porous ones such as activated carbons (ACs) were preferred due to their low cost, high surface area and porosity, high adsorption capability, high amenability to modify the pore structure and functionalize the surface, low energy requirements for regeneration, as well as hydrophobicity [20,21].
ACs in granular and powdered form are the most commonly used adsorbent [21]. Generally, ACs have relatively low micropore volume and multimodal pore size distribution, which are the main factors to limit their adsorption capabilities. Conversely, in comparison with the conventional ACs, newly developed fibrous ACs, also known as activated carbon nanofibers (ACNFs) [22], have shown the improved adsorption capacity due to the fibrous structure and presence of accessible micropores from their external surface [23], which reduce the mass transfer resistance for adsorbate diffusion to reach the adsorption sites. Polyacrylonitrile (PAN) is the most used polymer in electrospinning of NFs due to its high carbon yield and thermal-stable at high temperature treatments. Although the developed pristine PAN-based ACNFs has shown the improved adsorption performance as compared with the commercial ACs, recent study disclosed that the inclusion of nanofillers/additives could further improve the surface area and micropore volume of the modified ACNFs [24,25]. In comparison with other additives, graphene and graphene oxide with novel properties and economical carbon-based materials have been the potential candidates for adsorbent materials due to their large theoretical specific surface area (SBET) and high porosity [26,27]. These excellent properties have opened up the utilization of graphene in a wide range of applications, including supercapacitors, biomedicals, fuel cells, energy storage etc. [28]. Accordingly, graphene-based composites such as nitrogen-doped graphene oxide sheets (N-GOs) have been proposed by Alghamdi et al. (2018) [29] for energy storage applications related to gas adsorption and separation. They have observed that the N-GOs demonstrated a good CO2 adsorption capacity of 1.36 mmol/g. Notably, the selection of GO in this study is also because the GO can be mass-produced from inexpensive graphite as raw materials and a cost-effective method which made the reduced GO (rGO) composites into economical adsorbents.
Here, this work reports the preparation of novel carbonaceous composites of reduced graphene oxide (rGO) doped PAN-based activated carbon nanofibers, i.e., rGO/ACNF using a simple electrospinning method and pyrolysis process. Up to now, there is no publication that extensively discussed the utilization of PAN-based rGO/ACNFs composites for CO2 adsorption. Therefore, the main novelty of this present work is to develop and characterize the rGO/ACNF composites (with different rGO loadings) using different techniques to understand their physicochemical properties and assess for CO2 adsorption (using a volumetric adsorption system at 5–15 bar) to evaluate their potentials for CCS. Kinetics of CO2 adsorption of the materials under investigation are also studied in detail to understand their adsorption mechanisms and performance.

2. Materials and Methods

2.1. Synthesis of Reduced Graphene Oxide (rGO)

The graphite powder (~325 mesh, 99%) was purchased from Alfa Aesar, and other chemicals such as sulphuric acid (H2SO4), sodium nitrate (NaNO3), potassium permanganate (KMnO4), hydrogen chloride (HCl), and hydrogen peroxide (H2O2) were obtained from Merck and used without further purification. Graphene oxide (GO) was prepared from natural graphite powder using a conventional Hummer’s method. Then, 150 mL of concentrated H2SO4 was added into the mixture of graphite powder and NaNO3. The suspension was vigorously stirred at <20 °C in an ice bath, followed by the addition of KMnO4 (18 g). Then, the temperature of the solution was increased slowly to 35 °C, and the mixture was stirred for another 30 min before it was quenched by adding 300 mL of deionized (DI) water. The temperature of the mixture was then raised to 98 °C and stirred overnight. Afterward, 300 mL of 30% H2O2 was introduced into the mixture, which was followed by the addition of 5% HCl solution to remove any metal ions left over [30]. The resulting solid was washed several times with DI water (until the neutral pH was achieved), separated by vacuum filtration and dried under vacuum (at 50 °C for 24 h) to obtain the GO. To obtain rGO, the GO sample was thermally reduced and exfoliated under thermal condition at >800 °C and inert atmosphere [31,32].

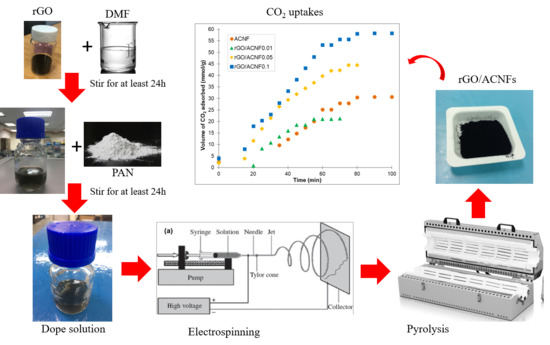
2.2. Preparation of Activated Carbon Nanofibers Nanocomposites (gACNFs)

rGO (1, 5 and 10 wt. %, respectively, relative to the weight of polymer polyacrylonitrile, PAN; 150,000 molecular weight of kDa) was dispersed in dimethylformamide (DMF; 99.999%) and sonicated under stirring for 24 h at room temperature until the homogenous solution was obtained. Both polymer and solvent were procured from Sigma-Aldrich. PAN (8 wt. % relative to the total weight) was added into the solution, and the solution was stirred again for 24 h at room temperature to obtain a homogenous solution [25]. Detailed formulation was shown in Table S1 (Supplementary Materials).
PAN-based NFs were prepared using the optimum electrospinning conditions established by our previous research [30]. Specifically, the injection flow rate was 1.0 mL/h, voltage power was 10 kV, and the distance between the needle tip and collector was 15 cm. Furthermore, the ambient parameters inside the chamber including the humidity, temperature, and air velocity were also controlled during the operation. The obtained pristine and composite nanofibers (with 1, 5, and 10 wt. % rGO loading) were denoted as NF, rGO/NF0.01, rGO/NF0.05, and rGO/NF0.1, respectively. Activated carbon nanofibers (ACNF) were produced by subjecting the electrospun NFs to three stages of pyrolysis, including thermal stabilization (oxidation), carbonization, and activation, where the experimental details were described elsewhere [25,33]. The activated NFs were denoted as ACNF, rGO/ACNF0.01, rGO/ACNF0.05, and rGO/ACNF0.1 accordingly.

2.3. Characterization of Materials

Porous structures of the materials under investigation were characterized by using nitrogen (N2) adsorption/desorption analysis at −196 °C on Micromeritics Tristar II 3020, and the specific surface area (SBET) was calculated using the Brunauer–Emmett–Teller (BET) method. Prior N2 sorption analysis, the sample was degassed at 100 °C under vacuum for at least 24 h. The total pore volume (Vtotal) was measured from the adsorption amounts of N2 gas at p/p0 = 0.99 and the micropore volume (Vmicro) was determined by density functional theory (DFT). The mesopore volumes (Vmeso) were calculated by subtracting the Vmicro from Vtotal. The structural transformation and degree of graphitization of the materials were analyzed using Raman spectroscopy (on Raman Xplora Plus spectrometer). To study the phase structure and crystallinity of the materials, an X-ray diffractometer (XRD, Rigaku SmartLab; Rigaku Corporation, The Woodlands, TX, United States) was used. Surface morphology and diameter, as well as the elemental composition of the materials, were analyzed using field electron scanning emission microscope coupled with elemental dispersive X-ray spectroscopy (FE-SEM-EDX, Hitachi SU8020; Hitachi High-Technologies Corporaation, Tokyo, Japan). Prior to FE-SEM analysis, all samples were dried at 100 °C and stored in a desiccator overnight.

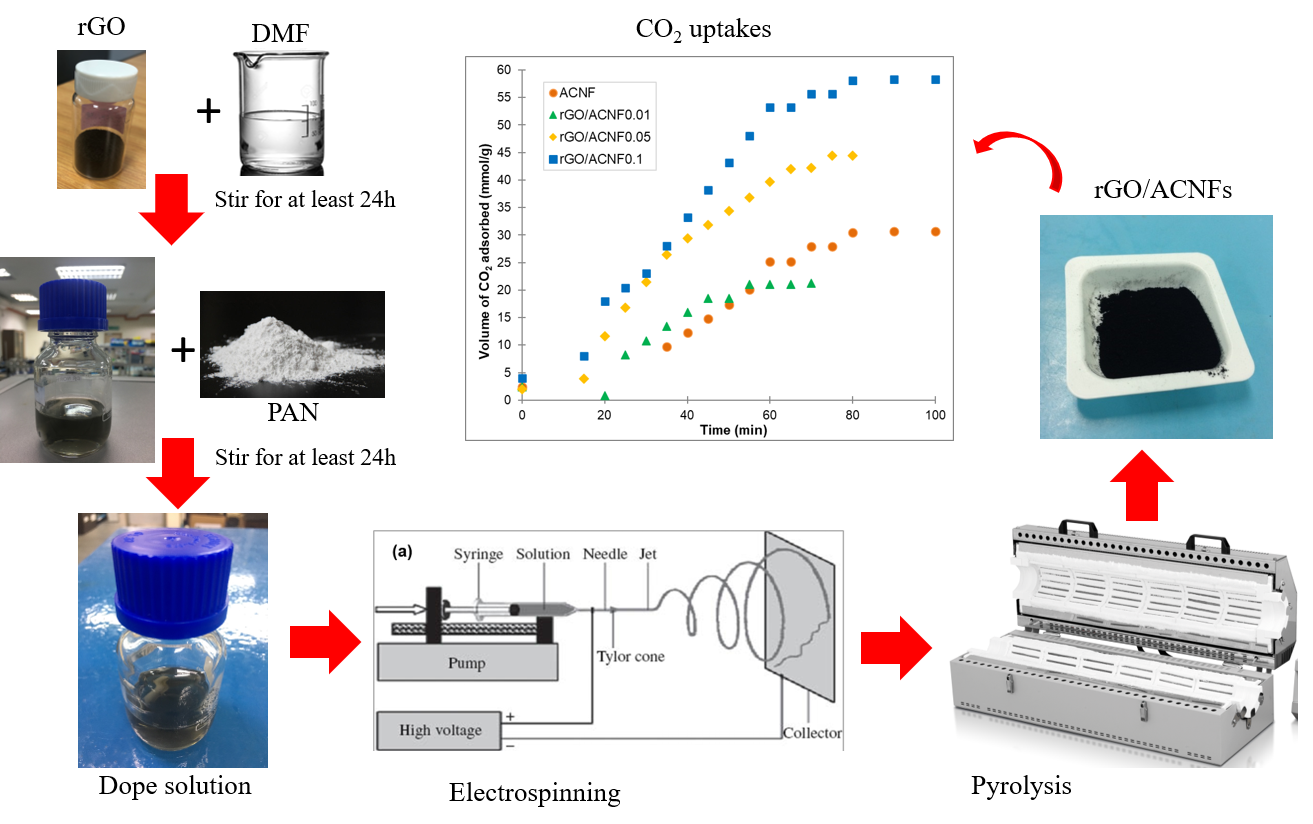
2.4. CO2 Adsorption Experiments

Static volumetric CO2 adsorption measurements were performed on the same rig as the one shown in Figure 1. Prior to CO2 adsorption, the sample (~0.5 g) was dried under vacuum at 150 °C for 12 h to remove the moisture. In each test, the ACNFs and CO2 were loaded into adsorption cell (AC) and loading cell (LC), respectively, until the pressure achieved the required levels. The gas adsorption test was started once the pressure reached the desired level (5, 10 and 15 bar), by introducing the CO2 (adsorbates) with the ACNFs (adsorbent) in the AC by turning the valve between the AC and LC. The selection of these three pressures is to determine the adsorption capacity of both pristine and composite ACNFs at low and moderate pressures. The pressure and temperature in both AC and LC were recorded every 5 min until the pressure reached equilibrium. The adsorption equilibrium was achieved when both pressure and temperature were constant for approximately 10 min. The amount of CO2 adsorbed was calculated by using Equation (1):
q =   1 m [ V v R ( | P Z T | i   | P Z T | e q ) a +   ( | P Z T | i   | P Z T | e q ) l ]
where m is the adsorbent mass (g), q is the amount of gas adsorbed (mmol/g), P is pressure (bar), T is temperature (K), V is volume (cm3), R is the gas constant, while the subscripts a, l, i, and eq refer to adsorption cell, loading cell, the initial state and adsorption final equilibrium state, respectively. Z is the compressibility factor [34].
The CO2 adsorption performance of pristine ACNF and composite were evaluated as a function of time, until equilibrium is reached at room temperature and different adsorption pressures of 5, 10, and 15 bar. In this study, only a rGO/ACNF0.1 composite was used for further assessment (kinetic studies) to compare with the pristine ACNFs, due its comparatively high N2 and CO2 adsorption performance and the associated high SBET value.

2.5. Kinetic Studies

Apart from the study of adsorption capacity, when a new system is evaluated in terms of its potentiality for industrial applications, an understanding of adsorption kinetics is also necessary. In principle, kinetic parameters should provide information about mass transfer rates of the adsorbates trough the external adsorbed layer or layers, macropores and micropores of the adsorbent. Up to now, literature provides several kinetic models [11,35,36]. In general, experimental data obtained are fitted with the functions associated to those models to finally select the best fitting to choose the model describing the kinetics of the adsorption process.
Lagergren’s pseudo-first order and pseudo-second order of kinetic models were used to study the experimental data of CO2 adsorption on the materials at different times. The pseudo-first order assumes that the adsorption rate is proportional to the number of free adsorption sites on the surface of the adsorbent. The linear equation of this model is shown as follows:
l n ( q e   q t ) =   ln q e k 1 t
where qt is the weight-specific adsorbed amount of the adsorbate at time t (s) during the adsorption process (mmol/g), qe is the weight-specific adsorbed amount of the adsorbate at the end of equilibrium (mmol/g), and k1 is the adsorption rate constant of the pseudo-first order model.
Therefore, if the representation of l n ( q e   q t ) versus time can be well fitted to a straight line, then it can be said that adsorption of CO2 obeys the pseudo-first order model. In general, this pseudo-first order model explains reversible interactions between adsorbent and adsorbate and therefore accounts for physisorption processes [11].
On the other hand, the pseudo-second order considers that the adsorption rate is proportional to the square of vacant adsorption sites on the adsorbent surface and the linear equation, as shown in Equation (3).
t q t =   1 k 2 q e 2   + 1 q e t
where k 2 (mmol/g) is the adsorption rate constant for the pseudo-second order equation. Therefore, if the representation of t/qt versus time can be well fitted to a straight line, then it can be said that adsorption of CO2 obeys the pseudo-second order model. This pseudo-second order model explains relatively strong interactions, chemical interactions, between the gas molecules and the adsorbent, therefore the process would be represented by a chemisorption as the rate controlling step [37]. Both k 1 and k 2 values can be obtained from the slopes of the corresponding fitted straight lines.

3. Results and Discussion

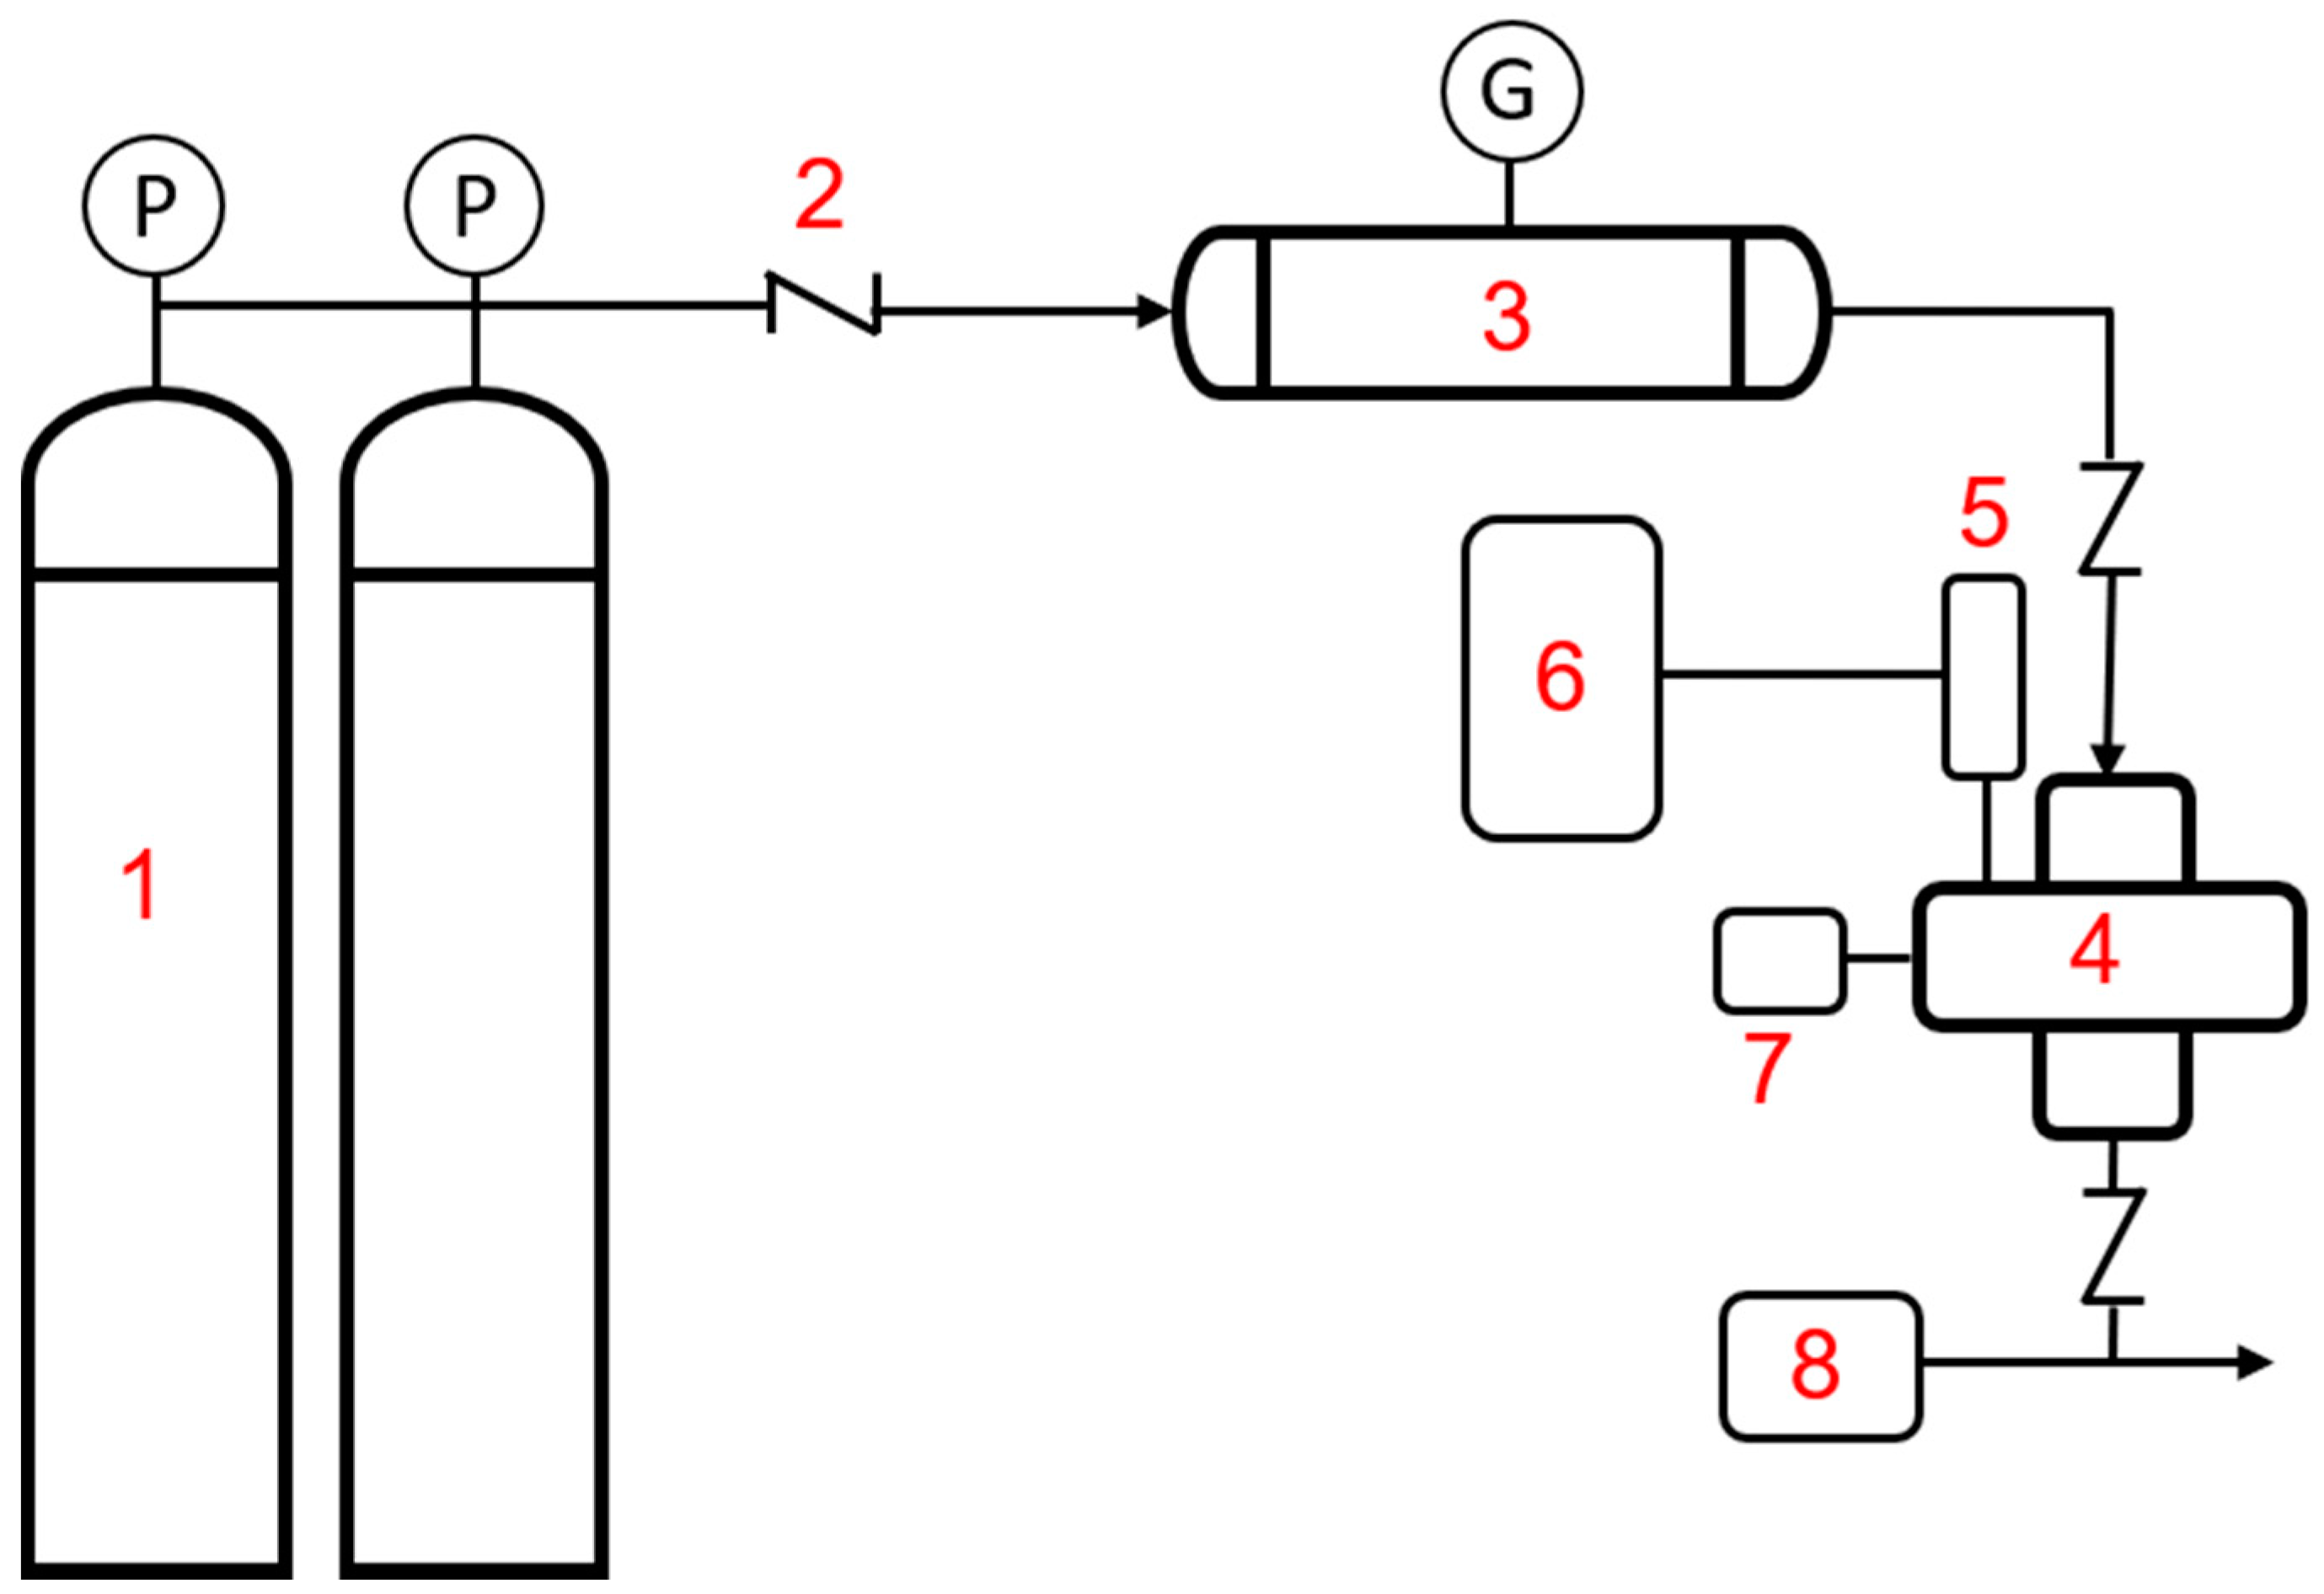
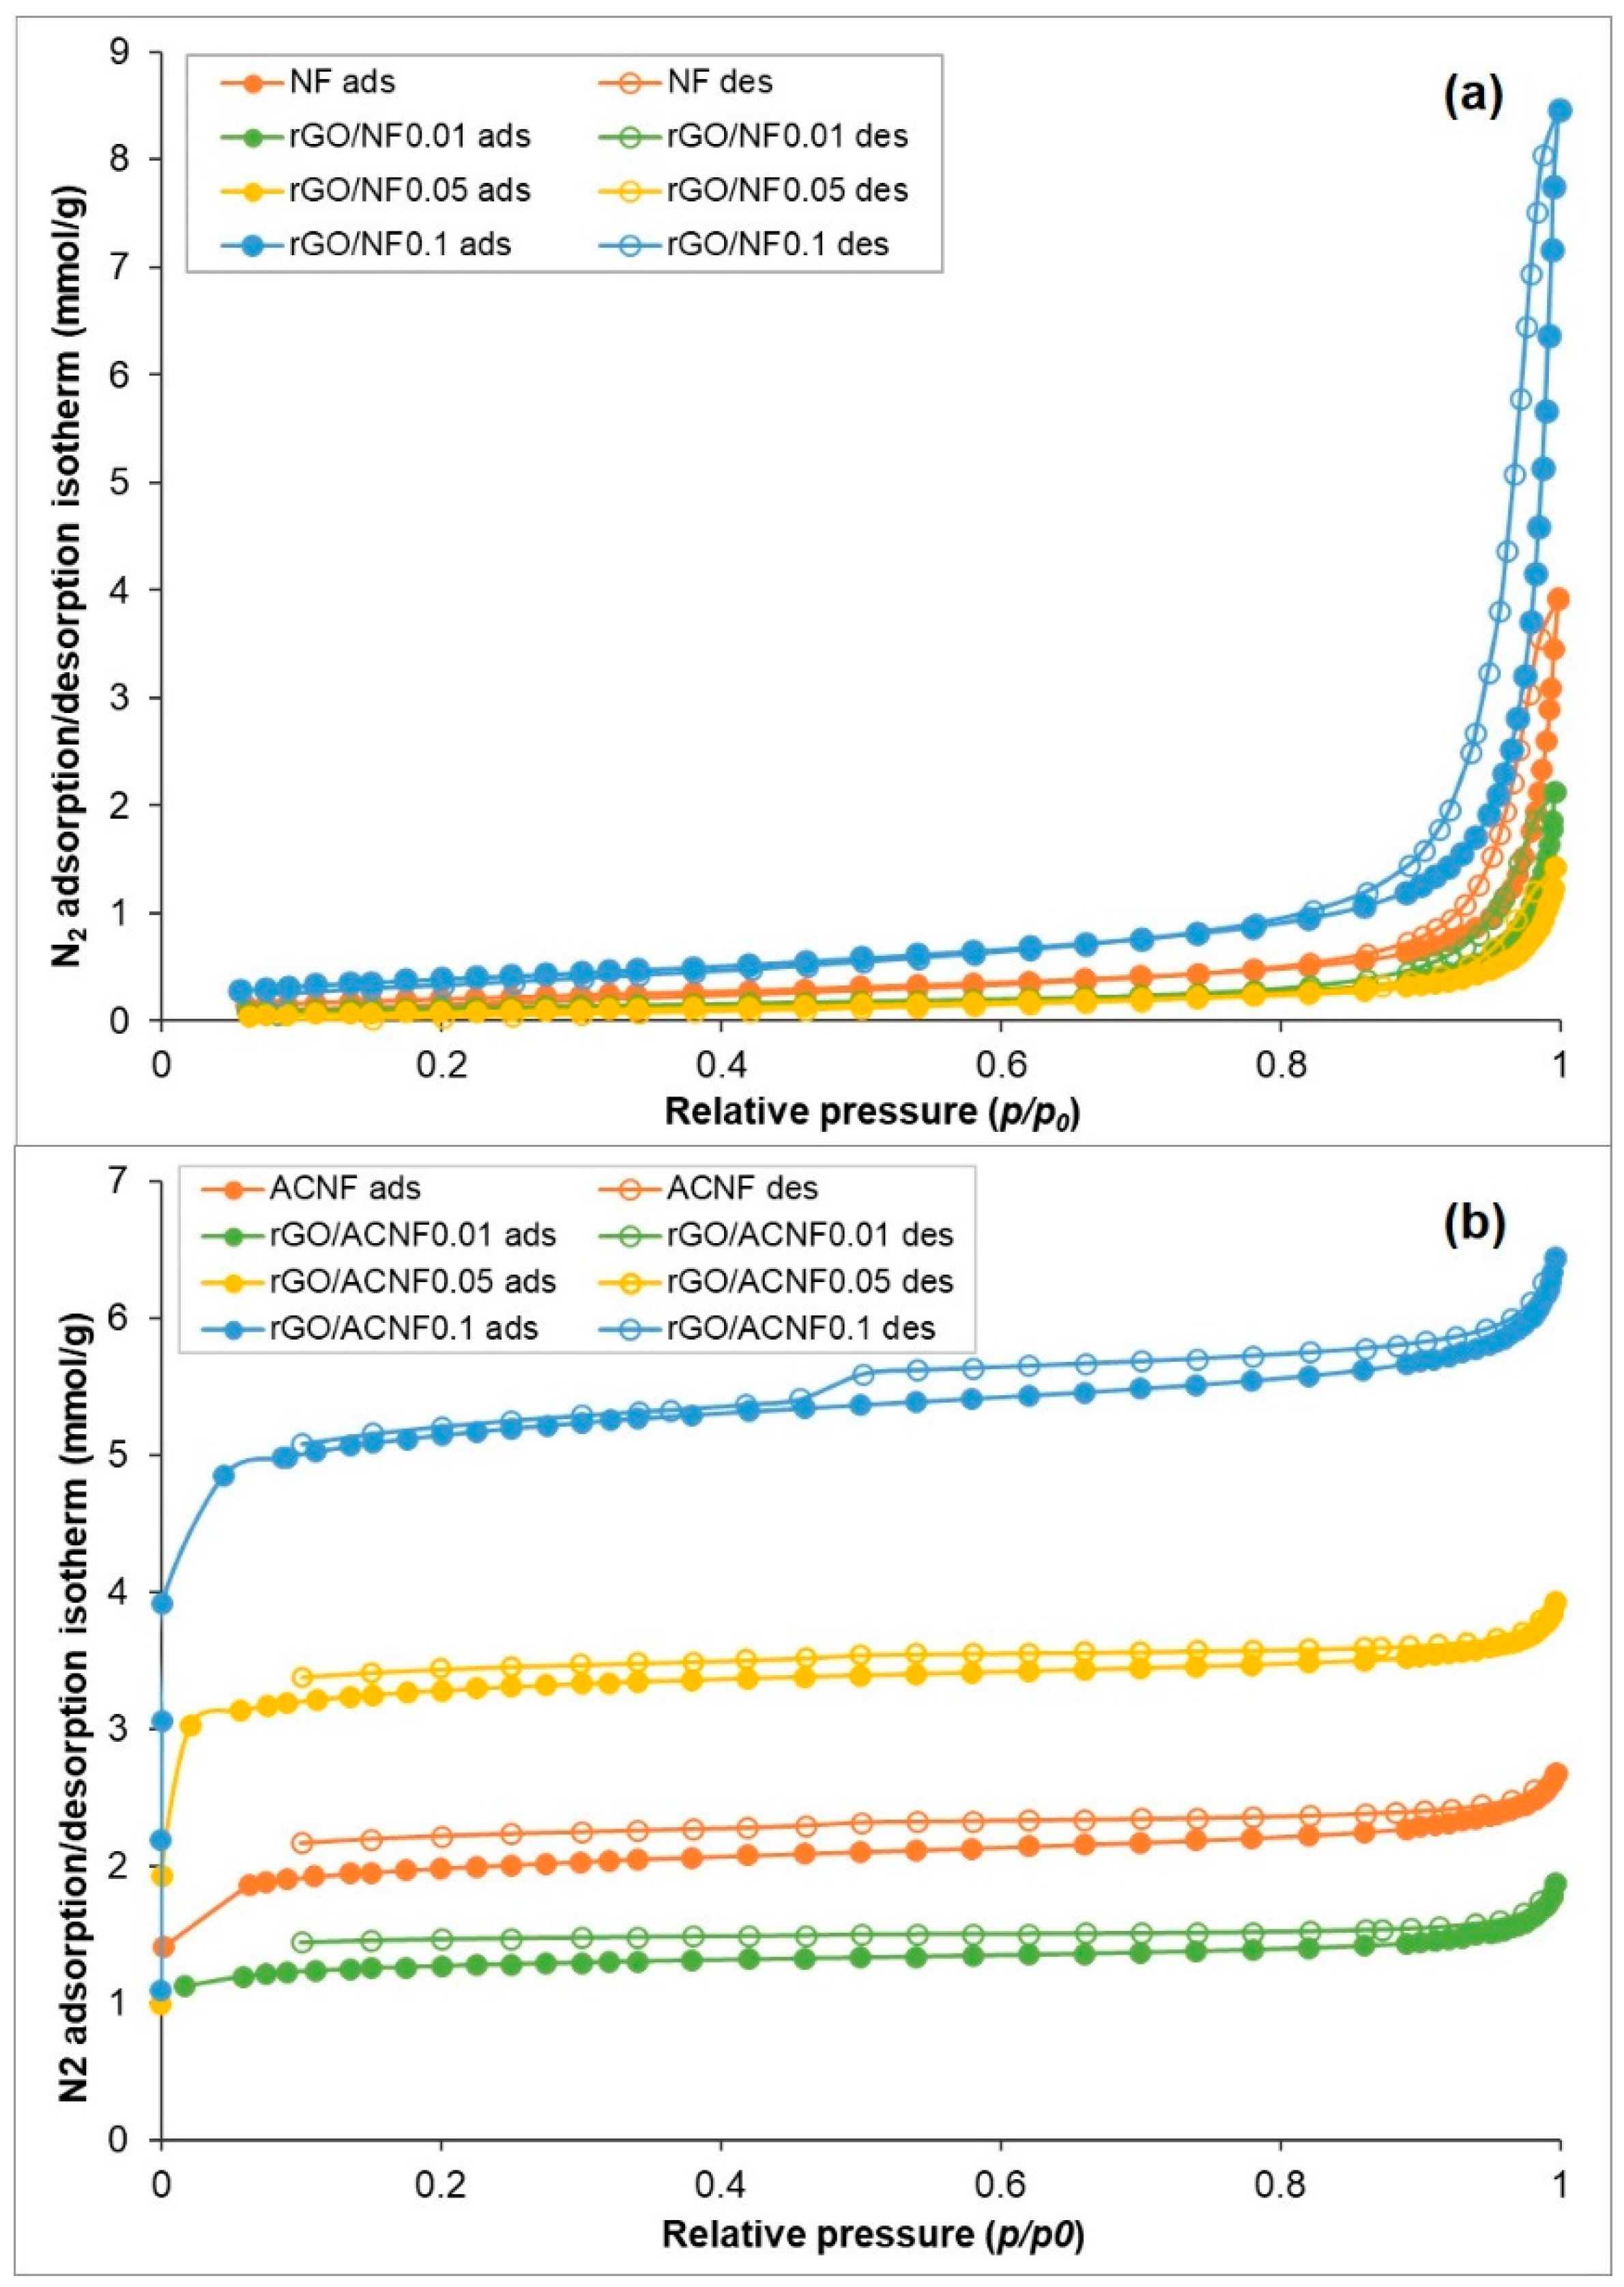
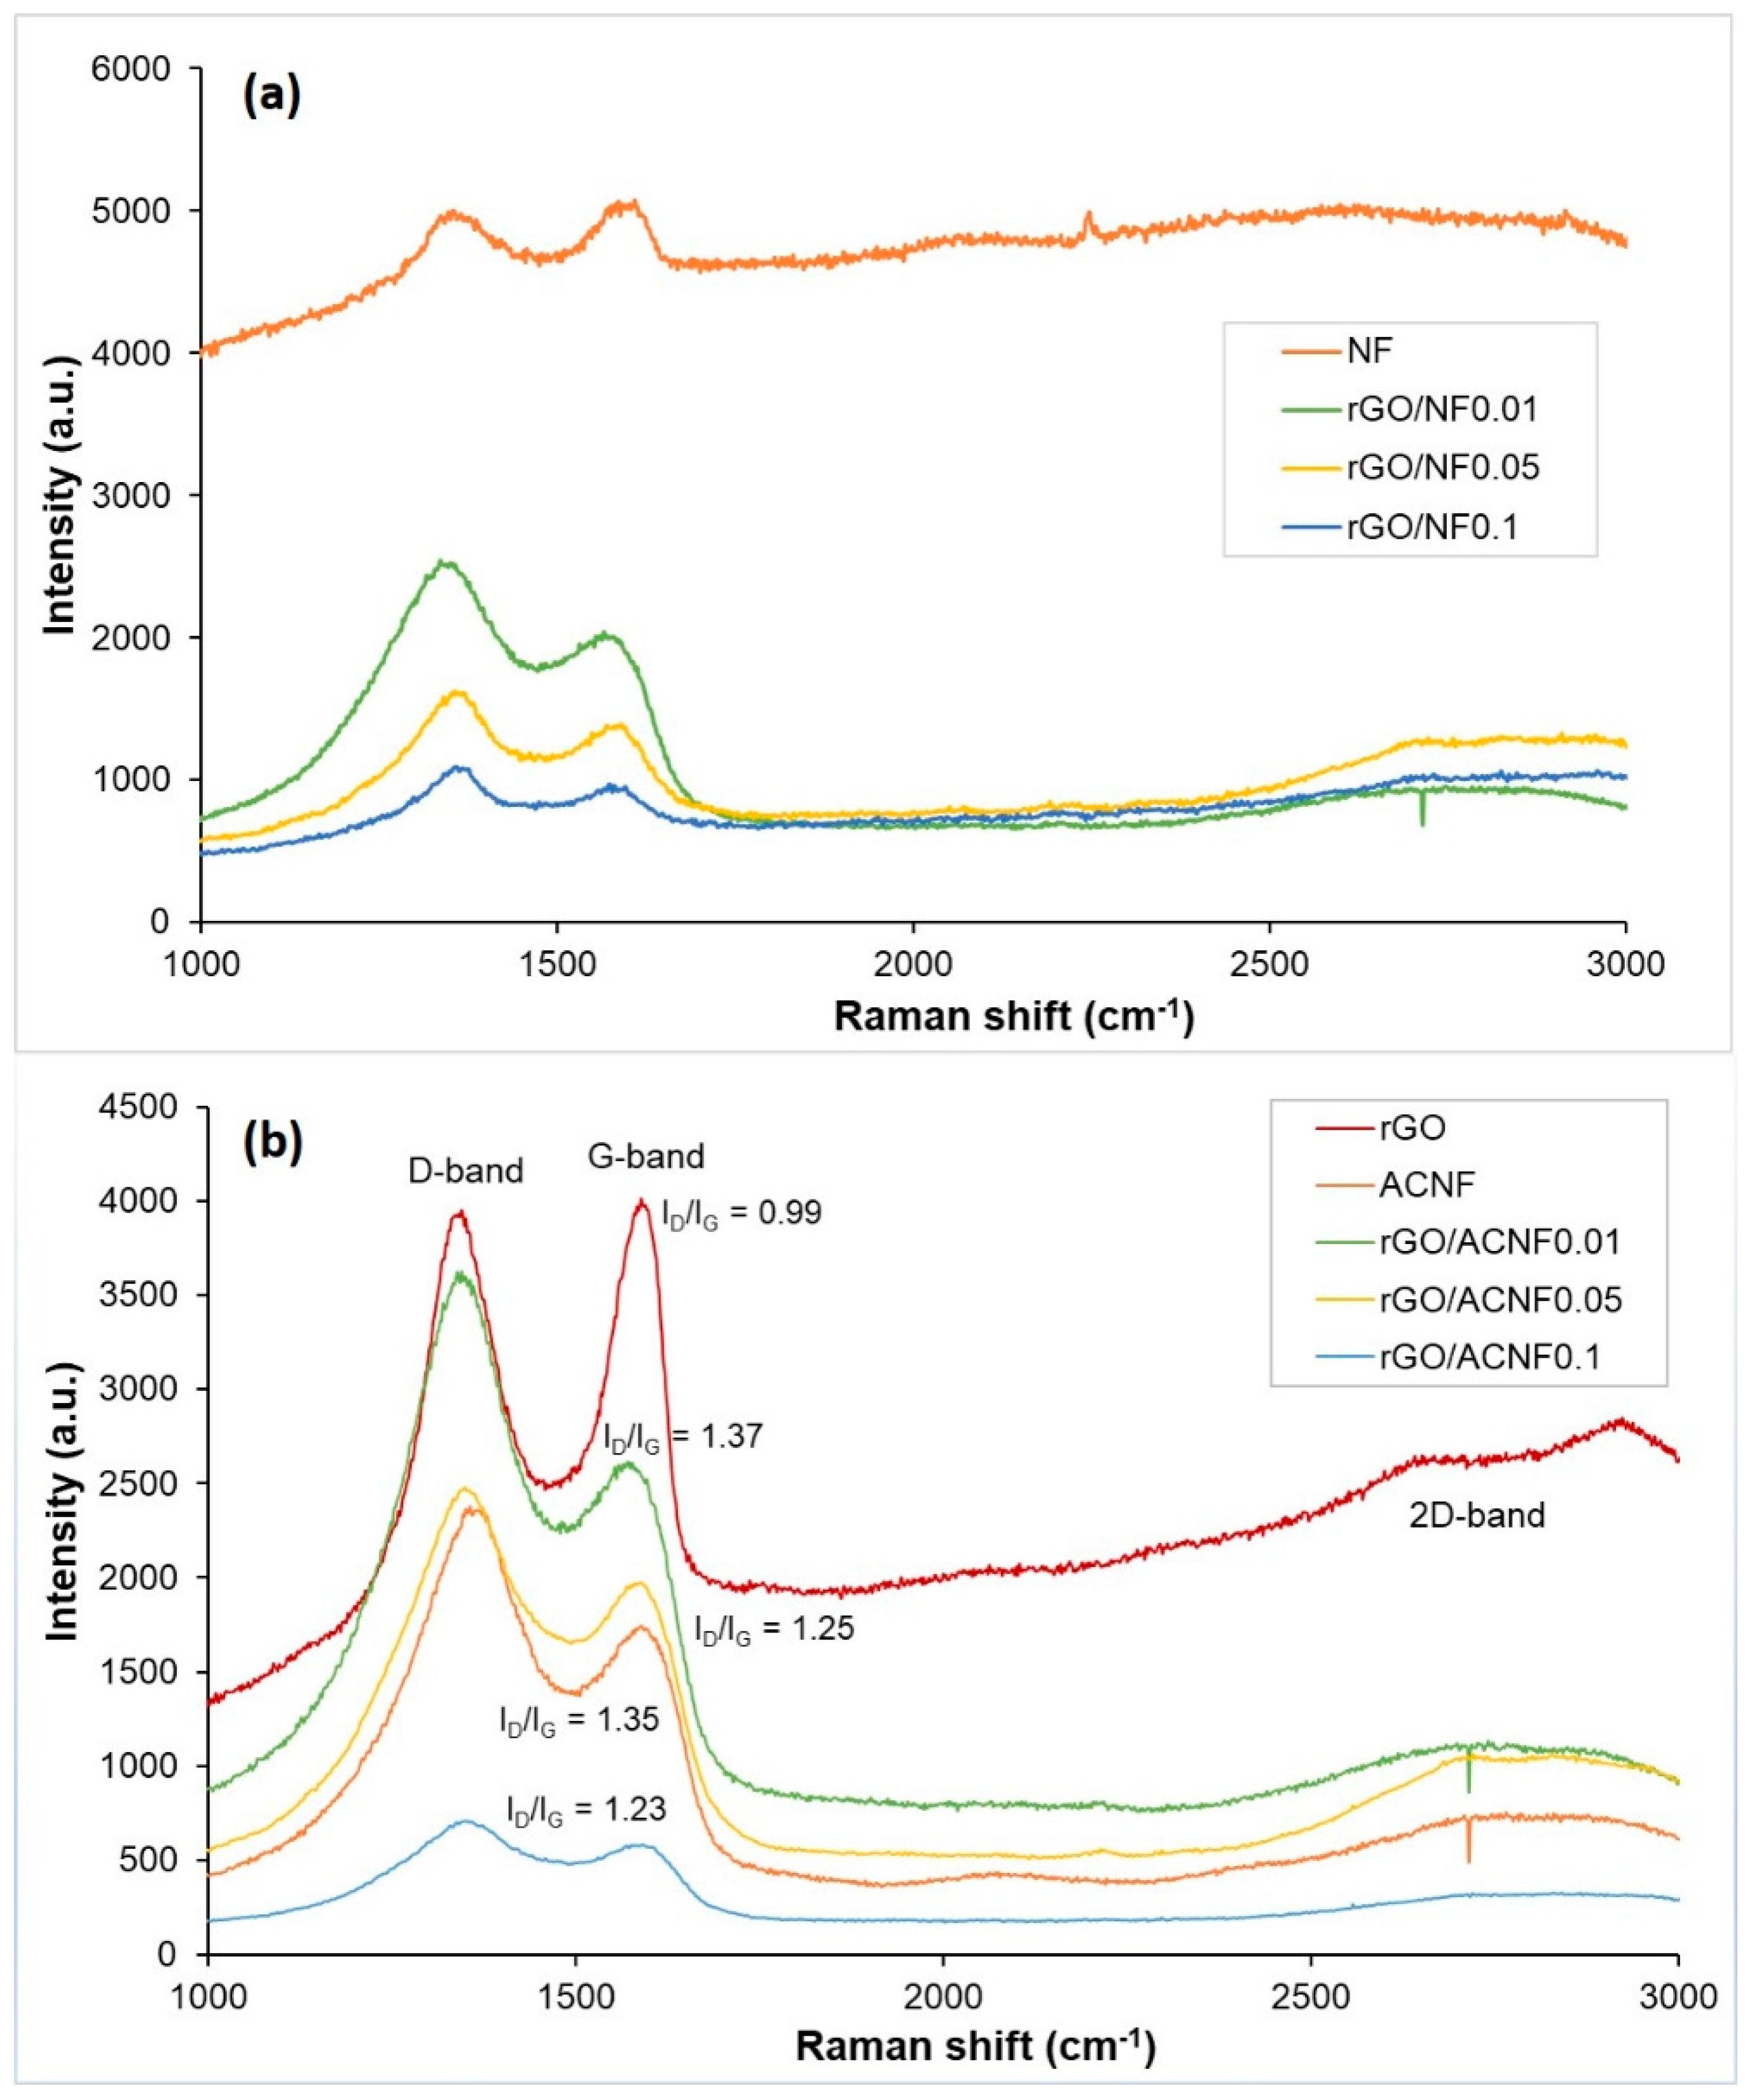
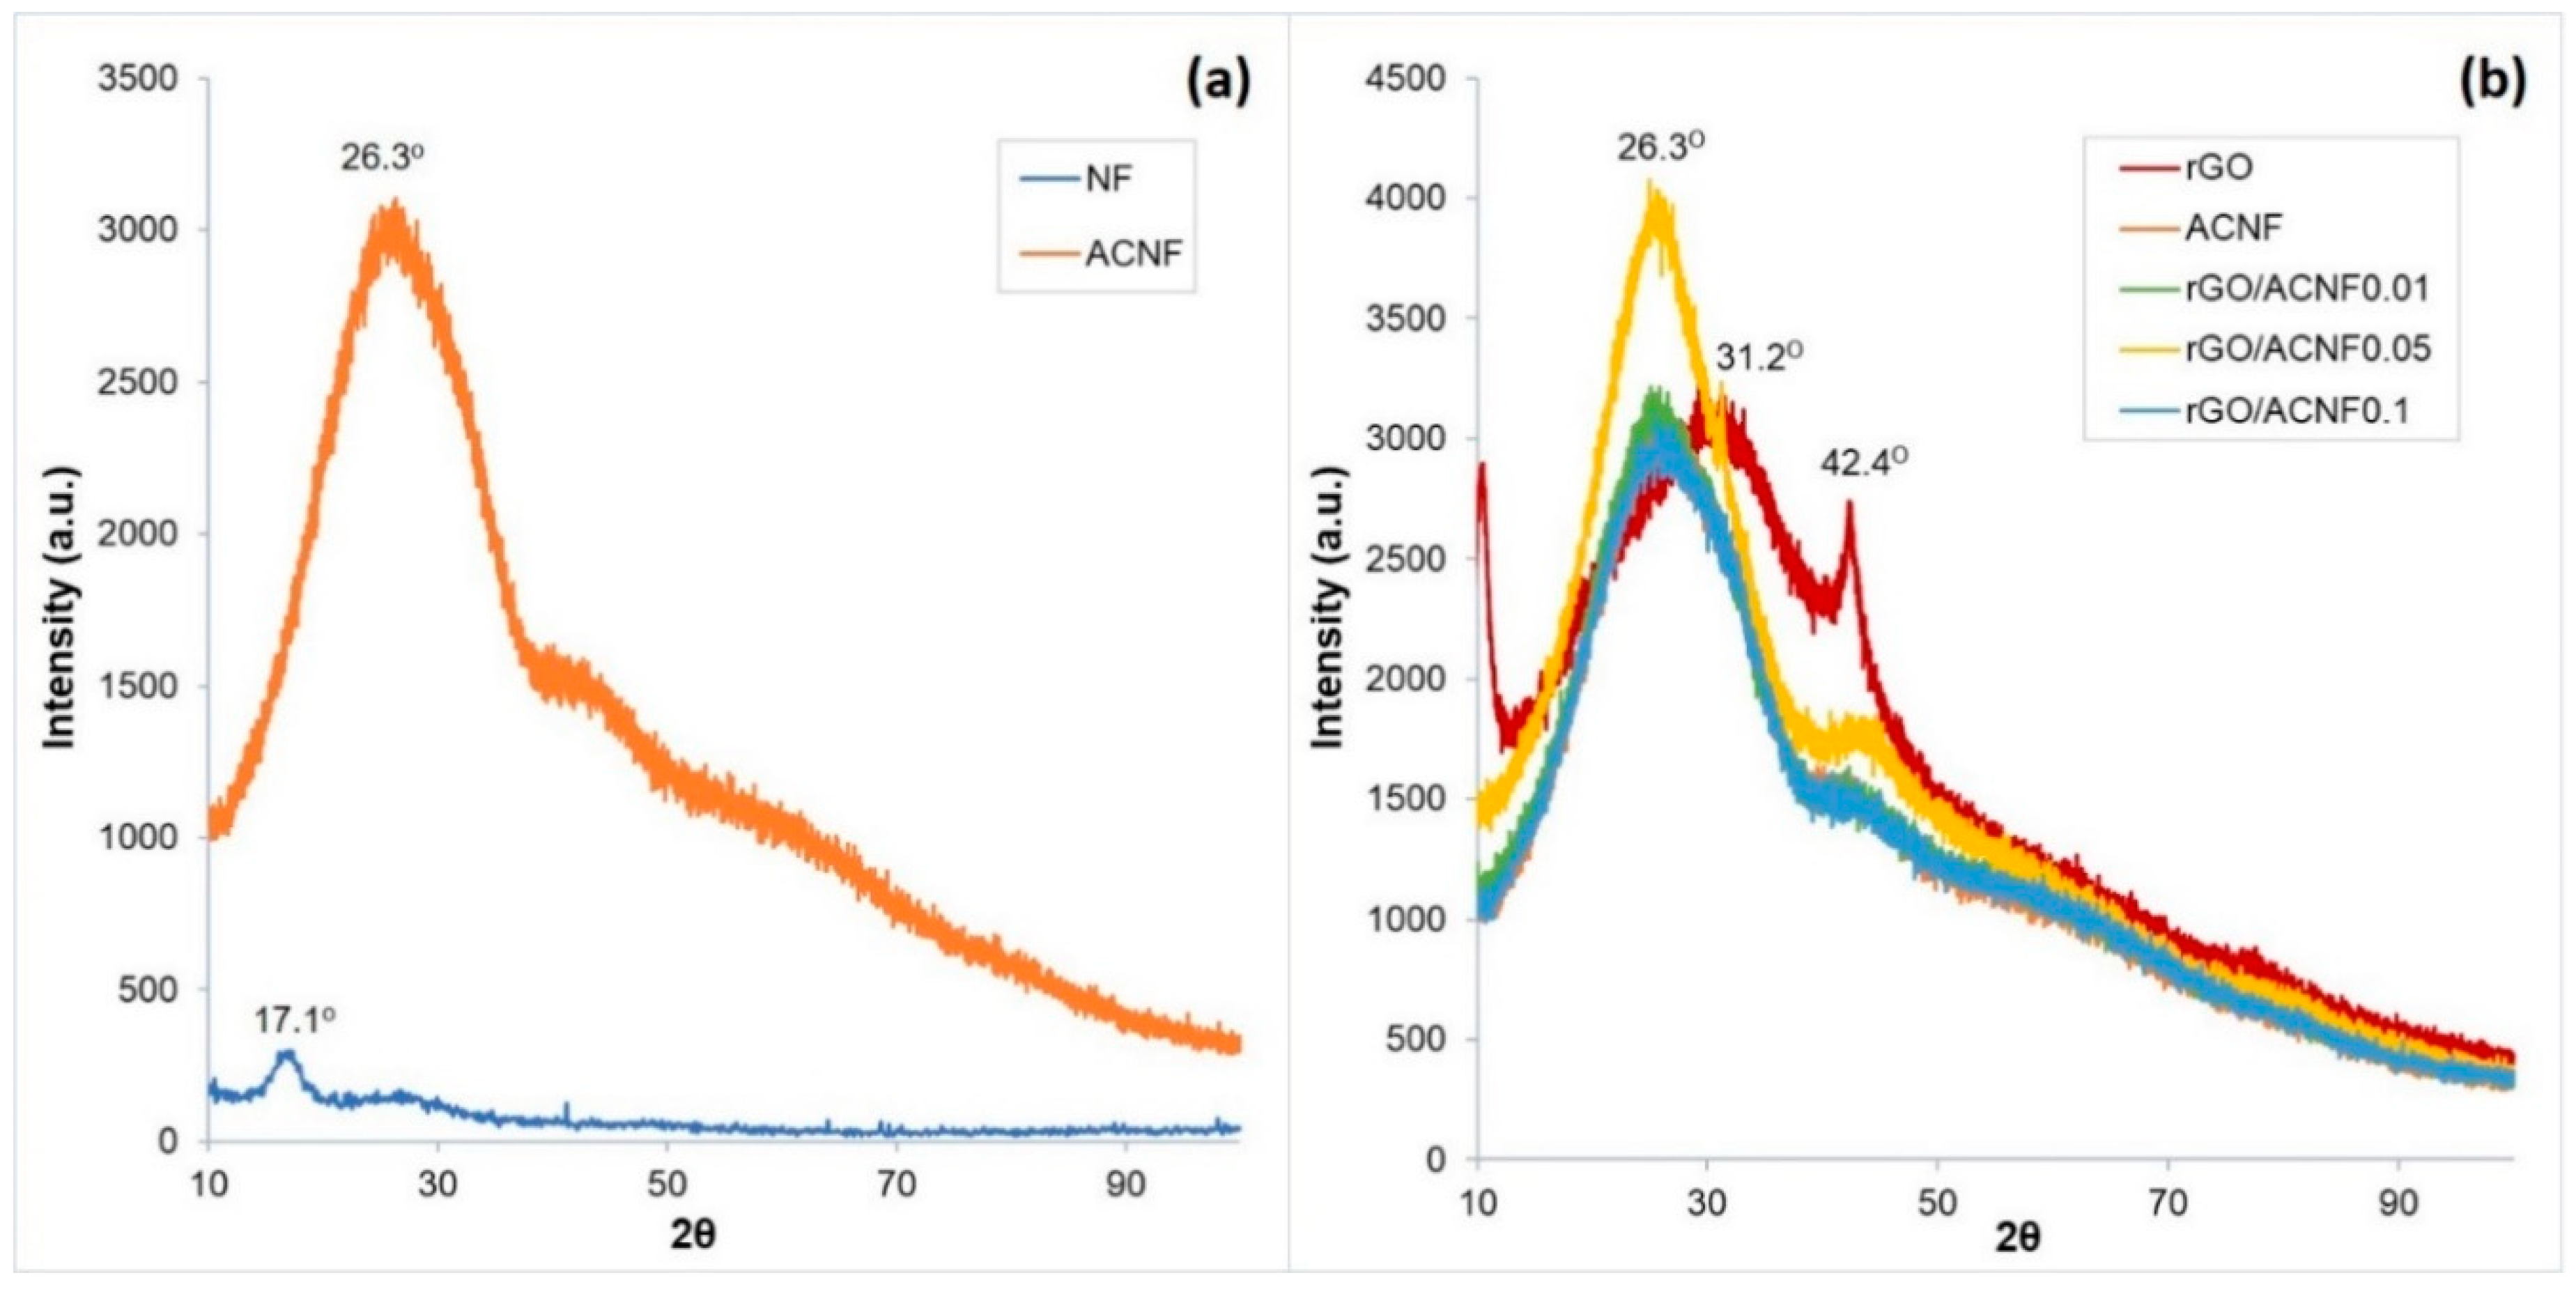
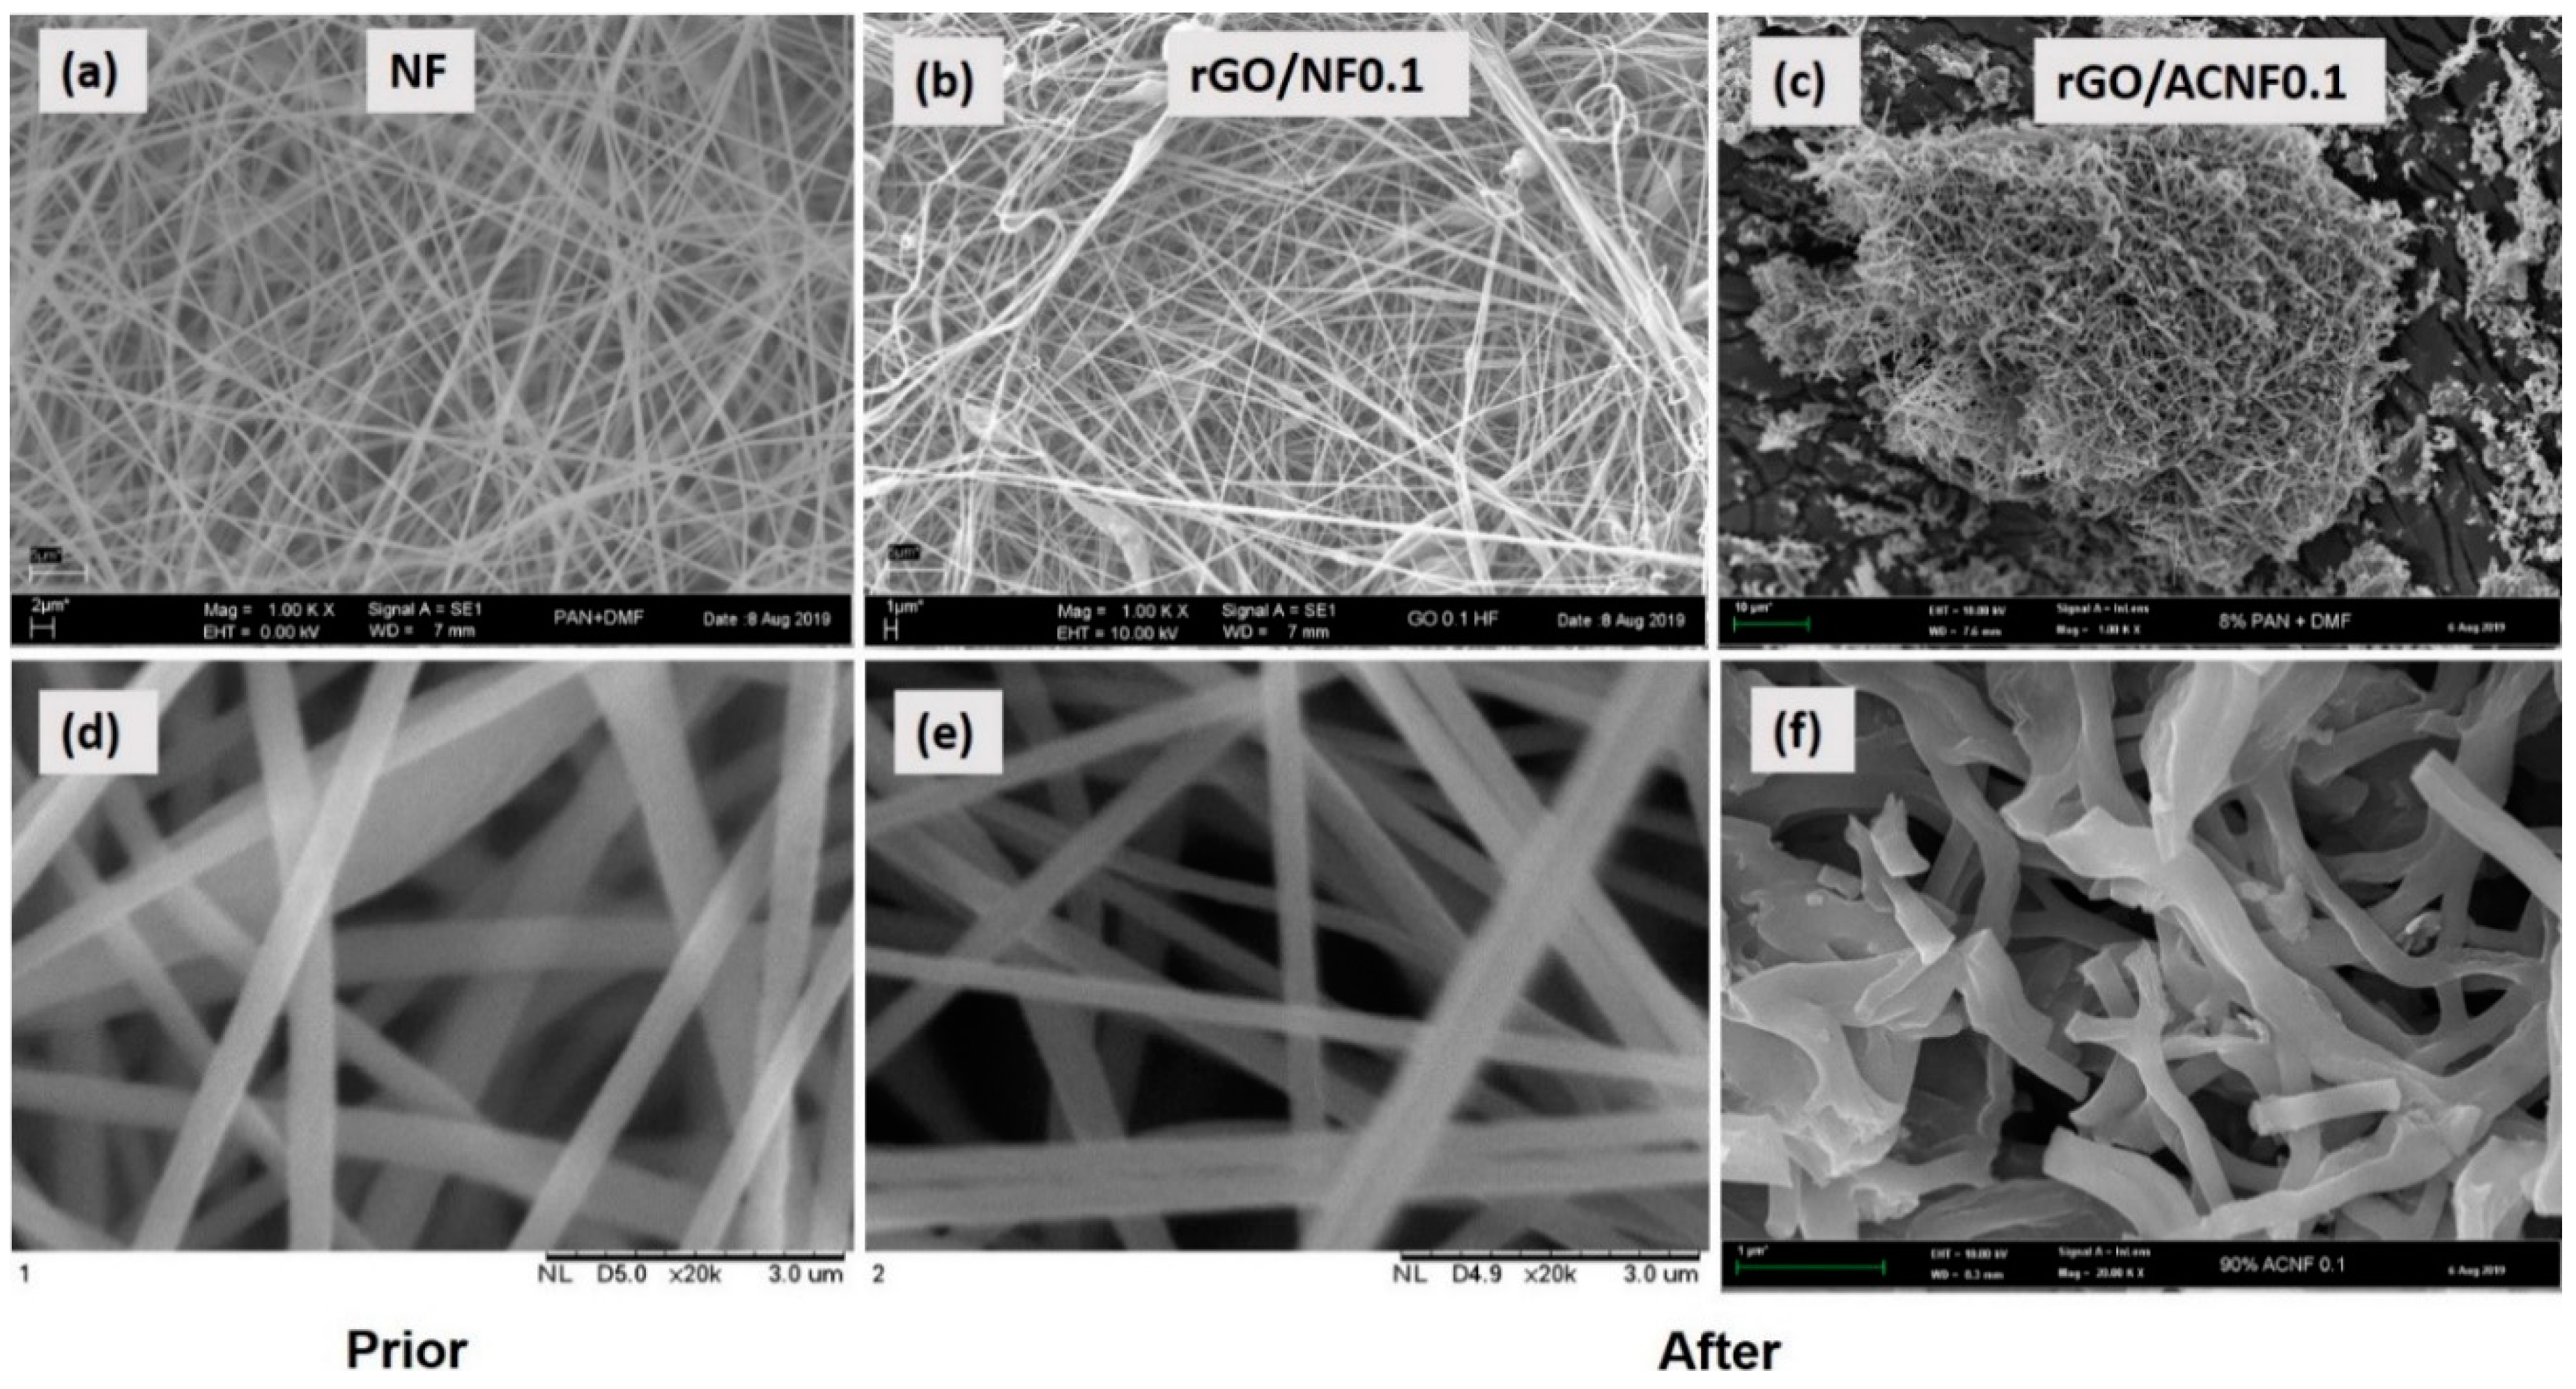
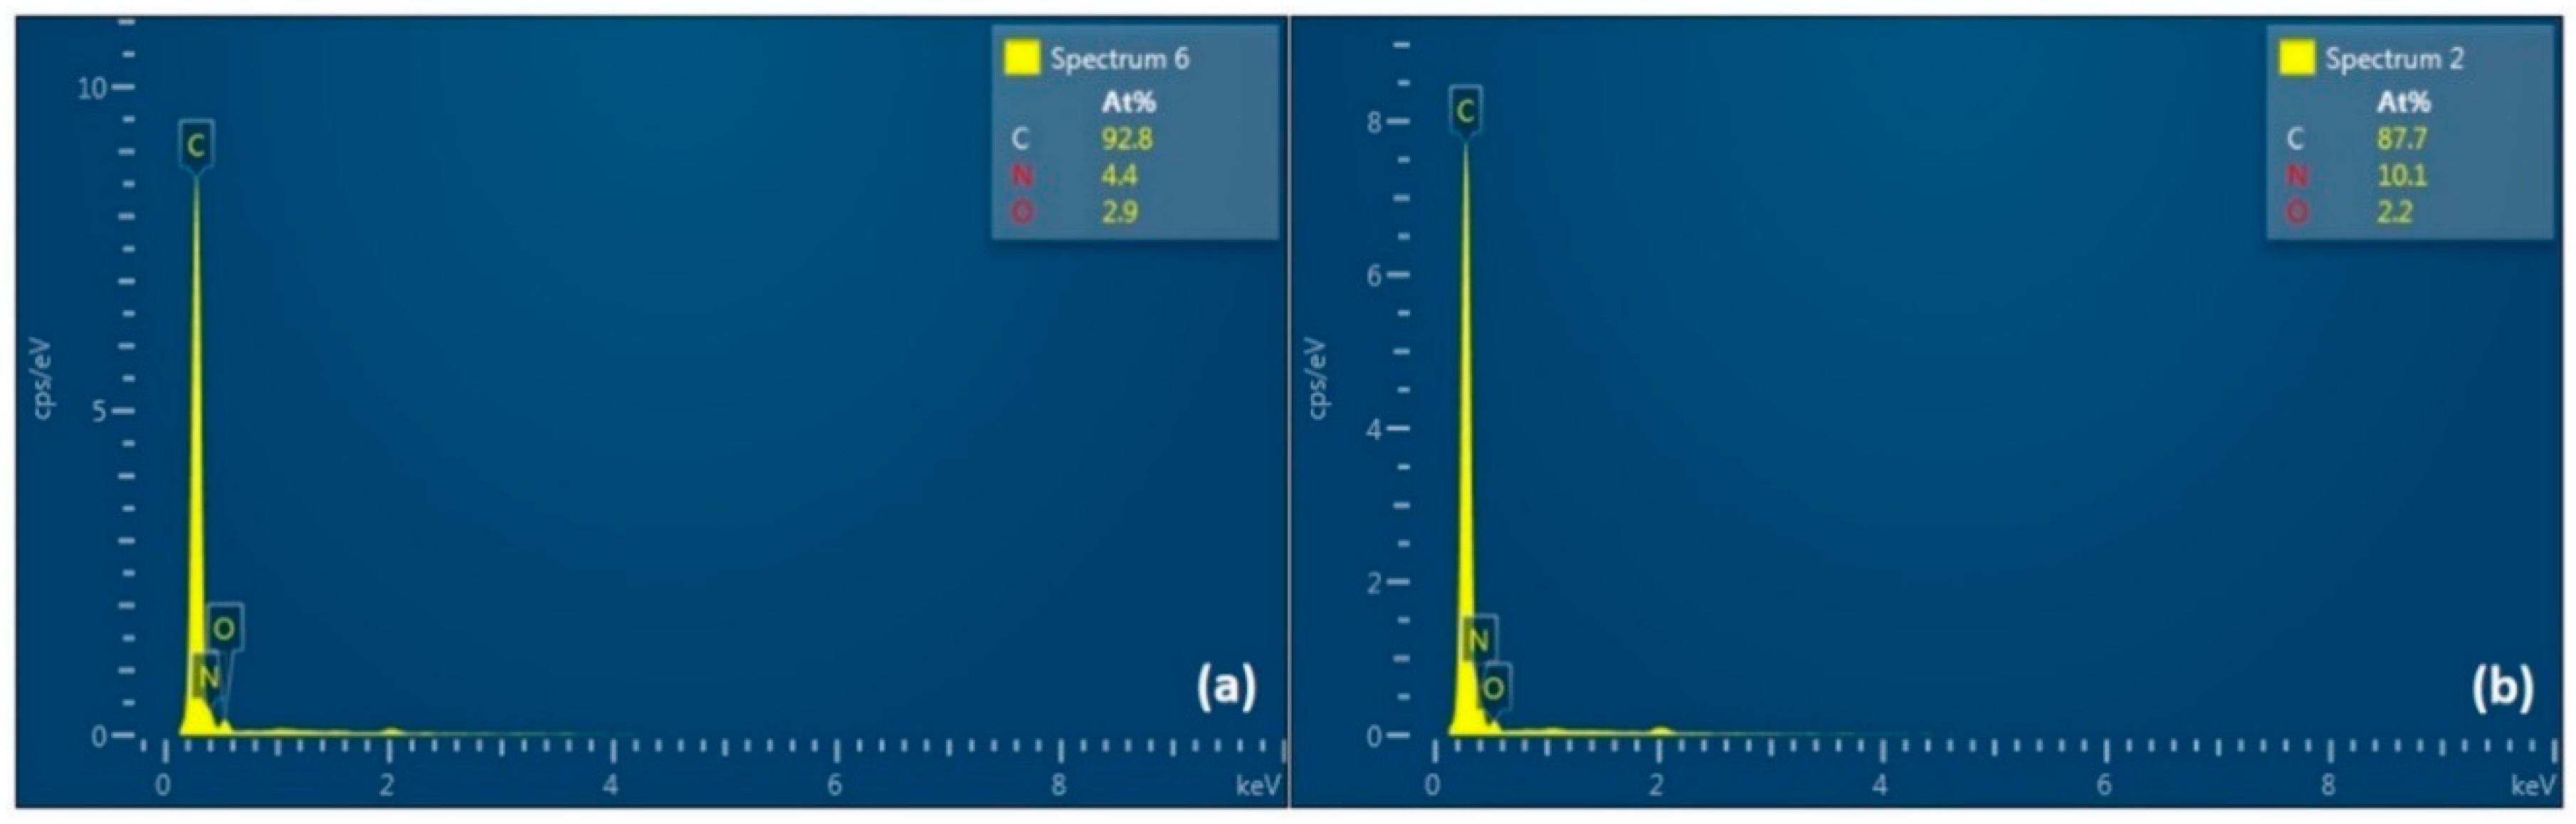
3.1. Properties of Materials

The microstructure and textural properties of nanofibers and composites before (NF and rGO/NF) and after activation (ACNF and rGO/ACNF) were studied by N2 adsorption/desorption analysis at −196 °C, and the plotted results are shown in Figure 2 and Table 1. Figure 2a shows the N2 adsorption/desorption isotherms of the NF samples before activation, showing profiles which point out type II isotherms, indicating the presence of macroporous or non-porous structures according to International Union of Pure Chemical and Applied Chemistry (IUPAC) [38,39]. This type of isotherm is believed to have single layer to multilayer adsorption, which is reflected by the shape of the isotherms in Figure 2a, i.e., linear at p/p0 < 0.8 and convex at p/p0 > 0.85–1.0. As shown in Table 2, all NF and rGO/NF materials are not microporous, i.e., Vmicro = 0 cm3/g and the addition of rGO did not alter the textural property of the NFs, since the relevant property of rGO/NF materials does not correlate with the loading of rGO. The activation procedure was able to improve the textural property of the ACNFs. The development of meso- and micropores and increment in surface area were measured in all activated samples. The microporous properties in all samples are reflected by the Type I(b) isotherms measured by N2 adsorption [38,40]. As shown in Figure 2b, the sorption curves for the activated samples appear above the curves obtained in the case of non-activated materials, at least at p/p0 < 0.9. Besides, they show a very long plateau from p/p0 = 0.05–0.95, showing the typical adsorption behaviour of microporous materials. Meanwhile, at p/p0 > 0.95, the adsorption curve is further increased without any significant halted observed. The adsorption-desorption isotherms of ACNFs also show the presence of H3 type of hysteresis loop [38] in the p/p0 range of 0.4–1.0, which suggests the presence of capillary condensation in mesoporous features [41,42]. It is worth mentioning that the values of Vmicro/Vtotal confirmed that all activated samples were primarily microporous, with a relatively high proportion of Vmicro to the Vtotal. Contributions by the mesopores to the porous structure were also measured, as shown by the Vmeso values.
The creation of meso-/micro-porous structures through activation at 700 °C was reflected by the significant improvement of SBET in all samples, as shown in Table 2. SBET of ACNFs drastically increased from 17 m2/g to 139 m2/g, which is eight times higher than the pristine NFs. For the activated composites, the highest SBET of 373 m2/g was measured for rGO/ACNF0.1 and the lowest SBET of 92 m2/g was determined for rGO/ACNF0.01, respectively, as rGO/ACNF0.1 exhibits the highest SBET compared to other samples, indicating the possible high adsorption capacity. Interestingly, the effect of the amount of rGO loading was more noticeable after activation. This is could possibly be due to the catalytic effect of rGO that takes place at elevated temperatures [43]. SBET is low in all samples before activation, showing no significant catalytic ability, but increases after being activated, indicating that rGO have good catalytic ability for developing SBET at elevated temperatures. After activation, the relevant porous characteristics, such as SBET and pore volumes, seem to have a good correlation with the amount of rGO loading. Typically, it is believed that adsorbent materials with high SBET and Vmicro are beneficial to adsorption of gas molecules [44].
The degree of graphitization and structural features of the pristine rGO, NF and rGO/NF composites before and after activation was analyzed by Raman spectroscopy, as shown in Figure 3a,b, respectively. It can be seen that all samples under investigation exhibit two characteristic peaks at 1368 cm−1 and 1612 cm−1, which represent the D-band and G-band of graphitic materials, respectively. The presence of D-band in all samples indicates the presence of defective or disordered carbon structures [37], whilst the existence of G-band is attributed to the ordered graphitic structures with sp2− hybridized carbon atoms [26]. The only significant different observed in Raman spectra before and after activation is the higher Raman intensity and more amorphous structure exhibited by the samples before activation. Reduction in intensity was observed when the samples underwent activation. In pristine rGO, both D-/G-bands have relatively strong intensities, with the appearance of weak 2D-band around 2700 cm−1 [45], which is typical in graphene materials. The intensity of G-band is slightly higher than that of the D-band, indicating that the self-synthesised graphene-based material from graphite demonstrated the crystalline, ordered but also possessed defect structures within the carbon lattice [46]. The non-appearance of 2D-band in rGO/ACNF composites is believed to be due to the amount of rGO composited into the structures being too small. Obviously, the intensity of D-band is higher than G-band in all ACNF-based samples, indicating that the resulting composite materials possess defective structures and are highly amorphous in nature, which is in agreement with the findings by XRD analysis (to be discussed later).
The degree of graphitization of the materials was evaluated by calculating the intensity ratio of the D and G band (ID/IG). Obviously, rGO shows the smallest ID/IG ratio of 0.99 compared to other electrospun materials, which represents the high degree of graphitization and ordered carbon structures in it [31,47]. In comparison with rGO, the ID/IG of ACNF is comparatively higher, at 1.35, suggesting a less ordered carbon structure in the ACNF. As expected, the incorporation of rGO with ACNF gave the materials with ID/IG ranging from 1.2–1.4 and this ratio decrease with the increase of the rGO concentrations (Figure 3). From the results obtained, it was demonstrated that the graphitic structure of rGO/ACNF composites were improved with the increment of rGO loading, and it was found that rGO/ACNF0.1 unveiled the smallest ratio of 1.23. Regardless of its lowest ID/IG compared to other samples, it is believed that the carbon materials with this value are still considered to own disordered and defective structures. This is supported by a study reported by Gayathri et al. [45], as the graphene synthesized in their research still possessed a defect structure, even at very low ID/IG of ~0.2–0.4.
Figure 4a shows the comparative XRD patterns of NF and ACNF. XRD spectrum of NF shows a peak at 17.1°, which can be attributed to the diffraction feature of PAN as polymer precursor [48,49]. After activation at 700 °C, the presence of broad peak at 26.3° at high intensity in ACNF corresponds to the 002 plane of the carbon skeleton [50]. This means that carbon-based materials with ladder structures such as ACNFs have been successfully developed through the cyclization of PAN during activation. Activation has also improved the crystallinity of the ACNFs. However, the ACNFs obtained in this study still remain amorphous (absence of sharp peak) due to the destruction of the in-plane aromatic lattices [51], leaving highly defect structures in the ACNFs [2,26]. Meanwhile, Figure 4b shows the comparative XRD patterns of rGO, ACNFs, and rGO/ACNF composites, which were used to investigate the effect of rGO loading on the graphitization degree and their crystallinity. All materials under investigation, including the rGO, show one intense broad diffraction peak in a range of 17°–31° (hexagonal graphite), and another characteristic peak at 41°–43° (rhombohedral graphite) [40], with variation only in their intensities. XRD analysis of carbonaceous phase in the materials can tell the feature of the crystallographic (100) and amorphous (110) planes. As previously mentioned, the appearance of the low and broad peaks at 41°–43° represents the amorphous structure with a very low graphitization degree. This result corresponds well to the finding by Raman spectroscopy. According to a study conducted by Guo et al. [52], carbon materials with amorphous and defective structures are believed to have more potential in altering the textural properties of the ACNFs, which can improve their adsorption capacity. Therefore, the ACNFs with the defective nature developed by this study were believed to have high CO2 adsorption capacity.
Figure 5 shows the morphology and structure of NF, rGO/NF0.1, and rGO/ACNF0.1 composites at two different magnifications, i.e., 1000× and 20,000×. The electrospun NF and rGO/NF0.1 exhibited smooth, thread-like and interconnected fibrous structures as shown in Figure 5a,b,d,e. In Figure 5e, the incorporation of 10% of rGO (Figure 5e) shows a reduction in their average diameter from ~450 nm to ~280 nm, as compared to their pristine NF. A few droplets were detected in some regions in NF composite, as shown in Figure 5b, and this is due to the effect of rGO, because graphene-based materials must alter the conductivity as well as viscosity of the solution to be electrospun [53]. Subsequently, these conductivity changes should affect the electrostatic repulsion among jet spray from the needle tip to the collector surface during the electrospinning process, which affecting the final diameter of the fibers. A report by Huang et al. [54] stated that the solution with high conductivity should lead to production fibers by electrospinning with smaller diameter. Since it seems that the smaller the fiber diameter, the higher the SBET, it is expected that one could be able to control the SBET by simply changing the conductivity of the polymer solution to be electrospun with the simple addition of rGO. In this study, the production of materials with high SBET is one of the important issues, since it is one of the factors which contribute to the high adsorption capability. On the other hand, the change of morphology and the further reduction in fibers diameter were also observed after activation at 700 °C, as shown in Figure 5c,f. This result is in accordance with those obtained by Kim et al. [44]. The ACNFs become coarser, wrinkled, and shrunk when activated, but still maintain its fibrous morphology with some fracture identified. The shrinkage in the diameter is caused by the evolution of volatile species during the cyclization of the ACNFs, as well as the removal of moisture [55].
Elemental dispersive X-ray (EDX) analysis of the pristine and composite ACNFs was shown in Figure 6. Both EDX spectra revealed similar composition of three elements, which were carbon (C), nitrogen (N), and oxygen (O), but with different percentages. An insignificant difference was detected in the elemental composition between the two samples, as they were both carbon-based materials from a similar carbon precursor. The percentage of C in pristine ACNF is 92.8%, which is higher than than of rGO/ACNF, that is, 87.7%. This was probably due to the comparatively high concentration of PAN polymer (as carbon-based precursor) used in preparing the dope solution, resulting in a high C element in the structure.

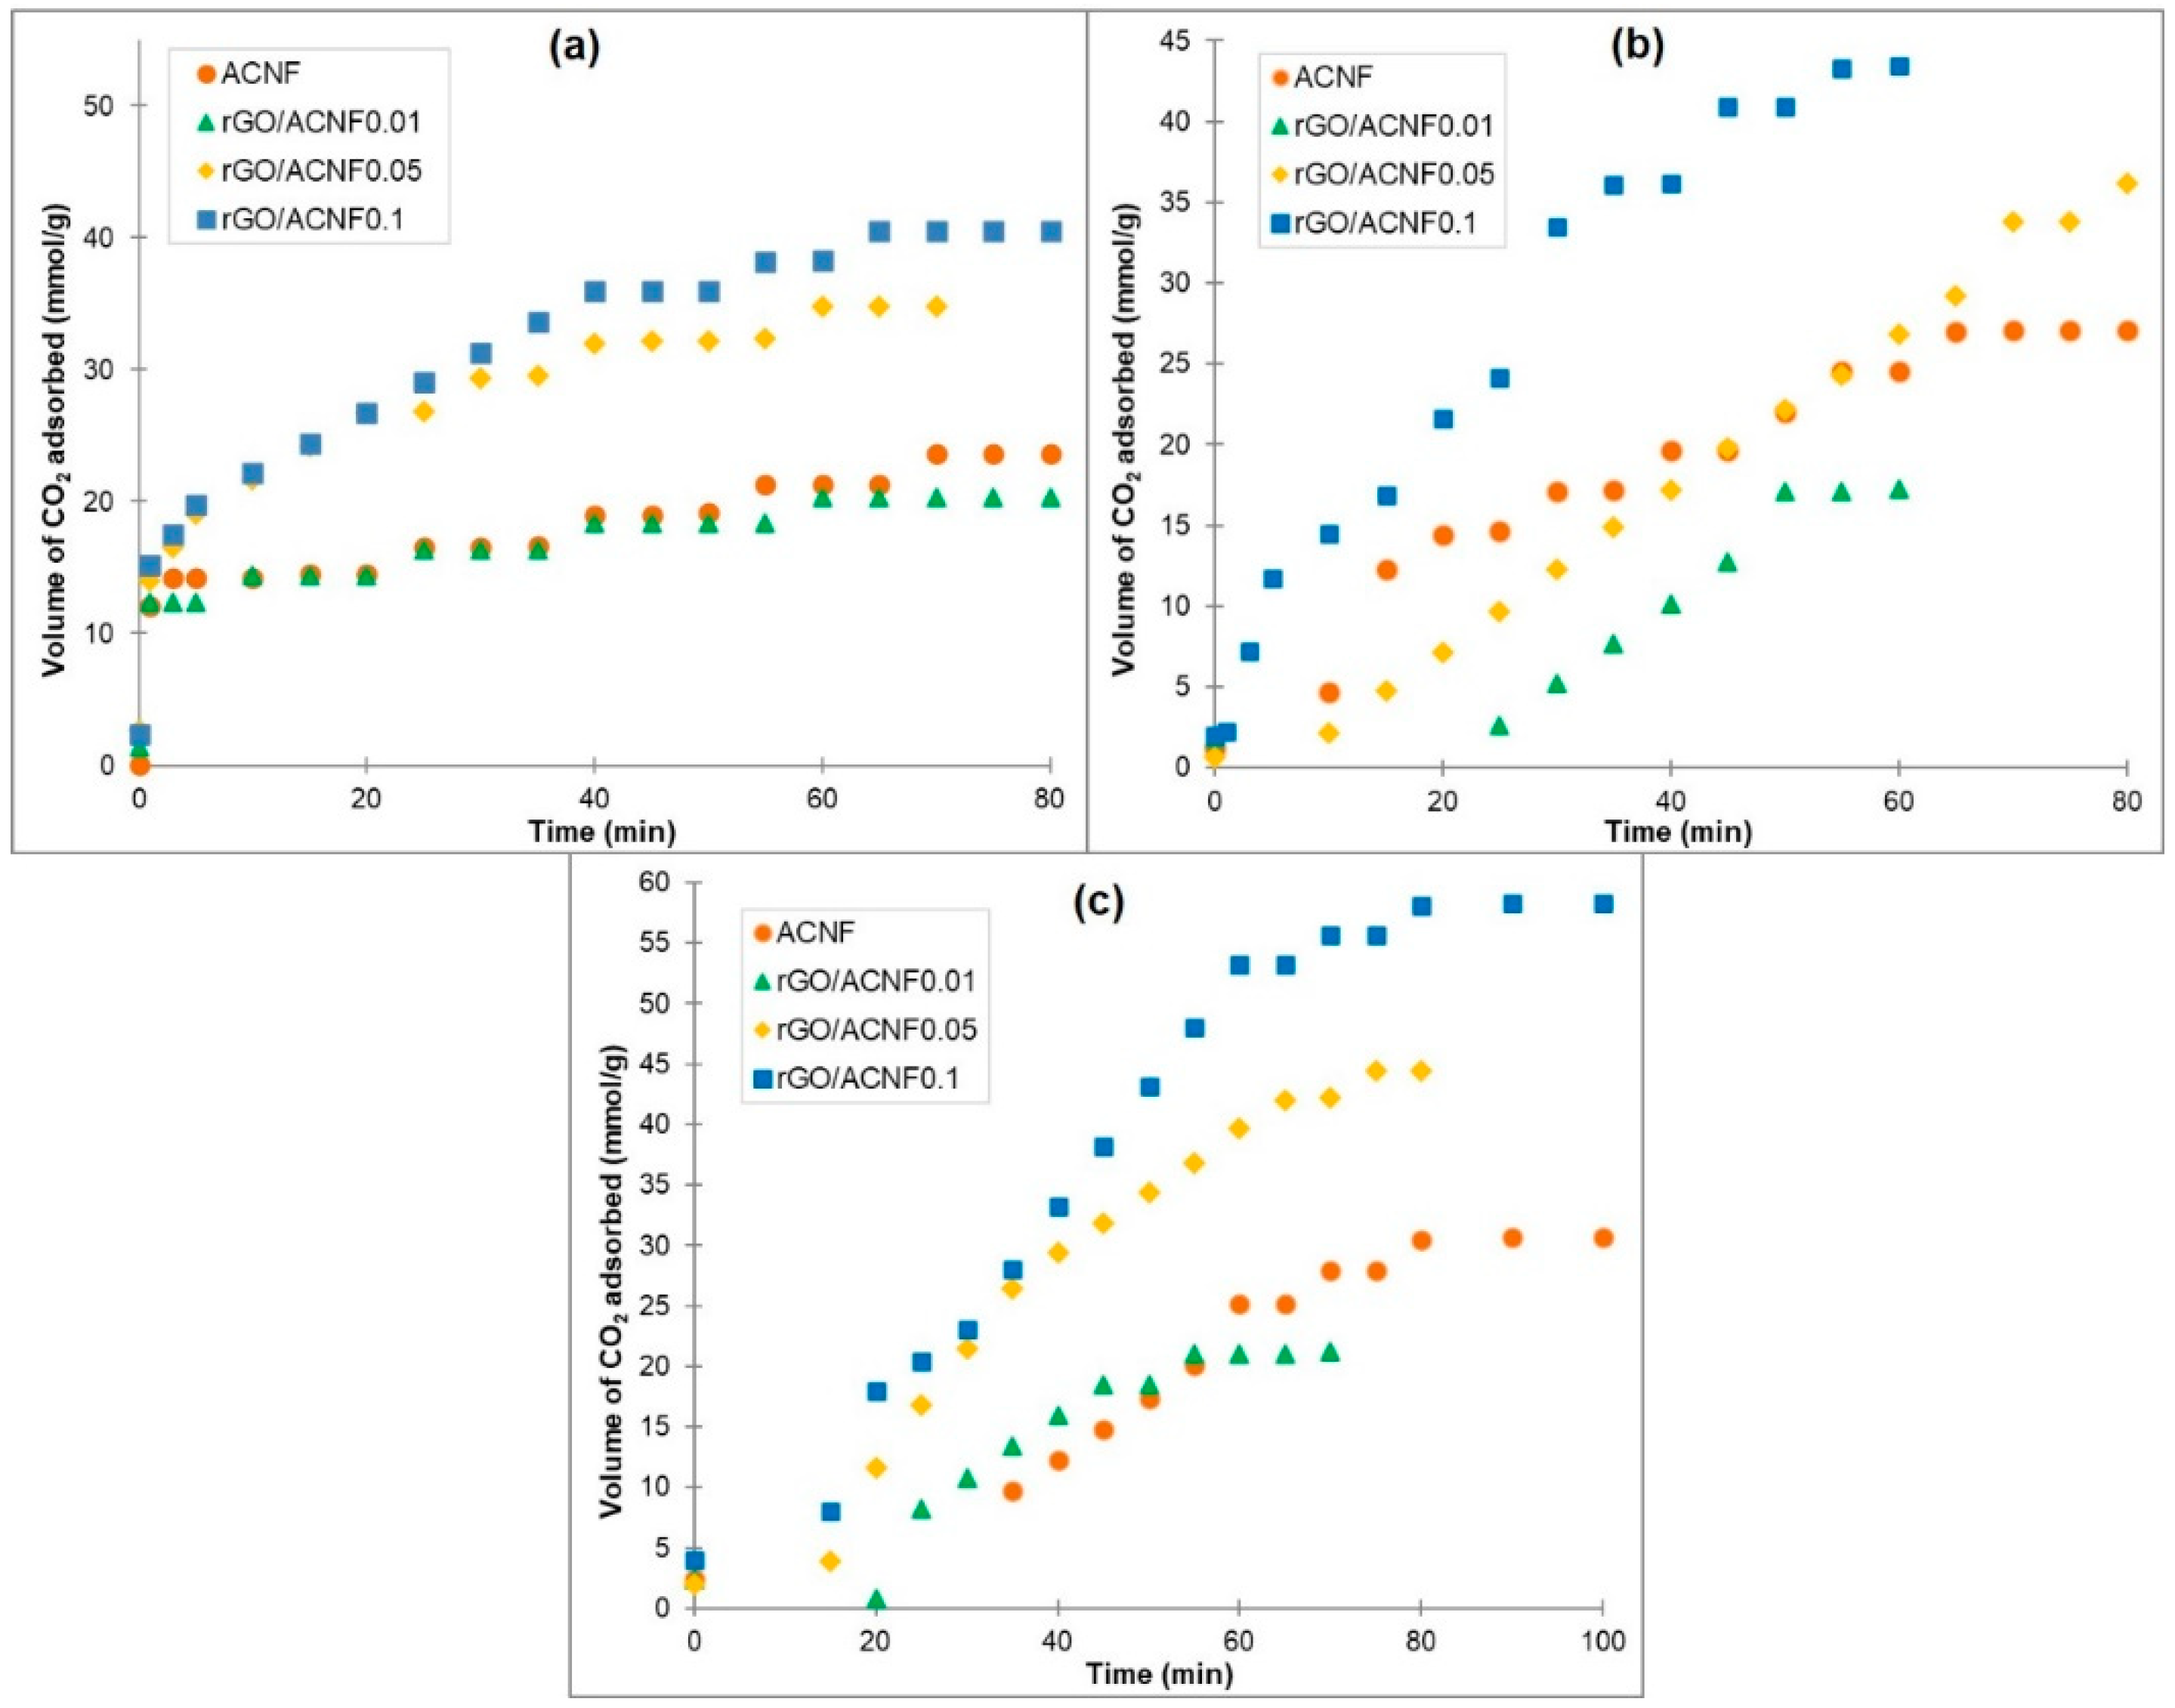
3.2. CO2 Adsorption Performance

The adsorption capacity as a function of time and detailed parameters of the CO2 uptakes of the pristine ACNF and composites are summarized in Figure 7 and Table 2, respectively. Figure 7 shows that the shape of CO2 adsorption curves of all materials under investigation is quite similar, with only difference in the amount adsorbed. It was found that, after the introduction of CO2, 95% of adsorption happened within one hour, which was followed by the slow uptake until the equilibrium. This can be explained by the increased diffusion resistance during adsorption and the reduction in the unoccupied active sites in the ACNFs. Figure 8 represents the adsorption mechanism between the CO2 molecules and the ACNFs. The CO2 molecules were adsorbed onto the available microporous and mesoporous structures in the ACNFs by van der Waals forces of attraction, forming either monolayer or multilayers, depending on the behavior of the adsorption.
All samples exhibited similar trend at all pressures, as follows: rGO/ACNF0.01<ACNF<rGO/ACNF0.05<rGO/ACNF0.1. At 5 bar, the CO2 uptakes of rGO/ACNF0.1 are the highest amongst the other composites, which is almost doubled the value of the uptakes of the ACNF, i.e., 41 mmol/g vs. 24 mmol/g. With an increase in the adsorption pressure, the CO2 uptake increased as well, suggesting that the capture of CO2 by this kind of adsorbents can be described as a physisorption phenomenon [56,57]. As shown in Table 3, the CO2 uptakes of rGO/ACNF0.1 increases from 41 mmol/g at 5 bar to 43 and 58 mmol/g at 10 and 15 bar, respectively. Interestingly, in spite of the moderate SBET obtained, the adsorption value is comparatively higher than any previously reported on CO2 adsorbent materials, which makes it a potentially excellent future CO2 adsorbent. In fact, the adsorption isotherms obtained from the various pressures and specific temperature explained the equilibrium adsorption capacity of the ACNFs. The isotherms were found to be Type I, being in line with the findings based on N2 isotherms, i.e., the microporous features that were induced to achieve the high adsorption of CO2 [58].
Table 3 summarized the comparison between CO2 uptakes by different carbon fibers-based adsorbents and their composites from previous literature with the rGO/ACNF composites produced in this study. As shown, the resultant SBET of the rGO/ACNF0.1 is the lowest among the other reported adsorbents. Regardless, its low SBET value, the volume of the CO2 uptakes is the highest. This excellent adsorption performance is highly believed due to its well-distributed porous structures, which is the Vmicro occupied up to 68% of the Vtotal and another 32% was occupied by mesoporous. Both micropores and mesopores play vital role in the adsorbates-adsorbent interaction.

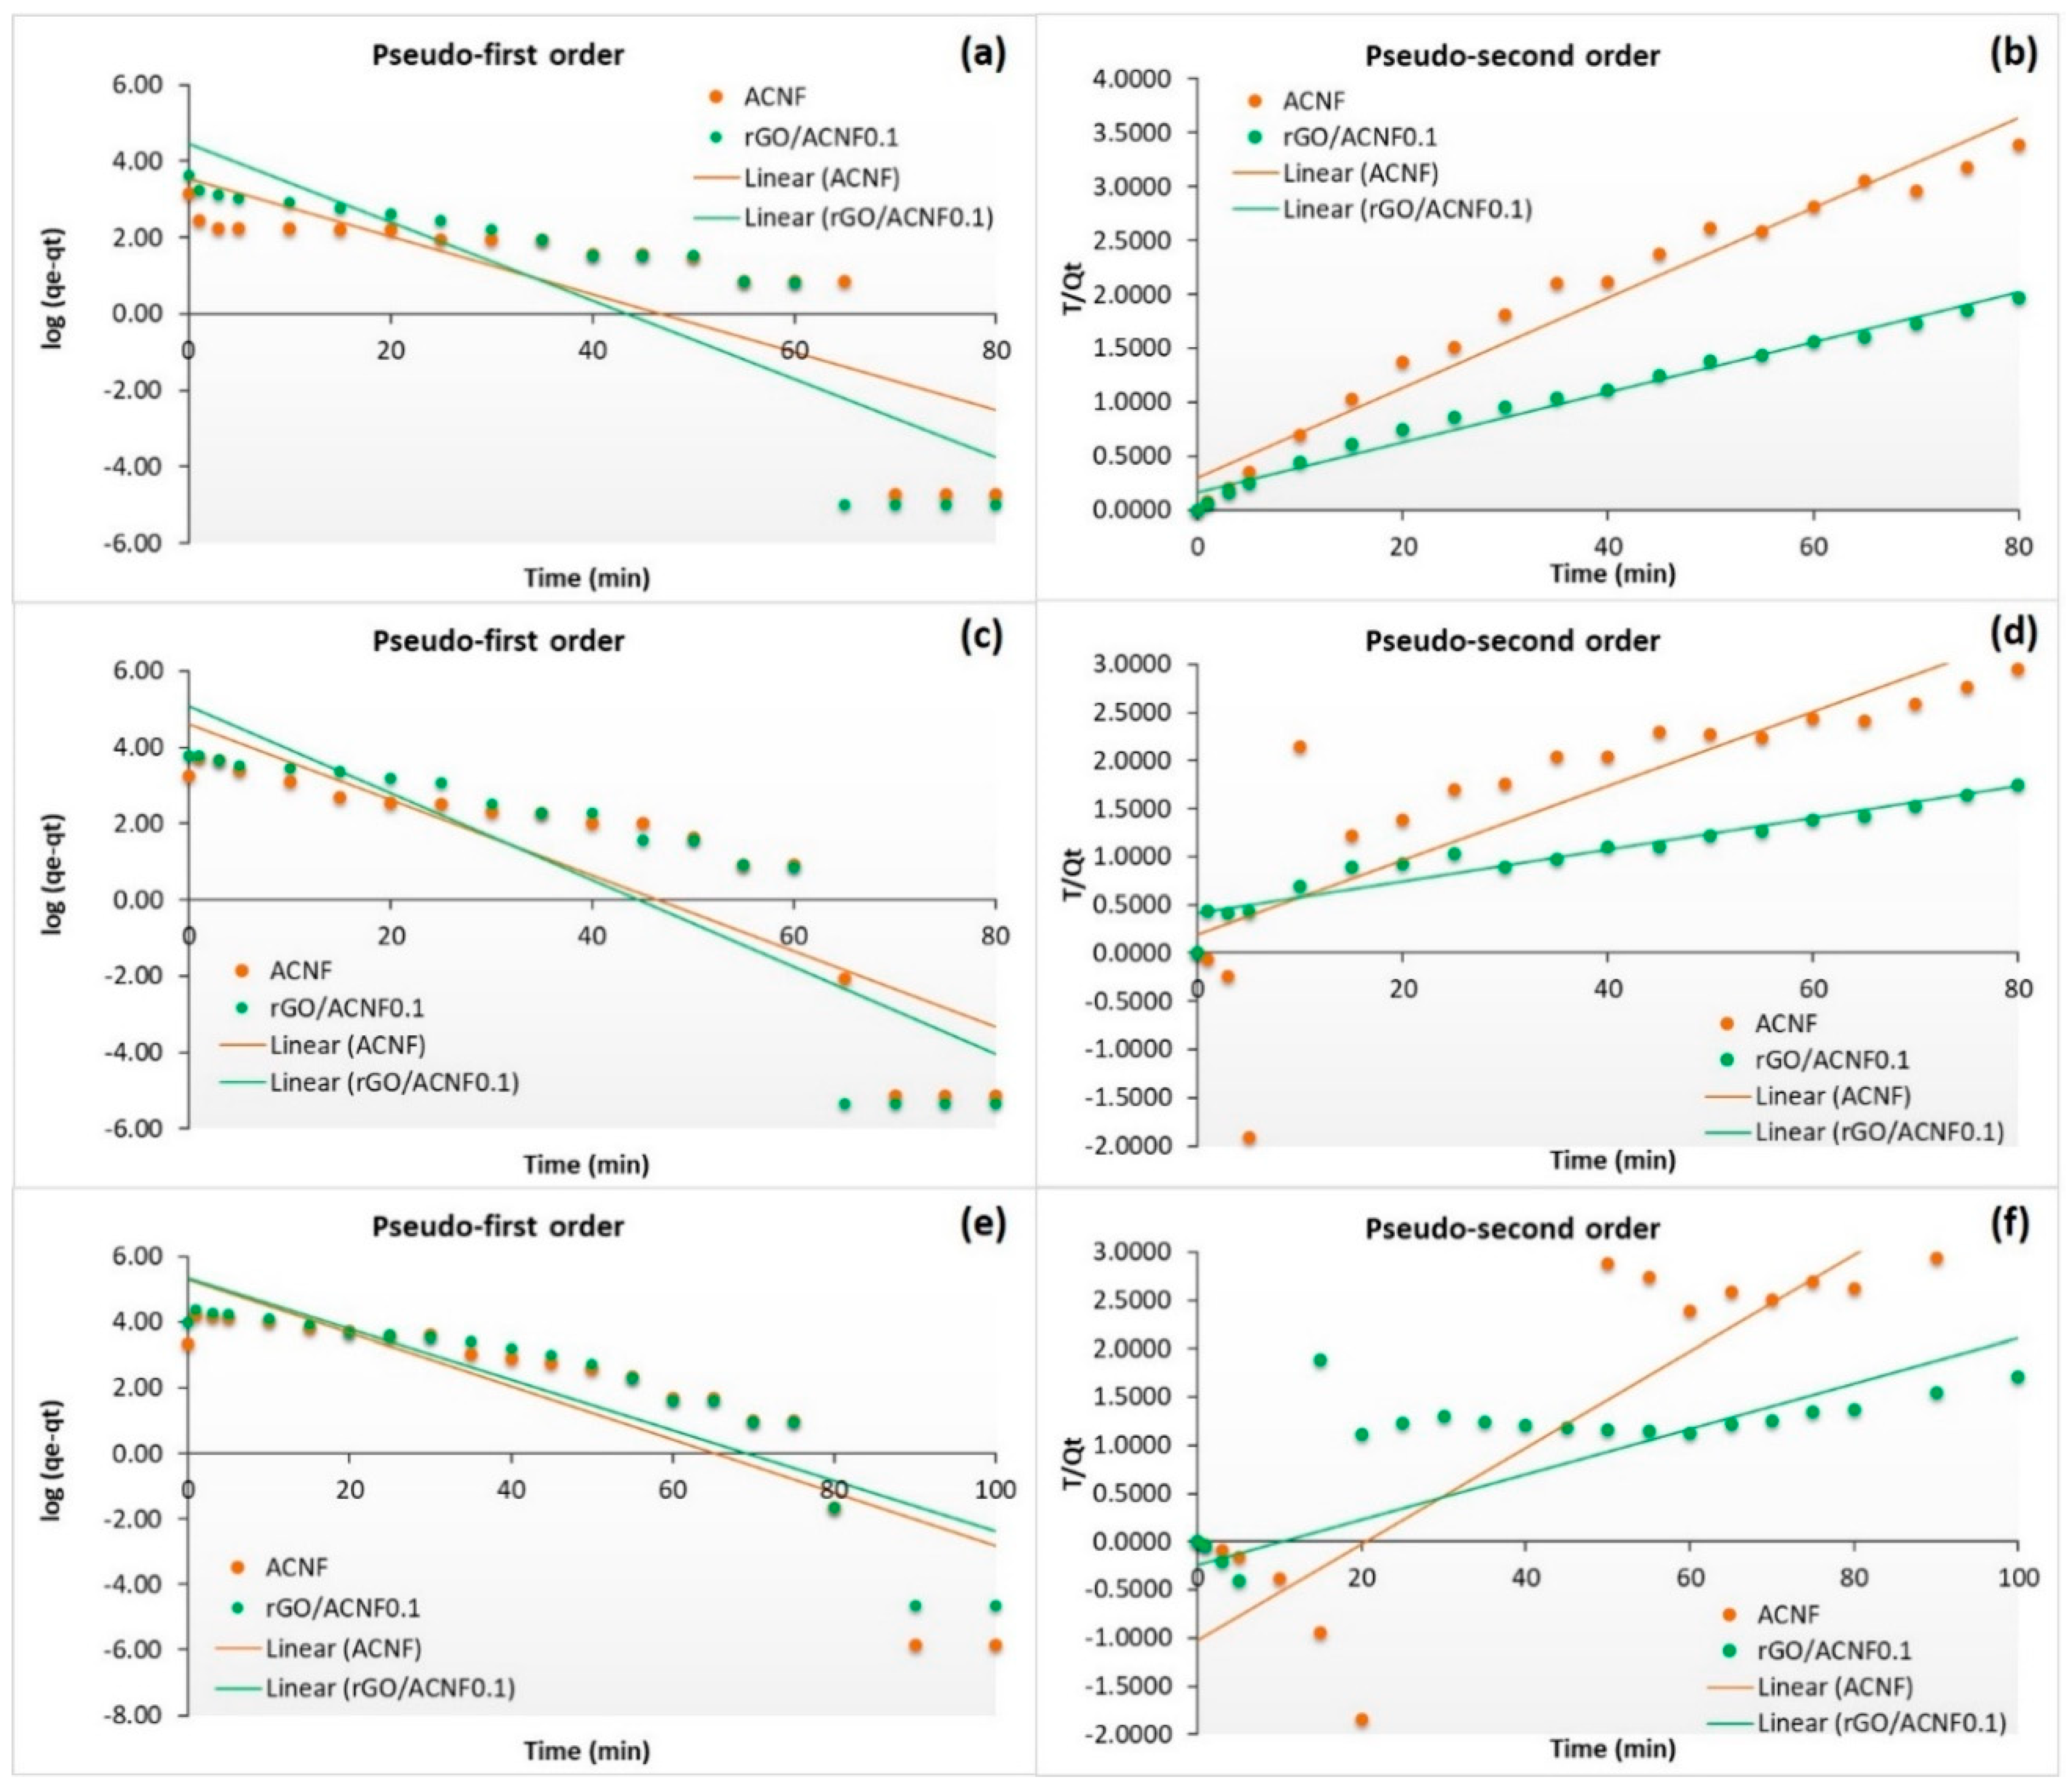
3.3. Adsorption Kinetics

For the adsorption of CO2 by ACNF and rGO/ACNF0.1 at different pressures (5, 10, and 15 bar), Figure 9 shows the representation of experimental data and linear fittings associated with the kinetic models presented in the experimental part. In pseudo-first order model, a plot of log(qe-qt) versus t will generate a straight line using Equation (2). Meanwhile, in pseudo-second order model, the straight-line plot of t/qt against t was generated using Equation (3). On the other hand, Table 4 gathers the kinetic parameters obtained from the linear regressions and the corresponding correlation coefficients (R2). Based on the R2 values collected in Table 4, the pseudo-second order model could be appropriate to describe the adsorption behavior of ACNF at 5 bar and rGO/ACNF0.1 at 5 and 10 bar, while the pseudo-first order model fitted the adsorption data best for the pristine ACNF at 10 and 15 bar and rGO/ACNF0.1 at 15 bar. The low of R2 values found in the samples at certain pressures shown in Table 4 represents the bad quality of linearization [63] and verifies that these kinetic models do not fit well with the experimental data of the CO2 adsorption depending on the specific pressures used. Therefore, it seems that, when the pressure of CO2 is high enough, the CO2 adsorption process can be better described by the pseudo-first order kinetic model, implying therefore mainly a physisorption phenomenon. On the contrary, when the pressure of CO2 is low enough, the adsorption phenomena is better described by chemical reaction between the free sites on the ACNF and the CO2 molecules, chemisorption [64]. It can be said that both ACNFs and rGO/ACNF0.1 are well-fitted pseudo-second order model at low pressure adsorption with higher R2 values of 0.9645 and 0.9825, respectively, compared to pseudo-first order model. In fact, lots of previous studies have mentioned that the CO2 adsorption onto the sorbents’ surface at higher pressure involve physisorption rather than chemisorption, which is more related to the adsorption towards the surface with higher SBET, Vtotal, and Vmicro by weak dipole interactions [65,66]. Furthermore, it also believed that this physisorption, at higher adsorption pressure, resulted in the development of multilayers of CO2 molecules on the heterogeneous surface of both ACNFs samples. For example, a study by Belmabkhout et al. [12] reported that the adsorption of pure CO2 (14.7 mmol/g) onto the sorbents’ surface at high pressure (e.g., 45 bar) and ambient temperature involved reversible physisorption. In conclusion, it can be said that these two kinetic models are found to be suitable for fitting the present kinetic data of CO2 adsorption at 15 bar and 25 °C, in the following order: Pseudo-first order > pseudo-second order.

4. Conclusions

The excellent CO2 adsorbent was successfully fabricated by incorporating reduced graphene oxide (rGO) into the PAN-based activated carbon nanofibers (ACNF) via the simple electrospinning and activation methods. It is noteworthy to mention that the suitable amount of rGO composited into the ACNFs is very crucial in producing rGO/ACNF composites with outstanding physicochemical properties, as well as high adsorption capacity. It worth to mention that the suitable loading of rGO is very crucial to obtain the ACNFs composites with the best properties and adsorption performance. In this study, the rGO/ACNF0.1 with 10% of rGO shows higher CO2 uptakes of 58 mmol/g at 15 bar and 25 °C, which almost double the uptakes value compared to ACNF with a moderate SBET value of 373 m2/g. At higher pressure, the CO2 adsorption obeyed the pseudo-first order kinetic model, indicating the physisorption between the CO2 molecules and the porous network of the adsorbents. This is the leading report on PAN-rGO/ACNF composites fabricated from self-synthesized graphene-based materials, such as rGO and porous carbon materials such as ACNFs, which is an efficient way to discover low-cost carbon adsorbents for a high CO2 uptake.

Supplementary Materials

The following are available online at https://www.mdpi.com/2073-4360/12/9/2117/s1, Table S1: Dope formulation of gACNFs composite with different concentrations of reduced graphene oxide (rGO).

Author Contributions

Conceptualization, F.E.C.O.; methodology, F.E.C.O. and N.Y.; software, F.E.C.O.; validation, N.Y., J.G.-B., X.F. and A.F.I.; formal analysis, F.E.C.O., N.Y., J.G.-B., X.F. and A.F.I.; investigation, F.E.C.O.; resources, F.E.C.O.; data curation, F.E.C.O.; writing—original draft preparation, F.E.C.O.; N.Y.; writing—review and editing, N.Y., J.G.-B., X.F. and A.F.I.; visualization, F.E.C.O.; supervision, N.Y., J.G.-B., X.F. and A.F.I.; project administration, F.E.C.O.; funding acquisition, N.Y. All authors have read and agreed to the published version of the manuscript.

Funding

This research was funded by Malaysian Ministry Education and Universiti Teknologi Malaysia under UTM Prototype Research grant (UTMPR) (Q.J130000.2851.00L41), Collaborative Research Grant (CRG) (Q.J130000.2451.07G72), UTM-TDR grant scheme (Q.J130000.3551.06G07), HICOE research grant (R.J090301.7851.4J428), UTM award grant (R.J130000.7351.5M002), and UTM Shine grant (Q.J130000.2451.09G21).

Acknowledgments

The authors would also like to acknowledge the technical and management support from Advanced Membrane Technology Research Center, Universiti Teknologi Malaysia (AMTEC, UTM). One of the authors, Othman, F.E.C. would like to acknowledge the Zamalah Scholarship received from Universiti Teknologi Malaysia (UTM), NIMS Internship Scholarship 2018 awarded by National Institute for Materials Science (NIMS), Japan and Mitacs-Globalink Research Award 2020 awarded by Mitacs and Ecole Polytechnique de Montreal, Canada.

Conflicts of Interest

The authors declare no conflict of interest.

References

  1. Acevedo, E.R.; Cortés, F.B.; Franco, C.A.; Carrasco-Marín, F.; Pérez-Cadenas, A.F.; Fierro, V.; Celzard, A.; Schaefer, S.; Molina, A.C. An Enhanced Carbon Capture and Storage Process (e-CCS) Applied to Shallow Reservoirs Using Nanofluids Based on Nitrogen-Rich Carbon Nanospheres. Materials 2019, 12, 2088. [Google Scholar] [CrossRef] [PubMed] [Green Version]
  2. Huang, G.-G.; Liu, Y.-F.; Wu, X.-X.; Cai, J. Activated carbons prepared by the KOH activation of a hydrochar from garlic peel and their CO2 adsorption performance. New Carbon Mater. 2019, 34, 247–257. [Google Scholar] [CrossRef]
  3. Bains, P.; Psarras, P.; Wilcox, J. CO2 capture from the industry sector. Prog. Energy Combust. Sci. 2017, 63, 146–172. [Google Scholar] [CrossRef]
  4. Acevedo, E.R.; Franco, C.A.; Carrasco-Marín, F.; Pérez-Cadenas, A.F.; Cortés, F.B. Biomass-Derived Carbon Molecular Sieves Applied to an Enhanced Carbon Capture and Storage Process (e-CCS) for Flue Gas Streams in Shallow Reservoirs. Nanomaterials 2020, 10, 980. [Google Scholar] [CrossRef]
  5. Carbon Cycle Greenhouse Gases, Mouna Loa Observatory. 2020. Available online: https://www.esrl.noaa.gov/gmd/ccgg/ (accessed on 17 August 2020).
  6. Willard, B. CO2—Why 450 ppm Is Dangerous and 350 ppm Is Safe. 2014. Available online: https://sustainabilityadvantage.com/2014/01/07/co2-why-450-ppm-is-dangerous-and-350-ppm-is-safe/ (accessed on 20 July 2020).
  7. Le Quéré, C.; Jackson, R.B.; Jones, M.W.; Smith, A.J.P.; Abernethy, S.; Andrew, R.; De-Gol, A.J.; Willis, D.R.; Shan, Y.; Canadell, J.G.; et al. Temporary reduction in daily global CO2 emissions during the COVID-19 forced confinement. Nat. Clim. Chang. 2020, 10, 1–7. [Google Scholar] [CrossRef]
  8. Chen, Y.P.; Bashir, S.; Liu, J. Chapter 7- Carbon Capture and Storage. In Advanced Nanomaterials and Their Applications in Renewable Energy; Liu, J., Bashir, S., Eds.; Elsevier Science: Amsterdam, The Netherlands, 2015; pp. 329–366. [Google Scholar]
  9. Abbasi, A.; Nasef, M.M.; Babadi, F.E.; Faridi-Majidi, R.; Takeshi, M.; Abouzari-Lotf, E.; Choong, T.; Somwangthanaroj, A.; Kheawhom, S. Carbon Dioxide Adsorption on Grafted Nanofibrous Adsorbents Functionalized Using Different Amines. Front. Energy Res. 2019, 7, 1–14. [Google Scholar] [CrossRef]
  10. Romano, M.C.; Anantharaman, R.; Arasto, A.; Ozcan, D.C.; Ahn, H.; Dijkstra, J.; Carbo, M.; Boavida, D. Application of Advanced Technologies for CO2 Capture From Industrial Sources. Energy Procedia 2013, 37, 7176–7185. [Google Scholar] [CrossRef] [Green Version]
  11. Singh, V.K.; Kumar, E.A.; Emadabathuni, A.K. Measurement and analysis of adsorption isotherms of CO2 on activated carbon. Appl. Therm. Eng. 2016, 97, 77–86. [Google Scholar] [CrossRef]
  12. Belmabkhout, Y.; Serna-Guerrero, R.; Sayari, A. Adsorption of CO2 from dry gases on MCM-41 silica at ambient temperature and high pressure. 1: Pure CO2 adsorption. Chem. Eng. Sci. 2009, 64, 3721–3728. [Google Scholar] [CrossRef]
  13. Hauchhum, L.; Mahanta, P. Carbon dioxide adsorption on zeolites and activated carbon by pressure swing adsorption in a fixed bed. Int. J. Energy Environ. Eng. 2014, 5, 349–356. [Google Scholar] [CrossRef] [Green Version]
  14. Al-Janabi, N.; Hill, P.; Torrente-Murciano, L.; Garforth, A.; Gorgojo, P.; Siperstein, F.; Fan, X. Mapping the Cu-BTC metal—Organic framework (HKUST-1) stability envelope in the presence of water vapour for CO2 adsorption from flue gases. Chem. Eng. J. 2015, 281, 669–677. [Google Scholar] [CrossRef] [Green Version]
  15. Al-Janabi, N.; Deng, H.; Borges, J.; Liu, X.; Garforth, A.; Siperstein, F.R.; Fan, X. A facile post-synthetic modification method to improve hydrothermal stability and CO2 selectivity of CyBTC metal-organic framework. Ind. Eng. Chem. Res. 2016, 55, 7941–7949. [Google Scholar] [CrossRef] [Green Version]
  16. Olijire, A.A. Synthesis chemistry of metal-organic frameworks for CO2 capture andconversion for sustainable energy future. Renew. Sustain. Energy Rev. 2018, 92, 570–607. [Google Scholar] [CrossRef]
  17. Chiang, Y.-C.; Hsu, W.-L.; Lin, S.-Y.; Juang, R.-S. Enhanced CO2 Adsorption on Activated Carbon Fibers Grafted with Nitrogen-Doped Carbon Nanotubes. Materials 2017, 10, 511. [Google Scholar] [CrossRef]
  18. Bhatta, L.K.G.; Bhatta, U.M.; Venkatesh, K. Metal Oxides for Carbon Dioxide Capture. Sustain. Agric. Rev. 2019, 38, 63–83. [Google Scholar] [CrossRef]
  19. Rodríguez-García, S.; Santiago, R.; López-Díaz, D.; Merchán, M.D.; Velázquez, M.M.; Fierro, J.L.G.; Palomar, J. Role of the Structure of Graphene Oxide Sheets on the CO2 Adsorption Properties of Nanocomposites Based on Graphene Oxide and Polyaniline or Fe3O4-Nanoparticles. ACS Sustain. Chem. Eng. 2019, 7, 12464–12473. [Google Scholar] [CrossRef]
  20. Pellerano, M.; Pré, P.; Kacem, M.; Delebarre, A. CO2 capture by adsorption on activated carbons using pressure modulation. Energy Procedia 2009, 1, 647–653. [Google Scholar] [CrossRef] [Green Version]
  21. El-Sharkawy, I.I.; Mansour, M.H.; Awad, M.M.; El-Ashry, R. Investigation of Natural Gas Storage through Activated Carbon. J. Chem. Eng. Data 2015, 60, 3215–3223. [Google Scholar] [CrossRef]
  22. Othman, F.E.C.; Yusof, N.; Hasbullah, H.; Jaafar, J.; Ismail, A.F.; Nasri, N.S. Physicochemical properties and methane adsorption performance of activated carbon nanofibers with different types of metal oxides. Carbon Lett. 2017, 24, 82–89. [Google Scholar]
  23. Lee, H.-M.; Kim, H.-G.; An, K.-H.; Kim, B.-J. Effects of pore structures on electrochemical behaviors of polyacrylonitrile-based activated carbon nanofibers by carbon dioxide activation. Carbon Lett. 2014, 15, 71–76. [Google Scholar] [CrossRef] [Green Version]
  24. Tavanai, H.; Jalili, R.; Morshed, M.; Jalili, R. Effects of fiber diameter and CO2 activation temperature on the pore characteristics of polyacrylonitrile based activated carbon nanofibers. Surf. Interface Anal. 2009, 41, 814–819. [Google Scholar] [CrossRef]
  25. Othman, F.E.C.; Yusof, N.; Ismail, A.F.; Jaafar, J.; Salleh, W.N.W.; Aziz, F. Preparation and characterization of polyacrylonitrile-based activated carbon nanofibers/graphene (gACNFs) composite synthesized by electrospinning. AIP Adv. 2020, 10, 055117. [Google Scholar] [CrossRef]
  26. Mishra, A.K.; Ramaprabhu, S. Carbon dioxide adsorption in graphene sheets. AIP Adv. 2011, 1, 32152. [Google Scholar] [CrossRef]
  27. Takeuchi, K.; Yamamoto, S.; Hamamoto, Y.; Shiozawa, Y.; Tashima, K.; Fukidome, H.; Koitaya, T.; Mukai, K.; Yoshimoto, S.; Suemitsu, M.; et al. Adsorption of CO2 on Graphene: A Combined TPD, XPS, and vdW-DF Study. J. Phys. Chem. C 2017, 121, 2807–2814. [Google Scholar] [CrossRef]
  28. Wang, Z.; Ciacchi, L.C.; Wei, G. Recent Advances in the Synthesis of Graphene-Based Nanomaterials for Controlled Drug Delivery. Appl. Sci. 2017, 7, 1175. [Google Scholar] [CrossRef] [Green Version]
  29. Alghamdi, A.A.; Alshahrani, A.F.; Khdary, N.H.; Alharthi, F.A.; Alattas, H.A.; Adil, S.F. Enhanced CO2 Adsorption by Nitrogen-Doped Graphene Oxide Sheets (N-GOs) Prepared by Employing Polymeric Precursors. Materials 2018, 11, 578. [Google Scholar] [CrossRef] [Green Version]
  30. Yoo, M.J.; Park, H. Effect of hydrogen peroxide on properties of graphene oxide in Hummers method. Carbon 2019, 141, 515–522. [Google Scholar] [CrossRef]
  31. Pei, S.; Cheng, H.-M. The reduction of graphene oxide. Carbon 2012, 50, 3210–3228. [Google Scholar] [CrossRef]
  32. Alam, S.N.; Sharma, N.; Kumar, L. Synthesis of Graphene Oxide (GO) by Modified Hummers Method and Its Thermal Reduction to Obtain Reduced Graphene Oxide (rGO)*. Graphene 2017, 6, 1–18. [Google Scholar] [CrossRef] [Green Version]
  33. Othman, F.E.C.; Yusof, N.; Hasbullah, H.; Othman, M.H.D.; Ismail, A.F.; Abdullah, N.; Nordin, N.A.H.M.; Aziz, F.; Salleh, W.N.W. Polyacrylonitrile/magnesium oxide-based activated carbon nanofibers with well-developed microporous structure and their adsorption performance for methane. J. Ind. Eng. Chem. 2017, 51, 281–287. [Google Scholar] [CrossRef]
  34. Nasri, N.S.; Hamza, U.D.; Ismail, S.N.; Ahmed, M.M.; Mohsin, R. Assessment of porous carbons derived from sustainable palm solid waste for carbon dioxide capture. J. Clean. Prod. 2014, 71, 148–157. [Google Scholar] [CrossRef]
  35. Stevens, L.; Williams, K.; Han, W.Y.; Drage, T.C.; Snape, C.; Wood, J.; Wang, J. Preparation and CO2 adsorption of diamine modified montmorillonite via exfoliation grafting route. Chem. Eng. J. 2013, 215, 699–708. [Google Scholar] [CrossRef]
  36. Lopes, E.C.; Dos Anjos, F.S.; Vieira, E.F.; Cestari, A.R. An alternative Avrami equation to evaluate kinetic parameters of the interaction of Hg(II) with thin chitosan membranes. J. Colloid Interface Sci. 2003, 263, 542–547. [Google Scholar] [CrossRef]
  37. Romero, J.R.G.; Moreno-Piraján, J.C.; Giraldo, L. Kinetic and Equilibrium Study of the Adsorption of CO2 in Ultramicropores of Resorcinol-Formaldehyde Aerogels Obtained in Acidic and Basic Medium. J. Carbon Res. C 2018, 4, 52. [Google Scholar] [CrossRef] [Green Version]
  38. Qi, L.; Tang, X.; Wang, Z.; Peng, X. Pore characterization of different types of coal from coal and gas outburst disaster sites using low temperature nitrogen adsorption approach. Int. J. Min. Sci. Technol. 2017, 27, 371–377. [Google Scholar] [CrossRef]
  39. Thommes, M.; Kaneko, K.; Neimark, A.V.; Olivier, J.P.; Rodríguez-Reinoso, F.; Rouquerol, J.; Sing, K.S. Physisorption of gases, with special reference to the evaluation of surface area and pore size distribution (IUPAC Technical Report). Pure Appl. Chem. 2015, 87, 1051–1069. [Google Scholar] [CrossRef] [Green Version]
  40. Lee, S.-Y.; Park, S.-J. Determination of the optimal pore size for improved CO2 adsorption in activated carbon fibers. J. Colloid Interface Sci. 2013, 389, 230–235. [Google Scholar] [CrossRef]
  41. Sing, K.S.; Williams, R.T. Physisorption Hysteresis Loops and the Characterization of Nanoporous Materials. Adsorpt. Sci. Technol. 2004, 22, 773–782. [Google Scholar] [CrossRef]
  42. Liu, H.; Ding, W.; Lei, S.; Tian, X.; Zhou, F. Selective adsorption of CH4/N2 on Ni-based MOF/SBA-15 composite materials. J. Nanomater. 2019, 9, 149, 1–14. [Google Scholar] [CrossRef] [Green Version]
  43. Nasrollahzadeh, M.; Babaei, F.; Fakhri, P.; Jaleh, B. Synthesis, characterization, structural, optical properties and catalytic activity of reduced graphene oxide/copper nanocomposites. RSC Adv. 2015, 5, 10782–10789. [Google Scholar] [CrossRef]
  44. Kim, D.W.; Jung, D.W.; Adelodun, A.A.; Jo, Y.M. Evaluation of CO2 adsorption capacity of electrospun carbon fibers with thermala and chemical activation. J. Appl. Polym. Sci. 2017, 134, 45534. [Google Scholar] [CrossRef]
  45. Gayathri, S.; Jayabal, P.; Kottaisamy, M.; Ramakrishnan, V. Synthesis of few layer graphene by direct exfoliation of graphite and a Raman spectroscopic study. AIP Adv. 2014, 4, 27116. [Google Scholar] [CrossRef]
  46. Frank, O.; Mohr, M.; Maultzsch, J.; Thomsen, C.; Riaz, I.; Jalil, R.; Novoselov, K.S.; Tsoukleri, G.; Parthenios, J.; Papagelis, K.; et al. Raman 2D-Band Splitting in Graphene: Theory and Experiment. ACS Nano 2011, 5, 2231–2239. [Google Scholar] [CrossRef] [PubMed] [Green Version]
  47. Hong, S.M.; Kim, S.H.; Jeong, B.G.; Jo, S.M.; Lee, K.B. Development of porous carbon nanofibers from electrospun polyvinylidene fluoride for CO2 capture. RSC Adv. 2014, 4, 58956–58963. [Google Scholar] [CrossRef]
  48. Badawy, S.M.; Dessouki, A.M. Cross-Linked Polyacrylonitrile Prepared by Radiation-Induced Polymerization Technique. J. Phys. Chem. B 2003, 107, 11273–11279. [Google Scholar] [CrossRef]
  49. Jyothi, N.K.; Kumar, K.V.; Murthy, P.N. FTIR, XRD and DC conductivity studies of proton conducting gel polymer electrolytes based on polyacrylonitrile (PAN). Int. J. ChemTech Res. 2014, 6, 5214–5219. [Google Scholar]
  50. Lee, H.-M.; Kang, H.-R.; An, K.H.; Kim, H.-G.; Kim, B.-J. Comparative studies of porous carbon nanofibers by various activation methods. Carbon Lett. 2013, 14, 180–185. [Google Scholar] [CrossRef] [Green Version]
  51. Ouassim, B.; Fouad, G.; Arunabh, G.; Ouafae, A.; Tarik, C. Excellent CO2 capture by ultra-high microporous activated carbon made out from Natural coal. Chem. Eng. Technol. 2020. under review. [Google Scholar]
  52. Guo, J.; Morris, J.R.; Ihm, Y.; Contescu, C.I.; Gallego, N.C.; Duscher, G.; Pennycook, S.J.; Chisholm, M.F. Topological Defects: Origin of Nanopores and Enhanced Adsorption Performance in Nanoporous Carbon. Small 2012, 8, 3283–3288. [Google Scholar] [CrossRef]
  53. Bin Ali, A.; Renz, F.; Koch, J.; Tegenkamp, C.; Sindelar, R. Graphene Nanoplatelet (GNPs) Doped Carbon Nanofiber (CNF) System: Effect of GNPs on the Graphitic Structure of Creep Stress and Non-Creep Stress Stabilized Polyacrylonitrile (PAN). Nanomaterials 2020, 10, 351. [Google Scholar] [CrossRef] [Green Version]
  54. Huang, Z.-M.; Zhang, Y.; Kotaki, M.; Ramakrishna, S. A review on polymer nanofibers by electrospinning and their applications in nanocomposites. Compos. Sci. Technol. 2003, 63, 2223–2253. [Google Scholar] [CrossRef]
  55. Ahmad, M.; Wang, J.; Xu, J.; Zhang, Q.; Zhang, B. Magnetic tubular carbon nanofibers as efficient Cu(II) ion adsorbent from wastewater. J. Clean. Prod. 2020, 252, 119825. [Google Scholar] [CrossRef]
  56. Wei, H.; Deng, S.; Hu, B.; Chen, Z.; Wang, B.; Huang, J.; Yu, G. Granular Bamboo-Derived Activated Carbon for High CO2Adsorption: The Dominant Role of Narrow Micropores. ChemSusChem 2012, 5, 2354–2360. [Google Scholar] [CrossRef]
  57. Li, K.; Tian, S.; Wang, J.; Jiang, J.; Chen, X.; Yan, F. Pine cone shell-based activated carbon used for CO2 adsorption. J. Mater. Chem. A 2016, 4, 5223–5234. [Google Scholar] [CrossRef]
  58. Chen, L.; Watanabe, T.; Kanoh, H.; Hata, K.; Ohba, T. Cooperative CO2 adsorption promotes high CO2 adsorption density over wide optimal nanopore range. Adsorpt. Sci. Technol. 2017, 36, 625–639. [Google Scholar] [CrossRef] [Green Version]
  59. Ullah, S.; Shariff, A.M.; Bustam, M.A.; Elkhalifah, A.E.I.; Murshid, G.; Riaz, N.; Shimekit, B. Modified MIL-53 with multi-wall carbon nanotubes and nano fibers on CO2 adsorption. Appl. Mech. Mater. 2014, 625, 870–873. [Google Scholar] [CrossRef]
  60. Ojeda-López, R.; Esparza-Schulz, M.; Pérez-Hermosillo, I.J.; Hernández-Gordillo, A.; Domínguez-Ortiz, A. Improve in CO2 and CH4 Adsorption Capacity on Carbon Microfibers Synthesized by Electrospinning of PAN. Fibers 2019, 7, 81. [Google Scholar] [CrossRef] [Green Version]
  61. Meng, L.-Y.; Park, S.-J. Effect of heat treatment on CO2 adsorption of KOH-activated graphite nanofibers. J. Colloid Interface Sci. 2010, 352, 498–503. [Google Scholar] [CrossRef]
  62. Yuan, H.; Meng, L.-Y.; Park, S.-J. KOH-activated graphite nanofibers as CO2 adsorbents. Carbon Lett. 2016, 19, 99–103. [Google Scholar] [CrossRef] [Green Version]
  63. Hu, X.-J.; Wang, J.-S.; Liu, Y.; Li, X.; Zeng, G.-M.; Bao, Z.-L.; Zeng, X.-X.; Chen, A.; Long, F. Adsorption of chromium (VI) by ethylenediamine-modified cross-linked magnetic chitosan resin: Isotherms, kinetics and thermodynamics. J. Hazard. Mater. 2011, 185, 306–314. [Google Scholar] [CrossRef]
  64. Martín, C.; Sweatman, M.; Brandani, S.; Fan, X. Wet impregnation of a commercial low cost silica using DETA for a fast post-combustion CO2 capture process. Appl. Energy 2016, 183, 1705–1721. [Google Scholar] [CrossRef] [Green Version]
  65. Berger, A.H.; Bhown, A.S. Comparing physisorption and chemisorption solid sorbents for use separating CO2 from flue gas using temperature swing adsorption. Energy Procedia 2011, 4, 562–567. [Google Scholar] [CrossRef] [Green Version]
  66. Culp, J.T.; Smith, M.R.; Bittner, E.; Bockrath, B. Hysteresis in the Physisorption of CO2 and N2 in a Flexible Pillared Layer Nickel Cyanide. J. Am. Chem. Soc. 2008, 130, 12427–12434. [Google Scholar] [CrossRef]
Figure 1. Schematic diagram of the volumetric set-up for CO2 adsorption. 1. Feed gas 2. Check valve 3. Loading column 4. Adsorption column 5. High pressure transducer 6. Pressure meter 7. Thermocouple 8. Vacuum pump; P: pressure regulator; G: pressure gauge.
Polymers 12 02117 g001
Figure 2. N2 adsorption/desorption isotherms of the materials under investigation (a) materials before activation and (b) materials after activation.
Polymers 12 02117 g002
Figure 3. Raman spectra of rGO, ACNF and rGO/ACNF. (a) materials before activation and (b) materials after activation.
Polymers 12 02117 g003
Figure 4. XRD spectra of (a) pristine NF and ACNF; and (b) rGO, ACNF, and rGO/ACNFs.
Polymers 12 02117 g004
Figure 5. FESEM micrographs of NF, rGO/NF0.1 and rGO/ACNF0.1 composite at different magnifications (ac) of 1000× magnification and (df) of 20,000× magnification.
Polymers 12 02117 g005
Figure 6. EDX spectra of (a) pristine ACNF and (b) rGO/ACNF composites.
Polymers 12 02117 g006
Figure 7. CO2 uptake kinetics of the pristine ACNF and composite at different adsorption pressures (a) 5 bar, (b) 10 bar, and (c) 15 bar at 25 °C.
Polymers 12 02117 g007
Figure 8. Illustration of (a) overview of ACNFs composite structure and (b) CO2 adsorption mechanism on the gACNFs.
Polymers 12 02117 g008
Figure 9. Pseudo-first order and pseudo-second order kinetic models of ACNF and rGO/ACNF0.1 composite at different pressures: (a,b) 5 bar, (c,d) 10 bar, and (e,f) 15 bar.
Polymers 12 02117 g009
Table 1. Porous characteristics of the pristine nanofibers (NF) and reduced graphene oxide (rGO)/NFs nanocomposites before and after activation.
SamplesSBET (m2/g)Vtotal (cm3/g)Vmicro (cm3/g)Vmeso (cm3/g)Vmicro/Vtotal (%)
Before ActivationNF170.14000
rGO/NF0.01100.07000
rGO/NF0.0580.05000
rGO/NF0.1320.30000
After ActivationActivated carbon nanofibers (ACNF)1390.090.060.0367
rGO/ACNF0.01920.070.040.0357
rGO/ACNF0.052330.140.090.0564
rGO/ACNF0.13730.220.150.0768
SBET = specific surface area; Vtotal = total pore volume; Vmicro = micropore volume; Vmeso = mesopore volume.
Table 2. CO2 uptakes at different pressures at ambient temperatures.
SampleCO2 Uptakes (mmol/g)
5 bar10 bar15 bar
ACNF242731
rGO/ACNF0.01172021
rGO/ACNF0.05343644
rGO/ACNF0.1414358
Table 3. Comparison of CO2 adsorption capacity on various types of carbon fibers and their composite-based adsorbents.
MaterialsSBET (m2/g)Vmicro (cm3/g)Vol. of CO2 Adsorbed (mmol/g)Temp; PressureRef.
rGO/ACNF0.13730.224125 °C; 5 barThis work
4325 °C; 10 bar
5825 °C; 15 bar
PVDF-CNFs10650.613.130 °C; 1 atmHong et al., 2014 [58]
CNF-SnO24340.202.625 °C; 1 atmAli et al., 2020 [54]
CNF-MIL-53140-1.3525 °C; 1 barUllah et al., 2014 [59]
PAN-CMFs966-2.925 °C; 1 barOjeda-Lopez et al., 2019 [60]
Graphite NFs5670.2759.2 mg/g25 °C; 1 atmMeng and Park, 2010 [61]
Graphite NFs9660.2570.8 mg/g25 °C; 1 atmYuan et al., 2016 [62]
Table 4. The fitted parameters of pseudo-first order and pseudo-second order of ACNF and rGO/ACNF0.1 composite.
SamplePressure (bar)qe,exp (mmol/g)Pseudo-First OrderPseudo-Second Order
k1R2k2R2
ACNF5240.10360.63370.13970.9645
rGO/ACNF0.1410.08650.75660.14350.9825
ACNF10270.12170.75950.19020.6563
rGO/ACNF0.1460.09410.76670.05310.9127
ACNF15310.11140.72660.03190.3897
rGO/ACNF0.1580.07160.78610.06970.2493

