Article

Coincident Correlation between Vibrational Dynamics and Primary Relaxation of Polymers with Strong or Weak Johari-Goldstein Relaxation

1
Dipartimento di Fisica “Enrico Fermi”, Università di Pisa, Largo B.Pontecorvo 3, I-56127 Pisa, Italy
2
Istituto per i Processi Chimico-Fisici-Consiglio Nazionale delle Ricerche (IPCF-CNR), via G. Moruzzi 1, I-56124 Pisa, Italy
*
Author to whom correspondence should be addressed.
These authors contributed equally to this work.
Polymers 2020, 12(4), 761; https://doi.org/10.3390/polym12040761
Submission received: 26 February 2020 / Revised: 19 March 2020 / Accepted: 24 March 2020 / Published: 31 March 2020
(This article belongs to the Special Issue State-of-the-Art Polymer Science and Technology in Italy (2019,2020))

Abstract

:
The correlation between the vibrational dynamics, as sensed by the Debye-Waller factor, and the primary relaxation in the presence of secondary Johari-Goldstein (JG) relaxation, has been investigated through molecular dynamics simulations. Two melts of polymer chains with different bond length, resulting in rather different strength of the JG relaxation are studied. We focus on the bond-orientation correlation function, exhibiting higher JG sensitivity with respect to alternatives provided by torsional autocorrelation function and intermediate scattering function. We find that, even if changing the bond length alters both the strength and the relaxation time of the JG relaxation, it leaves unaffected the correlation between the vibrational dynamics and the primary relaxation. The finding is in harmony with previous studies reporting that numerical models not showing secondary relaxations exhibit striking agreement with experimental data of polymers also where the presence of JG relaxation is known.

1. Introduction

If polymers and liquids avoid crystallization during cooling or compression, they freeze into a microscopically disordered solid-like state, a glass [1]. On approaching the glass transition, molecular rearrangements occur via both the primary mode, referred to as structural or α relaxation, and the faster secondary (β) processes as evidenced by mechanical, electrical, and thermal properties of materials [2,3,4]. Although it has been at the focus of a large number of phenomenological and theoretical studies, as well as of experiments and simulations [4,5,6,7,8,9,10], there is still no definitive microscopic description available for the β relaxation. In particular, there is a special class of secondary relaxations involving translation or reorientation of the molecular unit as a whole, well different from the trivial ones, related to intramolecular degrees of freedom, such as the motion of pendant groups in polymers. This special class of β processes, called Johari Goldstein (JG) to honor the researchers that first noticed it [5], is universal in glass formers [4,6,7] and has been shown [6] to have strong relation to structural α-relaxation, being both governed by intermolecular interactions. A number of experimental results indicate that this β JG relaxation is sensitive to the thermodynamic variables underlying the glass transition [4,7], mimicking the α relaxation, being strongly pressure dependent and showing the invariance of the ratio τα/τβ to variations of pressure and temperature, keeping τα constant. β JG, for these reasons, can be considered as the precursor to structural relaxation, having a slower dynamics due to cooperativity involving many body dynamics [6,8].
The purpose of the present paper is to investigate if the presence of well resolved secondary relaxation could disprove the universal correlation between the vibrational dynamics and the primary relaxation observed by experiments and numerical simulations in highly viscous liquids [11], for a recent mini review see Reference [12]. We are motivated by the fact that the timescale of the secondary relaxation ( τ ¯ s ) is intermediate between the vibrational timescale (t*), a few picoseconds, and the structural relaxation time of the primary relaxation ( τ ¯ p ) which reaches about hundreds of seconds close to the glass transition:
t * τ ¯ s < τ ¯ p
The exact definitions of the symbols in Equation (1) will be given in Section 3. Here, we are interested in the secondary relaxation observed in the main chain of linear polymers without side groups. This class fits the definition of Johari-Goldstein (JG) relaxation [7]. There is consensus that in linear chains the JG process involves local motion of the polymer backbone.
Recently, the investigation of JG relaxation by using MD simulations has been facilitated by the development of coarse-grained models of linear polymers having fixed bond length and bond angles constrained to 120° [13,14,15]. We also mention studies of the JG relaxation in asymmetric diatomic molecules [15,16].

2. Model and Numerical Methods

We investigate two coarse-grained models of linear polymer chains. The melts are constituted by Nc = 512 linear chains made of M = 25 monomers each, resulting in a total number of monomers N = 12800. Non-bonded monomers at a distance r interact via a Lennard-Jones potential:
U L J r = ε σ * r 12 2 σ * r 6
where σ* = 21/6σ is the minimum of the potential, U L J r = σ = ϵ . The potential is truncated at r = rc = 2.5σ for computational convenience. Adjacent bonded monomers interact with each other via the harmonic potential Ubond(r) = kbond(rl0)2, where the constant kbond is set to 2000 ϵ / σ 2 to ensure high stiffness. We consider two distinct cases, corresponding to rest bond length l0 set to either l0 = 0.48σ or l0 = 0.55σ. The rationale behind our choice of the two bond lengths relies on the finding that previous Molecular-Dynamics (MD) simulations of the present model [14], investigating the rotational dynamics, revealed the steep increase of the separation between the primary and the JG relaxations by decreasing the bond length below l 0 * = 0.5 σ (corresponding to 2Å in Figure 3 of Reference [14]). Therefore, one anticipates that the JG relaxation is much more apparent if l0 = 0.48σ with respect to l0 = 0.55σ. A bending potential Ubend(α) = kbend (cos α − cos α0)2, with kbend = 2000ϵ/σ2 and α0 = 120°, is introduced to maintain the angle α formed by two consecutive bonds nearly constant (see Figure 1 for typical chain conformations) [17].
All the data presented in this work are expressed in reduced MD units: length in units of σ, temperature in units of ϵ/kB, where kB is the Boltzmann constant, and time in units of τMD = (2/ϵ)1/2. We set σ = 1, ϵ = 1, m = 1 and kB = 1.
Simulations were carried out with the open-source software LAMMPS [18,19]. Equilibration runs were performed at constant number of monomers N, constant vanishing pressure P = 0 and constant temperature T (NPT ensemble) [20]. For each state the equilibration lasted at least for 3τee, being τee the relaxation time of the end-to-end vector autocorrelation function [21,22,23,24,25,26,27,28]. Production runs have been performed within the NVT ensemble (constant number of monomers N, constant volume V and constant temperature T). Additional short equilibration runs were performed when switching from NPT to NVT ensemble. No signatures of crystallization were observed in all the investigated states.
As a final remark, we point out that our adoption of a monodisperse polymer model where all the chains have equal length is not expected to limit our conclusions. In fact, the vibrational scaling collapses in a single master curve both the MD results of monodisperse polymer models and the experimental data on polymers which, expectedly, refer to polydisperse systems [11].

3. Results and Discussion

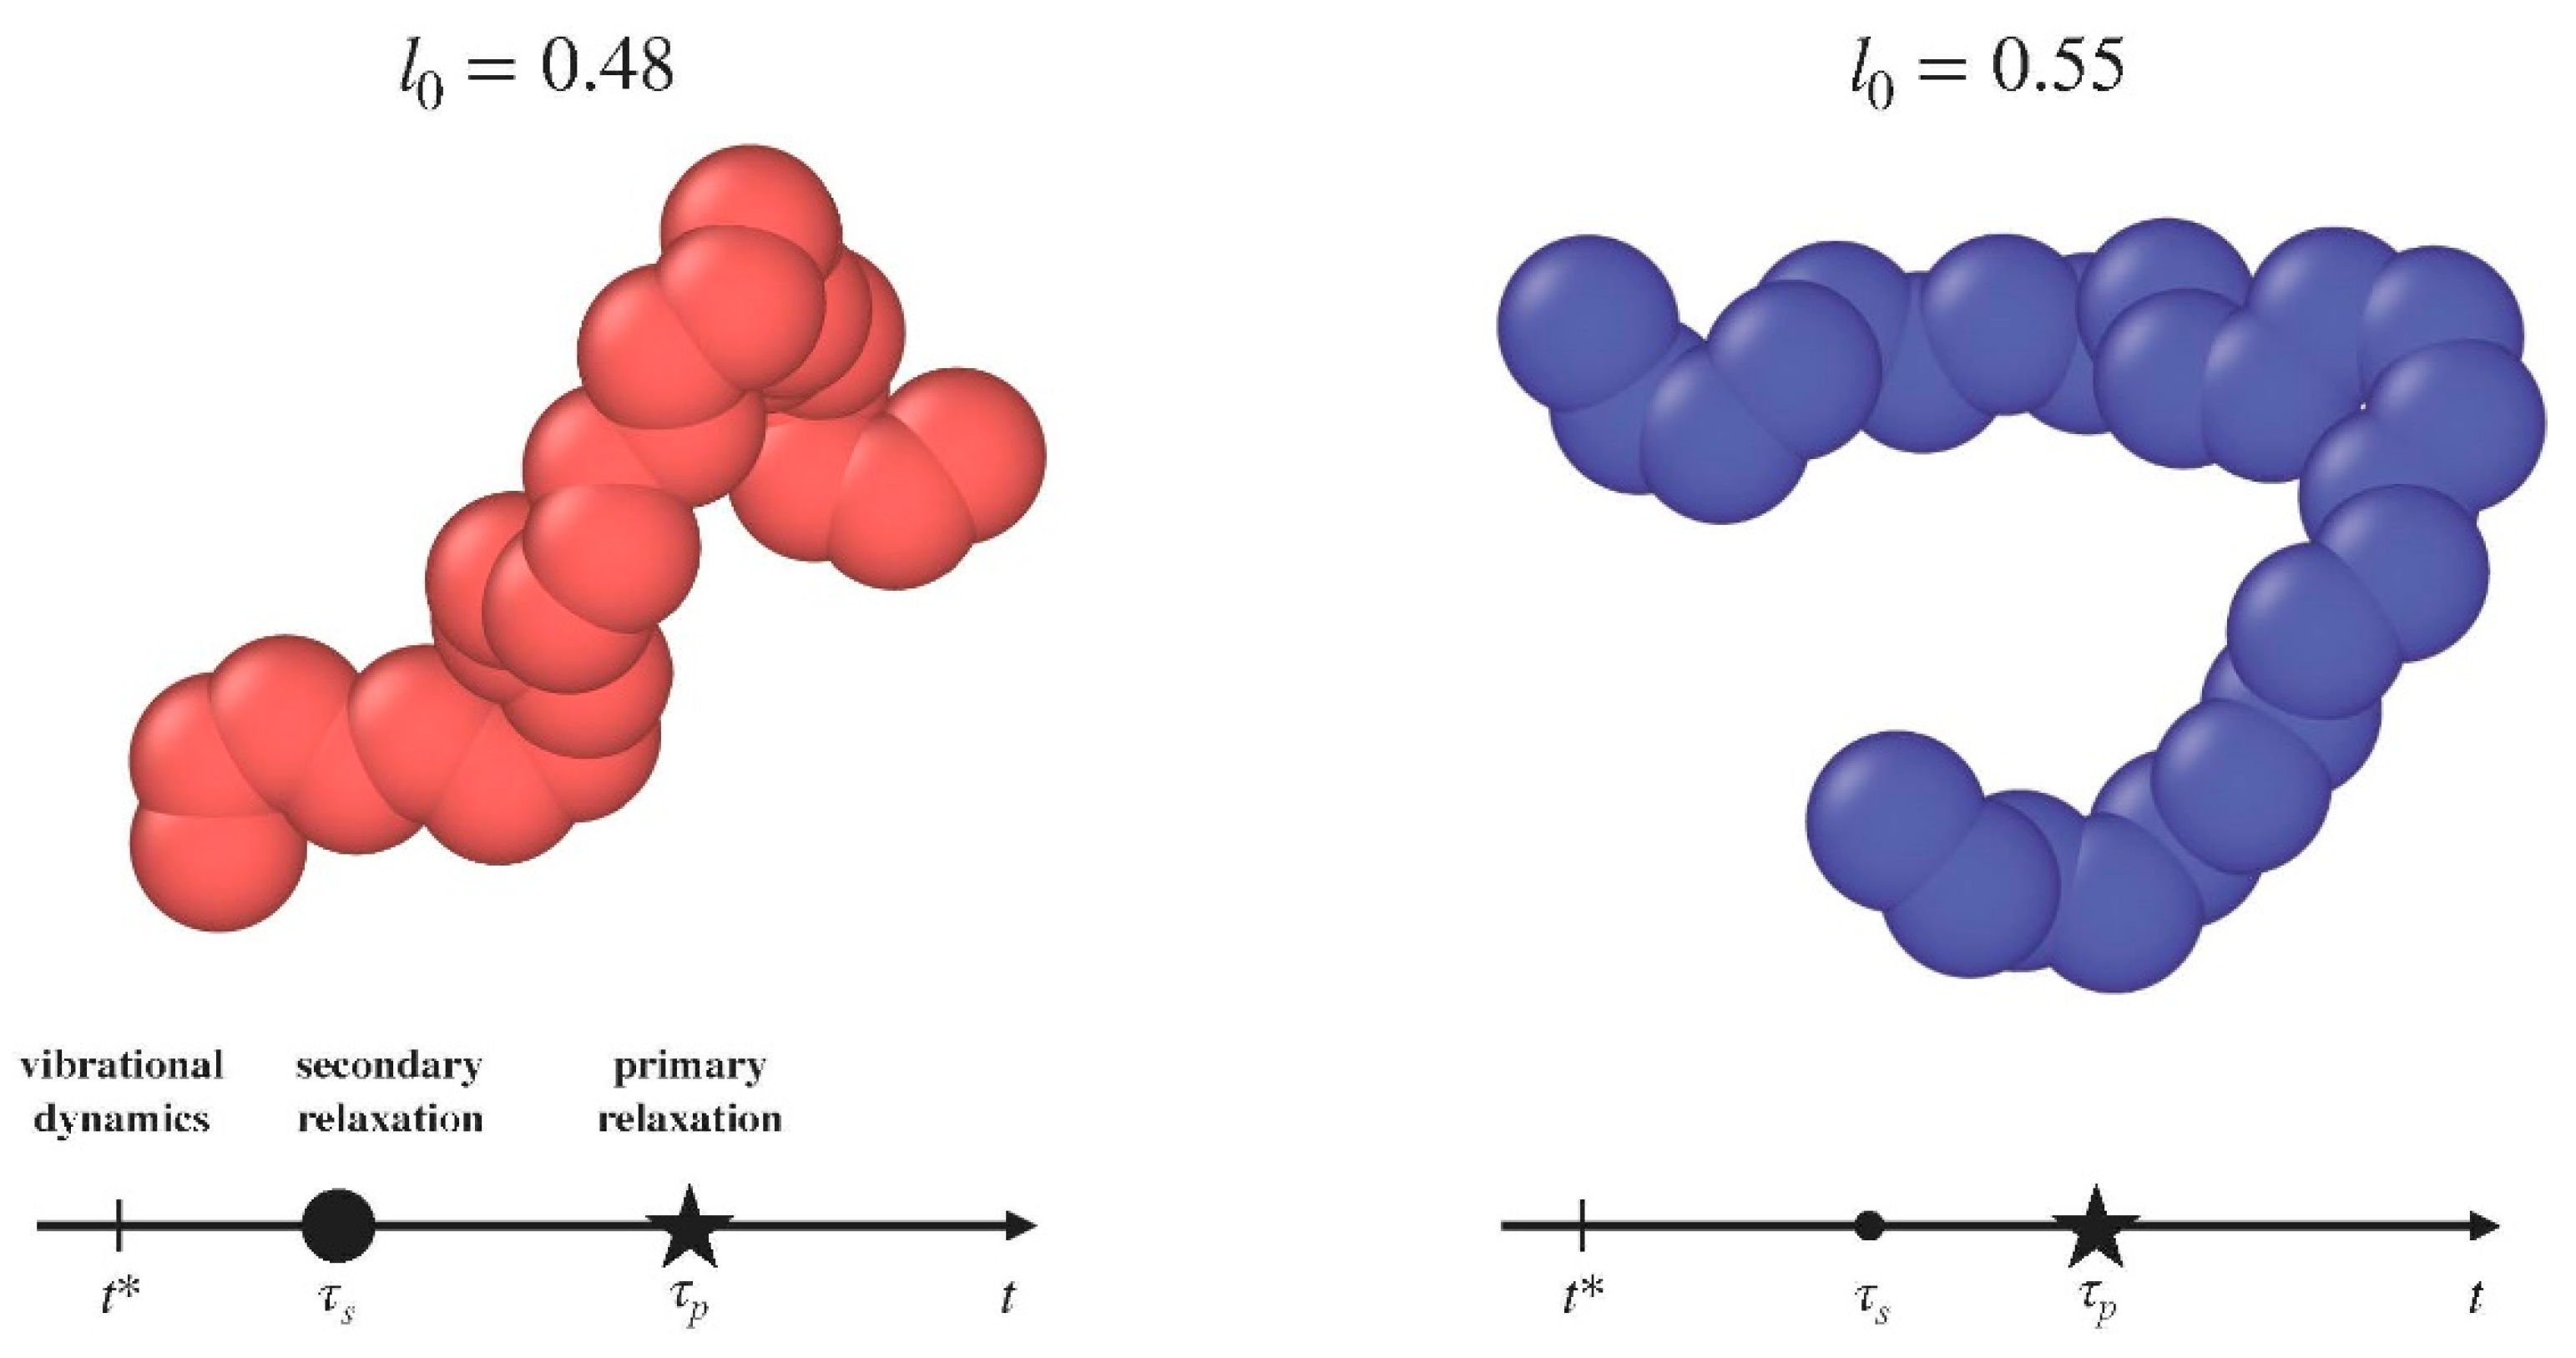
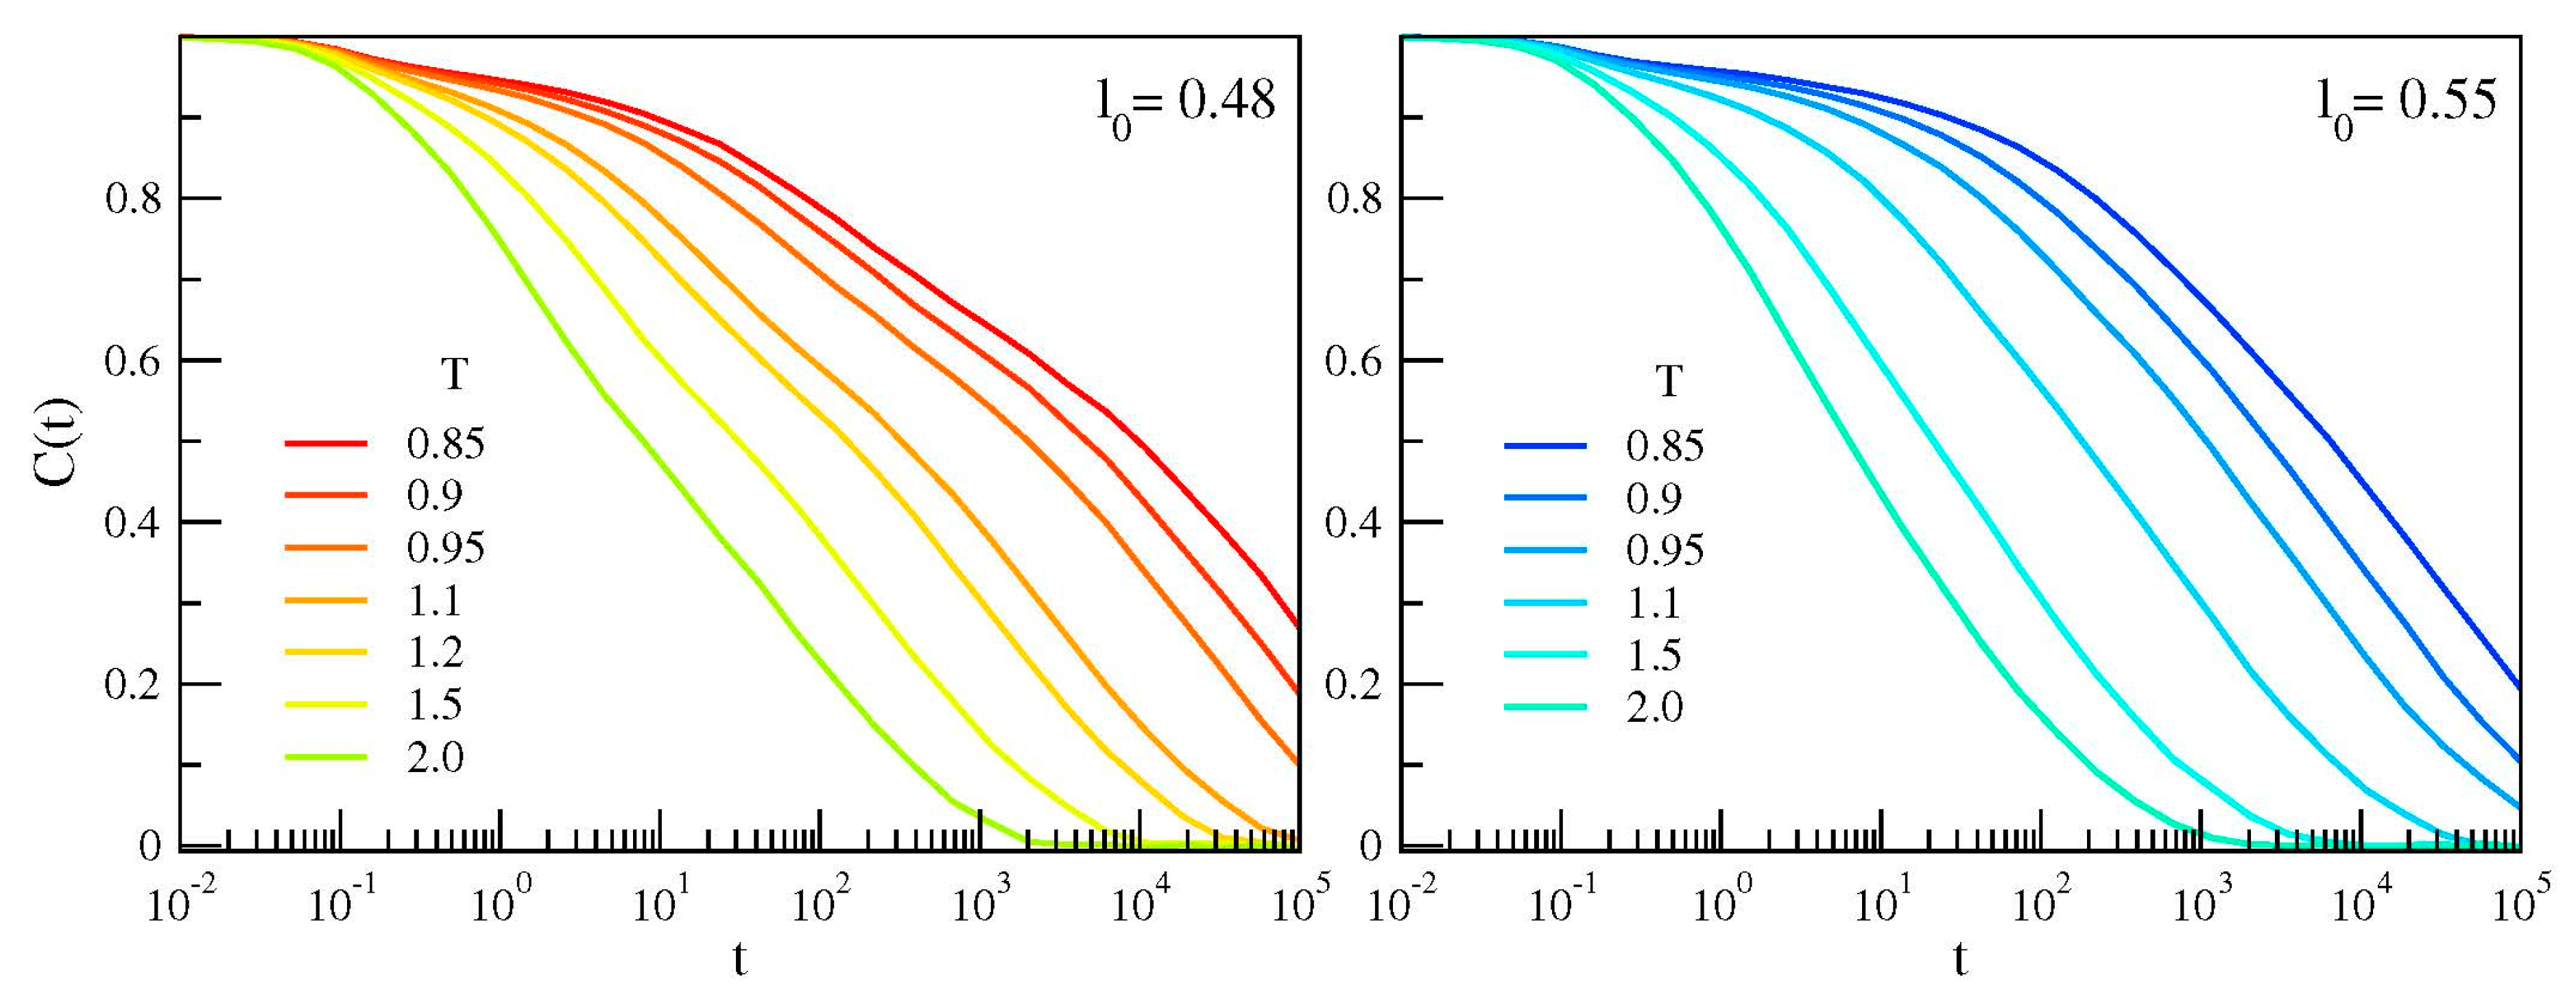
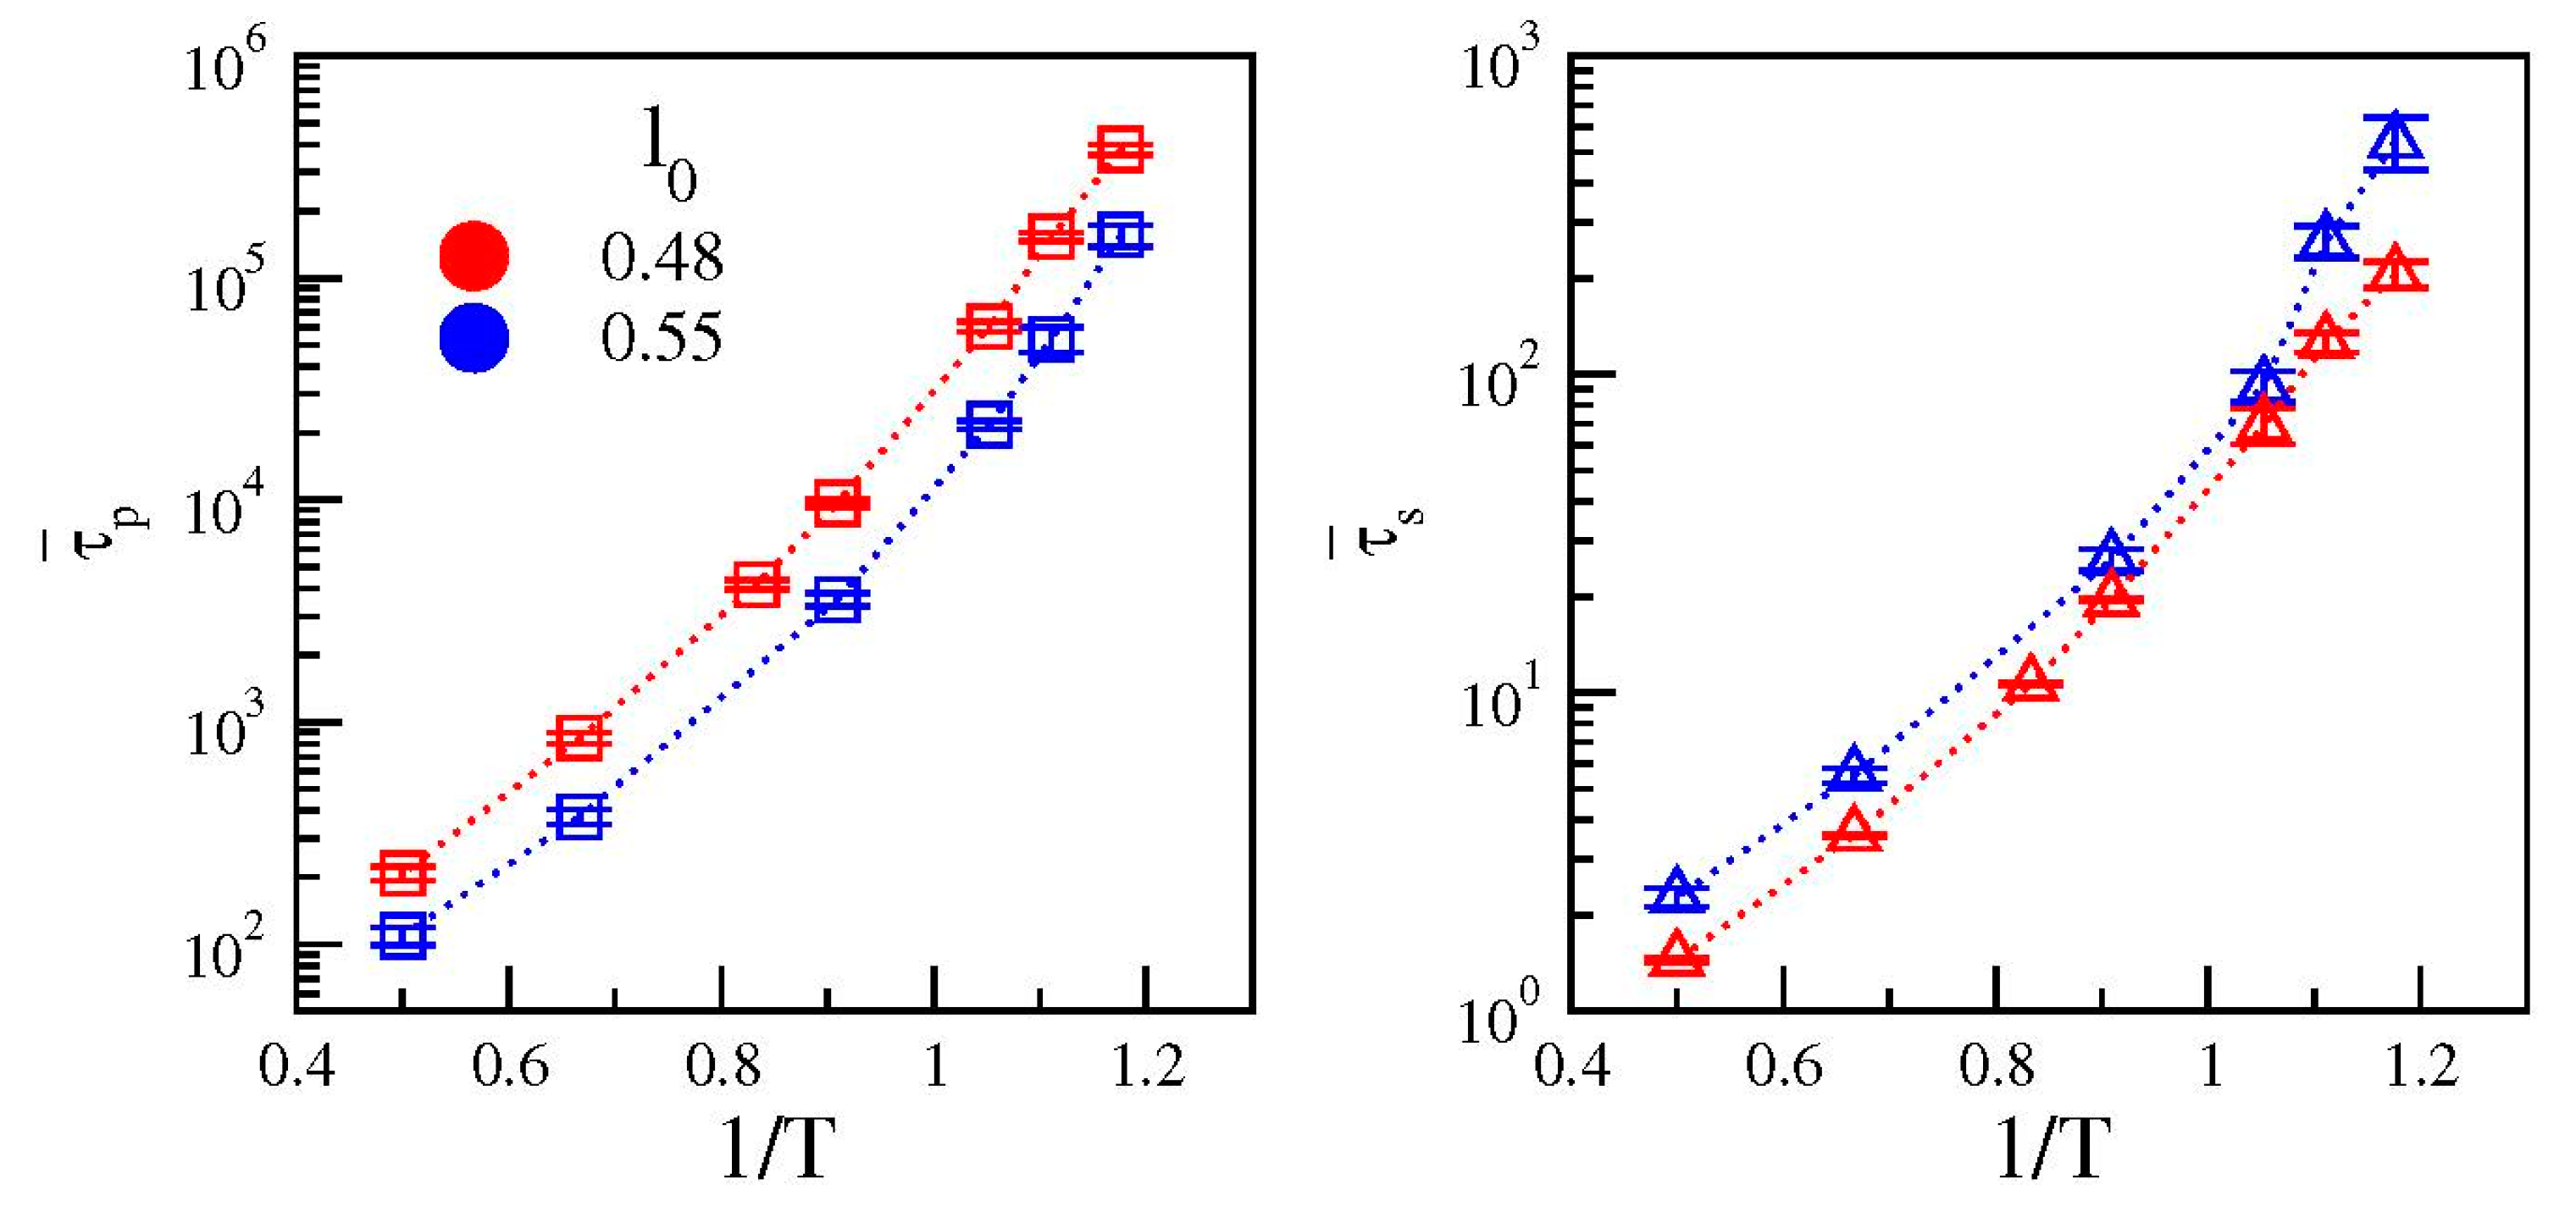
3.1. Bond Reorientation

Since in linear chains the JG process involves local motion of the polymer chain backbone [4,7], we focus on the most elementary relaxation process, that is, the reorientation of the bond linking two adjacent monomers of the same chain. Let us define a suitable average bond correlation function C(t) [29]. To this aim, we consider the unit vector along the m-th bond of the n-th chain at time t:
b m , n t = 1 l 0 r m , n t r m + 1 , n t
where rm,n (t) denotes the position of the m-th monomer in the n-th chain at time t. We define the correlation function C(t):
C t = 1 N c 1 M 1 n = 1 N c m = 1 M 1 b m , n t · b m , n 0
The brackets denote a suitable ensemble average. C(t) decreases in time (by definition C(0) = 1), finally vanishing at long times when the bond orientation has explored all the unit sphere.
Figure 2 plots the correlation function C(t) for the two polymer melts with chains having different bond length. In agreement with previous studies [13,14], it is seen that the chains having shorter bond length exhibits a characteristic two-step decay, signaling the presence of two distinct relaxation processes.
To gain more insight, the correlation function C(t) was analyzed under the assumption that it is represented by the weighted sum of two components, that is, a fast secondary process and a slower primary one:
C t = A p f p t + A s f s t
where fp(t) and fs(t) are two decaying functions with amplitudes Ap and As, respectively. The explicit form of fi(t) is taken as a stretched exponential:
f i t = exp t τ i β i ,   i = p , s
where τi denotes the relaxation time and βi the stretching exponent (as normally βi ≤ 1). We fit the MD data concerning the correlation function C(t) with Equation (5) excluding the time window t t ^ where the decay of the function is controlled by the ballistic motion of monomers (0.6 ≤ t ^ ≤ 1 with t ^ decreasing slightly by increasing T).
The analysis in terms of a sum of two stretched exponential decays, Equation (5) and Equation (6), conforms with most studies of primary and secondary relaxations in MD simulation [13,14,15,30,31] and in some experiments done in time domain [32,33]. Then, it facilitates the comparison between our results to those present in literature.
We have considered also the use of alternative functions to fit the secondary relaxation. For instance, we tested the Mittag Leffer function (with 2 fitting parameters like the stretched exponential), corresponding to the time-domain counterpart of the Cole-Cole function and usually used in studies of dielectric spectroscopy to describe the secondary process [34,35]. Yet, no significant differences have been found in terms of relaxation times and strengths with respect to the analysis with the sum of stretched exponentials.
Figure 3 shows the result of the best-fit of C(t) with Equation (5) and Equation (6) for a representative state of the model. For comparison, the best-fit with a single stretched exponential decay is also shown. The residuals CMD(t) − Cfit(t) plotted in the inset of Figure 3 prove the poor performance of the single-relaxation curve to fit the MD data.
Figure 4 presents the temperature dependence of the parameters extracted from the best-fit of data with Equation (5) and Equation (6). It is seen that reducing the bond length has two major effects: (i) increased separation of the relaxation times τs and τp (ii) enhanced amplitude of the secondary relaxation with respect to the primary one. It is also worth noting that the primary relaxation is less stretched in the model where the secondary relaxation is more apparent (l0 = 0.48) with respect to the case in which it is weak (l0 = 0.55). The differences are small but significant, that is, larger than the errors on the stretching exponents. Stretched relaxation is usually associated with the presence of dynamical heterogeneities, namely the spatial distribution of mobilities, which may differ of orders of magnitude in regions only a few nanometers away. In this framework, our results suggest that the presence of a not negligible secondary relaxation process slightly decreases the degree of dynamical heterogeneity of the system. We plan to address this aspect in future works.
To get rid of the temperature dependence of the stretching exponent β, we define the average relaxation time for the primary and the secondary relaxations, τ ¯ p and τ ¯ s respectively, as the time-integral of the corresponding relaxation function (fp and fs) leading to
τ ¯ i = τ i β i Γ 1 β i ,   i = p , s
The temperature dependence of the average relaxation times of the two polymer models are shown in Figure 5. For both systems the primary relaxation time (left panel in Figure 5) grows more than three orders of magnitude in the range of temperature from T = 2.0 to T = 0.85, exhibiting a non-Arrhenius upward concavity which is typical of fragile glassformers [36]. Conversely, the growth of the secondary relaxation time (right panel in Figure 5) is less pronounced (approximately two and a half decades in the same temperature range) and the deviations from an Arrhenius behavior are weaker, in particular for the system with stronger secondary relaxation (l0 = 0.48, red symbols).

3.2. Monomer Mobility

With the aim of further characterizing the dynamics of the two polymer melts with chains having distinct bond lengths, we now consider the monomer mobility, as quantified by the mean square displacement (MSD)
r 2 t = 1 N i = 1 N x t t x i 0 2
where xi (t) is the position of the i-th monomer at time t. Figure 6 shows MSD curves for the two systems at all the investigated temperatures. At very short times (ballistic regime) MSD increases according to r 2 t 3 k B T / m t 2 . At later times a quasi-plateau region becomes apparent when the temperature is lowered. This signals the increased trapping of a particle in the cage of its neighbors. Once escaped from the cage, due to the presence of the chain connectivity, the monomers undergo a sub diffusive motion r 2 t t δ with δ < 1 (Rouse regime) [21]. At very long times, monomers displace in a diffusive way (δ = 1). Diffusion is hardly seen in our simulations since, due to the length of the chains, it occurs at the limit of the accessible timescales.

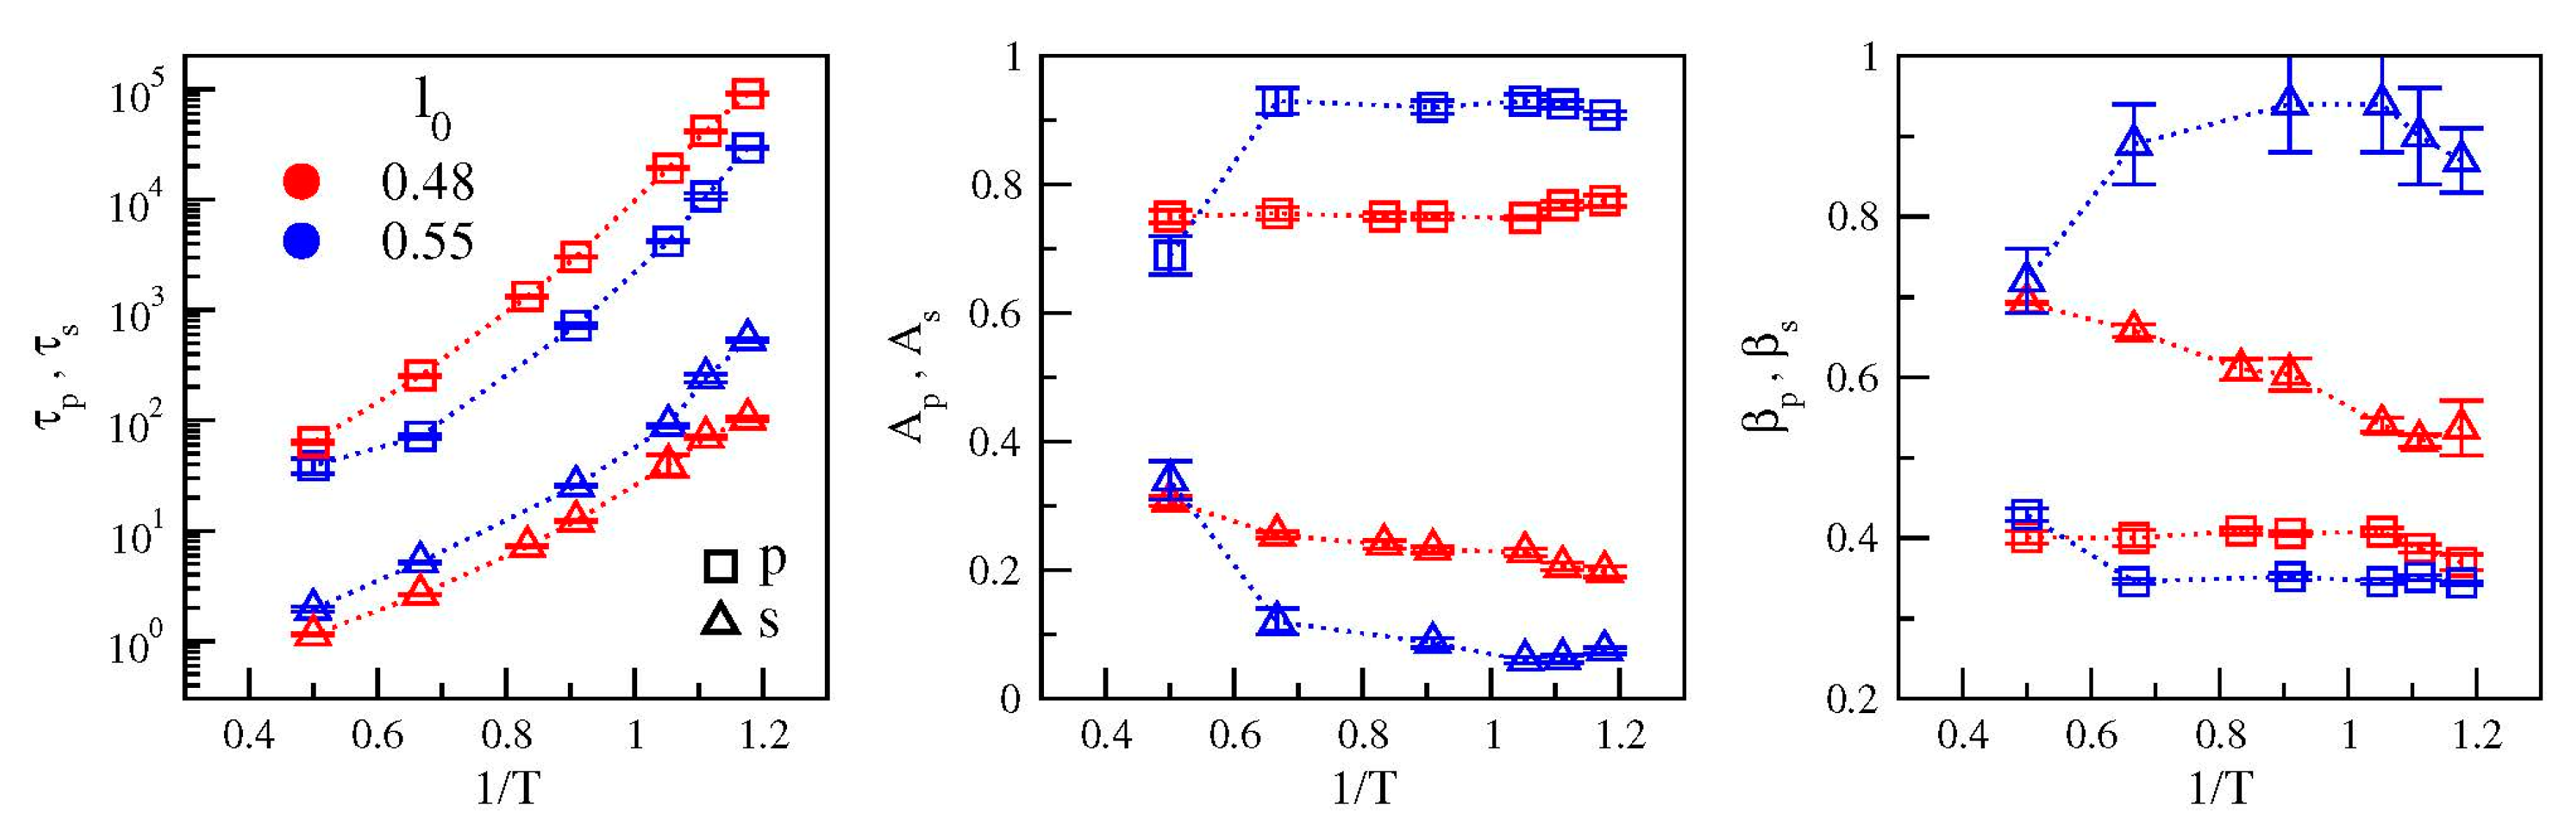
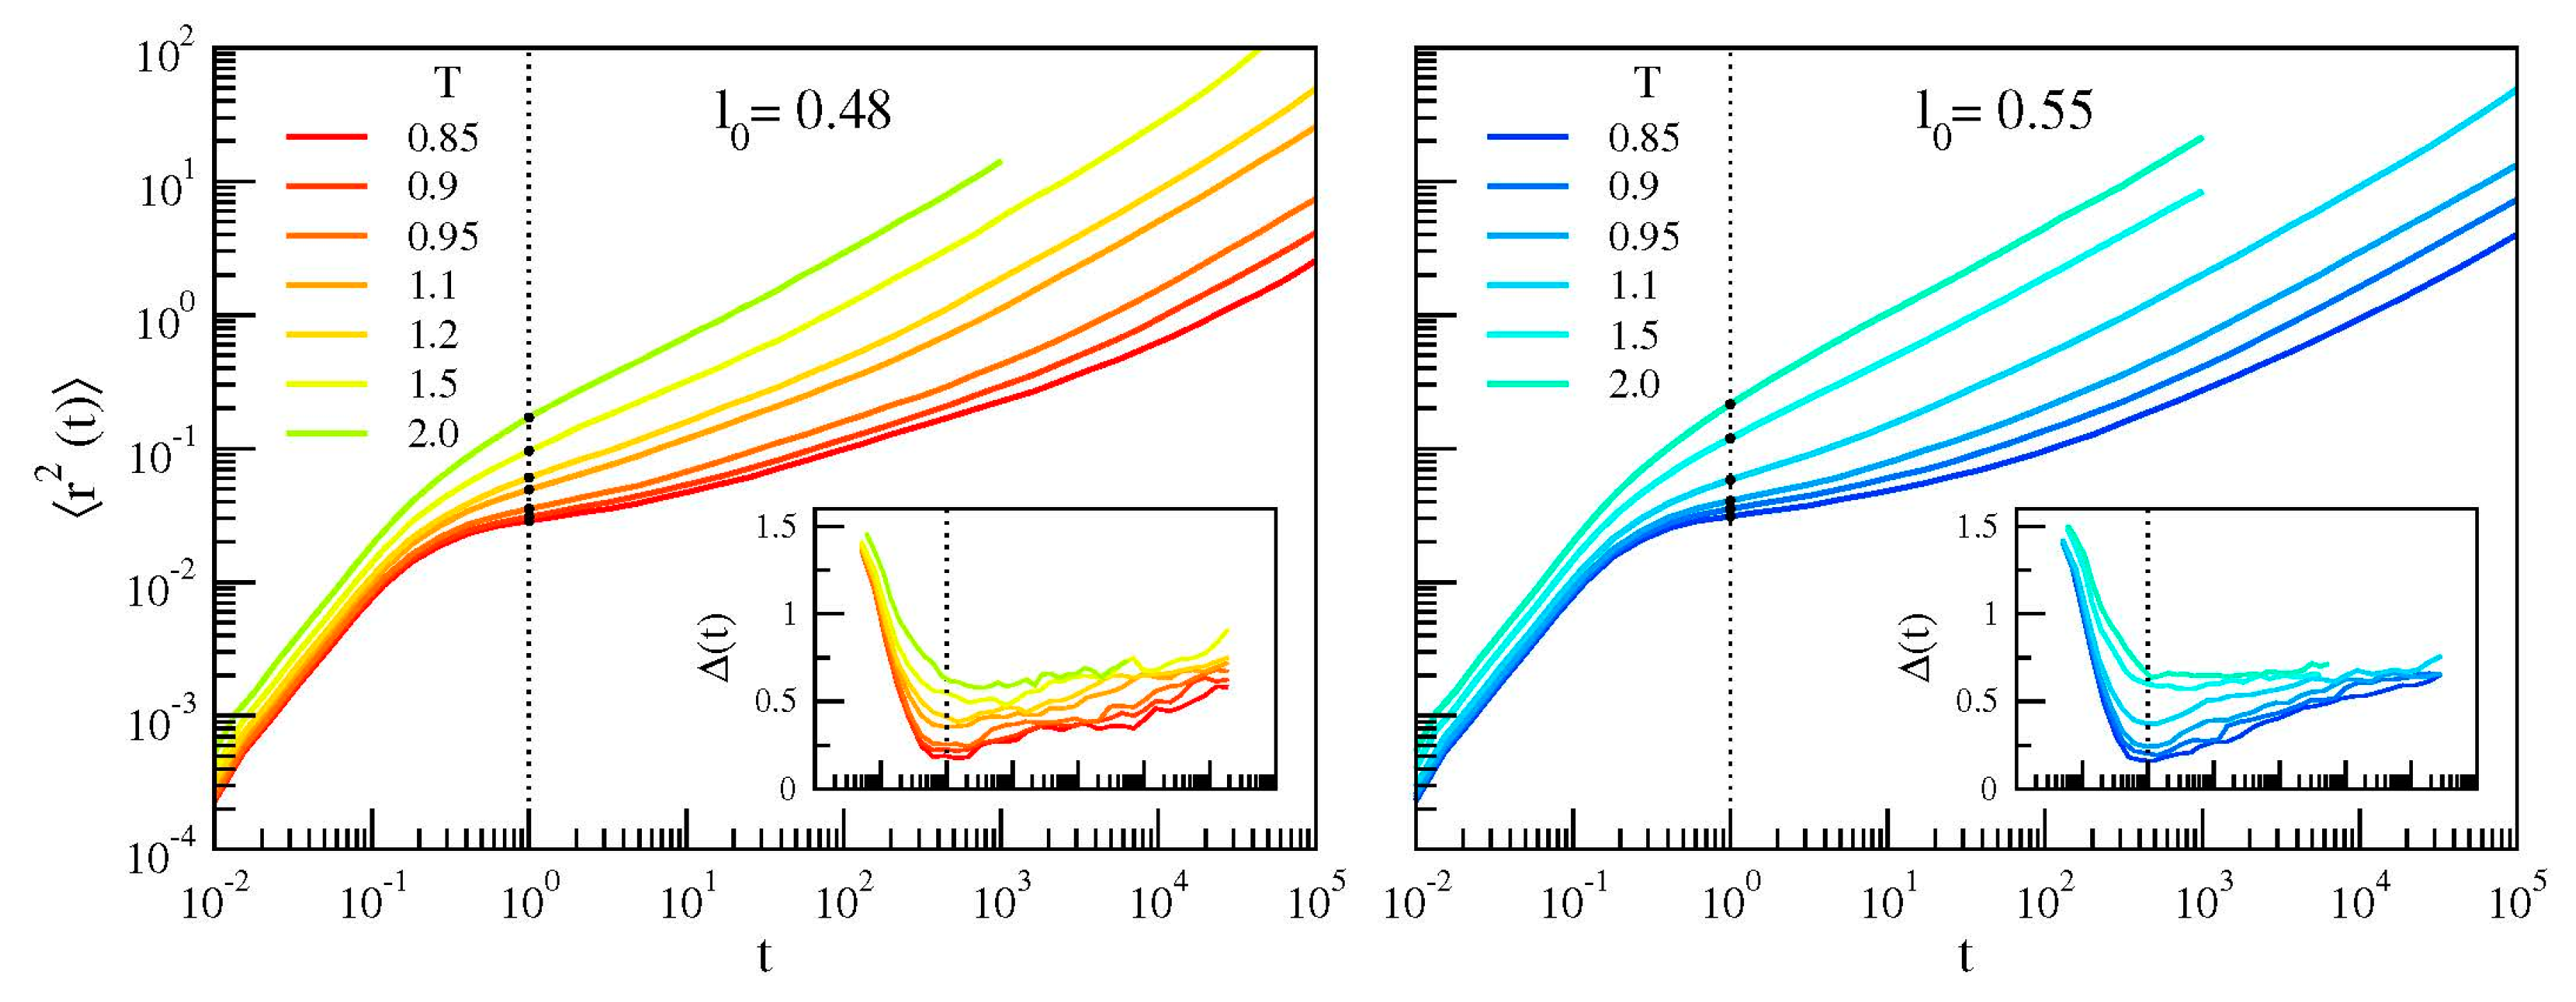
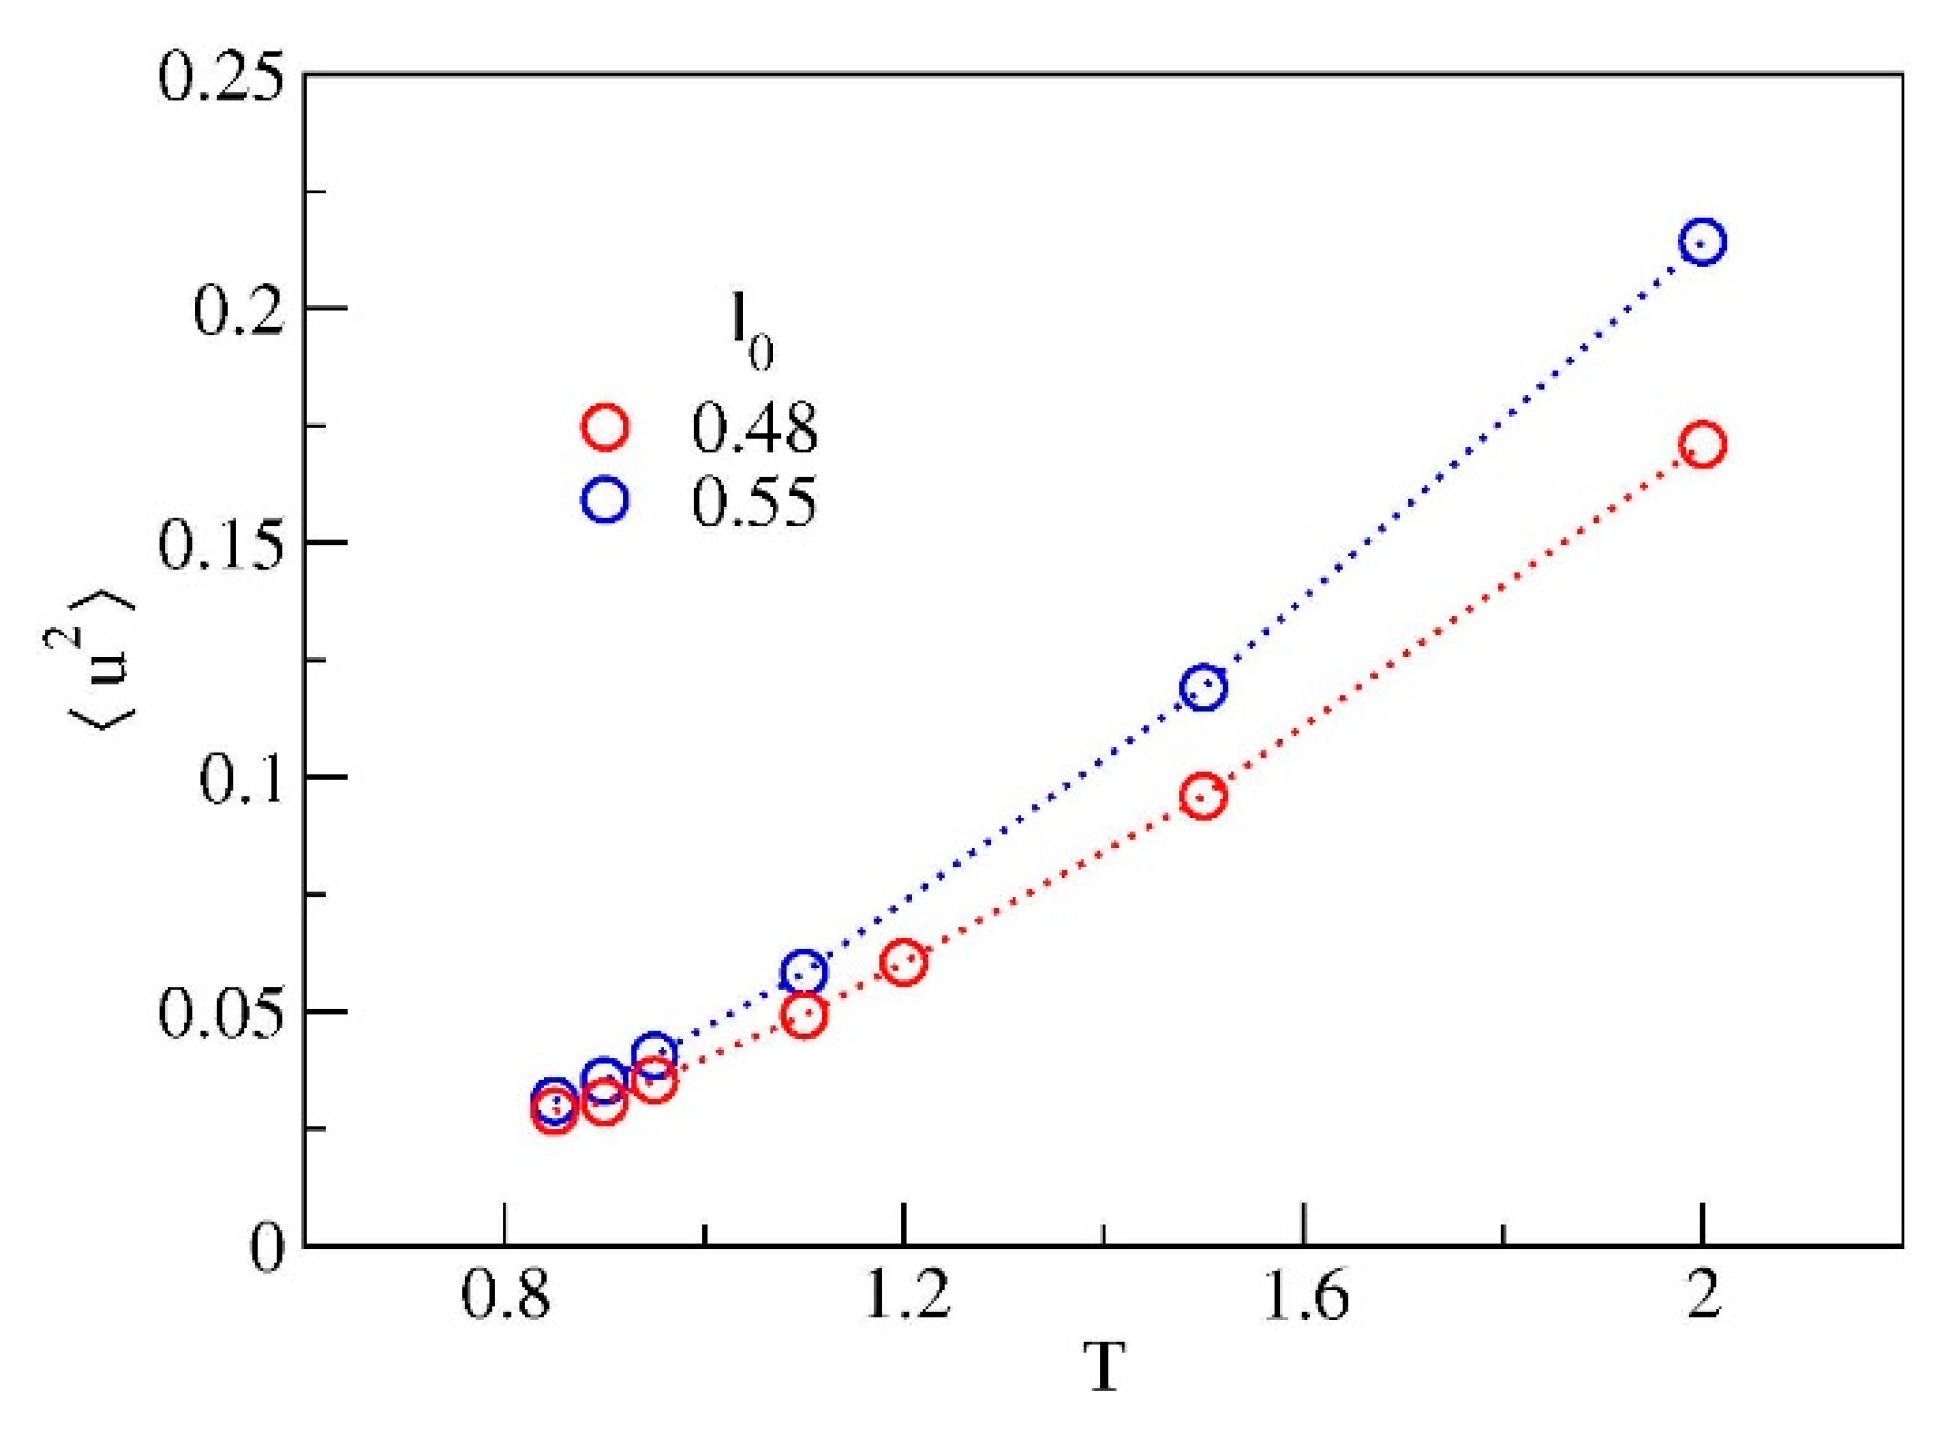
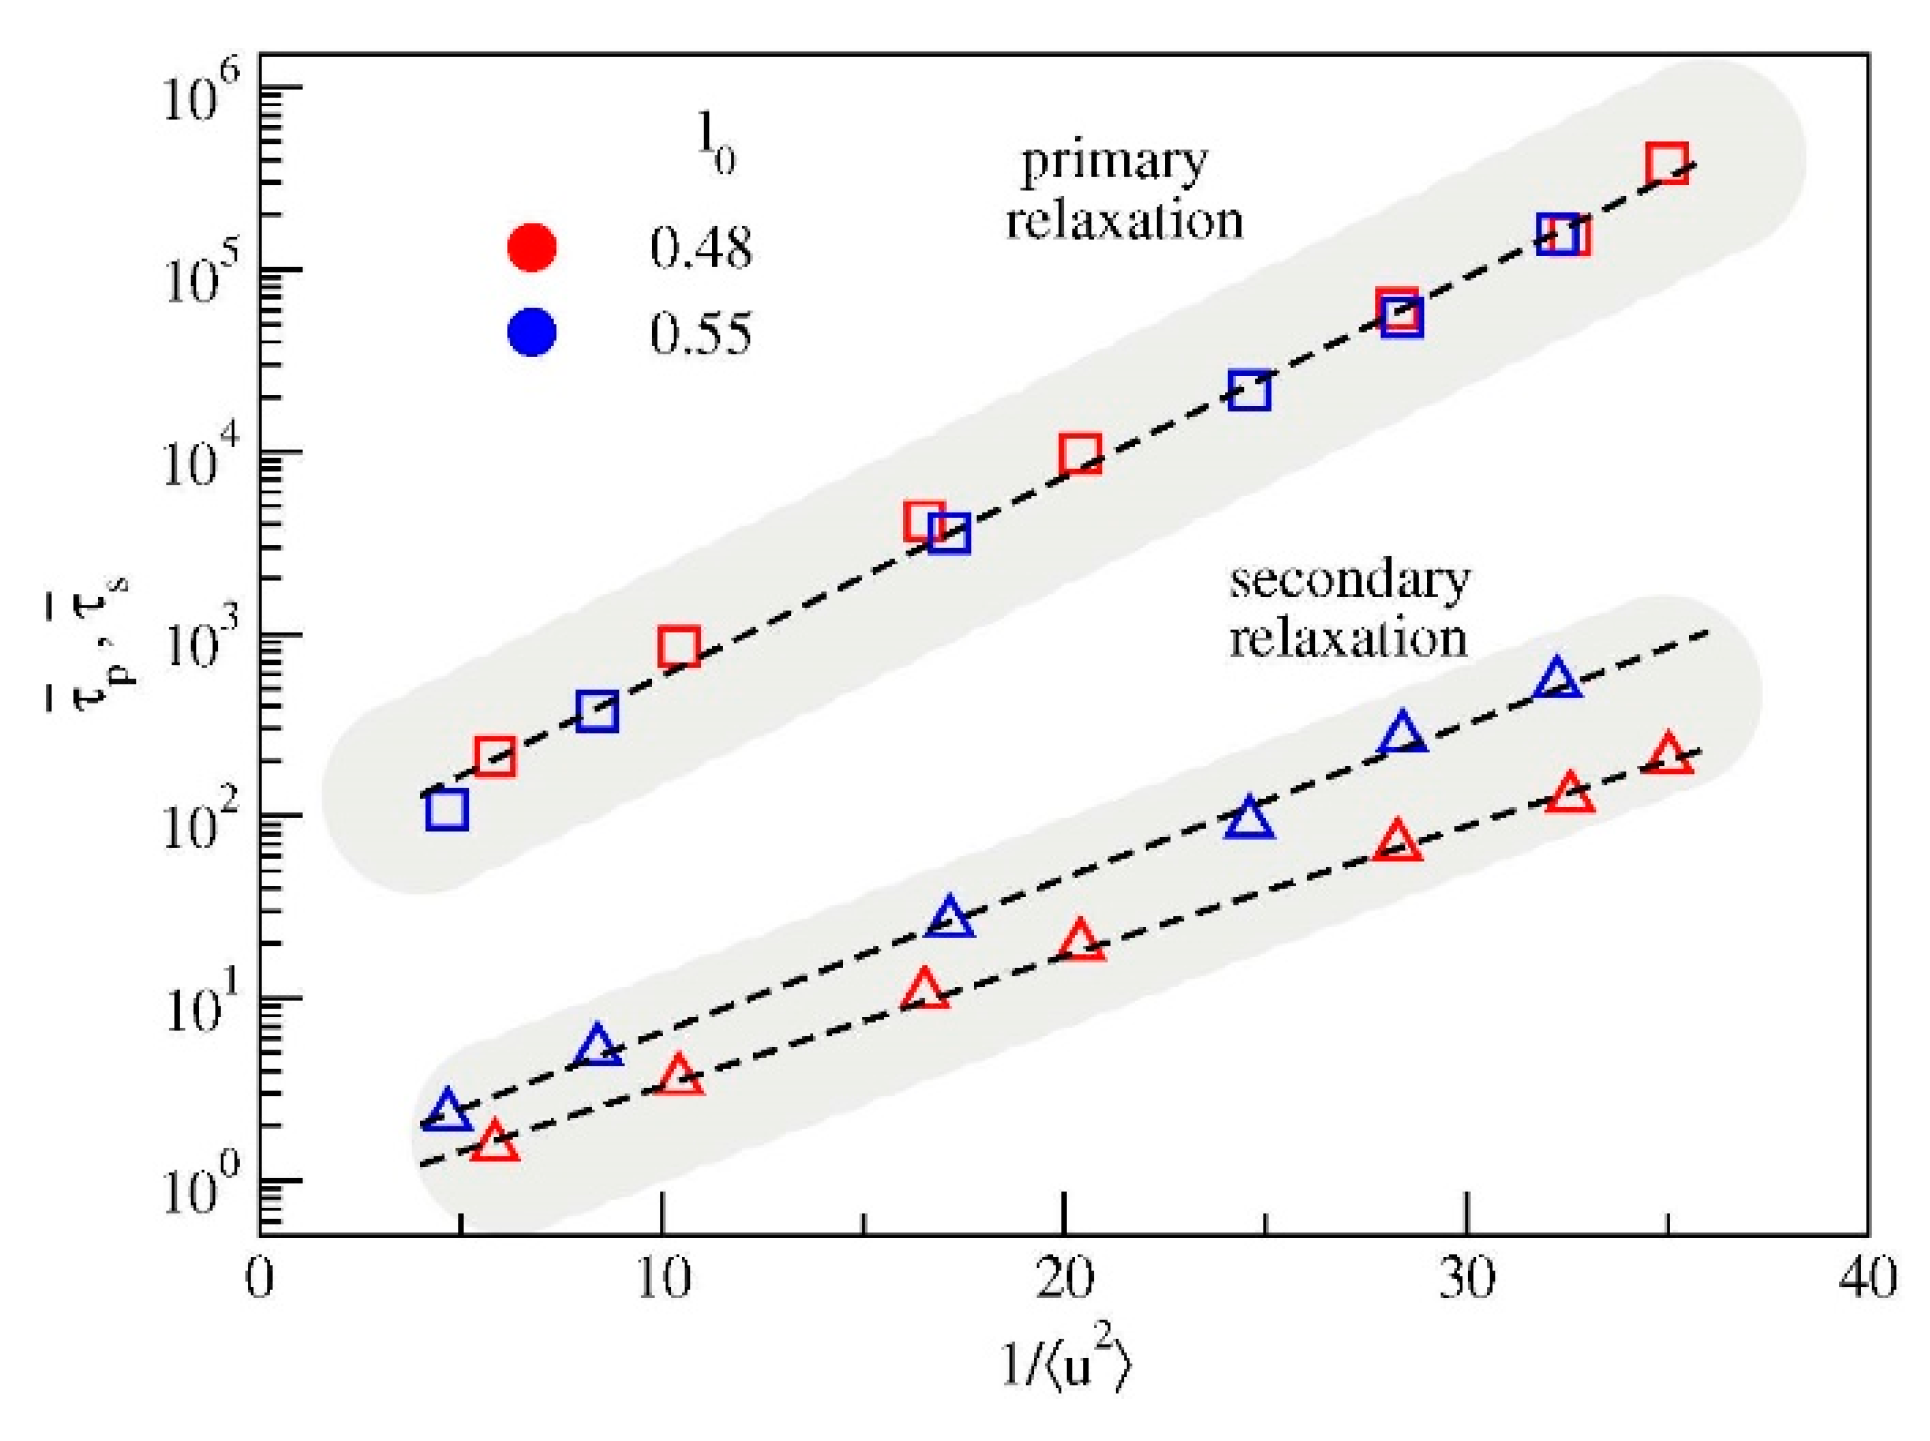
3.3. Cage Dynamics and Correlation with Primary and Secondary Relaxations

To identify a characteristic time-scale of the cage dynamics we consider the slope of MSD in the log-log representation
t log r 2 t log t
The slope ∆(t) is plotted in the insets of Figure 6. ∆(t) tends to 2 at very short times, due to the ballistic motion. Then, it drops to a minimum value signaling effective trapping in the cage. Later, ∆(t) increases—staying less than 1 due to the Rouse sub-diffusion—with a progressive approach to the unit value characterizing the diffusive regime. The minimum occurs at t * 1 independently of both the system and its physical state. It offers a convenient definition of the monomer Debye-Waller (DW) factor u 2 as the MSD at t * [11,12]:
u 2 r 2 t = t *
The position of u 2 is marked in Figure 6 with black circles. We remind that the DW factor provides a measure of the rattling motion of the monomer in the cage of the first neighbours. The temperature dependence of DW is reported in Figure 7. The dependence is not linear evidencing that, even at very short time scales, that is, t * 1 (corresponding to a few picoseconds [11], see also Reference [37]), the rattling of the monomer in the cage is not harmonic. Notably, the two systems exhibit different curves for u 2 . In particular, at fixed temperature the system with chains having longer bond length exhibits larger DW factor.
We are now in a position to test the correlation between the vibrational dynamics and the relaxation. Recently, this correlation has been examined in great detail as far as the primary relaxation is concerned [11]. It was found that numerical models not providing appreciable secondary relaxations exhibit striking agreement with experimental data of polymers where the presence of JG relaxation is known, like 1,4 Polybutadiene, Polyvinylchloride and Polymethylmethacrylate [4,6,7,38]. This finding needs clarification since the secondary relaxation acts at an intermediate time scale between the fast vibrational dynamics and the primary relaxation and it could, in principle, interfere with the correlation.
To address this aspect, Figure 8 plots the correlation between the average relaxation times and the DW factor. As major result of the present paper, it is clearly seen that the correlation between the fast vibrational dynamics and the primary relaxation is not affected by the presence of the secondary relaxation, in the sense that the data concerning the systems exhibiting either strong (l0 = 0.48) or weak (l0 = 0.55) secondary relaxation exhibit the same master correlation curve τ ¯ p   vs.   u 2 . Notably, this coincidence takes place even if the correlation curves τ ¯ s   vs.   u 2 do depend on the bond length.
It seems proper to comment on a feature of Figure 8. The correlation between the primary relaxation and the DW factor of distinct systems is usually seen in terms of the reduced DW factor u 2 / u g 2 to get rid of specific system-dependent aspects, u g 2 being the DW factor at the glass transition temperature [11]. Figure 8 shows that the correlation of the two systems under study is rather high by considering the unscaled DW factor. This suggests that, even if the glass transition of the two systems is different due to the different temperature dependence of the primary relaxation times, see Figure 5 (left), the DW factor at the glass transition of the two systems is equal within the errors.

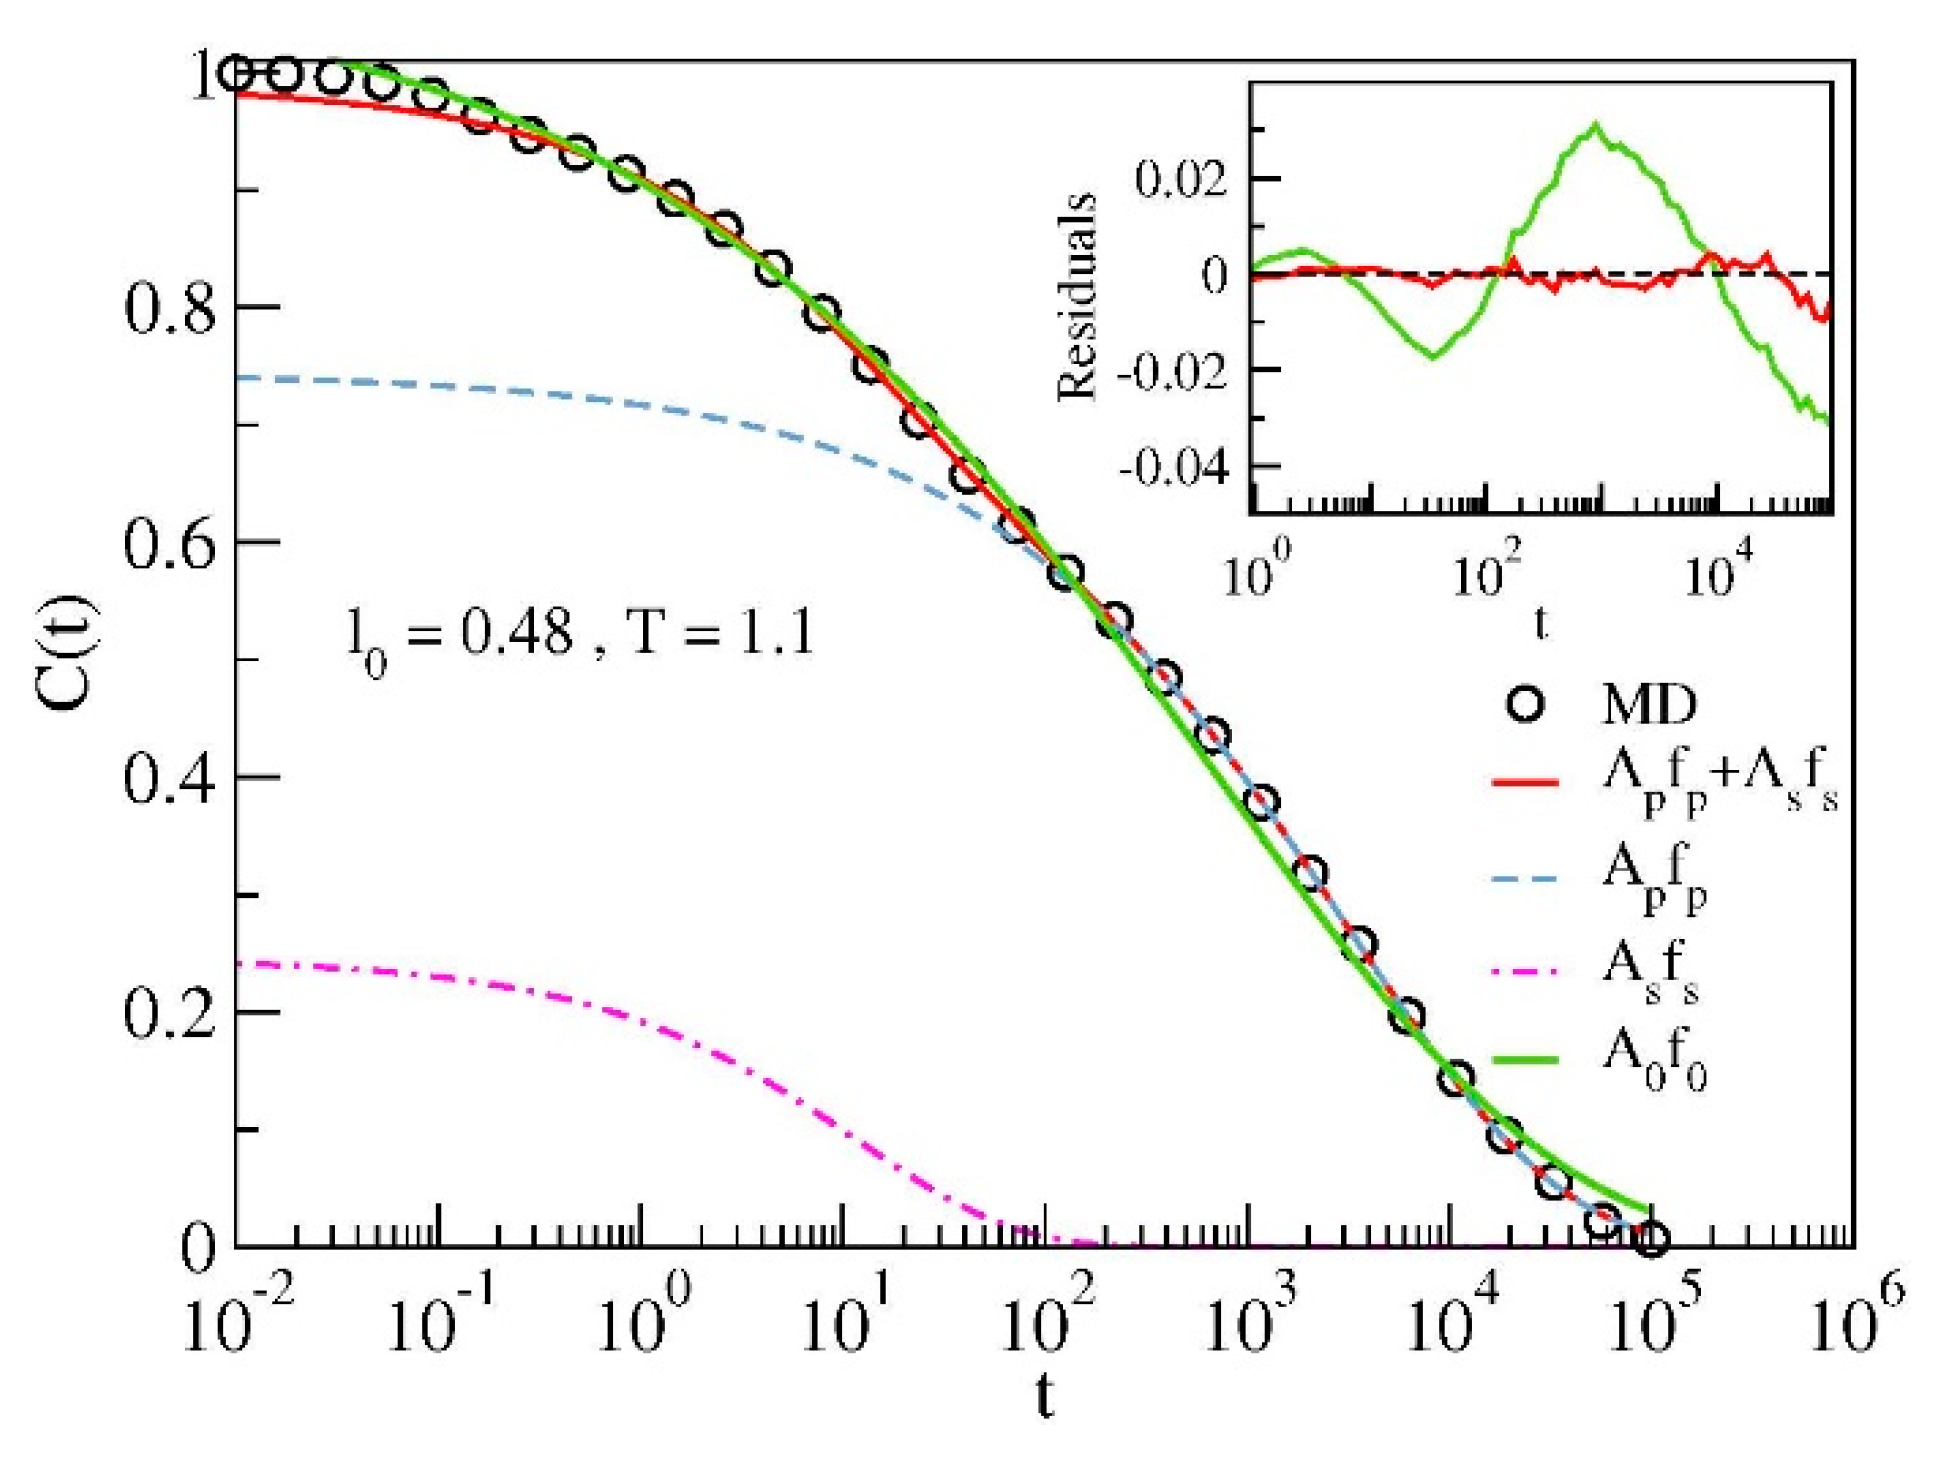
3.4. Alternative Probe Functions of Secondary Relaxation

The present study reveals the JG relaxation via the bond correlation function C(t), Equation (4). We pose the question of the JG sensitivity of alternative relaxation functions. We focus here on the familiar intermediate scattering function (ISF) [11,39] and the torsional autocorrelation function (TACF) [14]. ISF is defined as [11,39]:
F s q , t = 1 N i = 1 N e i q · x i t x i 0
In an isotropic liquid, ISF depends only on the modulus of the wavevector q = q and features the rearrangements of the spatial structure of the fluid over the length scale ∼2π/q. As alternative relaxation function, the segmental relaxation has been characterized by TACF [14]:
TACF t = 1 N c 1 M 3 n = 1 N c m = 1 M 3 | θ m , n t | | θ m , n 0 | | θ m , n 0 | 2 | θ m , n 0 | 2 | θ m , n 0 | 2
where θ m , n t is the modulus of the m-th dihedral angle of the n-th chain at a given time t [40].
Figure 9 compares the bond correlation function C(t), Equation (4), with ISF and TACF at the lowest investigated temperature (T = 0.85, where the primary and the JG relaxation are expected to have the largest separation). A distinctive feature of C(t) at that temperature is the presence of the step at t ~ 4 · 10 3 , signalling the secondary relaxation, see Figure 2, left. The step is clearly visible when C(t) drops ∼40% only. Figure 9, left, shows that the same step is also observed in TACF but when more than ∼90% of the decay has been completed. Namely, it is harder to be observed. Figure 9, right, plots ISF for different wavevectors in a range including q = qmax ∼ 2π/σ, corresponding to the maximum of the static structure factor. It is seen that there is no evidence of the two-step decay observed in the bond correlation function C(t) at the same temperature, see Figure 2, left. The results presented in Figure 9 are not unexpected. Previous MD studies [13] performed by using the same model of the present work (dubbed FRC model in Reference [13]) reported that ISF needs lower temperatures to reveal a two-step process in the relaxation. This suggests that ISF has lower JG resolution.
The ability to resolve in a limited time and temperature range both primary and secondary relaxation is related to their relative separation in time scale as well as relative strength. Concerning ISF, timescale separation is possible exploring high wavevector q, in order to be more sensitive to local and restricted dynamics, but the relative strength is also affected by this choice [41]. As recently shown [42], the microscopic density correlation function is dominated at short times by spatial fluctuations of some molecules within the cage formed by the nearest neighbours, that is, by rattling motions within the cage, while at longer times part of the relaxation strength is related to large spatial fluctuations extending at least up to the intermolecular distance, that is, outside the cage. The faster type of motion has been identified as the secondary, while the slower and more intense is the primary one. Timescale separation is usually larger for orientational dynamics, that entails for primary motions a much larger timescale than the intermediate scattering functions (as shown also in Figure 9). In contrast, for the secondary relaxation only local and fast rearrangements are probed by both observables (if the correct wavevector q is chosen). Again, C(t) is much more sensitive than ISF to the presence of secondary relaxation because the relative strength is dominant. Indeed, secondary processes are characterized by rare (but not negligible) and fast rearrangements, resulting in large-amplitude angle motions, which bring a considerable decorrelation of the orientation function [15]. For these reasons orientational correlation function is usually much more sensitive to detect and resolve secondary motions with respect to what happen for intermediate structure function or density autocorrelation function. This has been demonstrated by experiments and numerical simulation studies [43,44,45].

4. Conclusions

We have studied by MD simulations two melts of polymer chains with different bond length, resulting in rather different strength of the secondary JG relaxation. Our interest is the correlation between the fast vibrational dynamics, as sensed by the Debye-Waller factor, and the slow primary relaxation in the presence of JG relaxation. Multiple relaxation processes were searched by using the bond-orientation correlation function, C(t) which proved higher JG sensitivity with respect to alternatives provided by TACF and ISF functions. We find that changing the bond length alters both the strength and the relaxation time of the secondary relaxation, as well as the correlation with the DW factor. On the other hand, it leaves unaffected the correlation between the vibrational dynamics and the primary relaxation. This finding is in harmony with previous studies reporting that numerical models not showing secondary relaxations exhibit striking agreement with experimental data of polymers where the presence of JG relaxation is known [11].
The present result fits into the context of the recent debate about the universality of the correlation between fast and slow degrees of freedom. Actually, a relation between viscous flow and vibrational properties in glass-forming materials has been found in recent studies examining the fragility and the nonergodicity factor, as obtained from scattering techniques in the glassy state [46] and extrapolated to the glass transition region [47]. These two quantities were found strongly correlated only once the effect of secondary relaxation processes, if present, was correctly accounted for. With regards to this issue, it is noteworthy to mention that DW factor as defined in Equation (10) is the best definition of cage vibration amplitude, devoid of any further decorrelation due to JG relaxation.

Author Contributions

Conceptualization, A.T., F.P., S.C. and D.L.; methodology, validation, formal analysis, investigation, A.T., F.P. and D.L.; software, A.T. and F.P.; writing—review and editing, A.T., F.P., M.M., S.C. and D.L.; supervision, F.P. and D.L.; funding acquisition, S.C. and M.M. All authors have read and agreed to the published version of the manuscript.

Funding

This research was funded by University of Pisa grant number PRA-2018-34 (“ANISE”).

Acknowledgments

A generous grant of computing time from IT Center, University of Pisa and Dell EMC® Italia is gratefully acknowledged.

Conflicts of Interest

The authors declare no conflict of interest.

Abbreviations

ISFIntermediate scattering function
JGJohari-Goldstein
MDmolecular-dynamics
MSDMean square displacement
DWDebye-Waller

References

  1. Debenedetti, P.G. Metastable Liquids; Princeton University Press: Princeton, NJ, USA, 1997. [Google Scholar]
  2. McCrum, N.G.; Read, B.E.; Williams, G. Anelastic and Dielectric Effects in Polymeric Solids; Dover Publications: New York, NY, USA, 1991. [Google Scholar]
  3. Angell, C.A.; Ngai, K.L.; McKenna, G.B.; McMillan, P.; Martin, S.W. Relaxation in glassforming liquids and amorphous solids. J. Appl. Phys. 2000, 88, 3113–3157. [Google Scholar] [CrossRef] [Green Version]
  4. Ngai, K.L. Relaxation and Diffusion in Complex Systems; Springer: Berlin, Germany, 2011. [Google Scholar]
  5. Johari, G.P.; Goldstein, M. Viscous Liquids and the Glass Transition. II. Secondary Relaxations in Glasses of Rigid Molecules. J. Chem. Phys. 1970, 53, 2372. [Google Scholar] [CrossRef]
  6. Ngai, K. Relation between some secondary relaxations and the relaxations in glass-forming materials according to the coupling model. J. Chem. Phys. 1998, 109, 6982–6994. [Google Scholar] [CrossRef]
  7. Ngai, K.L.; Paluch, M. Classification of secondary relaxation in glass-formers based on dynamic properties. J. Chem. Phys. 2004, 120, 857–873. [Google Scholar] [CrossRef] [PubMed]
  8. Capaccioli, S.; Paluch, M.; Prevosto, D.; Wang, L.M.; Ngai, K.L. Many-Body Nature of Relaxation Processes in Glass-Forming Systems. J. Phys. Chem. Lett. 2012, 3, 735–743. [Google Scholar] [CrossRef]
  9. Cicerone, Q.Z.; Tyagi, M. Picosecond Dynamic Heterogeneity, Hopping, and Johari-Goldstein Relaxation in Glass-Forming Liquids. Phys. Rev. Lett. 2014, 113, 117801. [Google Scholar] [CrossRef] [Green Version]
  10. Yu, R.R.; Samwer, K. Structural rearrangements governing Johari-Goldstein relaxations in metallic glasses. Sci. Adv. 2017, 3, 1701577. [Google Scholar] [CrossRef] [Green Version]
  11. Larini, L.; Ottochian, A.; De Michele, C.; Leporini, D. Universal scaling between structural relaxation and vibrational dynamics in glass-forming liquids and polymers. Nat. Phys. 2008, 4, 42–45. [Google Scholar] [CrossRef]
  12. Puosi, F.; Tripodo, A.; Leporini, D. Fast Vibrational Modes and Slow Heterogeneous Dynamics in Polymers and Viscous Liquids. Int. J. Mol. Sci. 2019, 20, 5708. [Google Scholar] [CrossRef] [Green Version]
  13. Bedrov, D.; Smith, G.D. Molecular dynamics simulation study of the α and β-relaxation processes in a realistic model polymer. Phys. Rev. E 2005, 71, 050801. [Google Scholar] [CrossRef]
  14. Bedrov, D.; Smith, G.D. Secondary Johari–Goldstein relaxation in linear polymer melts represented by a simple bead-necklace model. J. Non-Crystal. Solids 2011, 357, 258–263. [Google Scholar] [CrossRef]
  15. Fragiadakis, D.; Roland, C.M. Participation in the Johari–Goldstein Process: Molecular Liquids versus Polymers. Macromolecules 2017, 50, 4039–4042. [Google Scholar] [CrossRef] [Green Version]
  16. Fragiadakis, D.; Roland, C.M. Molecular dynamics simulation of the Johari-Goldstein relaxation in a molecular liquid. Phys. Rev. E 2012, 86, 020501. [Google Scholar] [CrossRef] [PubMed] [Green Version]
  17. Larini, L.; Barbieri, A.; Prevosto, D.; Rolla, P.A.; Leporini, D. Equilibrated polyethylene single-molecule crystals: Molecular-dynamics simulations and analytic model of the global minimum of the free-energy landscape. J. Phys. Condens. Matter 2005, 17, L199–L208. [Google Scholar] [CrossRef]
  18. Plimpton, S. Fast Parallel Algorithms for Short-Range Molecular Dynamics. J. Comput. Phys. 1995, 117, 1–19. [Google Scholar] [CrossRef] [Green Version]
  19. Lammps. Available online: http://lammps.sandia.gov (accessed on 26 February 2020).
  20. Prevosto, D.; Capaccioli, S.; Lucchesi, M.; Leporini, D.; Rolla, P. Pressure and temperature dependence of structural relaxation dynamics in polymers: A thermodynamic interpretation. J. Phys. Condens. Matter 2004, 16, 6597–6608. [Google Scholar] [CrossRef] [Green Version]
  21. Doi, M.; Edwards, S.F. The Theory of Polymer Dynamics; Clarendon Press: Oxford, UK, 1988. [Google Scholar]
  22. Giordano, M.; Leporini, D.; Martinelli, M.; Pardi, L.; Santucci, S.; Umeton, C. Nonlinear electron spin resonance techniques for the study of inhomogeneously broadened spectra. J. Chem. Phys. 1988, 88, 607–616. [Google Scholar] [CrossRef]
  23. Andreozzi, L.; Giordano, M.; Leporini, D. Efficient characterization of the orientational ordering of ESR-active probes in supermolecular fluids. Appl. Magn. Reson. 1993, 4, 279–295. [Google Scholar] [CrossRef]
  24. Leporini, D. Relationship between a nonlinear response and relaxation induced by colored noise. Phys. Rev. A 1994, 49, 992–1014. [Google Scholar] [CrossRef]
  25. Andreozzi, L.; Giordano, M.; Leporini, D. Linear and non-linear electron spin resonance study of the rotational diffusion of a molecular tracer in supercooled o-terphenyl. J. Non-Cryst. Solids 1998, 235, 219–224. [Google Scholar] [CrossRef]
  26. Andreozzi, L.; Faetti, M.; Giordano, M.; Leporini, D. Scaling between the rotational diffusion of tracers and the relaxation of polymers and glass formers. J.Phys. Condens. Matter 1999, 11, A131–A137. [Google Scholar] [CrossRef]
  27. Andreozzi, L.; Faetti, M.; Giordano, M.; Leporini, D. Scaling of the Rotational Relaxation of Tracers in o-Terphenyl: A Linear and Nonlinear ESR Study. J. Phys. Chem. B 1999, 103, 4097–4103. [Google Scholar] [CrossRef]
  28. Barbieri, A.; Gorini, G.; Leporini, D. Role of the density in the crossover region of o-terphenyl and poly(vinyl acetate). Phys. Rev. E 2004, 69, 061509. [Google Scholar] [CrossRef] [PubMed] [Green Version]
  29. Barbieri, A.; Campani, E.; Capaccioli, S.; Leporini, D. Molecular dynamics study of the thermal and the density effects on the local and the large-scale motion of polymer melts: Scaling properties and dielectric relaxation. J. Chem. Phys. 2004, 120, 437–453. [Google Scholar] [CrossRef] [Green Version]
  30. Smith, G.D.; Bedrov, D. A molecular dynamics simulation study of the α- and β-relaxation processes in 1,4-polybutadiene. J. Non-Crystal. Solids 2006, 352, 4690–4695. [Google Scholar] [CrossRef]
  31. Fragiadakis, D.; Roland, C.M. Chain Flexibility and the Segmental Dynamics of Polymers. J. Phys. Chem. B 2019, 123, 5930–5934. [Google Scholar] [CrossRef]
  32. Zorn, R.; Arbe, A.; Colmenero, J.; Frick, B.; Richter, D.; Buchenau, U. Neutron scattering study of the picosecond dynamics of polybutadiene and polyisoprene. Phys. Rev. E 1995, 52, 781–795. [Google Scholar] [CrossRef]
  33. Gupta, S.; Mamontov, E.; Jalarvo, N.; Stingaciu, L.; Ohl, M. Characteristic length scales of the secondary relaxations in glass-forming glycerol. Eur. Phys. J. E 2016, 39, 40. [Google Scholar] [CrossRef] [Green Version]
  34. Hilfer, R. Analytical representations for relaxation functions of glasses. J. Non-Crystal. Solids 2002, 305, 122–126. [Google Scholar] [CrossRef] [Green Version]
  35. Pardo, L.C.; Lunkenheimer, P.; Loidl, A. Dielectric spectroscopy in benzophenone: The beta relaxation and its relation to the mode-coupling Cole-Cole peak. Phys. Rev. E 2007, 76, 030502. [Google Scholar] [CrossRef] [Green Version]
  36. Angell, C. Relaxation in liquids, polymers and plastic crystals-strong/fragile patterns and problems. J. Non-Crystal. Sol. 1991, 131, 13–31. [Google Scholar] [CrossRef]
  37. Ottochian, A.; Leporini, D. Scaling between structural relaxation and caged dynamics in Ca0.4K0.6(NO3)1.4 and glycerol: Free volume, time scales and implications for the pressure-energy correlations. Philosophical Magazine 2011, 91, 1786–1795. [Google Scholar] [CrossRef] [Green Version]
  38. Arbe, A.; Buchenau, U.; Willner, L.; Richter, D.; Farago, B.; Colmenero, J. Study of the Dynamic Structure Factor in the β Relaxation Regime of Polybutadiene. Phys. Rev. Lett. 1996, 76, 1872–1875. [Google Scholar] [CrossRef] [PubMed]
  39. Hansen, J.P.; McDonald, I.R. Theory of Simple Liquids, 3rd ed.; Academic Press: Cambridge, MA, USA, 2006. [Google Scholar]
  40. Kremer, K.; Grest, G.S.; Carmesin, I. Crossover from Rouse to Reptation Dynamics: A Molecular-Dynamics Simulation. Phys. Rev. Lett. 1988, 61, 566–569. [Google Scholar] [CrossRef]
  41. Arbe, A.; Richter, D.; Colmenero, J.; Farago, B. Merging of the α and β relaxations in polybutadiene: A neutron spin echo and dielectric study. Phys. Rev. E 1996, 54, 3853–3869. [Google Scholar] [CrossRef] [PubMed]
  42. Caporaletti, F.; Capaccioli, S.; Valenti, S.; Mikolasek, M.; Chumakov, A.I.; Monaco, G. A microscopic look at the Johari-Goldstein relaxation in a hydrogen-bonded glass-former. Sci. Rep. 2019, 9, 14319. [Google Scholar] [CrossRef] [Green Version]
  43. Richter, D.; Monkenbusch, M.; Arbe, A.; Colmenero, J.; Farago, B. Dynamic structure factors due to relaxation processes in glass-forming polymers. Phys. B: Condensed Matter 1997, 241, 1005–1012. [Google Scholar] [CrossRef]
  44. Tölle, A. Neutron scattering studies of the model glass former ortho-terphenyl. Rep. Prog. Phys. 2001, 64, 1473–1532. [Google Scholar] [CrossRef] [Green Version]
  45. Fragiadakis, D.; Roland, C.M. Dynamic correlations and heterogeneity in the primary and secondary relaxations of a model molecular liquid. Phys. Rev. E 2014, 89, 052304. [Google Scholar] [CrossRef] [Green Version]
  46. Scopigno, T.; Ruocco, G.; Sette, F.; Monaco, G. Is the Fragility of a Liquid Embedded in the Properties of Its Glass? Science 2003, 302, 849–852. [Google Scholar] [CrossRef] [Green Version]
  47. Scopigno, D.C.; Ruocco, G. Universal relation between viscous flow and fast dynamics in glass-forming materials. Phys. Rev. B 2010, 81, 100202. [Google Scholar] [CrossRef] [Green Version]
Figure 1. Pictorial view of the two kind of polymeric chains under consideration. L0 denotes the bond length. The time axis signal, in a qualitative way, the location of the dynamical processes of interest. The size of the dot of the secondary relaxation is proportional to the strength of the relaxation. The exact definition of the symbols is given in Section 3.
Polymers 12 00761 g001
Figure 2. Temperature dependence of the bond correlation function of the chains with different bond length. If l0 = 0.48, a two-step decay—evidencing two distinct relaxations—is observed.
Polymers 12 00761 g002
Figure 3. Illustrative example of the best-fit results via the double-relaxation function Equation (5). The best-fit with the single-relaxation function A0 f0 with f0 in the form of Equation (6) is also shown. Inset: residuals of the best-fit with the double- and single- relaxation functions.
Polymers 12 00761 g003
Figure 4. Plots of the temperature dependence of the best-fit parameters by using Equation (5) and Equation (6) (color codes as in Figure 1). From left to right: apparent relaxation times, relaxation strengths and stretching exponents.
Polymers 12 00761 g004
Figure 5. Arrhenius plots of the average relaxation times of the primary ( τ ¯ p , left) and secondary ( τ ¯ s , right) relaxations. Color code as in Figure 1.
Polymers 12 00761 g005
Figure 6. Monomer mean square displacement (MSD) of the two polymer melts with chains having bond lengths l0 = 0.48 (left) and l0 = 0.55 (right). Inset: corresponding MSD slope ∆(t), Equation (9). The vertical dashed lines mark the time t* ≈ 1 where ∆(t) reaches the minimum, locating the time where caging is more effective. t* is found to independent of both the system and its physical state. The black circles indicate the values of u 2 , Equation (10).
Polymers 12 00761 g006
Figure 7. Temperature dependence of the Debye-Waller factor u 2 . Color code as in Figure 1.
Polymers 12 00761 g007
Figure 8. Average relaxation times τ ¯ p and τ ¯ s versus the inverse Debye-Waller factor. The correlation between the vibrational dynamics and the primary relaxation time τ ¯ p is unaffected by the changes of both the strength and the relaxation time of the secondary relaxation, see Figure 4. Color code as in Figure 1.
Polymers 12 00761 g008
Figure 9. Left: comparison between the torsional autocorrelation function (TACF) and the bond-orientation correlation function, C(t) for the system with stronger secondary relaxation (l0 = 0.48) at the lowest investigated temperature (T = 0.85). Notice the step observed in both functions at t ~ 4 · 10 3 , signalling the secondary relaxation, see Figure 2, left. The step is much more apparent in C(t), occurring when the latter is dropped of ∼40% only. The same feature is observed in TACF when more than 90% of the decay has been completed. Right: corresponding intermediate scattering function (ISF) for different wavevectors in a range including q = qmax, corresponding to the maximum of the static structure factor. No apparent two-step decay is seen.
Polymers 12 00761 g009

