Article

Preparation and Properties of Stereocomplex of Poly(lactic acid) and Its Amphiphilic Copolymers Containing Glucose Groups

College of Chemical Engineering, Nanjing Forestry University, Nanjing 210037, China
*
Author to whom correspondence should be addressed.
Polymers 2020, 12(4), 760; https://doi.org/10.3390/polym12040760
Submission received: 20 February 2020 / Revised: 22 March 2020 / Accepted: 26 March 2020 / Published: 31 March 2020

Abstract

:
The stereocomplex of poly(lactic acid) containing glucose groups (sc-PLAG) was prepared by solution blending from equal amounts of poly(l-lactic acid) (PLLA) and poly(d-lactic acid-co-glucose) (PDLAG), which were synthesized from l- and d-lactic acid and glucose by melt polycondensation. The methods, including 1H nuclear magnetic resonance spectroscopy (1H NMR), gel permeation chromatography (GPC), differential scanning calorimetry (DSC), X-ray diffraction (XRD), fourier transform infrared spectroscopy (FT-IR), thermogravimetric analysis (TGA), polarizing microscope (POM), scanning electron microscope (SEM), transmission electron microscope (TEM), and contact angle were used to determine the effects of the stereocomplexation of enantiomeric poly(lactic acid) (PLA) units, the amphiphilicity due to glucose residues and lactic acid units, and the interaction of glucose residues with lactic units on the crystallization performance, hydrophilicity, thermal stability, and morphology of samples. The results showed PDLAG was multi-armed, and partial OH groups of glucose residues in PDLAG might remain unreacted. The molecular weight (Mw), dispersity (Ɖ), and glucose proportion in the chain of PDLAG thereby had significant effects on sc-PLAG. There were the stereocomplexation of enantiomeric lactic units and the amphiphilic self-assembly of PDLAG in sc-PLAG, which resulted in glucose groups mainly in the surface phase and lactic units in the bulk phase. The sc-PLAG only possessed the stereocomplex crystal owing to the interaction between nearly equimolar of l-lactic units of PLLA and d-lactic units of PDLAG, and had no homo-crystallites of l- or d-lactic units, which improved the melting temperature (Tm) of sc-PLAG about 50 °C higher than that of PLLA. Glucose groups in sc-PLAG played an important role by forming heterogeneous nucleation, promoting amphiphilic self-assembly, and affecting the ordered arrangement of lactic units. The glass transition temperature (Tg), the melting temperature (Tm), crystallinity, crystallization rate, and water absorption of sc-PLAG showed similar changes with the increased glucose content in feeding. All these parameters increased at first, and the maximum appeared as glucose content in feeding about 2%, such as the maximum crystallinity of 48.8% and the maximum water absorption ratio being 11.7%. When glucose content in feeding continued increasing, all these performances showed a downward trend due to the decrease of arrangement regularity of lactic acid chains caused by glucose groups. Moreover, the contact angle of sc-PLAG decreased gradually with the increased glucose content in feeding to obtain the minimum 77.5° as the glucose content in feeding being 5%, while that of PLLA was 85.0°. The sc-PLAG possessed a regular microsphere structure, and its microspheres with a diameter of about 200 nm could be observed. In conclusion, sc-PLAG containing proper glucose amount could effectively enhance the crystallinity, hydrophilicity, and thermal stability of PLA material, which is useful for drug delivery, a scaffold for tissue engineering, and other applications of biomedicine.

1. Introduction

Poly(lactic acid) (PLA), as an environmentally friendly thermoplastic polyester with excellent reproducibility of raw materials, good biocompatibility, biodegradability [1,2,3,4], and nontoxicity to the human body [5,6], is widely used in tissue engineering, drug controlled release, and packaging materials [7,8,9,10], whereas its poor thermal stability, slow crystallization rate, high crystallinity, and poor hydrophilicity confine its application scope [11,12,13]. To overcome the mentioned shortcomings, the performance of PLA materials can be improved through physical blending [14,15], copolymerization [16,17,18], the addition of a nucleation agent [19], and preparation of nanoparticle [20,21,22].
In order to improve the thermal properties of PLA materials, the two optical isomers of PLA, poly(l-lactic acid) (PLLA), and poly(d-lactic acid) (PDLA) are usually mixed to prepare the stereocomplex of poly(lactic acid) (sc-PLA). The sc-PLA with stereocomplex crystal structure may significantly boost the thermal stability of PLA, and its melting temperature (Tm) is about 50 °C higher than that of the neat PLLA [8,23]. Moreover, because PLLA with high molecular weight (Mw) and PDLA with high Mw usually cannot mix well, they cannot completely form the stereocomplex crystal structure (SC), and some homo-crystallites (HC) may form meanwhile. PLA grafted with cellulose could result in low melting temperature, good biocompatibility [24], and less hydrophobicity [10,25]. Glucose, as the most common monosaccharide in nature, is well-known for its extensive sources, low price, nontoxicity, and high hydrophilicity, etc. Glucose possessing five hydroxyl groups is easily modified with PLA by blending [14,26] or copolymerization [27]. Because of its advantages, such as low cost, simple technology, and convenient operation, the direct polycondensation may be used to prepare PLA and its copolymers, and the obtained PLA usually has low molecular weights [28]. Luo et al. [29] used glucose (Glu) and l-lactic acid (LLA) as starting material to synthesize poly(l-lactic acid-co-glucose) via melt polymerization at different molar feed ratios (n(l-LA ):n(Glu) being more than 50:1). The obtained copolymer was multi-armed with LLA chains, but the number and the length of LLA arms were not discussed clearly. The Mw of all copolymers was less than 5900 Da, and all dispersity (Ɖ) values (Mw/Mn) were less than 2. PLA with low Mw is liable to copolymerize with sugars, while it or its copolymers are easy to form perfect SC structure when blended. Cao et al. [30] synthesized two kinds of copolymers, such as poly(l-lactic acid-co-glucose) (PLLAG) and poly(d-lactic acid-co-glucose) (PDLAG), by melt polymerization with d-lactic acid, LLA, and glucose as raw materials. The Mw of PLLAG and PDLAG was about 15,000–20,600 with Ɖ value less than 2. Then, the stereocomplex of PLLAG and PDLAG was prepared by solution blending method. The ratios of PLLAG to PDLAG and glucose content in feeding had significant impacts on stereocomplex properties. These modifications of PLA are conducive to the performance improvement of PLA materials, which is one focus of contemporary green chemistry [31,32].
In this paper, we discussed the melt copolycondensation of lactic acid with glucose and the stereocomplex of PLLAG and PDLAG, in the light of our previous study [30]. We attempted to improve the comprehensive performances of PLLA materials by modifying linear PLLA homopolymer with multi-armed PDLAG through stereocomplexation of enantiomeric poly(lactic acid) units and the effect of amphiphilicity due to glucose residues and lactic acid units. PDLAG was prepared from d-lactic acid and glucose by melt polycondensation, while PLLA was prepared from l-lactic acid. Then, PLLA and PDLAG were mixed by solution blending to obtain the stereocomplex of PLLA and PDLAG (sc-PLAG—stereocomplex of poly(lactic acid) containing glucose groups). The glucose groups existing in the stereocomplex sc-PLAG could improve the hydrophilic performance of sc-PLAG. The effect of glucose groups on the preparation of sc-PLAG and the influence of glucose content in feeding on sc-PLAG were investigated so as to enhance the thermal stability, crystallization, and hydrophilic performance of poly(lactic acid) materials.

2. Materials and Methods

2.1. Materials

l-lactic acid and d-lactic acid (AR, 90%, MUSASHINO CHEMICAL (CHINA) CO., LTD. Yichun, China), anhydrous glucose (AR, Sinopharm Chemical Reagent Co., Ltd. Shanghai, China), stannous chloride (SnCl2) (AR, Shanghai Jiuyi Chemical Reagent Co., Ltd. Shanghai, China), p-toluenesulfonic acid (TSA) (AR, Shanghai Lingfeng Chemical Reagent Co., Ltd. Shanghai, China), methanol (AR, Nanjing Chemical Reagent Co., Ltd. Nanjing, China), and trichloromethane (AR, Shanghai Pilot Chemical Corporation, Shanghai, China) were all analytical reagents available in the market.

2.2. Characterization Methods

DRX2500 1H-NMR (Bruker Byerspin, Flanders, Switzerland) was used to record the 1H-NMR spectrum of PDLAG with CDCl3 as the solvent and tetramethylsilane (TMS) as the internal standard, and the chemical shift of chloroform (δ) was 7.26 as a reference. FT-ITIR-360 Infrared Spectrometer (Thermo Nicolet Corporation, Beijing, China) was used to determine the infrared spectra of samples, KBr tabletting, scanning range being from 400 to 4500 cm−1. Agilent 1100 gel permeation chromatography (Agilent Technologies (China) Co., Ltd. Beijing, China) was utilized to measure the molecular weight (Mw) of PLLA and PDLAG, and tetrahydrofuran (THF) was used as the mobile phase to dissolve the sample in THF at a concentration of 1 mg/mL with a flow rate of 1 mL/min and an injection volume of 20 μL. The thermal performance of samples was measured by the DSC-200F3 differential scanning calorimeter (NETZSCH-Gerätebau GmbH, Selb, Germany). The test temperature range was 10–250 °C under the protection of N2 airflow, and the heating rate was 10 °C/ min. The crystallinity was calculated by Proteus Analysis software (NETZSCH-Gerätebau GmbH, Selb, Germany). X-ray diffraction (XRD) analysis was carried out on a Rigaku D/max-Ra X-ray diffractometer (Riaku Corporation, Tokyo, Japan) with Cu-Kα radiation (λ = 0.154 nm), 40 kV voltage, and electric current 30 mA. The range of 2θ was from 5° to 40° at a scan rate of 5°/min. Q5000 thermogravimetric analyzer was used to determine the TGA curve of polymers with the temperature range from 20 to 600 °C at the heating rate of 10 °C/min and the flow rate of N2 of 10 mL/min. The contact angles were characterized by the FACECA-D contact angle meter (Japan Concorde co., LTD, Tokyo, Japan). The granular samples were melted and compressed to be molded into a film for the characterization. The measurement time of each point was 10 s, and the contact angle was the average value of five measurements. Transmission electron microscope (TEM) images were recorded by a JEM-1400 transmission electron microscope (Nippon electronics co., LTD, Tokyo, Japan). The sample was dispersed in ethanol solvent, treated by ultrasonic for 10 min. Then, a 1 μL sample solution drawn by a sampler was added to the copper mesh containing a carbon layer and dried at room temperature. The crystal morphology was investigated by the ECLIPSE polarizing microscope (Nikon Corporation, Tokyo, Japan). The morphology of sc-PLAG powders and sections was observed by Quanta 200 scanning electron microscope (SEM) (USA FEI, Hillsboro, Oregon, USA). The granular samples were melted and compressed to be molded into the film, and then the obtained films were soaked into distilled water for 24 h at 37 ± 0.5 °C. The added weight of sheet samples was weighed and divided by the weight of dried samples to get the water absorption ratio.

2.3. Synthesis of Poly(l-lactic acid)

A certain mass of l-lactic acid was weighed and added to a three-necked flask, which was heated up to 150 °C under normal pressure for 1 h, then decompressed to −0.08 MPa and reacted under this pressure for 4 h. Then, the catalyst containing stannous chloride and p-toluenesulfonic acid (the molar ratio of the two compounds being 1:1) was added to the flask. The catalyst amount was 0.5 wt% of the total mass of l-lactic acid. The reactor was heated up to 170 °C, and the reaction continued under a complete vacuum for 8 h. Then, the product was dissolved in trichloromethane and precipitated by methanol excess. The separated precipitates were dried in a vacuum for 10 h at 50 °C to obtain PLLA samples. The synthetic route of PLLA is shown in Scheme 1.

2.4. Synthesis of Poly(d-lactic acid-co-glucose) Copolymer

A certain amount of glucose and d-lactic acid was weighed and added to a three-necked flask, which was heated up to 150 °C under normal pressure for 1 h, then decompressed to −0.08 MPa and reacted under this pressure for 4 h. Then, the catalyst containing SnCl2 and TSA (the molar ratio of the two compounds being 1:1) was added to the flask. The catalyst amount was 0.5 wt% of the total mass of d-lactic acid and glucose. The reactor was heated up to 170 °C, and the reaction continued under a complete vacuum for 6–8 h. Then, the product was dissolved in trichloromethane and precipitated by methanol excess. The separated precipitates were dried in vacuum at 50 °C for 10 h to obtain poly(d-lactic acid-co-glucose) copolymer (PDLAG). The glucose content in the feeding of PDLAG samples was correspondingly expressed by the mass percentage of glucose to d-lactic acid in raw materials. So, the copolymer PDLAG obtained when the mass percentage of glucose in raw materials was 5% was named as PDLAG-5%. The other PDLAG samples were labeled with the same method. The glucose content in the feeding of the PDLA sample was 0%. The synthetic route of PDLAG is shown in Scheme 2.

2.5. Preparation of Stereocomplex of Poly(lactic acid) with Glucose Groups

PLLA and PDLAG with different glucose content in feeding were dissolved in trichloromethane, respectively, to prepare solutions with a 10% mass fraction. After evenly mixing equal amounts of PLLA and PDLAG solutions at room temperature, the mixture solution removed solvent by heating in the water bath at 50 °C for 10 h under atmospheric pressure and then dried at 50 °C under vacuum for 10 h to obtain the stereocomplex of poly(lactic acid) containing glucose groups, namely sc-PLAG.

3. Results and Discussion

3.1. Characterization of PDLAG

Poly(d-lactic acid-co-glucose) with glucose content in the feeding of 5 wt% was used as an example to perform the structural characterization of PDLAGs by FTIR and 1H-NMR (Figure 1). The FTIR curve showed the strong absorption of ester carbonyl at 1750 cm−1 and the characteristic absorptions of glucose group at 870 and 755 cm−1. The 1H-NMR spectrum showed -CH2 from glycosyl (Hc, Scheme 2) at 4.27–4.34 ppm and –CH from glycosyl (Hh, Scheme 2) at 5.96 ppm. 1H-NMR also showed -CH from repeat PDLA units (Ha, Scheme 2) at 5.15–5.22 ppm and –CH from the DLA end group (Ha’, Scheme 2) at 4.35–4.40 ppm. The ratio of the integral area of Ha’ to that of glycosyl Hh could be calculated to stand for the number of grafted PDLA chains on a glucose group. The ratio of Ha’ to Hh was more than 4, which meant that there were more than four PDLA chains linked to glucose residue. Namely, PDLAG could be multi-armed other than linear, and partial OH groups of glucose in PDLAG could be unreacted. The glycosyl with unreacted OH, together with the OH end group in a short DLA unit linked to it, was hydrophilic, and DLA chains were hydrophobic. So, PDLAG was amphiphilic. The results of FTIR and 1H-NMR indicated that the obtained PDLAGs were copolymers, and the glycosyl units were incorporated in PDLA backbones.
The Mn, Mw, and Ɖ of PLLA and PDLAG were measured by GPC, and the results are shown in Table 1. All GPC flow curves of PDLAG samples had only a single symmetrical peak, and all Ɖ values were less than 2, which indicated that the melt polycondensation of d-lactic acid and glucose indeed only gave the copolymer. The molecular weights of PDLAG were similar to that of PLLA, but Ɖ values of PDLAG were less than that of PLLA. With increasing glucose content in feeding, the molecular weights of PDLAG decreased first, reached to the lowest as glucose content in feeding being 2% (i.e., PDLAG-2%), and then increased gradually. Moreover, the Ɖ values of PDLAG increased with increasing glucose content in feeding. The molecular weight and Ɖ of PDLAG-5% were the highest. PDLAG-2% with lowest Mw and Ɖ about 1.90 could possess shorter chains, which could move easier when blending with PLLA. Moreover, the glucose proportion in PDLAG depended on the Mw of PDLAG, and PDLAG with high Mw had a low glucose proportion. The glucose proportion in PDLAG was calculated by the ratio of the Mw of glucose units to the Mw of the corresponding PDLAG and are listed in Table 1. With increasing glucose contents in feeding, the Mw of PDLAG might lessen, but the Ɖ values increased. Thus, PDLAG-2% had the lowest Mw, leading to the highest glucose proportion in the chain. As glucose contents in feeding continued increasing, the percentage of low-Mw PDLAG would rise. Moreover, the fairly low-Mw PDLAG fractions could dissolve in the mixture of trichloromethane and methanol and be removed from the products. The high-Mw PDLAG fractions were left during purification. Thus, the Mw of PDLAG-4% and PDLAG-5% gradually increased, but their glucose proportions were lessened, even less than the glucose content in feeding. Moreover, PDLAG-5% possessed the highest Mw, highest Ɖ values, and the lowest glucose proportion in the PDLAG chain.

3.2. DSC Analysis of sc-PLAG Thermal Properties and Crystal Structure

In order to analyze the effects of stereocomplexation and amphiphilicity on sc-PLAG, the DSC method was used to investigate the thermal properties and crystal structure of sc-PLAG [33]. All sc-PLAG samples were prepared by mixing the equal mass ratio of PLLA and PDLAG with different glucose content in feeding. The sc-PLAG sample prepared from PLLA and PDLAG-5% was named as sc-PLAG-5%, i.e., its glucose content in feeding was 5%. The other sc-PLAG samples were labeled with the same method. Because the contents of glucose residues in PDLAG were very low, l-lactic acid units in PLLA could be considered to be equimolar to d-lactic acid units in PDLAG regardless of glucose groups in sc-PLAG. Figure 2 shows the DSC curves of PLLA, PDLAG, and sc-PLAG samples with different glucose content in feeding. The crystallinity of both PLLA and PDLAG samples was calculated by the percentage of sample melting enthalpy and the melting enthalpy of PLA with the crystallinity of 100% (93.6 J/g). The crystallinity of sc-PLAG was calculated by the percentage of sample melting enthalpy and the melting enthalpy of sc-PLA with the crystallinity of 100% (142 J/g) [33,34]. The obtained transition temperature (Tg), Tm, and crystallinity are summarized in Table 2. The data of other PDLAG samples by DSC are also listed in Table 2 in order to compare with sc-PLAG. According to Figure 2 and Table 2, PLLA had the Tm of 147.9 °C due to HC formed by l-lactic units [35], while PDLAG-5% also could form HC formed by d-lactic units, and its Tm was 133.1 °C. Compared with PLLA, the Tg, Tm, and crystallinity of PDLAG significantly decreased, indicating that glucose groups in PDLAG chains weakened the thermal stability and crystallization performance of d-lactic units. The interaction between glucose residues and d-lactic acid units would result in glucose residues involved in crystallization, decreasing the crystal perfection and crystallinity of PDLAG. The glucose residues leading to the multi-armed structure of PDLAG and more end groups in PDLAG would reduce chain regularity and decrease the crystal perfection and crystallinity of PDLAG. Moreover, low Ɖ and high molecular weight of PDLAG would be conducive to crystallization. Thus, less glucose proportion in the chain, high Mw, and good chain regularity of PDLAG would increase the Tm of PDLAG samples. Because of the comprehensive effect of these factors, the Tm and crystallinity of PDLAG were less than those of PLLA and varied with increasing glucose content in feeding. That is the glucose content in feeding affected the molecular weights, Ɖ values of PDLAG, and glucose proportions in PDLAG. PDLAG-2% had the smallest Tm, mainly owing to its lowest Mw and highest glucose proportion in PDLAG. On the other hand, PDLAG-0.5% had the highest Tm, mainly due to its lowest Ɖ along with relatively high Mw, and the lowest glucose proportion in PDLAG.
When equimolar PLLA and PDLAG with different glucose content in feeding were blended to obtain sc-PLAG, all sc-PLAG samples only had one Tm more than 200 °C and 50 °C higher than that of PLLA. The Tm of sc-PLAG corresponded to the Tm of SC of PLA [35], which showed that glucose groups of PDLAG could not block the formation of SC structure of sc-PLAG. All sc-PLAG samples only formed SC structure instead of HC structure, indicating that SC structure was superior to HC in sc-PLAG [33]. The preforming stereocomplex crystallite might act as nucleating agents in the blending process and significantly increase the crystallization rate of PLA [35,36]. We could also find from Table 2 that the melting point of sc-PLAG varied regularly with glucose content in feeding. The Tm of sc-PLAG-0.5% was 205.6 °C, and then the Tm of sc-PLAG increased with the increased glucose content in feeding to reach to the maximum of 208.1 °C as the glucose content in feeding being 2%. Meanwhile, it could be observed from Table 2 that the effect of glucose content in feeding on the crystallinity of sc-PLAG was similar to its effect on the Tm of sc-PLAG. The crystallinity of PDLAG-5% and PLLA was 21.5% and 48.4%, respectively, while the crystallinity of each sc-PLAG was more than that of PDLAG-5% and less than or equal to that of PLLA, indicating that the interaction between PLLA and PDLAG improved the crystallization capacity of PLA. The crystallinity of sc-PLAG-0.5% was 35.9%, the crystallinity of sc-PLAG gradually increased with the increase of glucose content in feeding up to the maximum 48.8% as glucose content in feeding being 2%. However, when glucose content in feeding continued increasing, the crystallinity of sc-PLAG gradually decreased to 38.3% of sc-PLAG-5%. The influence factors of the crystallization of sc-PLAG might include stereocomplexation of enantiomeric PLA units, the amphiphilicity due to glucose residues and lactic acid units, and the interaction between glucose residues and l-lactic and d-lactic acid units. In sc-PLAG, the glucose groups interacted with lactic acid units to a certain extent, which might lead to the less ordered arrangement of l-lactic and/or d-lactic chains, the increase of crystal defects, and the decreasing amounts of SC, so that both Tm and crystallinity of sc-PLAG decreased. In PDLAG, the glycosyl with unreacted OH group of glucose and grafted likely by short DLA units with OH end groups was hydrophilic, and DLA chains were hydrophobic. The amphiphilic PDLAG could bring forth self-assembly and promote the aggregation of lactic units, which might improve the ordered arrangement of lactic acid chains, decrease crystal defects, and increase the amounts of SC. Therefore, the Tm and crystallinity of sc-PLAG increased. The stereocomplexation, amphiphilicity, and interaction in sc-PLAG were related to the motion of PDLAG affected by the chain structure and molecular weight of PDLAG. Multi-arm PDLAG with low Mw and short branches could move easily to form SC structure with linear PLLA regardless of the effects of PLLA. Moreover, the PDLAG sample with low Mw had high glucose proportion in molecular chains, which indicated high glucose amount in its sc-PLAG and increased amphiphilic interaction. The comprehensive effects of these factors resulted in different trends in the Tm and crystallinity of sc-PLAG with the change of glucose content in feeding. When a small amount of glucose group existed in sc-PLAG, the self-assembly of amphiphilic groups was weak, and the interaction between glucose groups and lactic units could reduce the ordered arrangement and the amount of SC, which decreased the Tm and crystallinity of sc-PLAG. The amphiphilic interaction of PDLAG gradually strengthened with increasing glucose content in feeding, and the ordered arrangement of lactic acid chain increased, which would improve the crystallization of sc-PLAG so that the Tm and crystallinity of sc-PLAG increased. When glucose content in feeding was 2%, the glucose amount in sc-PDLAG-2% was the biggest. The interaction between glucose groups and lactic units and the amphiphilic interaction achieved balance; thus, the Tm and crystallinity of sc-PLAG reached to the maximum. As glucose content in feeding continued to increase, the Mw of PDLAG increased gradually, so the glucose amount in sc-PDLAG decreased, and the motion of PDLAG was reduced. The interaction between the glucose groups and lactic units gradually enhanced, and the amphiphilic effect weakened, which resulted in the decrease of SC perfection and crystallinity, namely, the Tm and crystallinity of sc-PLAG decreased.
The Tg of PLLA, PDLAG, and sc-PLAG in Table 2 showed a similar trend like Tm with the change of glucose content in feeding. It’s well known that both Mw and Ɖ have an obvious influence on the Tg of polymers. PDLAG-0.5% with relatively high Mw and small Ɖ had the highest Tg (60.6 °C), while the Tg of PDLAG-5% with highest Mw and relatively big Ɖ was 52.9 °C. The Tg of all PDLAG samples was less than that of PLLA (with Tg being 65.7 °C), which showed that the Tg was lowered by the introduction of a small mass of glucose groups. The Tg of sc-PLAG-0.5% (being 53.9 °C) was less than that of PLLA. With increasing glucose contents in feeding, the Tg of sc-PLAG-1% and sc-PLAG-2% increased and reached the maximum Tg similar to that of PLLA. If glucose content in feeding continued to increase, the Tg of sc-PLAG gradually decreased to the smallest Tg of sc-PLAG-5%. The influence factors of Tg might include the Mw and Ɖ of PDLAG, the steric effect of glucose groups, crystallinity, the interaction of glucose groups with lactic units, etc., which would vary with glucose content in feeding. The comprehensive effects of these factors might change the Tg of sc-PLAG with glucose content in feeding.
In conclusion, the SC structure and glucose content in feeding made a significant impact on the Tg, Tm, and crystallinity of sc-PLAG. Thus, the preparation of the stereocomplex and the adjustment of glucose content in feeding could improve the mechanical property and thermal stability of PLA materials [35].

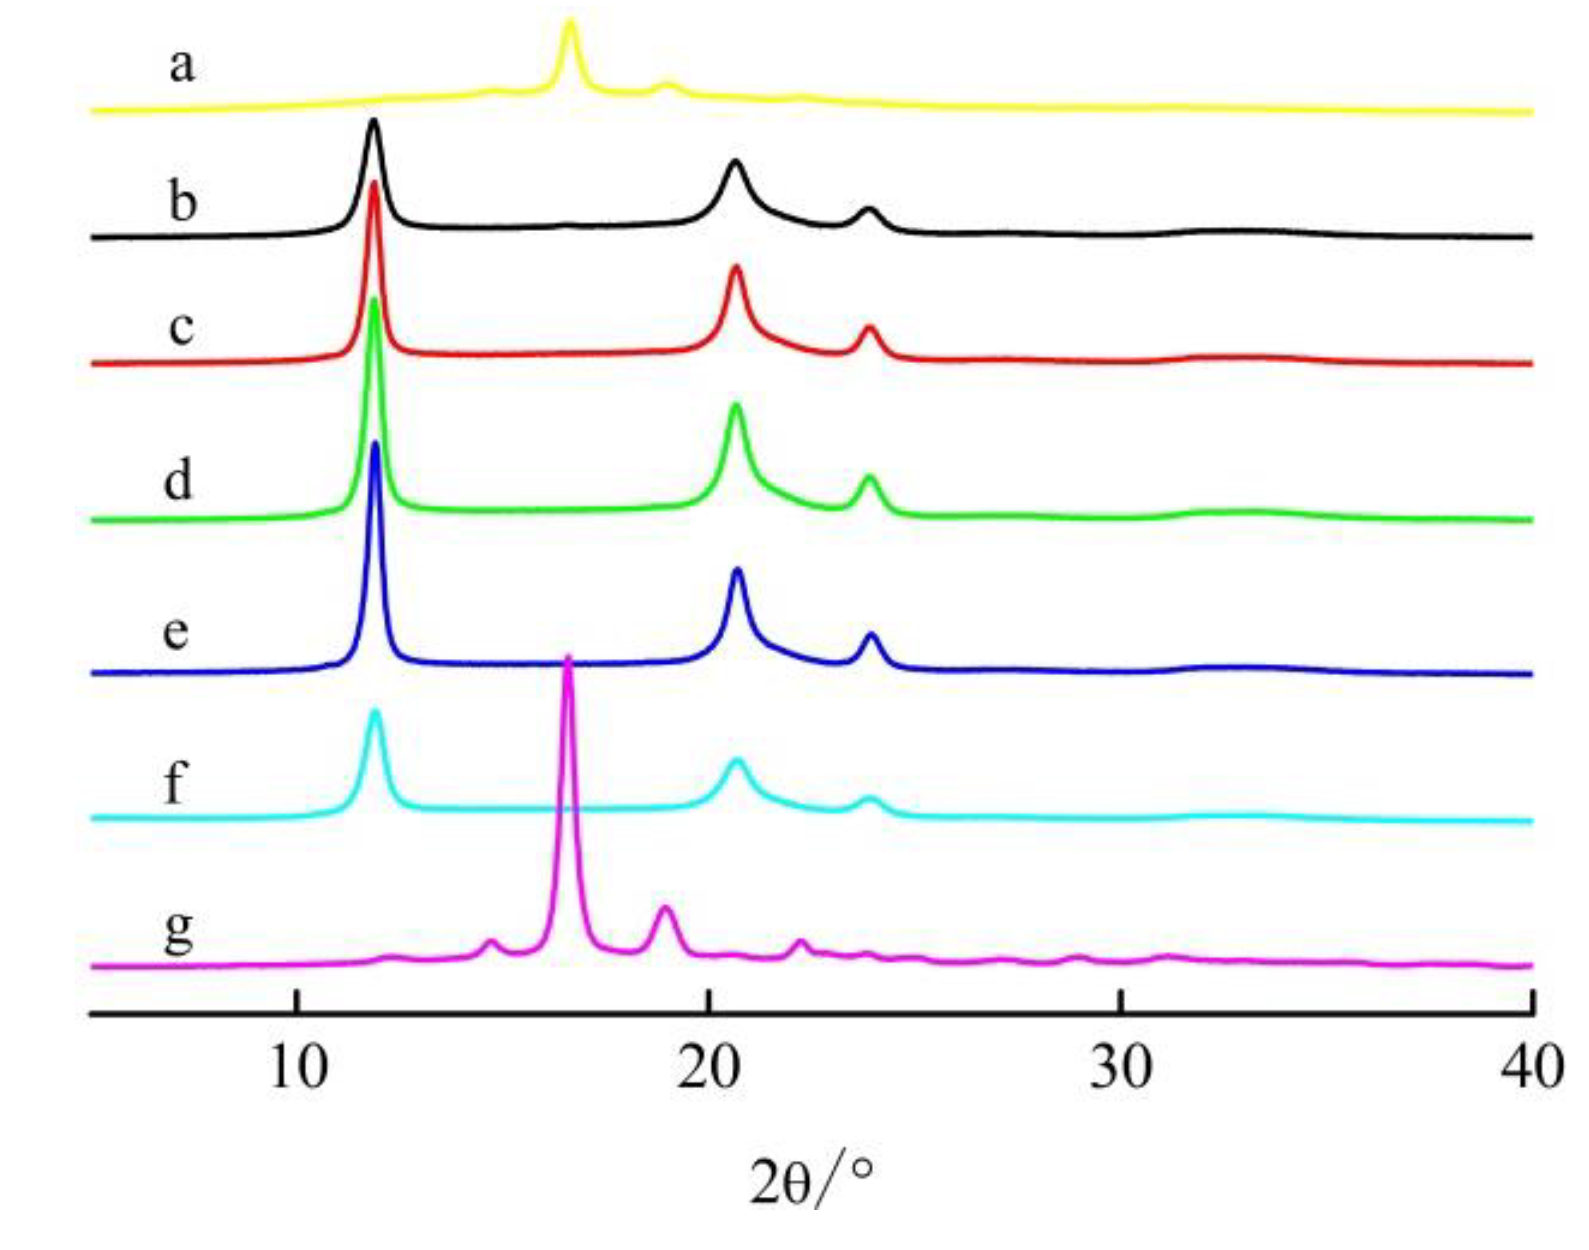
3.3. XRD Analysis of sc-PLGA Crystal Structure

Figure 3 shows the XRD curves of PLLA, PDLAG-5%, and sc-PLAG samples with different glucose content in feeding. The XRD curve of PLLA presented four diffraction peaks at 2θ = 14.8°, 16.6°, 19.0°, and 22.2°, corresponding to the reflection of (010), (200)/(110), (203), and (015) planes of PLA α-form crystal, respectively [37], which could be assigned to the HC diffraction peaks of lactic units, i.e., PLLA formed HC. At the same time, we also found two diffraction peaks at 2θ = 16.6° and 19.0° in PDLAG-5%, but the peak intensity was significantly weaker than those of PLLA, indicating that the addition of glucose could reduce the ordered arrangement of lactic units and thus increase the crystal defects, which was consistent with the above DSC conclusions.
Moreover, the sc-PLAG curves all presented diffraction peaks at 2θ = 11.9°, 20.7°, and 23.9°, corresponding to diffractions of (110), (300/030), and (220) planes of stereocomplex crystal, respectively, which are the characteristic peaks of SC [36]. These results indicated that d-lactic units in PDLAG and PLLA could form SC through stereocomplexation [37]. Figure 3 shows that all sc-PLAG only possessed SC diffraction peaks and no HC diffraction peaks, which meant that only SC existed in sc-PLAG, namely, SC could be formed more easily than HC [33]. Moreover, the 2θ of diffraction peaks of sc-PLAG almost didn’t change with glucose content in feeding, which suggested that glucose was less involved in the SC of PLA and did not affect the crystal form of sc-PLAG. When glucose content in feeding was 0.5%, the intensity of the sc-PLAG-0.5% diffraction peak was the smallest. Then, with the increased glucose content in feeding, the intensity of the diffraction peaks increased gradually until the maximum value appeared as glucose content in feeding being 2%, which indicated that the crystallinity of sc-PLAG was increasing. However, if glucose content in feeding continued to increase, the diffraction peak intensity of sc-PLAG decreased gradually; that is, the crystallinity of sc-PLAG decreased with the increase of glucose content in feeding. The XRD results were consistent with those of DSC, which showed that the comprehensive effects of the Mw and Ɖ of PDLAG, stereocomplexation, amphiphilicity, and the interaction between glucose residues and l-lactic and d-lactic units would induce the change of crystallinity of sc-PLAG with the glucose content in feeding.

3.4. FI-IR Analysis of the Effect of Glucose Groups on sc-PLAG

In order to further investigate the role of glucose groups in sc-PLAG, the infrared spectroscopy was used to analyze the interaction of glucose groups with lactic units in sc-PLAG. Figure 4 shows the infrared spectra of PLLA, PDLAG-5%, and sc-PLGA samples in the carbonyl bond and hydrogen bond regions and crystalline regions. In Figure 4, the FT-IR spectrum of PLLA presented a relatively wide peak at 3483 cm−1 due to the stretch vibration of both free and hydrogen-bonded –OH groups and the strongest peak at 1750 cm−1 due to the stretch vibration of ester carbonyl C=O [6,38,39]. The FT-IR spectrum of PDLAG-5% resembled that of PLLA, while the wider peak of –OH groups moved to 3510 cm−1, and the C=O peak slightly redshifted with increasing peak intensity, which could result from the existence of glucose groups and its interaction with lactic units. When PLLA was blended with equimolar PDLAG to form SC structure, the IR spectra of sc-PLAG samples displayed that the peaks at 3510 cm−1 gradually widened and strengthened and slightly moved to low wavenumber with the increase of glucose content in feeding. These changes of -OH peaks could be attributed to the comprehensive actions of -OH groups existing in l-lactic units, d-lactic units, and glucose groups and their interactions growing with the increase of glucose content in feeding [40]. Meanwhile, compared with PLLA, the C=O peak of sc-PLAG samples slightly shifted to lower wavenumber with decreasing intensity along with the increase of glucose content in feeding, which might be due to the interaction between C=O groups with –OH groups of glucose. The FT-IR results showed that there was the interaction of glucose with lactic acid units, which was already demonstrated in DSC and XRD.

3.5. TGA Analysis of the Thermal Properties of sc-PLAG

Thermogravimetric analysis is also effective to evaluate the thermal properties of polymer materials. Figure 5 shows the TGA curves of PLLA and sc-PLAG samples. The beginning degradation temperature Tb (at 5 wt% mass loss), the maximum degradation temperature Tmax (at 50 wt% mass loss), the final degradation temperature Tf (at 95 wt% mass loss) [41], and the carbon residue ratio Wr at 600 °C [26] of each sample were obtained from the analysis of Figure 5, and the results are listed in Table 3.
It could be reported from Figure 5 that PLLA and all sc-PLAG samples experienced single-step decomposition and had similar thermal degradation behaviors, namely, the thermal degradation process was divided into three stages. At the first stage, the weight loss of samples was less than 5% within 220 °C, which was due to the volatilization of a small amount of water left in samples and the pyrolysis of impurities. The second stage was at a temperature of 220–300 °C, which was the main pyrolysis stage, mainly due to lactic units and glucose groups, and up to 90 wt% of samples degraded. At the third stage, with the temperature higher than 300 °C, the pyrolysis of the samples reached the platform stage, and the Wr of PLLA and sc-PLAG samples was basically the same. PDLAG samples had thermal degradation behaviors similar to those of PLLA and sc-PLAG, which are listed in Table 3. Glucose groups possessed good thermal stability, and the increasing glucose proportion also increased the interaction of glucose groups with lactic units, which was helpful in retarding the pyrolysis process and improve the thermal stability of samples. However, glucose units could participate in the crystallization of PLA, decrease crystal perfection, and reduce thermal stability. The high Mw, perfect crystal structure, and high distribution of glucose units on the surface would improve the thermal stability of PDLAG and sc-PLAG samples. The Tmax of all PDLAG was lower than that of PLLA (its Tmax being about 274 °C), according to Table 3, which indicated that glucose units might decrease crystal perfection and accelerate the thermal degradation. PDLAG-5% had the highest Mw and likely more low-Mw fractions moving to the surface easily, which resulted in the highest Tmax of all PDLAG. On the contrary, PDLAG-2% had the lowest Tmax because of its lowest Mw and highest glucose units, which could decrease crystal perfection. Moreover, the Tmax of sc-PLAG samples was higher than that of the corresponding PDLAG, mainly due to its SC structure. On account of the comprehensive effects of the above factors, the Tmax of sc-PLAG-0.5% was about 262 °C, then the Tmax of sc-PLAG samples increased steadily with the increase of glucose content in feeding until the glucose content in feeding was 5%. Compared to PLLA-glucose blends [26] and PLA with different processing methods [41], the Tb, Tmax, and Tf of all sc-PLAG were lower than those of PLLA-glucose blends and the PLA materials, which indicated that the copolymerization of poly(lactic acid) and glucose and stereocomplex of PLA was more able to promote thermal degradation of PLLA.

3.6. POM Analysis of Crystal Morphology

The crystallization process and the morphology of PLLA and sc-PLAG were observed by polarized optical microscope (POM). PLLA and sc-PLAG samples were melted at 165 °C and 230 °C, respectively, for 5 min, cooled to a certain temperature (PLLA at 120 °C, sc-PLAG at 190 °C) at a rate of 10 °C/min, and then maintained at a constant temperature. We could estimate the effects of stereocomplexation, chain amphiphilicity, and the interaction of glucose groups with lactic units on the properties of sc-PLAG by studying the crystallization process and morphology of sc-PLAG [42]. Figure 6 shows the POM images of PLLA and sc-PLAG samples with different glucose content in feeding, showing the process of spherulite growth from 10 min to 30 min. The crystallization of PLLA is shown in Figure 6f, with existing regular and uniform-sized spherulites and obvious black cross extinction phenomena. The size of spherulites gradually increased as the extension of time, and spherulites would contact each other and deform. The crystallization of sc-PLAG-0.5% is shown in Figure 6e, with existing regular and uniform-sized spherulites and obvious black cross extinction phenomenon, but the size and amount of spherulites in this sample was smaller than those of PLLA during the same period. The spherulites size of sc-PLAG increased gradually along with the increase of glucose content in feeding and reached the maximum as glucose content in feeding being 2% (Figure 6c), meaning the increase of crystallization rate. However, when glucose content in feeding continued increasing, the size of the spherulites of sc-PLAG gradually decreased, meaning the decrease of crystallization rate. The sc-PLAG samples with glucose content in feeding beyond 2% possessed the crystallization rate faster than that of PLLA. The black cross extinction phenomenon of spherulites became invisible at the same time, meaning the less ordered arrangement of spherulites. These variations of spherulites were due to the combined effect of PDLAG motion, the stereocomplexation, the amphiphilicity, and the interaction of glucose residues with lactic units, as mentioned above [3,31].
The results of POM showed that a proper amount of glucose groups would play the role of heterogeneous nucleation agent and improve the crystallization rate of PLA stereocomplex, while a small amount or an excess glucose group could destroy the ordered arrangement of lactic acid units to reduce the regularity of SC.

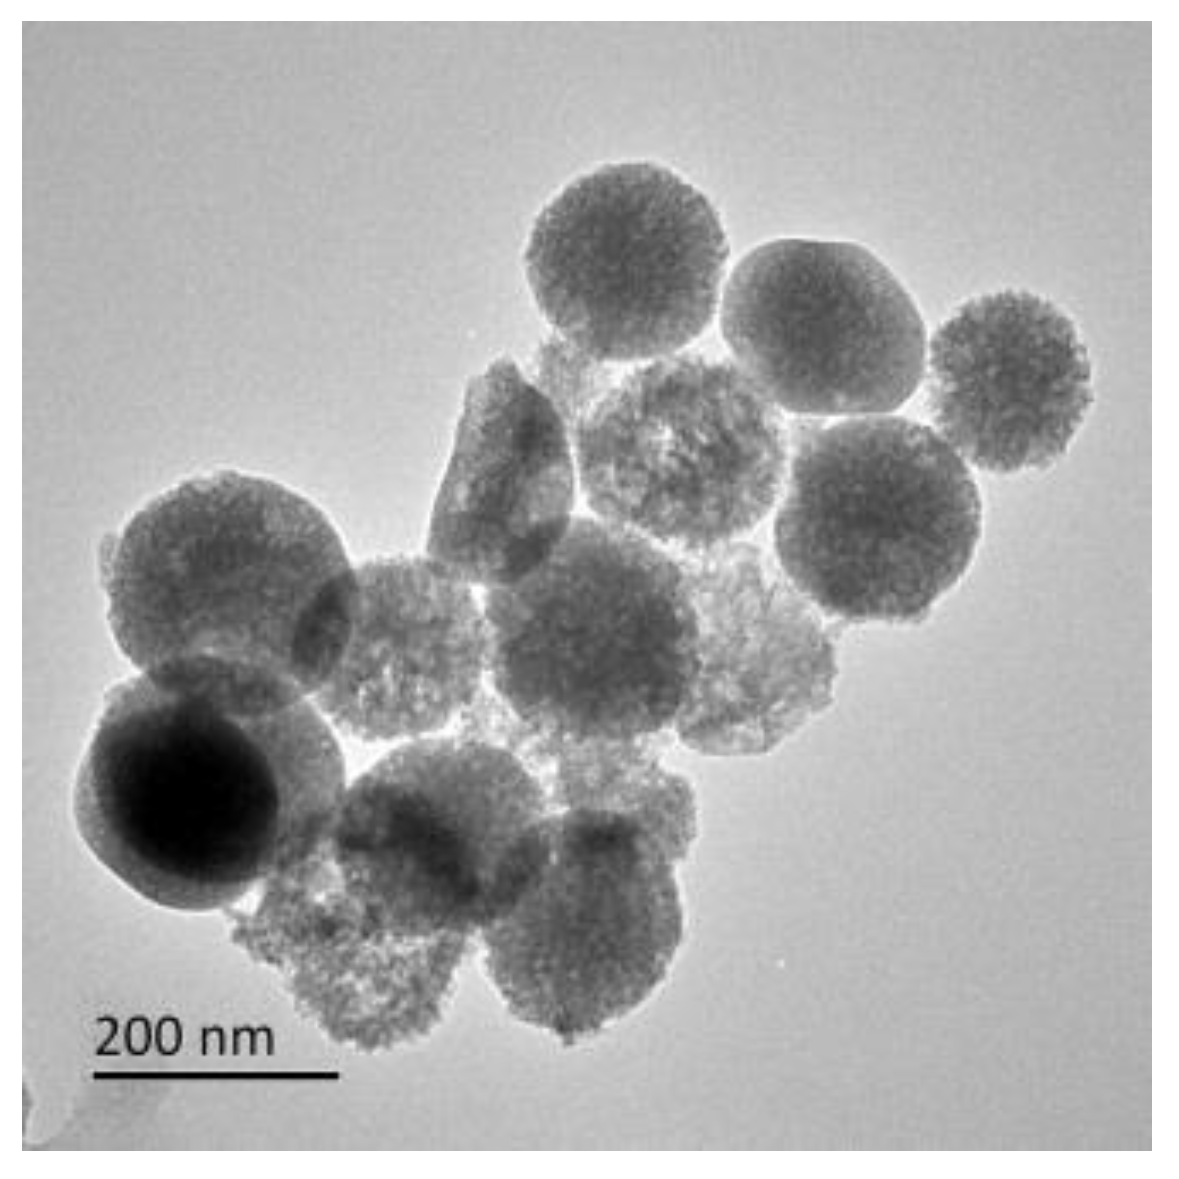
3.7. TEM and SEM Analysis of Sample Morphology

Figure 7 is the TEM photograph of sc-PLAG-5%, and other sc-PLAG samples also possessed similar morphology. The microspheres with a diameter of about 200 nm and the aggregation of microspheres could be observed [43]. In sc-PLAG, the formation of microspheres could be induced by the stereocomplexation of enantiomeric PLA units and the amphiphilicity due to glucose residues and lactic acid units, which indicated that the hydrophobic PLA units likely spontaneously gathered in the center of microspheres to form SC structure, while the hydrophilic glucose groups distributed on the surface of the microspheres. The self-assembly could be promoted by the stereocomplexation of enantiomeric PLA units, which would further improve the hydrophilicity of the surface of sc-PLAG samples.
Figure 8 is the scanning electron micrograph of sc-PLAG-4%, and other sc-PLAG samples also possessed similar morphology. Sc-PLAG possessed a porous multilayer structure, which consisted of microsphere structure due to the self-assembly and the stereocomplexation. The porous layer structure might be caused by the pores generated by solvent evaporation during the preparation and drying process, which would improve the adsorption of water. The results of TEM and SEM indicated that sc-PLAG could form a microsphere and porous layer structure, which might provide the possibility to improve the hydrophilicity and degradation of PLA. The improvement of sc-PLAG hydrophilicity would also be further proved by the contact angles analysis below.

3.8. Hydrophilic Analysis of sc-PLAG

In order to study the hydrophilicity of sc-PLAG samples, the water contact angles of sc-PLAG with different glucose content in feeding were tested [44]. Figure 9 shows the contact angle photographs of sc-PLAG blends and PLLA, respectively, and Table 4 shows the contact angle parameters of PLLA and sc-PLAG with different glucose content in feeding. The contact angles of all PLAG samples were less than that of PLLA, which meant that glucose could improve the hydrophilicity of PLA materials. The glucose residues in PDLAG with low Mw and wide Ɖ more easily moved to the surface and increased the hydrophilicity; thus, the contact angles of PLAG varied with glucose contents. The contact angles of all sc-PLAG were less than those of PDLAG because the interaction of PDLAG with PLLA could hinder PDLAG from moving to the surface. According to Figure 9 and Table 4, the contact angle of PLLA was 85°, indicating the poor hydrophilicity of PLLA. The contact angles of sc-PLAG decreased significantly with the increase of glucose contents in feeding by impacting the Mw and Ɖ of PDLAG samples. PDLAG-5% with the highest Ɖ perhaps contained more low-Mw components. As for sc-PLAG, multi-armed PDLAG interacted with linear PLLA, and the low-Mw glucose groups would tend to move to the surface of sc-PDLAG and improve its hydrophilicity. Thus, the contact angle of sc-PLAG-5% decreased to 77.5°. The result of contact angles testified that the addition of hydrophilic glucose was able to improve the hydrophilicity of PLA blends because the glucose groups were mainly located on the sc-PLAG surface due to the amphiphilicity of glucose residues and lactic units, which was consistent with SEM and TEM results.
To further explore the influence of stereocomplex and hydrophilic glucose groups on the water absorption performance of PLA materials [45], we tested and calculated the water absorption ratios of samples, and the results are listed in Table 5.
Table 5 shows the water absorption ratios of PLLA, PDLAG, and sc-PLAG with different glucose contents in feeding. The water absorption ratios of PDLAG samples were more than that of PLLA and increased with glucose contents. The water absorption ratios of sc-PLAG samples increased significantly compared with that of PLLA and more than that of the corresponding PDLAG. The water absorption ratio sc-PLAG-2% reached to the maximum, other than sc-PLAG-4% and sc-PLAG-5%, indicating that the water retention property of sc-PLAG did not merely depend on glucose contents in feeding. The water absorption ratios of sc-PLAG samples demonstrated that the addition of glucose significantly improved the hydrophilic property of PLA materials because of the porous structure and glucose groups mainly located on the surface of sc-PLAG. The result of water absorption showed that the addition of hydrophilic glucose was able to improve the hydrophilicity of PLA blends, which was consistent with SEM and contact angle analysis.

4. Conclusions

We successfully prepared sc-PLAG from PLLA and its enantiomeric copolymer PDLAG by direct polymerization and solution blending. PDLAG was multi-armed, and partial OH groups of glucose residues in PDLAG might remain unreacted. The glucose content in feeding obviously affected the Mw, dispersity (Ɖ), and glucose proportion in the chain of PDLAG samples. The glucose content in feeding would play an important role in sc-PLAG through its influence on the Mw, glucose proportion, and Ɖ of PDLAG. The results from DSC, XRD, and POM showed that only SC of sc-PLAG was formed when PLLA blended with equimolar PDLAG. The Tg, Tm, crystallinity, crystallization rate, and water absorption ratio presented similar changes with the increase of glucose content in feeding in sc-PLAG. That is, these performances of sc-PLAG gradually increased with the increase of glucose content in feeding until the maximum as glucose content in feeding being 2%. When glucose content in feeding continued increasing, these performances gradually decreased. The influence factors of the crystallization of sc-PLAG included the Mw and Ɖ of PDLAG, stereocomplexation of enantiomeric PLA units, the amphiphilicity due to glucose residues and lactic acid units, and the interaction between glucose residues and l-lactic and d-lactic acid units. The comprehensive actions of these factors resulted in different trends in these properties of sc-PLAG. Meanwhile, sc-PLAG possessed regular microsphere structure with glucose as the surface phase and SC of lactic units as the bulk phase from the results of TEM, SEM, contact angle analysis, and water absorption of sc-PLAG. Thus, poly(lactic acid) stereocomplex containing glucose groups could effectively improve the crystallinity, hydrophilicity, and thermal stability of PLA materials, providing a promising prospect in its application in the field of biomedicine, such as drug delivery system and tissue regeneration, etc.

Author Contributions

Conceptualization, Q.G. and L.Q.; methodology, D.C.; software, Q.Z.; validation, L.Q., Q.G., and Q.Z.; formal analysis, K.C.; investigation, T.L.; resources, Q.G.; data curation, K.R.Z.; writing—original draft preparation, L.Q.; writing—review and editing, L.Q.; visualization, L.Q.; supervision, Q.G.; project administration, Q.Z.; funding acquisition, Q.G. All authors have read and agreed to the published version of the manuscript.

Funding

This research was funded by the National Natural Science Foundation of China, grant number 50573032, 31200451, Priority Academic Program Development of Jiangsu Higher Education Institutions (PAPD), and Special Fund for Forest Scientific Research in the Public Welfare.

Acknowledgments

This work was supported by the National Natural Science Foundation of China (50573032, 31200451), Priority Academic Program Development of Jiangsu Higher Education Institutions (PAPD), and Special Fund for Forest Scientific Research in the Public Welfare.

Conflicts of Interest

The authors declare no conflict of interest.

References

  1. Hardianti, D.; Hidayat, N.; Kurniawan, R. Study of Nano-Hydroxyapatite:Poly Lactide Acid (n-HA:PLA) Composites and Their Biocompatibility, Bioactivity, and Biodegradability Characteristics. IOP Conf. Ser. Mater. Sci. Eng. 2019, 515, 012034. [Google Scholar]
  2. Liu, Y.; Zhan, Z.; Ye, H.; Lin, X.; Yan, Y.; Zhang, Y. Accelerated biodegradation of PLA/PHB-blended nonwovens by a microbial community. RSC Adv. 2019, 9, 10386–10394. [Google Scholar] [CrossRef] [Green Version]
  3. Scaffaro, R.; Lopresti, F.; Botta, L. PLA based biocomposites reinforced with Posidonia oceanica leaves. Compos. Part B Eng. 2018, 139, 1–11. [Google Scholar] [CrossRef]
  4. Anderson, J.M.; Shive, M.S. Biodegradation and biocompatibility of PLA and PLGA microspheres. Adv. Drug Deliv. Rev. 2012, 64, 72–82. [Google Scholar] [CrossRef]
  5. Arpagaus, C. PLA/PLGA nanoparticles prepared by nano spray drying. J. Pharm. Investig. 2019, 49, 405–426. [Google Scholar] [CrossRef] [Green Version]
  6. Qian, W.; Song, T.; Ye, M.; Xu, P.; Lu, G.; Huang, X. PAA-g-PLA amphiphilic graft copolymer: Synthesis, self-assembly, and drug loading ability. Polym. Chem. 2017, 8, 4098–4107. [Google Scholar] [CrossRef]
  7. Cheng, L.; Hu, C.; Li, J.; Huang, S.; Jiang, S. Stereocomplex-affected crystallization behaviour of PDLA in PDLA/PLDLA blends. CrystEngComm 2019, 21, 329–338. [Google Scholar] [CrossRef]
  8. Xie, P.; Wang, J.; Li, J.; Cheng, Q.; Zhou, K.; Ren, J. Miktoarm star-shaped poly(lactic acid) copolymer: Synthesis and stereocomplex crystallization behavior. J. Polym. Sci. Part A Polym. Chem. 2019, 57, 814–826. [Google Scholar] [CrossRef]
  9. Shi, X.; Jing, Z.; Zhang, G. Influence of PLA stereocomplex crystals and thermal treatment temperature on the rheology and crystallization behavior of asymmetric poly(L-Lactide)/poly(D-lactide) blends. J. Polym. Res. 2018, 25, 71. [Google Scholar] [CrossRef]
  10. Hassan, M.M.; Le Guen, M.J.; Tucker, N.; Parker, K. Thermo-mechanical, morphological and water absorption properties of thermoplastic starch/cellulose composite foams reinforced with PLA. Cellulose 2019, 26, 4463–4478. [Google Scholar] [CrossRef]
  11. Ma, P.; Shen, T.; Xu, P.; Dong, W.; Lemstra, P.J.; Chen, M. Superior Performance of Fully Biobased Poly(lactide) via Stereocomplexation-Induced Phase Separation: Structure versus Property. ACS Sustain. Chem. Eng. 2015, 3, 1470–1478. [Google Scholar] [CrossRef]
  12. Li, Z.; Muiruri, J.K.; Thitsartarn, W.; Zhang, X.; Tan, B.H.; He, C. Biodegradable silica rubber core-shell nanoparticles and their stereocomplex for efficient PLA toughening. Compos. Sci. Technol. 2018, 159, 11–17. [Google Scholar] [CrossRef]
  13. Toncheva, A.; Spasova, M.; Paneva, D.; Manolova, N.; Rashkov, I. Polylactide (PLA)-Based Electrospun Fibrous Materials Containing Ionic Drugs as Wound Dressing Materials: A Review. Int. J. Polym. Mater. Polym. Biomater. 2014, 63, 657–671. [Google Scholar] [CrossRef]
  14. Lyu, Y.; Pang, J.; Gao, Z.; Zhang, Q.; Shi, X. Characterization of the compatibility of PVC/PLA blends by Aid of Rheological Responses. Polymer 2019, 176, 20–29. [Google Scholar] [CrossRef]
  15. Haniff, M.; Bijarimi, M.; Zaidi, M.S.; Sahrim, A. Preparation and Characterization of Poly(Lactic Acid) (PLA)/Polyoxymethylene (POM) Blends. Mater. Sci. Forum 2018, 917, 3–6. [Google Scholar] [CrossRef]
  16. Yang, C.; Xue, Z.; Liu, Y.; Xiao, J.; Chen, J.; Zhang, L.; Guo, J.; Lin, W. Delivery of anticancer drug using pH-sensitive micelles from triblock copolymer MPEG-b-PBAE-b-PLA. Mater. Sci. Eng. C 2018, 84, 254–262. [Google Scholar] [CrossRef]
  17. Tsuji, H.; Kikkawa, K.; Arakawa, Y. Cocrystallization of monomer units of biobased and biodegradable Poly(l-lactic acid-co-glycolic acid) random copolymers. Polym. J. 2018, 50, 1079–1088. [Google Scholar] [CrossRef]
  18. Yin, X.; Hewitt, D.R.O.; Quah, S.P.; Zheng, B.; Mattei, G.S.; Khalifah, P.G.; Grubbs, R.B.; Bhatia, S.R. Impact of stereochemistry on rheology and nanostructure of PLA-PEO-PLA triblocks: Stiff gels at intermediate l/d-lactide ratios. Soft Matter 2018, 14, 7255–7263. [Google Scholar] [CrossRef]
  19. Phuphuak, Y.; Miao, Y.; Zinck, P.; Chirachanchai, S. Balancing crystalline and amorphous domains in PLA through star-structured polylactides with dual plasticizer/nucleating agent functionality. Polymer 2013, 54, 7058–7070. [Google Scholar] [CrossRef]
  20. Phetwarotai, W.; Phusunti, N.; Aht-Ong, D. Preparation and Characteristics of Poly(butylene adipate-co-terephthalate)/Polylactide Blend Films via Synergistic Efficiency of Plasticization and Compatibilization. Chin. J. Polym. Sci. 2018, 37, 68–78. [Google Scholar] [CrossRef]
  21. Bai, H.; Xiu, H.; Gao, J.; Deng, H.; Zhang, Q.; Yang, M.; Fu, Q. Tailoring impact toughness of poly(l-lactide)/poly(epsilon-caprolactone) (PLLA/PCL) blends by controlling crystallization of PLLA matrix. ACS Appl. Mater. Interfaces 2012, 4, 897–905. [Google Scholar] [CrossRef] [PubMed]
  22. Mohideen, M.; Quijano, E.; Song, E.; Deng, Y.; Panse, G.; Zhang, W.; Clark, M.R.; Saltzman, W.M. Degradable bioadhesive nanoparticles for prolonged intravaginal delivery and retention of elvitegravir. Biomaterials 2017, 144, 144–154. [Google Scholar] [CrossRef] [PubMed]
  23. Lee, S.; Kimoto, M.; Tanaka, M.; Tsuji, H.; Nishino, T. Crystal modulus of poly (lactic acid)s, and their stereocomplex. Polymer 2018, 138, 124–131. [Google Scholar] [CrossRef] [Green Version]
  24. Wiegand, C.; Nikolajski, M.; Hipler, U.C.; Heinze, T. Nanoparticle Formulation of AEA and BAEA Cellulose Carbamates Increases Biocompatibility and Antimicrobial Activity. Macromol. Biosci. 2015, 15, 1242–1251. [Google Scholar] [CrossRef] [PubMed]
  25. Ma, P.; Shen, T.; Lin, L.; Dong, W.; Chen, M. Cellulose-g-poly(d-lactide) nanohybrids induced significant low melt viscosity and fast crystallization of fully bio-based nanocomposites. Carbohydr. Polym. 2017, 155, 498–506. [Google Scholar] [CrossRef]
  26. Cao, D.; Gao, Q.-W.; Zhao, Y.-P.; Ming, W. Effect of glucose on the crystallization and thermal properties of poly(l-lactic acid) prepared through mixed solution method. In Advances in Engineering Research; Atlantis Press: Paris, France, 2017; Volume 105, pp. 573–576. [Google Scholar]
  27. Ansary, R.H.; Rahman, M.M.; Awang, M.B.; Katas, H.; Hadi, H.; Mohamed, F.; Doolaanea, A.A.; Kamaruzzaman, Y.B. Preparation, characterization and in vitro release study of BSA-loaded double-walled glucose-poly(lactide-co-glycolide) microspheres. Arch. Pharmacal Res. 2016, 39, 1242–1256. [Google Scholar] [CrossRef]
  28. Sangeetha, V.H.; Deka, H.; Varghese, T.O.; Nayak, S.K. State of the art and future prospectives of poly(lactic acid) based blends and composites. Polym. Compos. 2018, 39, 81–101. [Google Scholar] [CrossRef]
  29. Luo, S.H.; Yu, S.Q.; Li, J.X.; Wang, Z.Y. Research on the Modification of Poly(L-Lactic Acid) by Glucose via Direct Melt Polycondensation. Adv. Mater. Res. 2011, 311–313, 1106–1109. [Google Scholar] [CrossRef]
  30. Cao, D.; Ming, W.; Qi, L.Y.; Zhao, Y.P.; Gao, Q.W. Preparation and Properties of Poly(Lactic Acid) Stereocomplex Containing Glucose Groups. Chem. Ind. For. Prod. 2018, 38, 17–22. [Google Scholar]
  31. Madhavan Nampoothiri, K.; Nair, N.R.; John, R.P. An overview of the recent developments in polylactide (PLA) research. Bioresour. Technol. 2010, 101, 8493–8501. [Google Scholar] [CrossRef]
  32. Jiang, L.; Shen, T.; Xu, P.; Zhao, X.; Li, X.; Dong, W.; Ma, P.; Chen, M. Crystallization modification of poly(lactide) by using nucleating agents and stereocomplexation. E-Polymers 2016, 16, 1–13. [Google Scholar] [CrossRef]
  33. Yuzeng, L.; Qiao, L.; Gesheng, Y.; Ruihao, M.; Minmin, Y.; Huihui, Z.; Huili, S. Evaluation of thermal resistance and mechanical properties of injected molded stereocomplex of poly(l-lactic acid) and poly(d-lactic acid) with various molecular weights. Adv. Polym. Technol. 2018, 37, 1674–1681. [Google Scholar]
  34. Jia, S.K.; Yang, D.; Wang, Z.; Zhang, X.; Chen, L.; Fu, L. Morphologies, crystallization, and mechanical properties of PLA-based nanocomposites: Synergistic effects of PEG/HNTs. J. Appl. Polym. Sci. 2019, 136, 47385. [Google Scholar] [CrossRef]
  35. Kang, Y.; Chen, P.; Shi, X.; Zhang, G.; Wang, C. Preparation of open-porous stereocomplex PLA/PBAT scaffolds and correlation between their morphology, mechanical behavior, and cell compatibility. RSC Adv. 2018, 8, 12933–12943. [Google Scholar] [CrossRef] [Green Version]
  36. Lv, T.; Zhang, C.; Li, J.; Huang, S.; Wen, H.; Meng, Y.; Jiang, S. New insight into the mechanism of enhanced crystallization of PLA in PLLA/PDLA mixture. J. Appl. Polym. Sci. 2018, 135, 45663. [Google Scholar] [CrossRef]
  37. Cui, L.; Wang, Y.; Zhang, R.; Liu, Y. Design high heat-resistant stereocomplex poly(lactide acid) by cross-linking and plasticizing. Adv. Polym. Technol. 2018, 37, 2429–2435. [Google Scholar] [CrossRef]
  38. Pan, P.; Bao, J.; Han, L.; Xie, Q.; Shan, G.; Bao, Y. Stereocomplexation of high-molecular-weight enantiomeric poly(lactic acid)s enhanced by miscible polymer blending with hydrogen bond interactions. Polymer 2016, 98, 80–87. [Google Scholar] [CrossRef]
  39. Gupta, A.; Pal, A.K.; Woo, E.M.; Katiyar, V. Effects of Amphiphilic Chitosan on Stereocomplexation and Properties of Poly(lactic acid) Nano-biocomposite. Sci. Rep. 2018, 8, 4351. [Google Scholar] [CrossRef] [Green Version]
  40. Yang, W.; Li, N.; Cheng, H.; Li, Y.; Bai, X.; Deng, C. Determination of NIR informative wavebands for transmission non-invasive blood glucose measurement using a Fourier transform spectrometer. AIP Adv. 2018, 8, 035216. [Google Scholar] [CrossRef]
  41. Carrasco, F.; Pagès, P.; Gámez-Pérez, J.; Santana, O.O.; Maspoch, M.L. Processing of poly(lactic acid): Characterization of chemical structure, thermal stability and mechanical properties. Polym. Degrad. Stab. 2010, 95, 116–125. [Google Scholar] [CrossRef]
  42. Li, X.; Zhang, X.; Liu, G.; Yang, Z.; Yang, B.; Qi, Y.; Wang, R.; Wang, D.-Y. Effect of stereocomplex crystal and flexible segments on the crystallization and tensile behavior of poly(l-lactide). RSC Adv. 2018, 8, 28453–28460. [Google Scholar] [CrossRef] [Green Version]
  43. Apolinario, A.C.; Magon, M.S.; Pessoa, A., Jr.; Rangel-Yagui, C.O. Challenges for the Self-Assembly of Poly(Ethylene Glycol)(-)Poly(Lactic Acid) (PEG-PLA) into Polymersomes: Beyond the Theoretical Paradigms. Nanomaterials 2018, 8, 373. [Google Scholar] [CrossRef] [PubMed] [Green Version]
  44. Monticelli, O.; Bocchini, S.; Gardella, L.; Cavallo, D.; Cebe, P.; Germelli, G. Impact of synthetic talc on PLLA electrospun fibers. Eur. Polym. J. 2013, 49, 2572–2583. [Google Scholar] [CrossRef]
  45. Ayrilmis, N.; Kariz, M.; Kwon, J.H.; Kitek Kuzman, M. Effect of printing layer thickness on water absorption and mechanical properties of 3D-printed wood/PLA composite materials. Int. J. Adv. Manuf. Technol. 2019, 102, 2195–2200. [Google Scholar] [CrossRef]
Scheme 1. The synthetic route of poly(l-lactic acid) (PLLA).
Polymers 12 00760 sch001
Scheme 2. The synthetic route of poly(d-lactic acid-co-glucose) (PDLAG).
Polymers 12 00760 sch002
Figure 1. 1H-NMR spectrum of poly(d-lactic acid-co-glucose) (PDLAG)-5%.
Polymers 12 00760 g001
Figure 2. DSC curves of poly(l-lactic acid) (PLLA), PDLAG, and stereocomplex of poly(lactic acid) containing glucose groups (sc-PLAG) samples with different glucose content in feeding, a. PDLAG-5%; b. PDLAG-4%; c. PDLAG-2%; d. PDLAG-1%; e. PDLAG-0.5%; f. sc-PLAG-5%; g. sc-PLAG-4%; h. sc-PLAG-2%; i. sc-PLAG-1%; j. sc-PLAG-0.5%; k. PLLA.
Polymers 12 00760 g002
Figure 3. XRD curves of PLLA, PDLAG-5%, and sc-PLAG samples with different glucose content in feeding; the glucose content in the feeding of samples: a. PDLAG-5%; b. 5%; c. 4%; d. 2%; e. 1%; f. 0.5%; g. PLLA.
Polymers 12 00760 g003
Figure 4. FT-IR spectra of PLLA, PDLAG-5%, and sc-PLAG samples in carbonyl region and hydrogen-bond region, a. PDLAG-5%; b. sc-PLAG-5%; c. sc-PLAG-4%; d. sc-PLAG-2%; e. sc-PLAG-1%; f. sc-PLAG-0.5%; g. PLLA.
Polymers 12 00760 g004
Figure 5. TGA curves of PLLA and sc-PDLAG samples with different glucose content in feeding; glucose content in the feeding of samples (%): a. 5%; b. 4%; c. 2%; d. 1%; e. 0.5%; f. PLLA.
Polymers 12 00760 g005
Figure 6. Polarizing microscope images of PLLA and sc-PLAG samples (X200); the glucose content in the feeding of samples: (a) 5%; (b) 4%; (c) 2%; (d) 1%; (e) 0.5%; (f) PLLA.
Polymers 12 00760 g006
Figure 7. The TEM photograph of sc-PLAG-5%.
Polymers 12 00760 g007
Figure 8. The SEM micrograph of the section of sc-PLAG-4%.
Polymers 12 00760 g008
Figure 9. Water contact angles photographs of PLLA and sc-PLAG samples; the glucose content in the feeding of samples: (a) 5%; (b) 4%; (c) 2%; (d) 1%; (e) 0.5%; (f) PLLA.
Polymers 12 00760 g009
Table 1. The Mn, Mw, and dispersity (Ɖ) of PLLA and PDLAG by GPC.
SampleGlucose Content in Feeding/%Glucose Proportion in PDLAG/%Mn/g⋅mol−1Mw/g⋅mol−1Ɖ
PDLAG-5%5.01.6410,70020,6001.93
PDLAG-4%4.02.04856016,4001.92
PDLAG-2%2.02.13820015,6001.90
PDLAG−1%1.01.96890016,5001.85
PDLAG-0.5%0.51.90923016,8001.83
PLLA00876017,0001.95
Mn: Number average molecular weight. Mw: Weight average molecular weight.
Table 2. Thermal properties and crystallinity of PLLA, PDLAG, and sc-PLAG samples.
SampleGlucose Content in Feeding/%Tg/°CTm/°CCrystallinity/%
PDLAG-5%5.052.9133.125.1
PDLAG-4%4.051.3131.724.8
PDLAG-2%2.051.8130.830.3
PDLAG-1%1.057.2132.634.8
PDLAG-0.5%0.560.6140.842.1
sc-PLAG-5%5.051.8203.538.3
sc-PLAG-4%4.057.3203.139.8
sc-PLAG-2%2.065.4208.148.8
sc-PLAG-1%1.066.0206.542.9
sc-PLAG-0.5%0.553.9205.635.9
PLLA065.7147.948.4
Table 3. Characteristic temperatures of PLLA, PLLAG, and sc-PLAG samples determined by TGA.
SampleGlucose Content in Feeding/%Tb/°CTmax/°CTf/%Wr/%
sc-PLAG-5%5.0227.77276.48306.472.50
sc-PLAG-4%4.0231.57275.98300.112.20
sc-PLAG-2%2.0239.21274.60291.051.32
sc-PLAG-1%1.0228.13270.22287.581.41
sc-PLAG-0.5%0.5227.17262.89299.253.60
PDLAG-5%5.0237.32274.16--5.98
PDLAG-4%4.0224.44263.03335.694.62
PDLAG-2%2.0211.06250.52266.741.46
PDLAG-1%1.0213.35254.17293.894.34
PDLAG-0.5%0.5220.06258.15301.264.78
PLLA0237.59274.37288.752.71
Table 4. Water contact angles of PLLA and sc-PLAG samples.
SampleGlucose Content/%Contact Angle/°
sc-PLAG-5%5.077.5
sc-PLAG-4%4.078.5
sc-PLAG-2%2.081.6
sc-PLAG-1%1.082.1
sc-PLAG-0.5%0.582.9
PDLAG-5%5.070.5
PDLAG-4%4.072.5
PDLAG-2%2.066.5
PDLAG-1%1.072.5
PDLAG-0.5%0.576.0
PLLA085.0
Table 5. Hydroscopic property of PLLA and sc-PLAG samples.
SampleGlucose Content/%Water Absorption Ratio/%
sc-PLAG-5%5.09.7
sc-PLAG-4%4.09.4
sc-PLAG-2%2.011.7
sc-PLAG-1%1.08.3
sc-PLAG-0.5%0.57.5
PDLAG-5%5.09.0
PDLAG-4%4.08.7
PDLAG-2%2.08.3
PDLAG-1%1.07.8
PDLAG-0.5%0.57.5
PLLA02.5

