Natural Inspired Carboxymethyl Cellulose (CMC) Doped with Ammonium Carbonate (AC) as Biopolymer Electrolyte


Abstract
:
1. Introduction
2. Materials and Methods
2.1. Preparation of Carboxymethyl Cellulose-Ammonium Carbonate (CMC-AC) Electrolytes Films
2.2. Electrical Impedance Spectroscopy (EIS)
2.3. X-ray Diffractometer (XRD)
2.4. Fourier-Transform Infrared (FTIR)
2.5. Transference Number Measurement (TNM)
3. Results
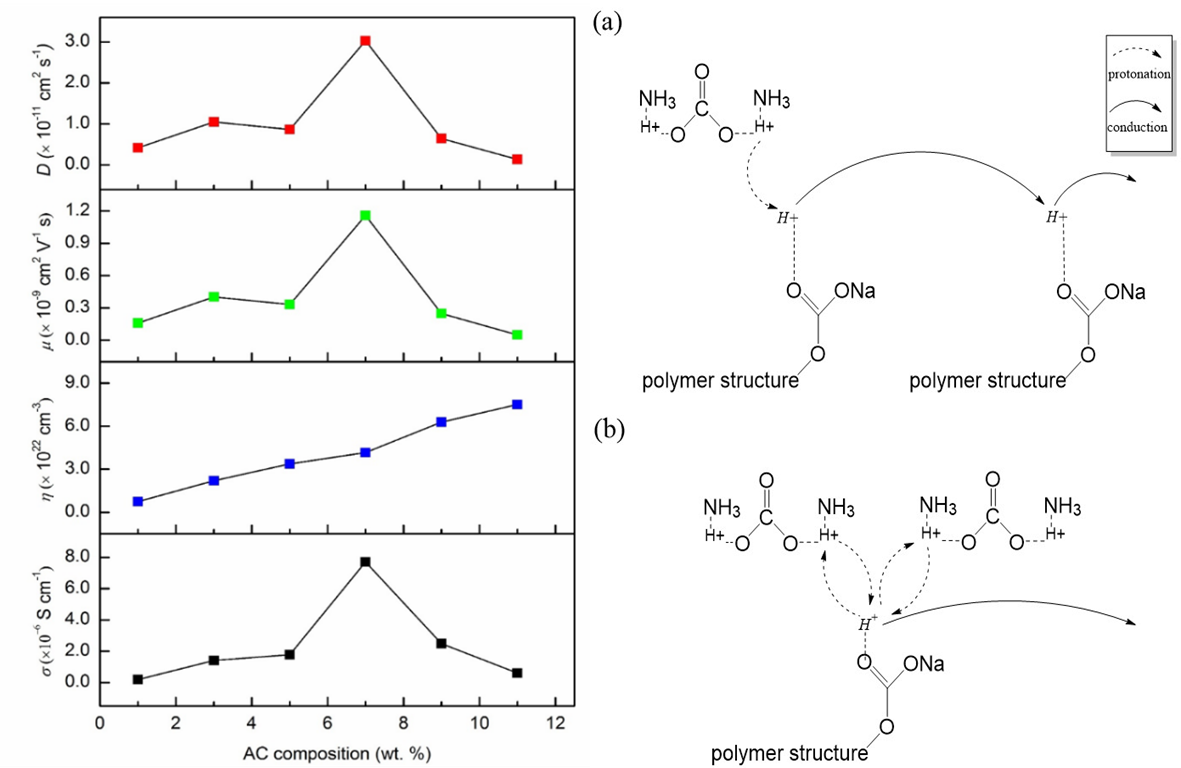
3.1. XRD Analysis
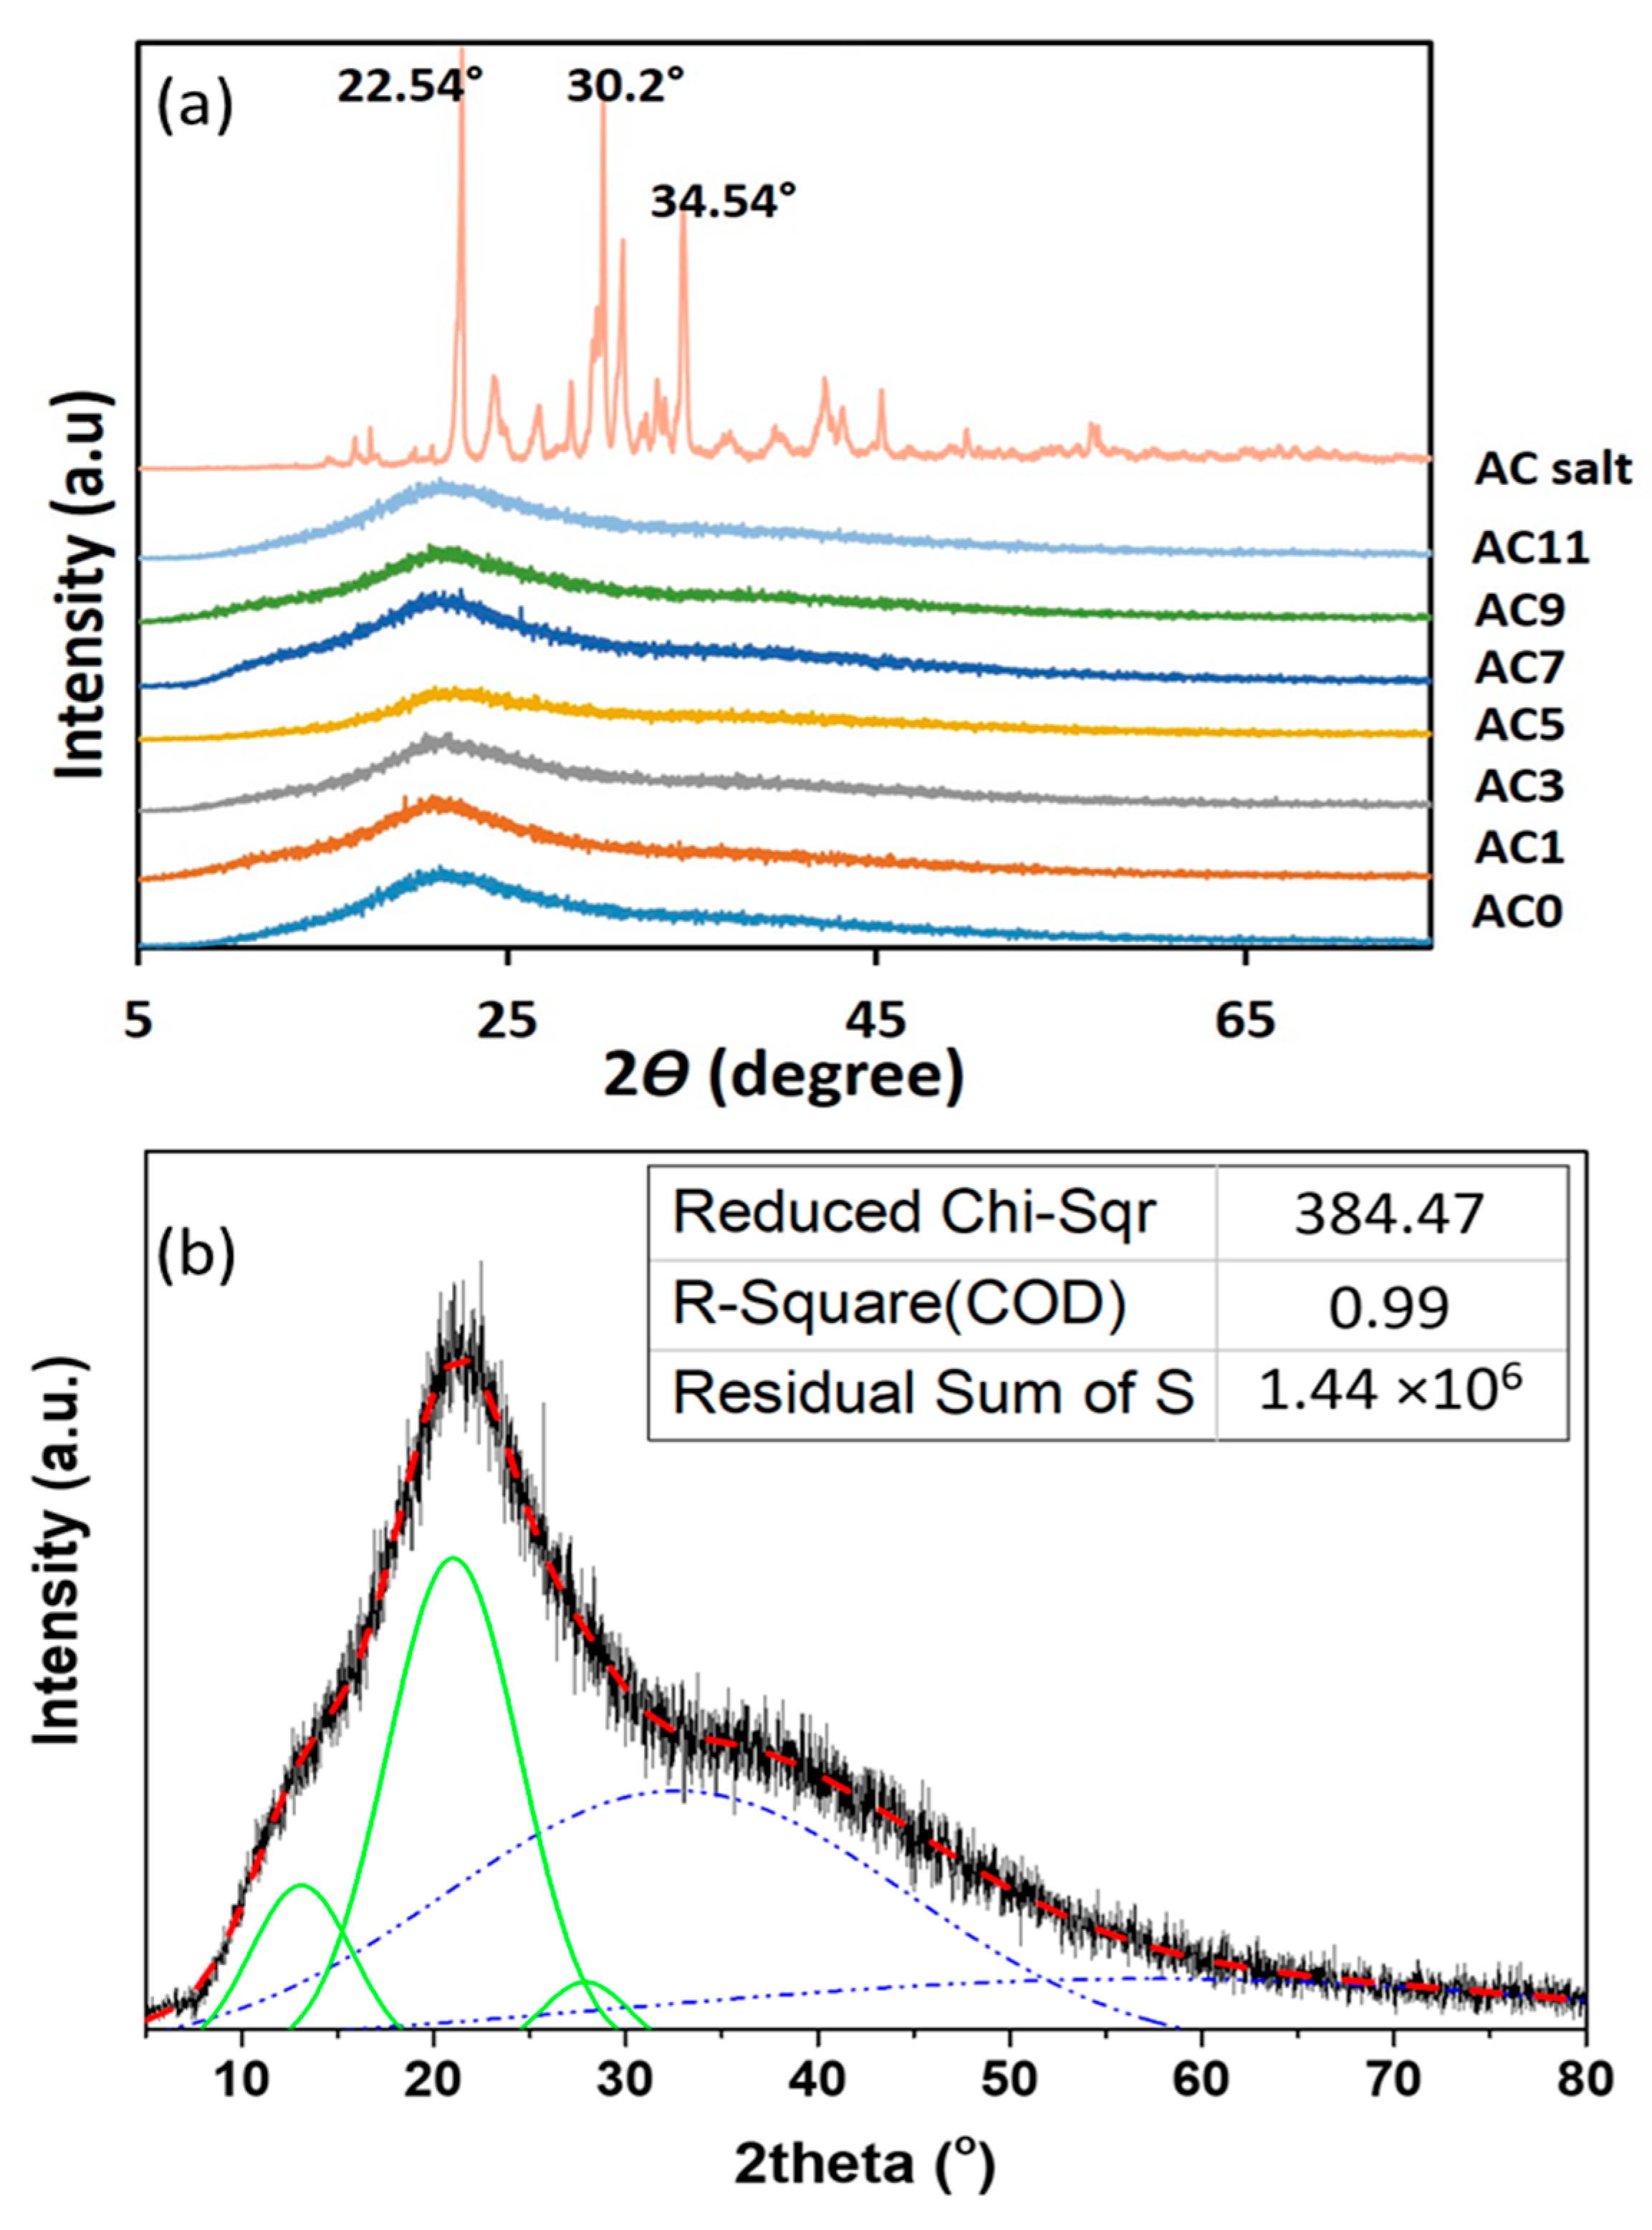
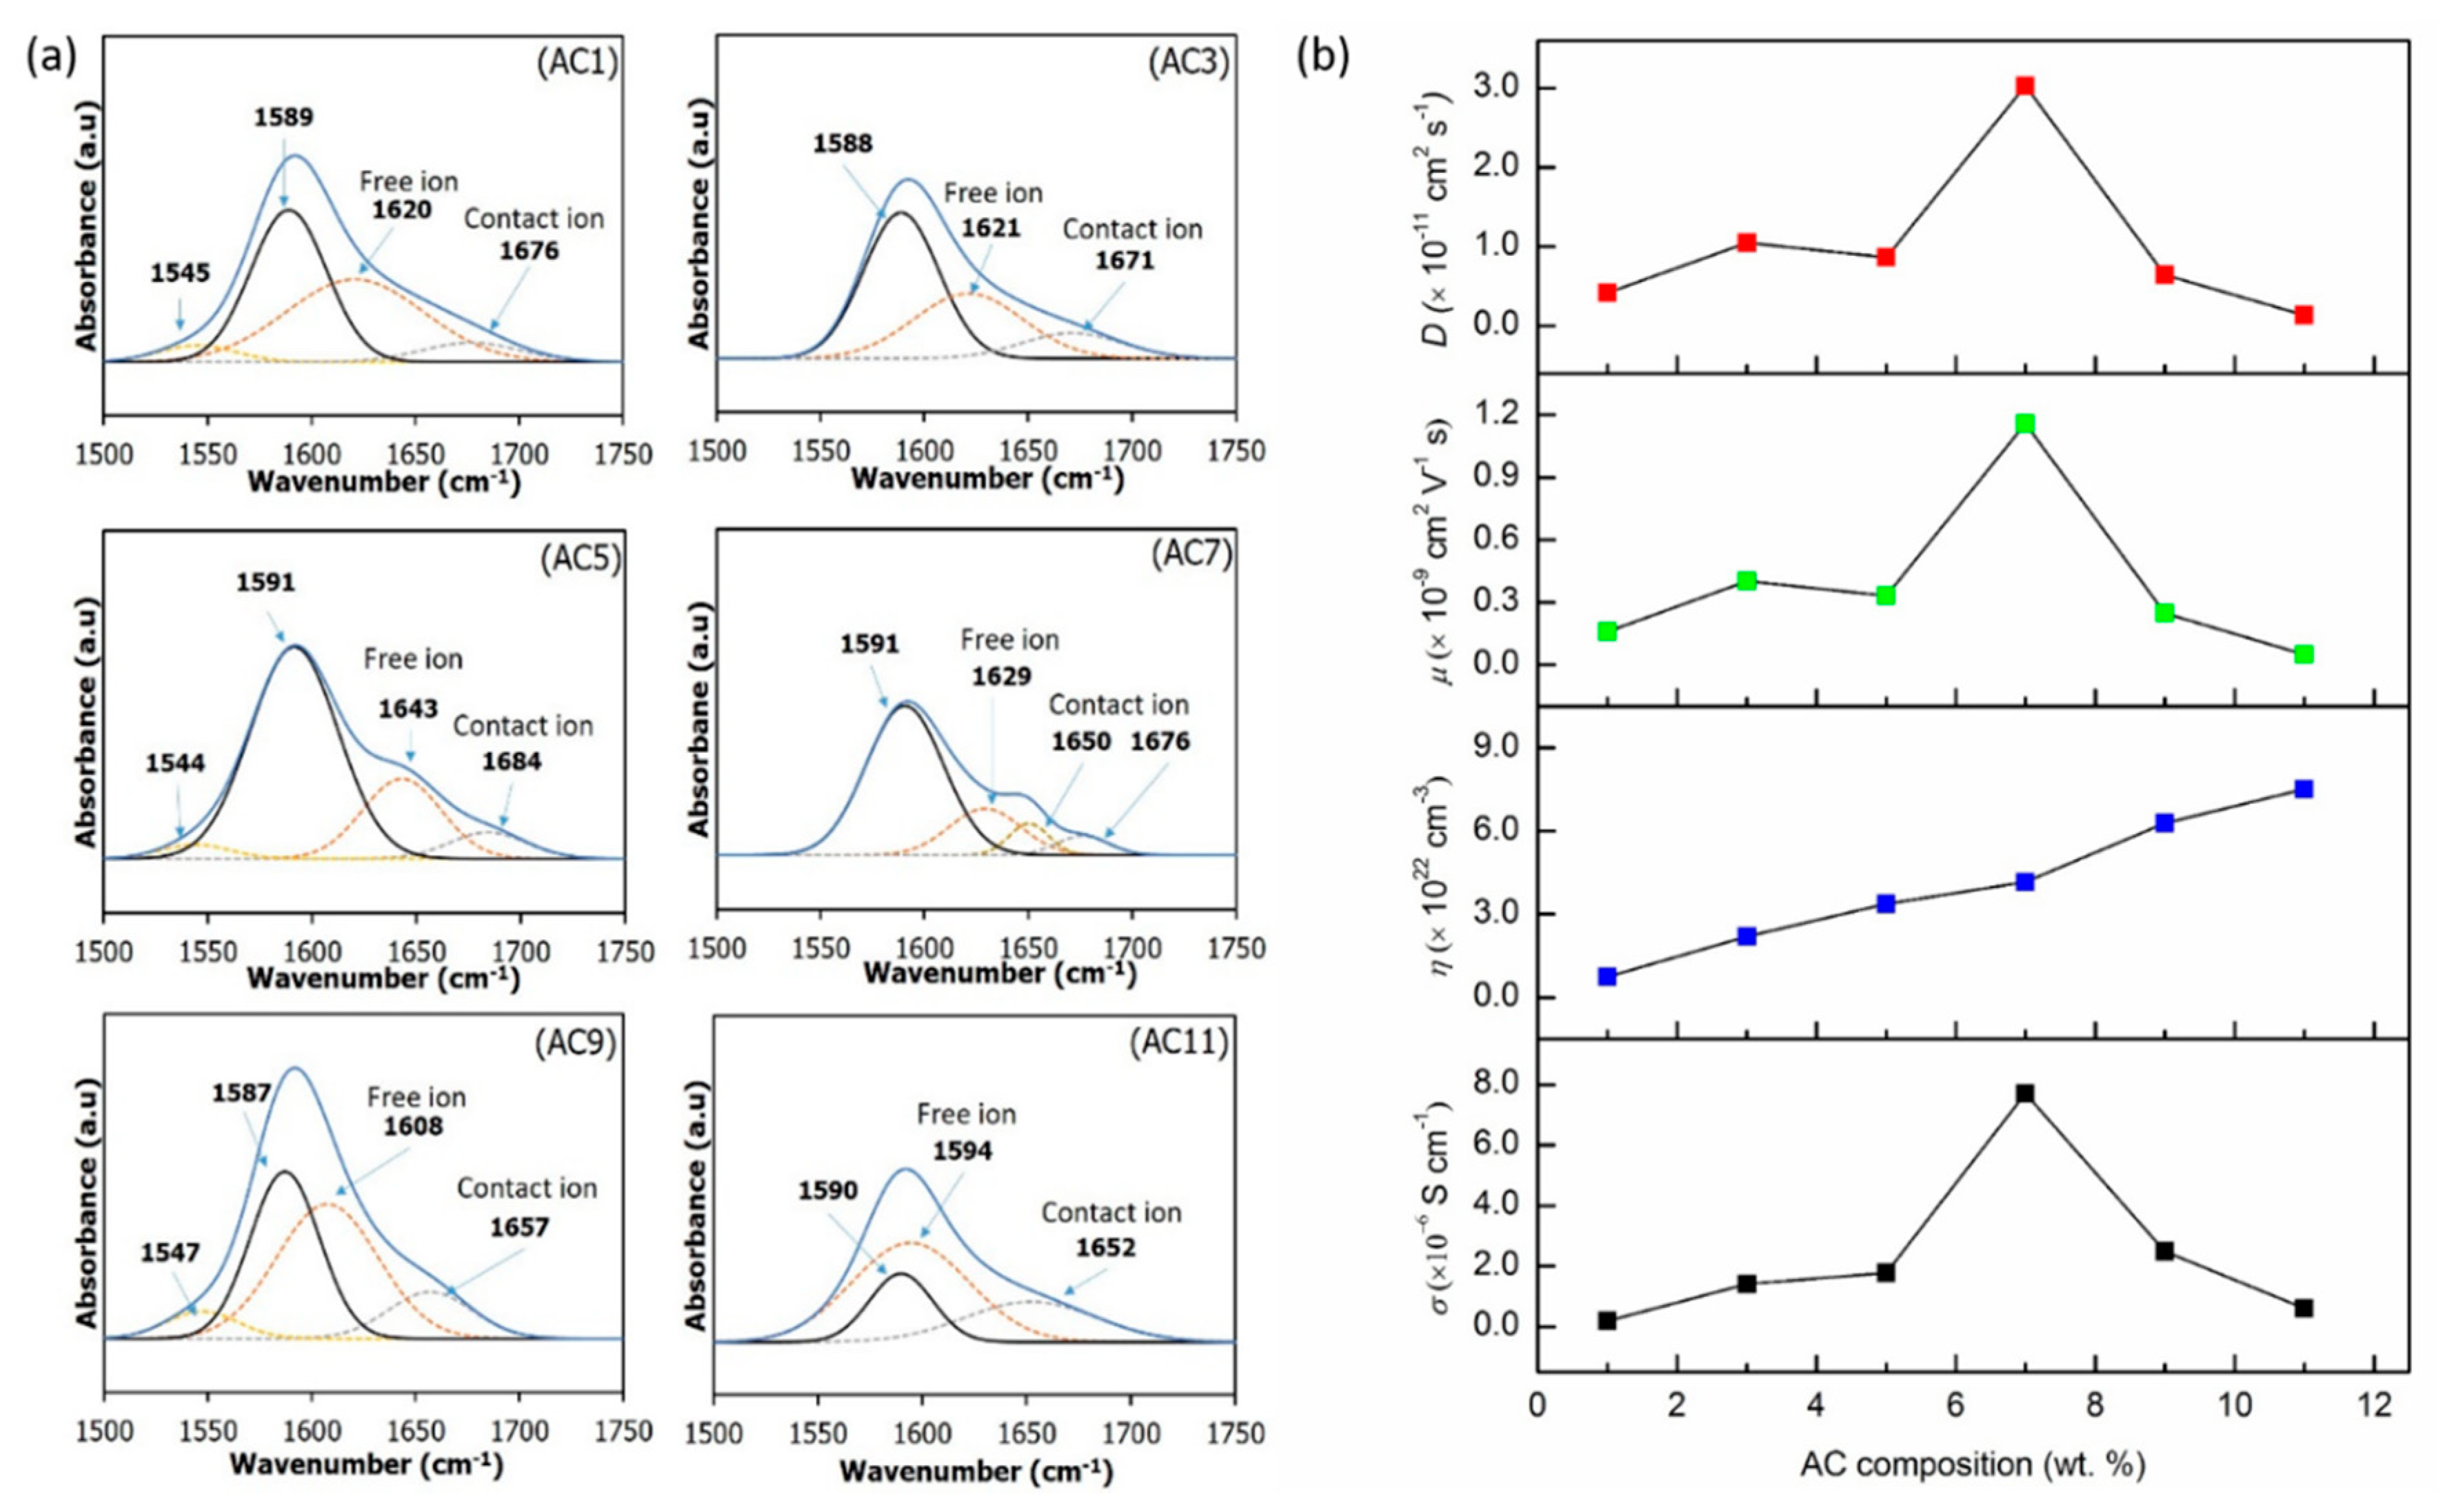
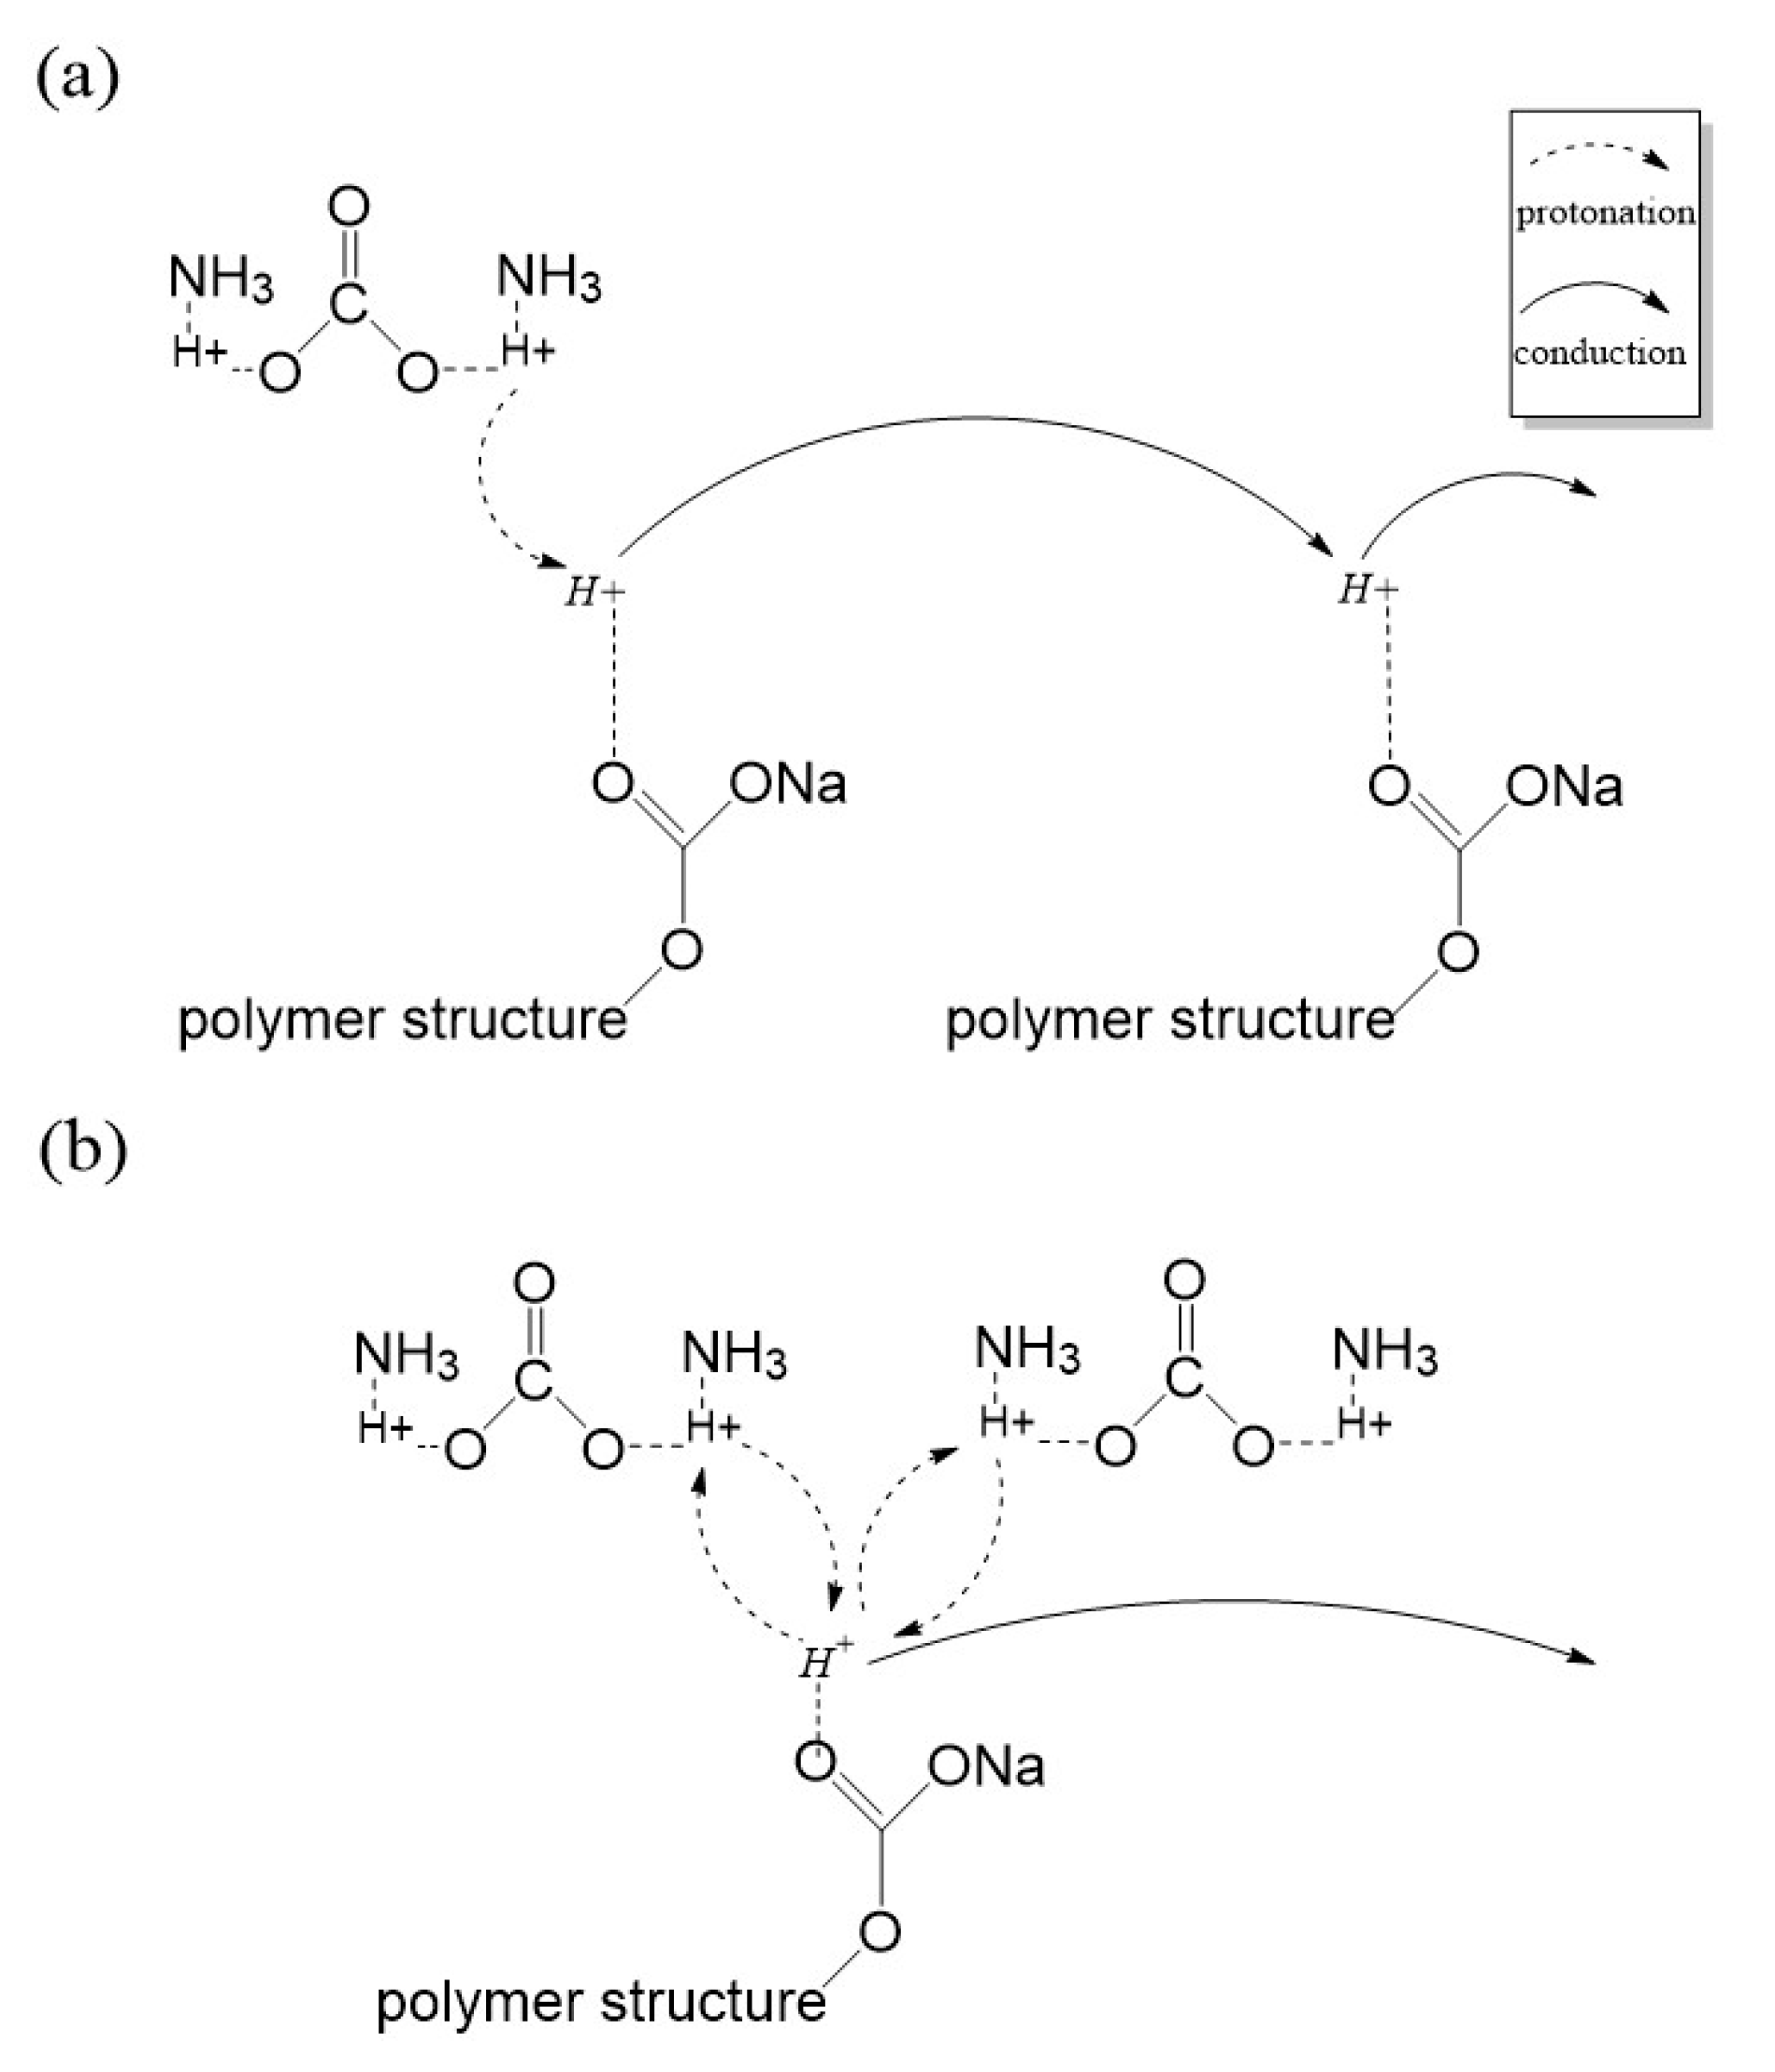
3.2. FTIR Analysis
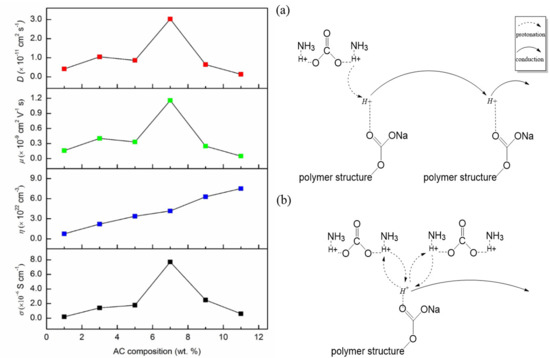
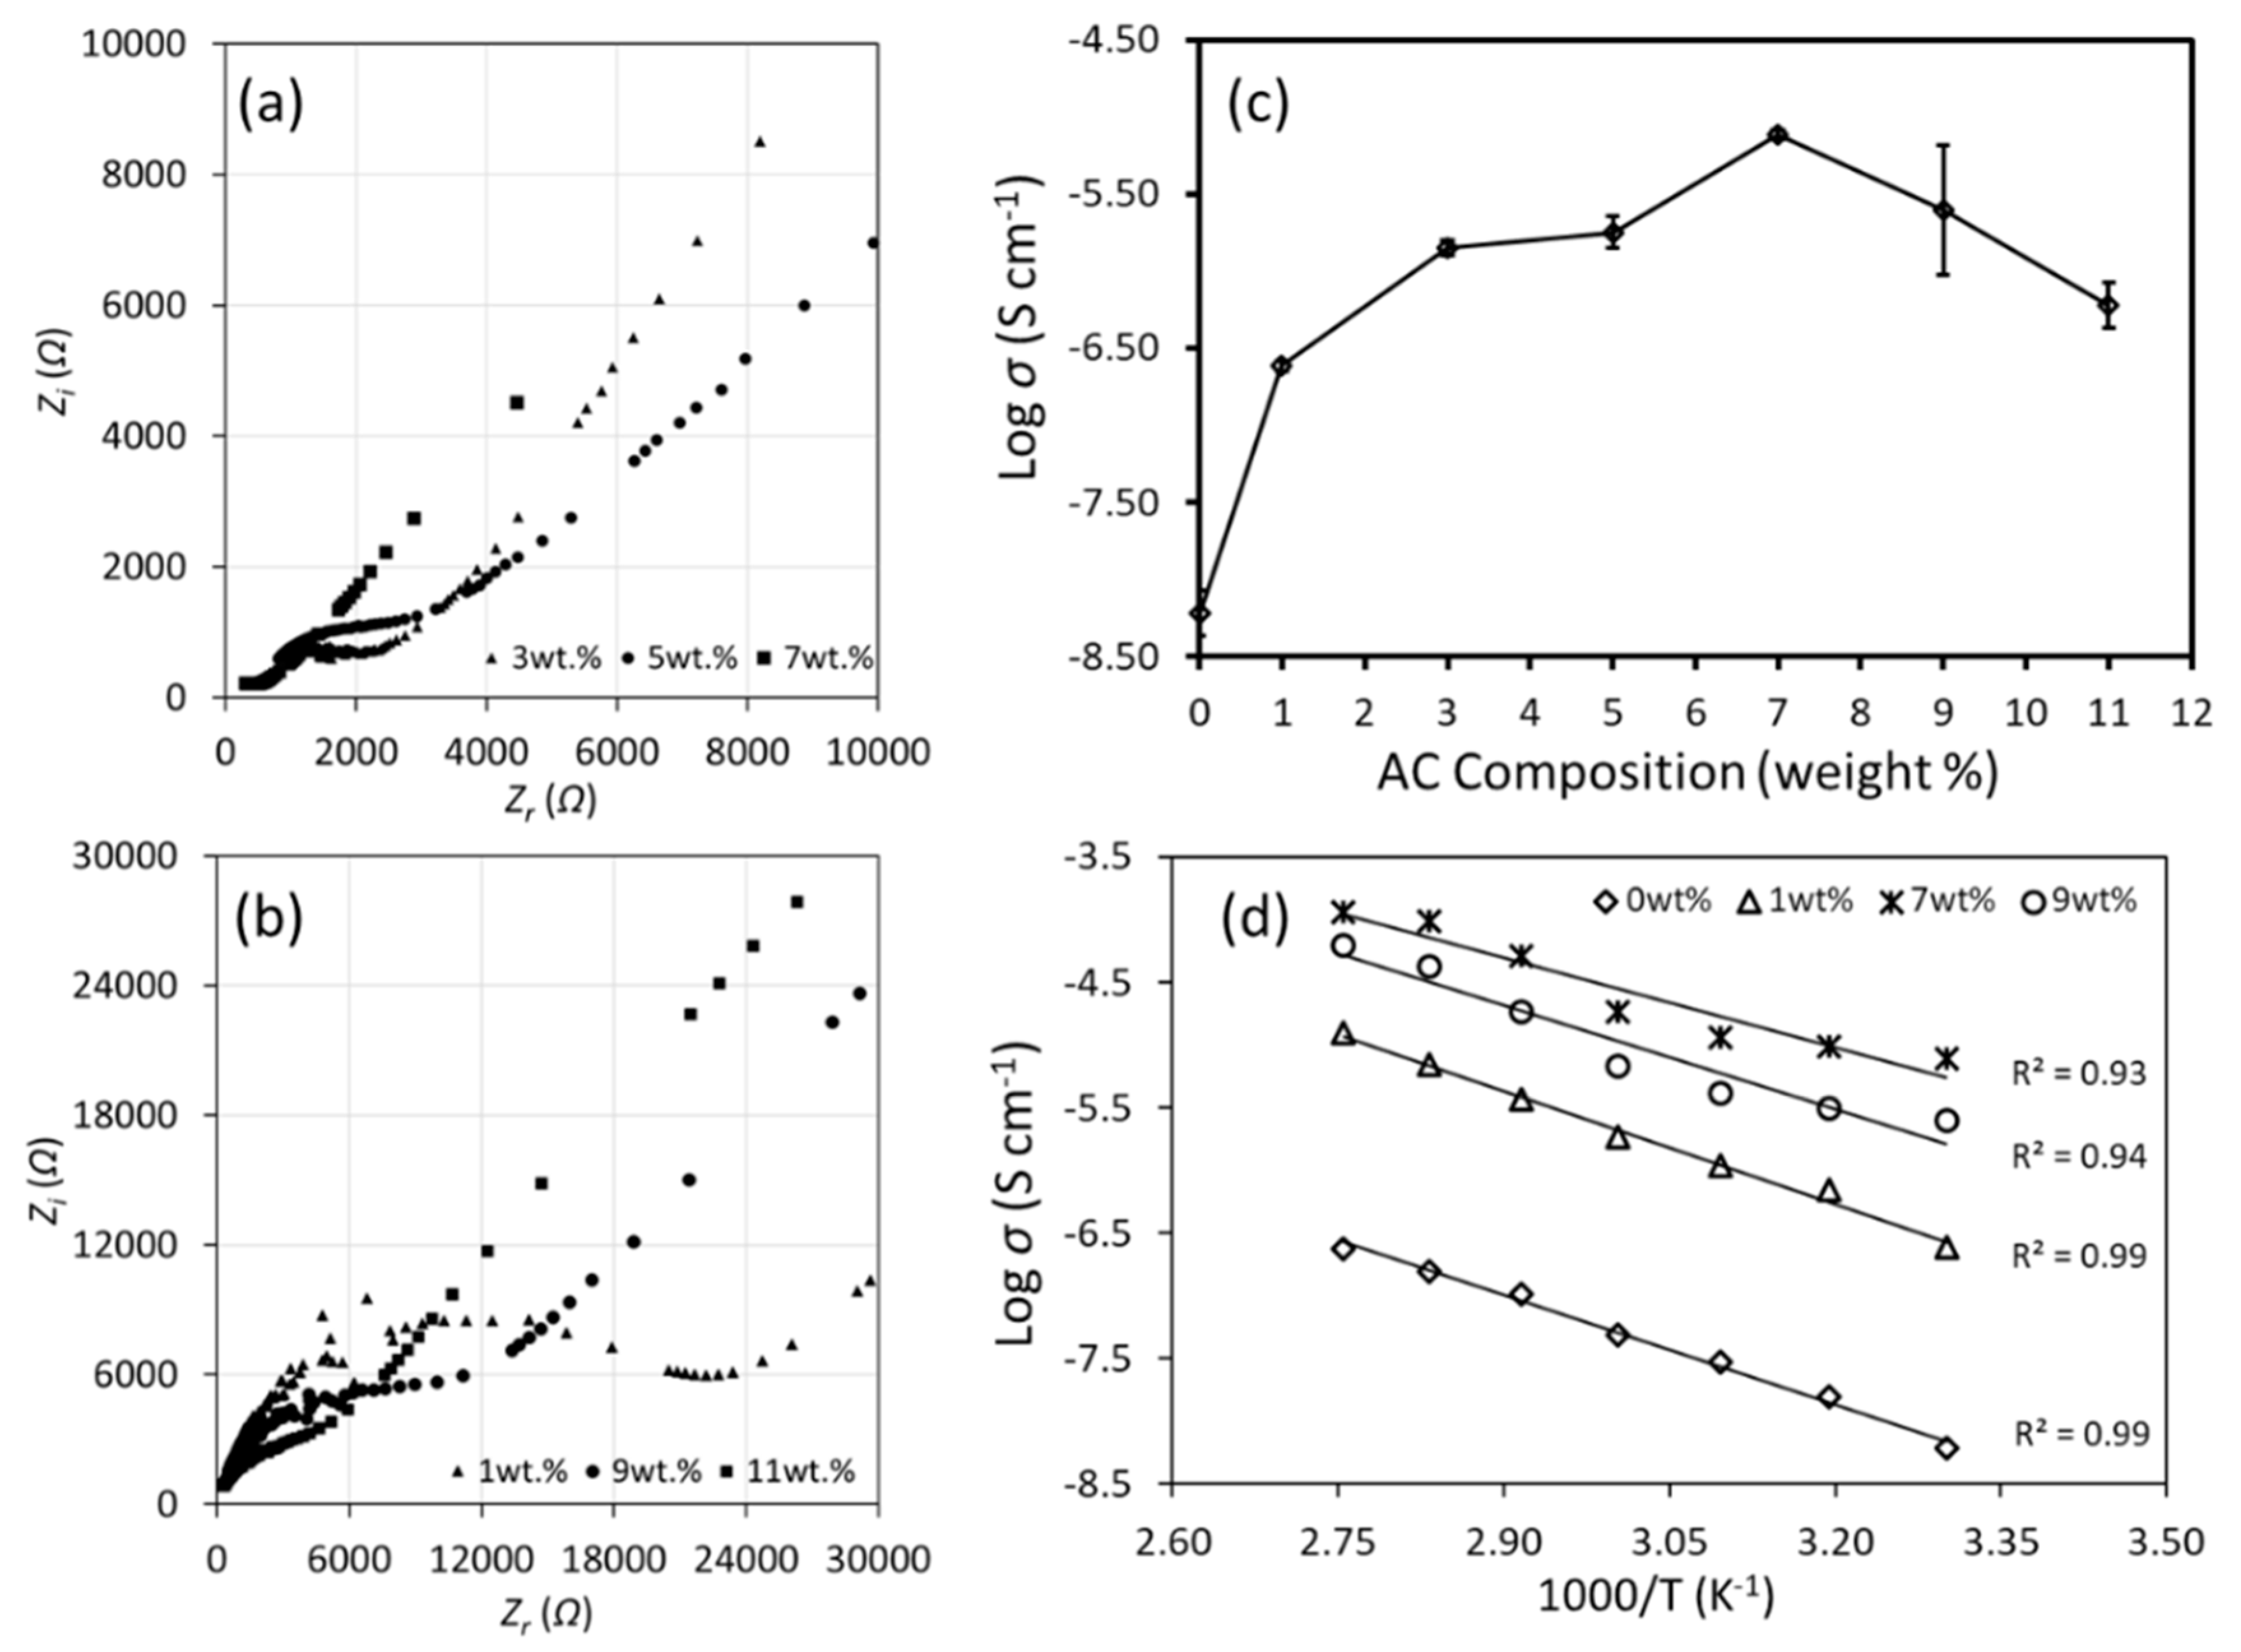
3.3. Ionic Conductivity and Transport Properties
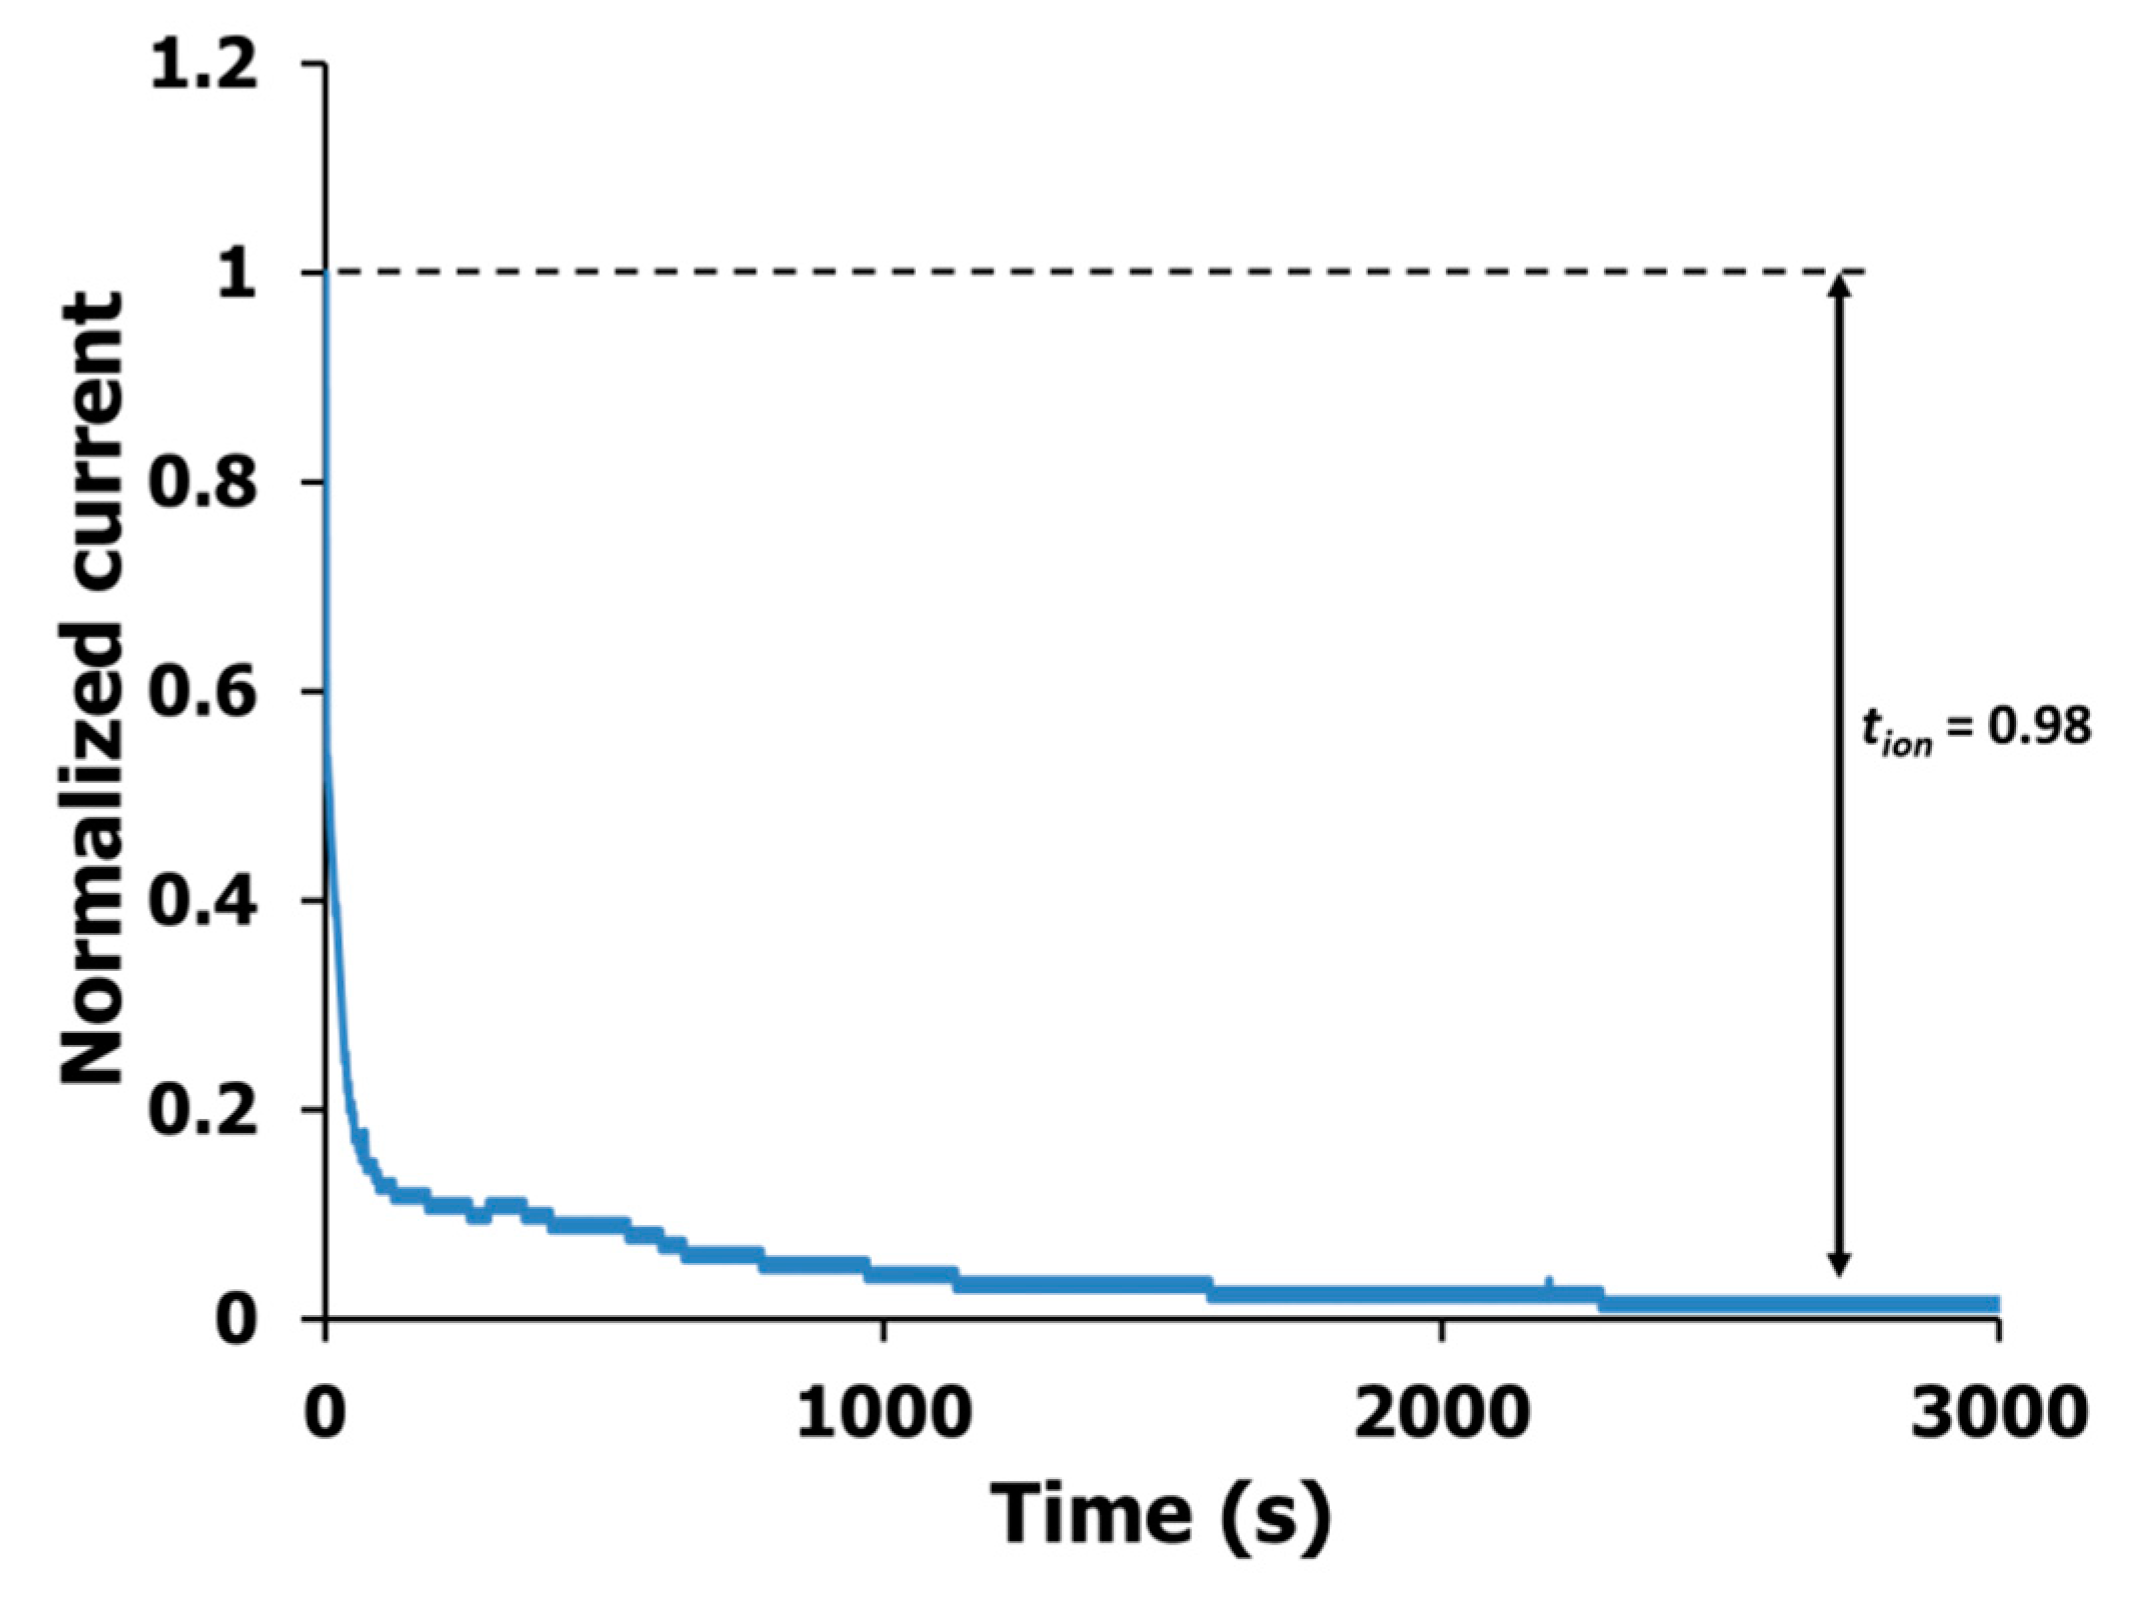
3.4. Transference Number Analysis
4. Conclusions
Supplementary Materials
Author Contributions
Funding
Acknowledgments
Conflicts of Interest
References
- Shi, S.; Gao, J.; Liu, Y.; Zhao, Y.; Wu, Q.; Ju, W.; Ouyang, C.; Xiao, R. Multi-scale computation methods: Their applications in lithium-ion battery research and development. Chin. Phys. B 2016, 25, 018212. [Google Scholar] [CrossRef]
- Goodenough, J.B.; Kim, Y.S. Challenges for rechargeable batteries. J. Power Sources 2011, 196, 6688–6694. [Google Scholar] [CrossRef]
- Kerdphol, T.; Qudaih, Y.; Mitani, Y. Optimum battery energy storage system using PSO considering dynamic demand response for microgrids. Int. J. Electr. Power Energy Syst. 2016, 83, 58–66. [Google Scholar] [CrossRef]
- Yue, L.P.; Ma, J.; Zhang, J.J.; Zhao, J.W.; Dong, S.M.; Liu, Z.H.; Cui, G.L.; Chen, L.Q. All solid-state polymer electrolytes for high-performance lithium ion batteries. Energy Storage Mater. 2016, 5, 139–164. [Google Scholar] [CrossRef]
- Chai, M.N.; Isa, M.I.N. Electrical Characterization and Ionic Transport Properties of Carboxyl Methylcellulose-Oleic Acid Solid Polymer Electrolytes. Int. J. Polym. Anal. Charact. 2013, 18, 280–286. [Google Scholar] [CrossRef]
- Zhang, Y.X.; Zuo, M.; Song, Y.H.; Yan, X.P.; Zheng, Q. Dynamic rheology and dielectric relaxation of poly(vinylidene fluoride)/poly(methyl methacrylate) blends. Compo. Sci. Technol. 2015, 106, 39–46. [Google Scholar] [CrossRef]
- Khan, M.M.A.; Rafiudin; Inamudin. PVC based polyvinyl alcohol zinc oxide composite membrane: Synthesis and electrochemical characterization for heavy metal ions. J. Ind. Eng. Chem. 2013, 19, 1365–1370. [Google Scholar] [CrossRef]
- Jacques, E.; Kjell, M.H.; Zenkert, D.; Lindbergh, G.; Behm, M.; Willgert, M. Impact of electrochemical cycling on the tensile properties of carbon fibres for structural lithium-ion composite batteries. Compos. Sci. Technol. 2012, 72, 792–798. [Google Scholar] [CrossRef] [Green Version]
- Chatterjee, B.; Kulshrestha, N.; Gupta, P.N. Nano composite solid polymer electrolytes based on biodegradable polymers starch and poly vinyl alcohol. Measurement 2016, 82, 490–499. [Google Scholar] [CrossRef]
- Alves, R.; Donoso, J.P.; Magon, C.J.; Silva, I.D.A.; Pawlicka, A.; Silva, M.M. Solid polymer electrolytes based on chitosan and europium triflate. J. Non-Cryst. Solids. 2016, 432, 307–312. [Google Scholar] [CrossRef]
- Basu, T.; Tarafdar, S. Influence of gamma irradiation on the electrical properties of LiClO4-gelatin solid polymer electrolytes: Modelling anomalous diffusion through generalized calculus. Radiat. Phys. Chem. 2016, 125, 180–198. [Google Scholar] [CrossRef]
- Raphael, E.; Avellaneda, C.O.; Manzolli, B.; Pawlicka, A. Agar-based films for application as polymer electrolytes. Electrochim. Acta 2010, 55, 1455–1459. [Google Scholar] [CrossRef]
- Liao, H.Y.; Zhang, H.Y.; Hong, H.G.; Li, Z.H.; Qin, G.; Zhu, H.P.; Lin, Y.X. Novel cellulose aerogel coated on polypropylene separators as gel polymer electrolyte with high ionic conductivity for lithium-ion batteries. J. Membrane Sci. 2016, 514, 332–339. [Google Scholar] [CrossRef]
- Colò, F.; Bella, F.; Nair, J.R.; Destro, M.; Gerbaldi, C. Cellulose-based novel hybrid polymer electrolytes for green and efficient Na-ion batteries. Electrochim. Acta 2015, 174, 185–190. [Google Scholar] [CrossRef]
- Hafiza, M.N.; Isa, M.I.N. Conduction mechanism via correlated barrier hopping in EC-plasticized 2-hydroxyehyl cellulose-ammonium nitrate solid polymer electrolyte. IOP Conf. Ser. Mater. Sci. Eng. 2018, 440, 012039. [Google Scholar] [CrossRef]
- Sasso, C.; Beneventia, D.; Zeno, E.; Conil, M.P.; Chaussya, D.; Belgacema, M.N. Carboxymethyl cellulose: A conductivity enhancer and film-forming agent for processable polypyrrole from aqueous medium. Synth. Met. 2011, 161, 397–403. [Google Scholar] [CrossRef]
- Kamarudin, K.H.; Isa, M.I.N. Structural and DC Ionic conductivity studies of carboxymethyl cellulose doped with ammonium nitrate as solid polymer electrolytes. Int. J. Phys. Sci. 2013, 8, 1581–1587. [Google Scholar] [CrossRef]
- Sohaimy, M.I.H.; Isa, M.I.N. Conductivity and dielectric analysis of cellulose based solid polymer electrolytes doped with ammonium carbonate (NH4CO3). Appl. Mech. 2015, 719–720, 67–72. [Google Scholar] [CrossRef]
- Ramlli, M.A.; Isa, M.I.N. Structural and Ionic Transport Properties of Protonic Conducting Solid Biopolymer Electrolytes Based on Carboxymethyl Cellulose Doped with Ammonium Fluoride. J. Phys. Chem. B 2016, 120, 11567–11573. [Google Scholar] [CrossRef]
- Rice, M.J.; Roth, W.L. Ionic transport in super ionic conductors: A theoretical model. J. Solid State Chem. 1972, 4, 294–310. [Google Scholar] [CrossRef]
- Bandara, T.M.W.J.; Mellander, B.E. Ionic Liquids: Theory, Properties, New Approaches; InTech: London, UK, 2011; pp. 383–406. [Google Scholar] [CrossRef] [Green Version]
- Petrowsky, M.; Frech, R. Concentration dependence of ionic transport in dilute organic electrolyte solutions. J. Phys. Chem. B 2008, 112, 8285–8290. [Google Scholar] [CrossRef] [PubMed]
- Fuzlin, A.F.; Bakri, N.A.; Sahraoui, B.; Samsudin, A.S. Study on the effect of lithium nitrate in ionic conduction properties based alginate biopolymer electrolytes. Mater. Res. Express 2020, 7, 015902. [Google Scholar] [CrossRef]
- Othman, L.; Md Isa, K.B.; Osman, Z.; Yahya, R. Ionic Transport Studies of Gel Polymer Electrolytes Containing Sodium Salt. Mater. Today Proc. 2017, 4, 5112–5129. [Google Scholar] [CrossRef]
- Ye, L.; Feng, Z. Polymer Electrolytes Fundamentals and Applications; Woodhead Publishing: Cambridge, UK, 2010; pp. 550–582. [Google Scholar] [CrossRef]
- Pradeepa, P.; Raj, S.E.; Sowmya, G.; Mary, J.K.; Prabhu, M.R. Optimization of hybrid polymer electrolytes with the effect of lithium salt concentration in PEO/PVdF-HFP blends. Mater. Sci. Eng. B 2016, 205, 6–17. [Google Scholar] [CrossRef]
- Mohamad, A.A.; Mohamad, N.S.; Yahya, M.Z.A.; Othman, R.; Ramesh, S.; Alias, Y.; Arof, A.K. Ionic conductivity studies of poly(vinyl alcohol) alkaline solid polymer electrolyte and its use in nickel-zinc cells. Solid State Ion. 2003, 156, 171–177. [Google Scholar] [CrossRef]
- Mejenom, A.A.; Hafiza, M.N.; Isa, M.I.N. X-Ray diffraction and infrared spectroscopic analysis of solid biopolymer electrolytes based on dual blend carboxymethyl cellulose-chitosan doped with ammonium bromide. ASM Sci. J. 2018, 11, 37–46. [Google Scholar]
- Kumar, R.; Sharma, S.; Pathak, D.; Dhiman, N.; Arora, N. Ionic conductivity, FTIR and thermal studies of nano-composite plasticized proton conducting polymer electrolytes. Solid State Ion. 2017, 305, 57–62. [Google Scholar] [CrossRef]
- Dhatarwal, P.; Sengwa, R.J. Dielectric relaxation, Li-ion transport, electrochemical, and structural behaviour of PEO/PVDF/LiClO4/TiO2/PC-based plasticized nanocomposite solid polymer electrolyte films. Compos Commun. 2020, 17, 182–191. [Google Scholar] [CrossRef]
- Hafiza, M.N.; Isa, M.I.N. Solid Polymer electrolyte production from 2-hydroxyethyl cellulose: Effect of ammonium nitrate composition on its structural properties. Carbohydr. Polym. 2017, 165, 123–131. [Google Scholar] [CrossRef]
- Shukur, M.F.; Ithnin, R.; Kadir, M.F.Z. Electrical characterization of corn starch-LiOAc electrolytes and application in electrochemical double layer capacitor. Electrochim. Acta 2014, 136, 204–216. [Google Scholar] [CrossRef]
- Ramesh, S.; Lu, S.C. Effect of lithium salt concentration on crystallinity of poly(vinylidene fluoride-co-hexafluoropropylene)-based solid polymer electrolytes. J. Mol. Struct. 2011, 994, 403–409. [Google Scholar] [CrossRef]
- Chai, M.N.; Isa, M.I.N. The Oleic Acid Composition Effect on the Carboxymethyl Cellulose Based Biopolymer Electrolyte. J. Cryst. Process Technol. 2013, 3, 1–4. [Google Scholar] [CrossRef] [Green Version]
- Hema, M.; Selvasekerapandian, S.; Sakunthala, A.; Arunkumar, D.; Nithya, H. Structural, vibrational and electrical characterization of PVA–NH4Br polymer electrolyte system. Phys. B Condens. Matter 2008, 403, 2740–2747. [Google Scholar] [CrossRef]
- Samsudin, A.S.; Isa, M.I.N. Characterization of carboxy methylcellulose doped with DTAB as new types of biopolymer electrolytes. Bull. Mater. Sci. 2012, 35, 1123–1131. [Google Scholar] [CrossRef]
- Ramlli, M.A.; Isa, M.I.N. Solid Biopolymer Electrolytes Based Carboxymethyl Cellulose Doped With Ammonium Fluoride: Ionic Transport and Conduction Mechanism. Polym. Renew. Resour. 2015, 6, 55–63. [Google Scholar] [CrossRef]
- Khandale, A.P.; Bhoga, S.S.; Gedam, S.K. Study on ammonium acetate salt-added polyvinyl alcohol-based solid proton-conducting polymer electrolytes. Ionics 2013, 19, 1619–1626. [Google Scholar] [CrossRef]
- Buraidah, M.H.; Arof, A.K. Characterization of chitosan/PVA blended electrolyte doped with NH4I. J. Non-Cryst. Solids. 2011, 357, 3261–3266. [Google Scholar] [CrossRef]
- Hassan, M.A.; Gouda, M.E.; Sheha, E. Investigations on the Electrical and Structural Properties of PVA Doped with (NH4)2SO4. J. Appl. Polym. 2010, 116, 1213–1217. [Google Scholar] [CrossRef]
- Kamlesh, P.; Nidhi, A.; Mrigank, M.D.; Chaturvedi, S.K. Effect of Plasticizers on Structural and Dielectric Behaviour of [PEO + (NH4)2C4H8(COO)2] Polymer Electrolyte. J. Polym. 2013, 2013, 752596. [Google Scholar] [CrossRef] [Green Version]
- Arof, A.K.; Amirudin, S.; Yusof, S.Z.; Noor, I.M. A method based on impedance spectroscopy to determine transport properties of polymer electrolytes. Phys. Chem. Chem. Phys. 2014, 16, 1856–1867. [Google Scholar] [CrossRef] [Green Version]
- Hafiza, M.N.; Isa, M.I.N. Correlation between structural, ion transport and ionic conductivity of plasticized 2-hydroxyethyl cellulose based solid biopolymer electrolyte. J. Membr. Sci. 2020, 597, 117176. [Google Scholar] [CrossRef]
- Ritthidej, G.C.; Phaechamud, T.; Koizumi, T. Moist heat treatment on physicochemical change of chitosan salt films. Int. J. Pharm. 2002, 232, 11–22. [Google Scholar] [CrossRef]
- Fadzallah, I.A.; Majid, S.R.; Careem, M.A.; Arof, A.K. A study on ionic interaction in chitosan-oxalic acid polymer electrolyte membranes. J. Membr. Sci. 2014, 463, 65–72. [Google Scholar] [CrossRef]
- Noor, I.S.; Majid, S.R.; Arof, A.K. Poly(vinyl alcohol)-LiBOB complexes for lithium-air cells. Electrochim. Acta 2013, 102, 149–160. [Google Scholar] [CrossRef]
- Md Isa, K.B.; Osman, Z.; Arof, A.K.; Othman, L.; Zainol, N.H.; Samin, S.M.; Chong, W.G.; Kamarulzaman, N. Lithium ion conduction and ion-polymer interaction in PVdF-HFP based gel polymer electrolytes. Solid State Ion. 2014, 268, 288–293. [Google Scholar] [CrossRef]
- Chai, M.N.; Isa, M.I.N. Novel Proton Conducting Solid Bio-polymer Electrolytes Based on Carboxymethyl Cellulose Doped with Oleic Acid and Plasticized with Glycerol. Sci. Rep. 2016, 6, 27328. [Google Scholar] [CrossRef] [PubMed]
- Vahini, M.; Muthuvinayagam, M. AC impedance studies on proton conducting biopolymer electrolytes based on pectin. Mater. Lett. 2018, 218, 197–200. [Google Scholar] [CrossRef]
- Rani, M.S.A.; Ahmad, A.; Mohamed, N.S. A comprehensive investigation on electrical characterization and ionic transport properties of cellulose derivative from kenaf fibre-based biopolymer electrolytes. Poly. Bull. 2018, 75, 5061–5074. [Google Scholar] [CrossRef]


| Sample | Weight (g) (± 0.01) | ||
|---|---|---|---|
| CMC | AC | wt.% | |
| AC0 | 2.00 | 0.00 | 0 |
| AC1 | 0.02 | 1 | |
| AC3 | 0.06 | 3 | |
| AC5 | 0.11 | 5 | |
| AC7 | 0.15 | 7 | |
| AC9 | 0.20 | 9 | |
| AC11 | 0.25 | 11 | |
| Sample | Coefficient of Determination, COD (R2) | Residual Sum of Square (×106) (a.u.) | Peak Area (a.u.) | Xc (%) | |
|---|---|---|---|---|---|
| Ac | Aa | ||||
| AC0 | 0.99 | 1.08 | 5547.07 | 7300.18 | 43.18 |
| AC1 | 0.99 | 1.19 | 5056.57 | 6127.60 | 45.21 |
| AC3 | 0.99 | 1.06 | 4333.50 | 8210.93 | 34.55 |
| AC5 | 0.99 | 0.87 | 2764.22 | 4944.47 | 35.86 |
| AC7 | 0.99 | 1.44 | 5744.59 | 12,860.22 | 30.88 |
| AC9 | 0.99 | 1.07 | 5273.33 | 5759.21 | 47.80 |
| AC11 | 0.99 | 1.08 | 5738.11 | 6768.42 | 45.88 |
| Polymer | Ammonium Salt | Wt.% | Ionic Conductivity (Scm−1) | Ref. |
|---|---|---|---|---|
| Carboxymethyl cellulose (CMC) | Ammonium fluoride NH4F | 9 | 6.40 × 10⁻⁷ | [37] |
| Polyvinyl Alcohol (PVA) | Ammonium Acetate NH4CH3COO | 20 | 1.3 × 10⁻⁷ | [38] |
| Chitosan (CS) | Ammonium Iodide NH4NO3 | 45 | 3.73 × 10⁻⁷ | [39] |
| Polyvinyl Alcohol (PVA) | Ammonium Sulfate (NH4)2SO4 | 5 | 1.92 × 10⁻⁹ | [40] |
| Polyethylene Oxide (PEO) | Ammonium Adipate (NH4)2C4H8(COO)2 | 1 | 1.87 × 10⁻⁷ | [41] |
| Carboxymethyl cellulose (CMC) | Ammonium Carbonate (NH4)2CO3 | 7 | 7.71 × 10⁻⁶ | Current work |
| Sample | Coefficient of Determination, COD (R2) | Residual Sum of Square (× 10−2) (a.u.) | Free Ion | Contact Ion | ||
|---|---|---|---|---|---|---|
| Area (a.u.) | (%) | Area (a.u.) | (%) | |||
| AC1 | 0.99 | 1.16 | 126.07 | 85.48 | 21.42 | 14.52 |
| AC3 | 0.99 | 1.74 | 79.73 | 73.52 | 28.71 | 26.48 |
| AC5 | 0.99 | 6.14 | 69.66 | 75.37 | 22.77 | 24.63 |
| AC7 | 0.99 | 2.67 | 36.97 | 59.53 | 25.12 | 40.47 |
| AC9 | 0.99 | 1.70 | 152.35 | 77.81 | 43.46 | 22.19 |
| AC11 | 0.99 | 0.46 | 128.31 | 68.51 | 58.97 | 31.49 |
| Sample | Transference, tion (± 0.01) | Diffusion Coefficient, D (× 10−13 cm2 s−1) | Ionic Mobility, µ (× 10−11 cm−2 v−1 s−1) | ||
|---|---|---|---|---|---|
| Cation | Anion | Cation | Anion | ||
| AC1 | 0.78 | 32.4 | 9.13 | 12.4 | 3.49 |
| AC3 | 0.82 | 86.0 | 18.9 | 32.9 | 7.22 |
| AC5 | 0.92 | 79.6 | 6.92 | 30.5 | 2.65 |
| AC7 | 0.98 | 297.0 | 6.06 | 114.0 | 2.32 |
| AC9 | 0.90 | 58.1 | 6.46 | 22.2 | 2.47 |
| AC11 | 0.92 | 12.1 | 1.05 | 4.6 | 0.40 |
© 2020 by the authors. Licensee MDPI, Basel, Switzerland. This article is an open access article distributed under the terms and conditions of the Creative Commons Attribution (CC BY) license (http://creativecommons.org/licenses/by/4.0/).
Share and Cite
Sohaimy, M.I.H.A.; Isa, M.I.N.M. Natural Inspired Carboxymethyl Cellulose (CMC) Doped with Ammonium Carbonate (AC) as Biopolymer Electrolyte. Polymers 2020, 12, 2487. https://doi.org/10.3390/polym12112487
Sohaimy MIHA, Isa MINM. Natural Inspired Carboxymethyl Cellulose (CMC) Doped with Ammonium Carbonate (AC) as Biopolymer Electrolyte. Polymers. 2020; 12(11):2487. https://doi.org/10.3390/polym12112487
Chicago/Turabian StyleSohaimy, Mohd Ibnu Haikal Ahmad, and Mohd Ikmar Nizam Mohamad Isa. 2020. "Natural Inspired Carboxymethyl Cellulose (CMC) Doped with Ammonium Carbonate (AC) as Biopolymer Electrolyte" Polymers 12, no. 11: 2487. https://doi.org/10.3390/polym12112487