Biocomposites Based on Plasticized Wheat Flours: Effect of Bran Content on Thermomechanical Behavior


Abstract
:1. Introduction
2. Materials and Methods
2.1. Materials
2.2. Preparation of Milled Products, Their Plasticization and Blending
2.3. Characterization of Flours and TPWF-Based Composites
2.3.1. Alveographic Properties
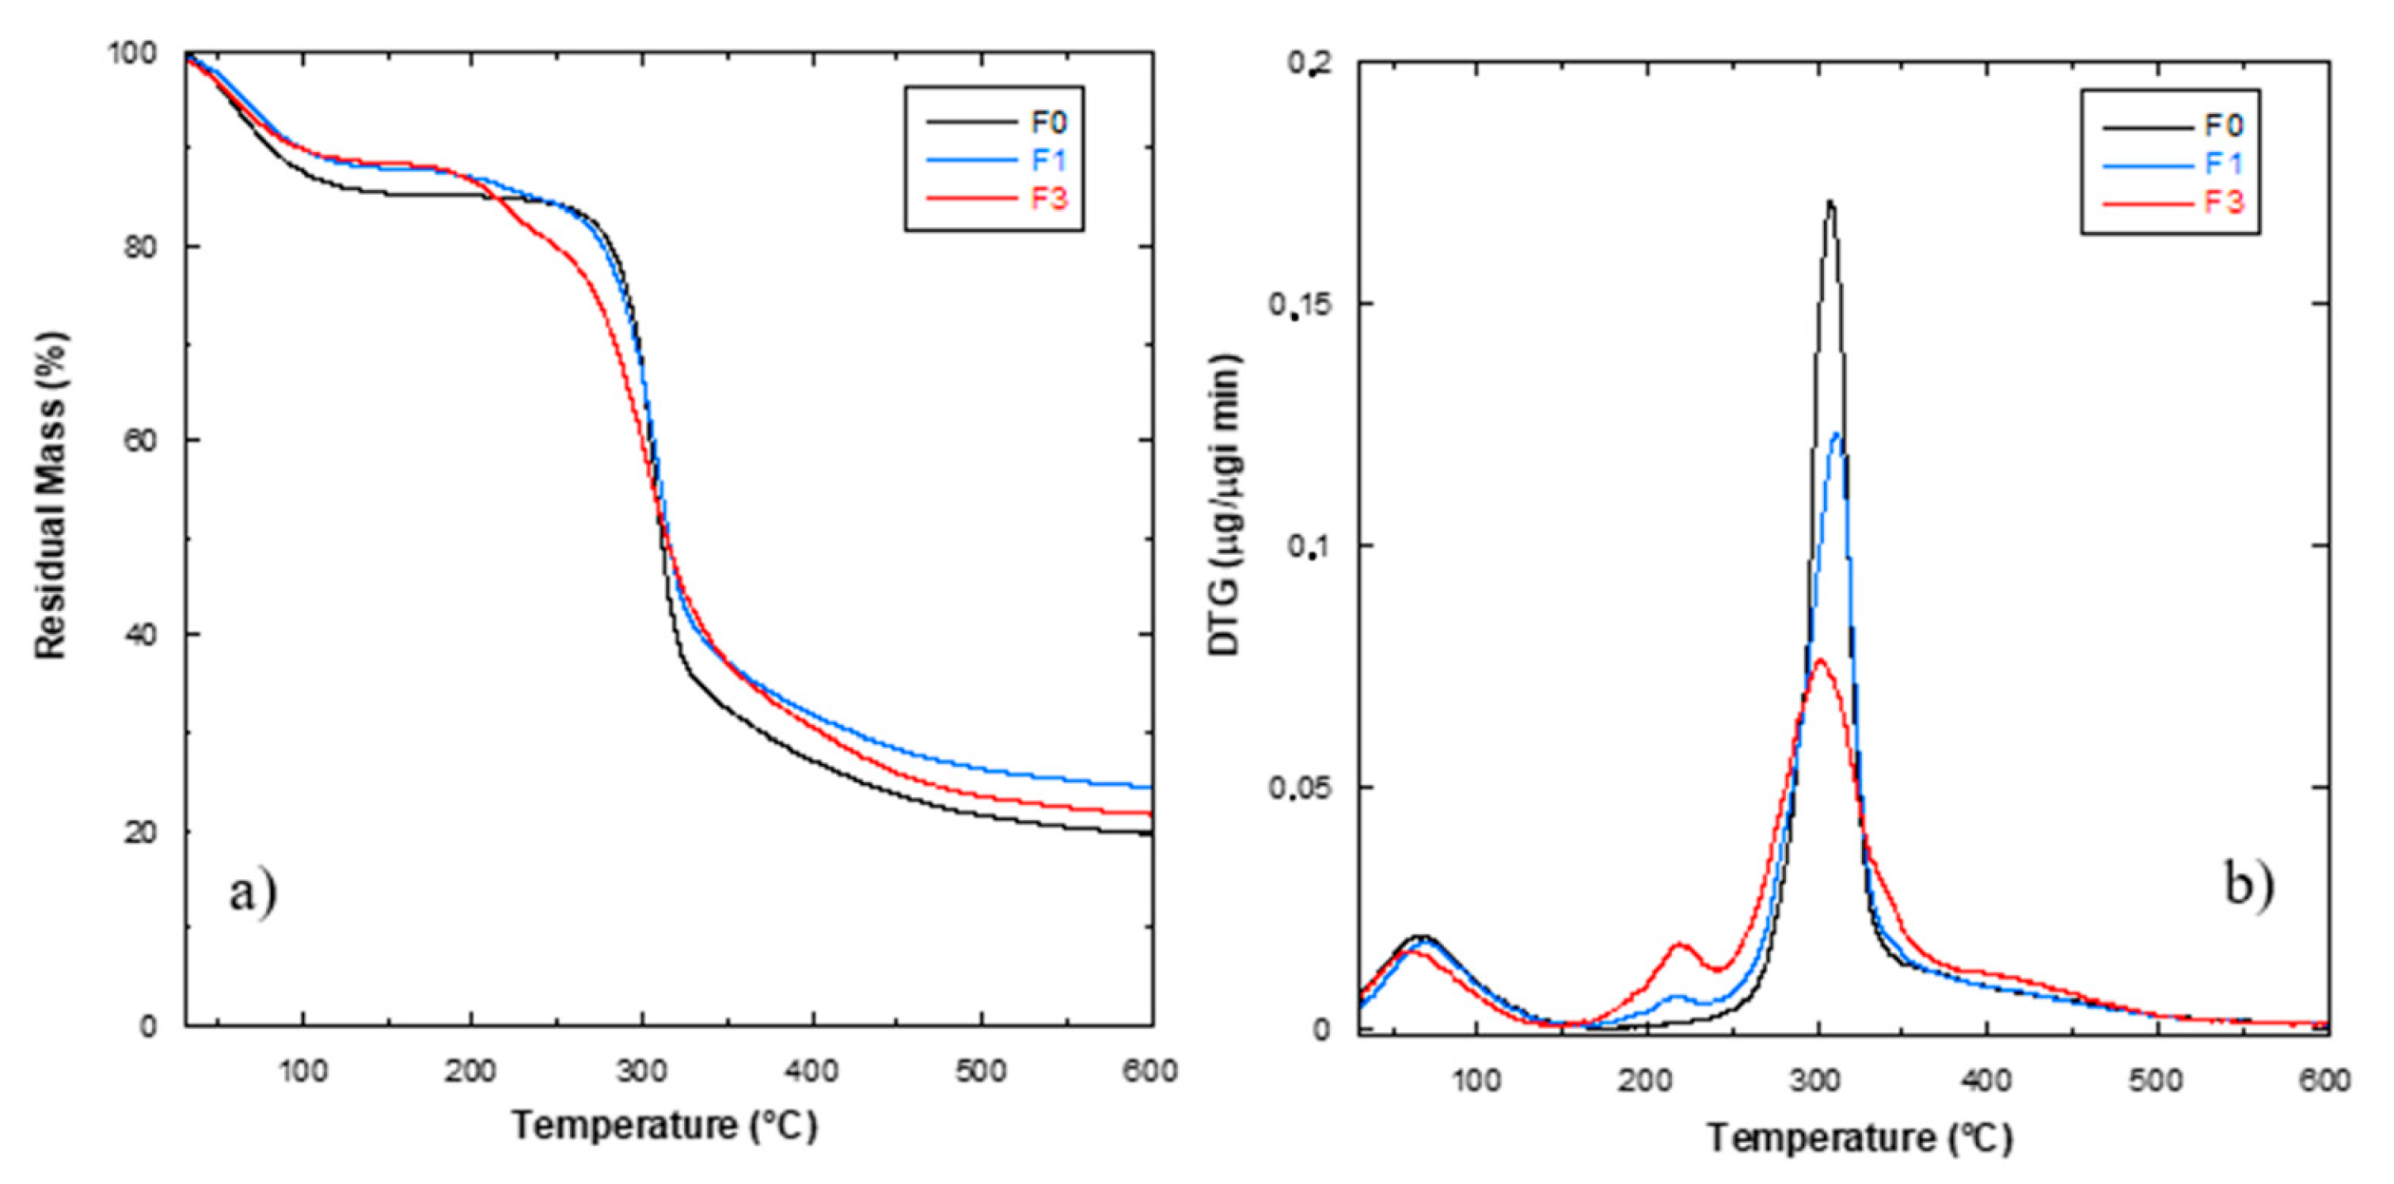
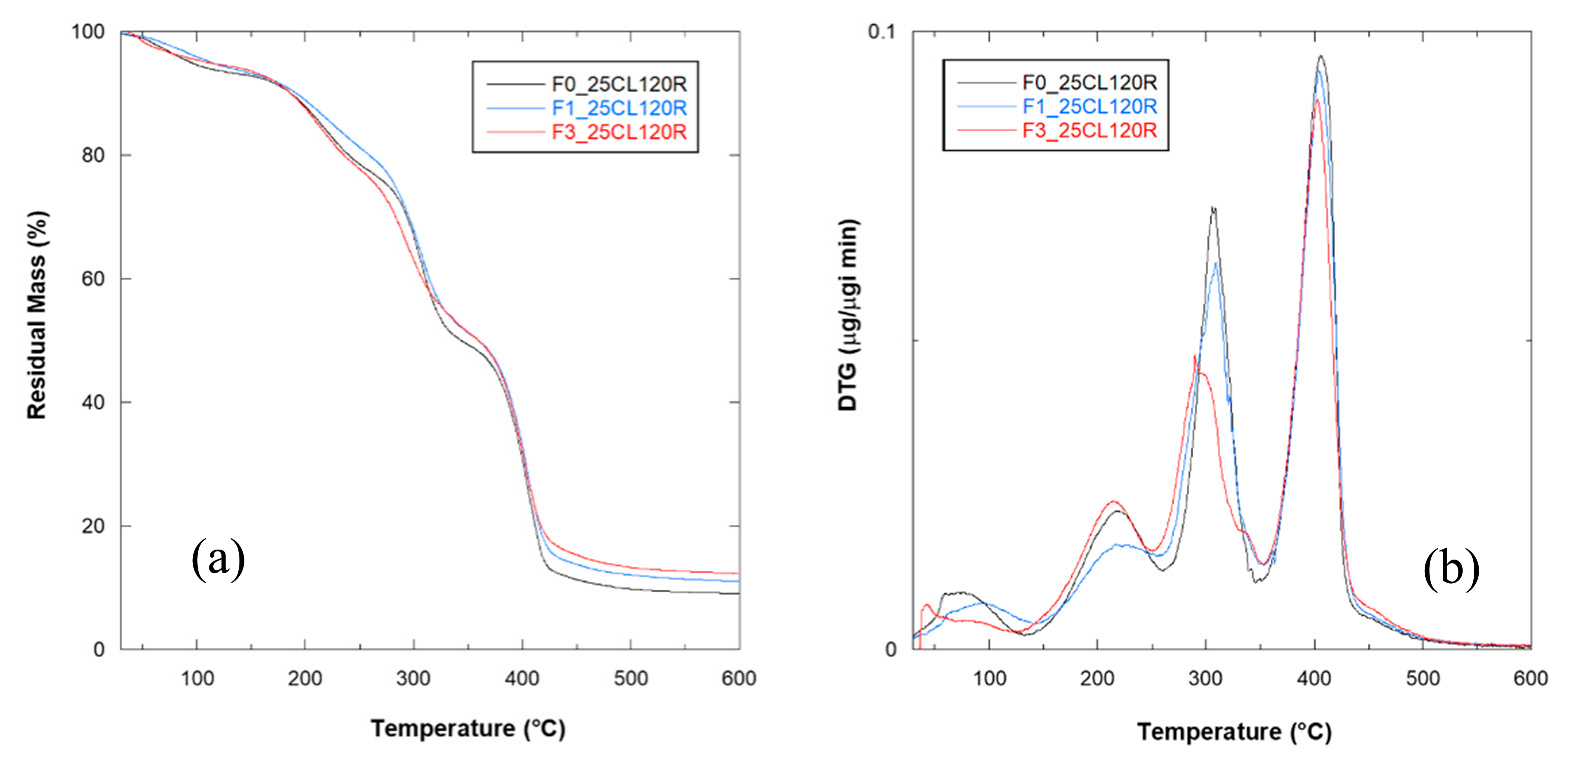
2.3.2. Thermogravimetric Analysis
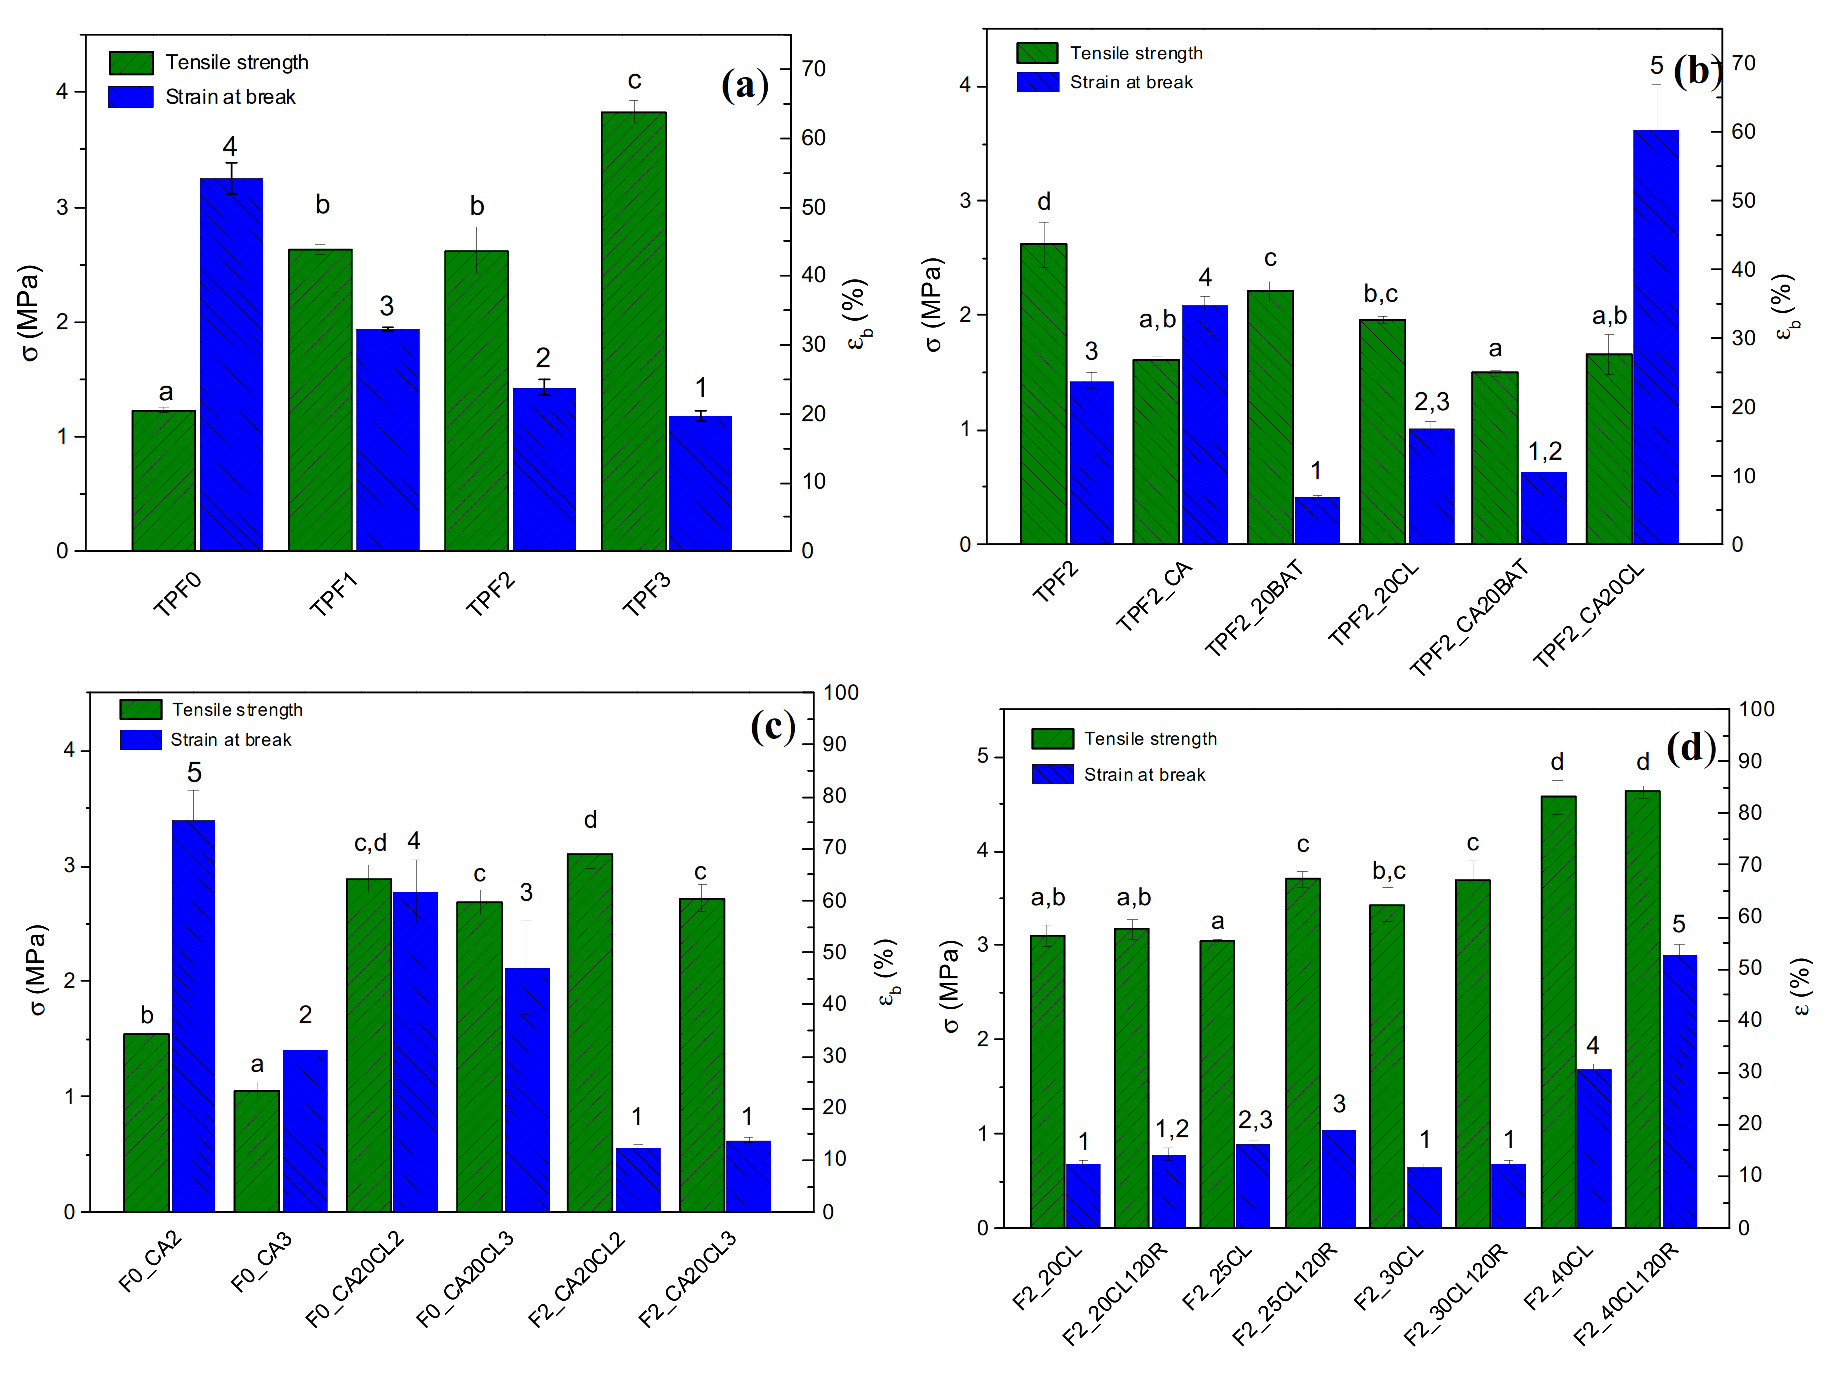
2.3.3. Tensile Tests
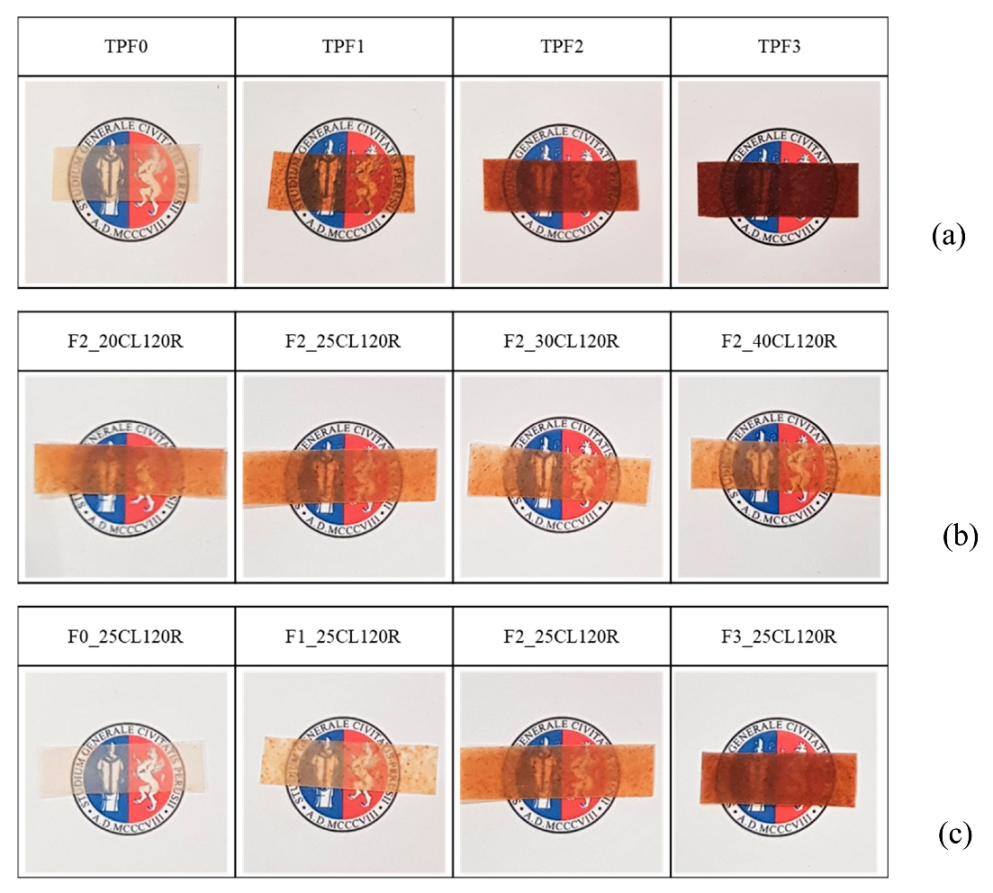
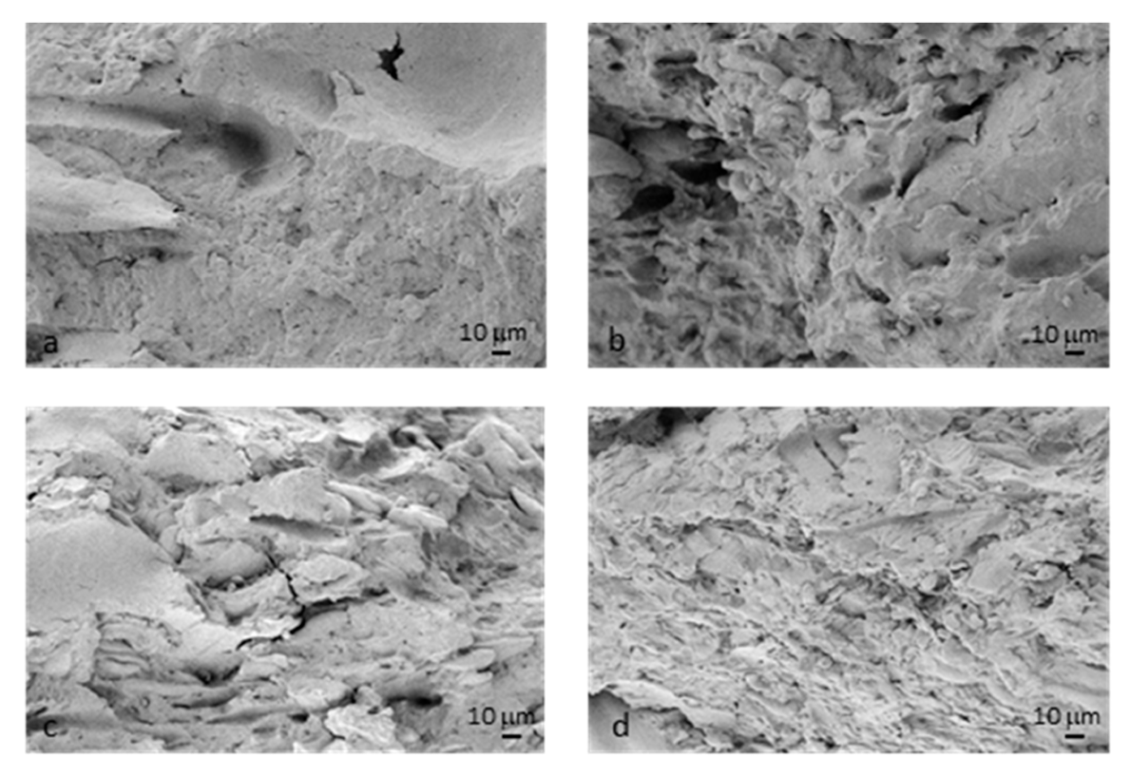
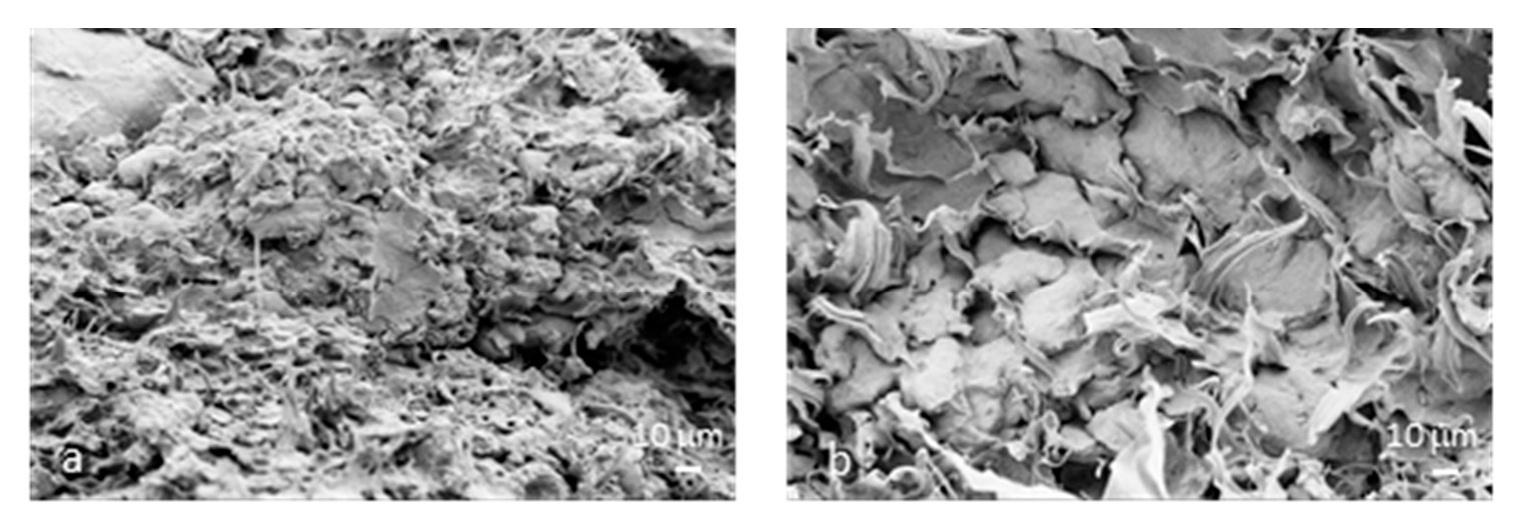
2.3.4. Morphological Evaluation
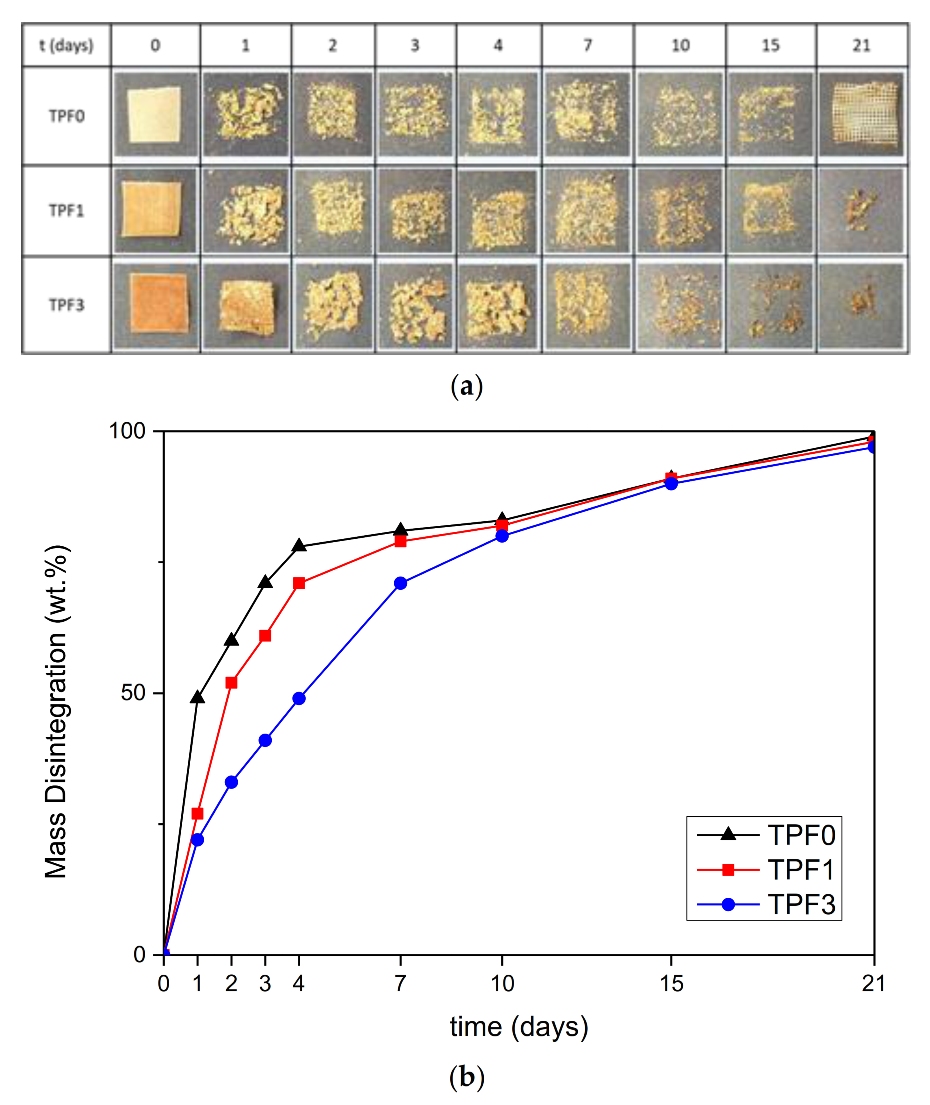
2.3.5. Disintegration in Compost
2.3.6. Evaluation of Phytotoxicity
- Gc = average number of germinated seeds in the sample
- Gt = average number of seeds germinated in the control
- Lc = average root length in the sample
- Lt = average root length in the control
2.3.7. Statistical Analysis
3. Results and Discussion
Wheat Flour Characterization
4. Conclusions
Author Contributions
Funding
Conflicts of Interest
References
- Leblanc, N.; Saiah, R.; Beucher, E.; Gattin, R.; Castandet, M.; Saiter, J.-M. Structural investigation and thermal stability of new extruded wheat flour based polymeric materials. Carbohyd. Polym. 2008, 73, 548–557. [Google Scholar] [CrossRef] [PubMed]
- Soccio, M.; Dominici, F.; Quattrosoldi, S.; Luzi, F.; Munari, A.; Torre, L.; Puglia, D. PBS-based green copolymer as efficient compatibilizer in Thermoplastic inedible Wheat Flour/Poly (Butylene Succinate) Blends. Biomacromolecules 2020, 21, 3254–3269. [Google Scholar] [CrossRef] [PubMed]
- Benincasa, P.; Dominici, F.; Bocci, L.; Governatori, C.; Panfili, I.; Tosti, G.; Torre, L.; Puglia, D. Relationships between wheat flour baking properties and tensile characteristics of derived thermoplastic films. Ind. Crop. Prod. 2017, 100, 138–145. [Google Scholar] [CrossRef]
- Puglia, D.; Dominici, F.; Kenny, J.M.; Santulli, C.; Governatori, C.; Tosti, G.; Benincasa, P. Tensile behavior of thermoplastic films from wheat flours as function of raw material baking properties. J. Polym. Environ. 2016, 24, 37–47. [Google Scholar] [CrossRef]
- Cano, A.; Jiménez, A.; Cháfer, M.; Gónzalez, C.; Chiralt, A. Effect of amylose:amylopectin ratio and rice bran addition on starch films properties. Carbohyd. Polym. 2014, 111, 543–555. [Google Scholar] [CrossRef] [Green Version]
- Prückler, M.; Siebenhandl-Ehn, S.; Apprich, S.; Höltinger, S.; Haas, C.; Schmid, E.; Kneifel, W. Wheat bran-based biorefinery 1: Composition of wheat bran and strategies of functionalization. LWT-Food Sci. Technol. 2014, 56, 211–221. [Google Scholar] [CrossRef]
- ElMekawy, A.; Diels, L.; De Wever, H.; Pant, D. Valorization of Cereal Based Biorefinery Byproducts: Reality and Expectations. Environ. Sci. Technol. 2013, 47, 9014–9027. [Google Scholar] [CrossRef]
- Bressiani, J.; Oro, T.; Da Silva, P.; Montenegro, F.; Bertolin, T.; Gutkoski, L.; Gularte, M. Influence of milling whole wheat grains and particle size on thermo-mechanical properties of flour using Mixolab. Czech. J. Food Sci. 2019, 37, 276–284. [Google Scholar] [CrossRef] [Green Version]
- Liu, N.; Ma, S.; Li, L.; Wang, X. Study on the effect of wheat bran dietary fiber on the rheological properties of dough. Grain Oil Sci. Technol. 2019, 2, 1–5. [Google Scholar] [CrossRef]
- De Bondt, Y.; Liberloo, I.; Roye, C.; Goos, P.; Courtin, C.M. The impact of wheat (Triticum aestivum L.) bran on wheat starch gelatinization: A differential scanning calorimetry study. Carbohyd. Polym. 2020, 241, 116262. [Google Scholar] [CrossRef]
- Dobircau, L.; Sreekumar, P.A.; Saiah, R.; Leblanc, N.; Terrié, C.; Gattin, R.; Saiter, J.M. Wheat flour thermoplastic matrix reinforced by waste cotton fibre: Agro-green-composites. Compos. Part A-Appl. S. 2009, 40, 329–334. [Google Scholar]
- Pérez-Pacheco, E.; Canto-Pinto, J.C.; Moo-Huchin, V.M.; Estrada-Mota, I.A.; Estrada-León, R.J.; Chel-Guerrero, L. Thermoplastic Starch (TPS)-Cellulosic Fibers Composites: Mechanical Properties and Water Vapor Barrier: A Review. Compos. Renew. Sustain. Mater. 2016, 85–105. [Google Scholar]
- Hanis-Syazwani, M.; Bolarinwa, I.F.; Lasekan, O.; Muhammad, K. Influence of starter culture on the physicochemical properties of rice bran sourdough and physical quality of sourdough bread. Food Res. 2018, 2, 340–349. [Google Scholar]
- Roozendaal, H.; Madian, A.; Frazier, R.A. Thermogravimetric analysis of water release from wheat flour and wheat bran suspensions. J. Food Eng. 2012, 111, 606–611. [Google Scholar] [CrossRef]
- El-Sayed, S. Thermal decomposition, kinetics and combustion parameters determination for two different sizes of rice husk using TGA. Eng. Agric. Environ. Food 2019, 12, 460–469. [Google Scholar]
- Yu, A.-N.; Li, Y.; Yang, Y.; Yu, K. The browning kinetics of the non-enzymatic browning reaction in L-ascorbic acid/basic amino acid systems. Food Sci. Technol. 2018, 38, 537–542. [Google Scholar]
- Edoardo Capuano, E.; Ferrigno, A.; Acampa, I.; Ait-Ameur, L.; Fogliano, V. Characterization of the Maillard reaction in bread crisps. Eur. Food Res. Technol. 2008, 228, 311–319. [Google Scholar]
- Rosell, C.M. The Science of Doughs and Bread Quality. In Flour and Breads and Their Fortification in Health and Disease Prevention; Academic Press: Cambridge, MA, USA, 2011; pp. 3–14. [Google Scholar]
- Majewsky, L.; Cunha, A.G. Evaluation of Suitability of Wheat Bran as a Natural Filler in Polymer Processing. Bioresources 2018, 13, 7037–7052. [Google Scholar]
- Follain, N.; Joly, C.; Dole, P.; Roge, B.; Mathlouthi. M. Quaternary starch based blends: Influence of a fourth component addition to the starch/water/glycerol system. Carbohydr. Polym. 2006, 63, 400–407. [Google Scholar] [CrossRef]
- Dominici, F.; Gigli, M.; Armentano, I.; Genovese, L.; Luzi, F.; Torre, L.; Munari, A.; Lotti, N. Improving the flexibility and compostability of starch/poly(butylene cyclohexanedicarboxylate)-based blends. Carbohydr. Polym. 2020, 246, 116631. [Google Scholar] [CrossRef]
- Carvalho, A.J.F.; Zambon, M.D.; da Silva Curvelo, A.A.; Gandini, A. Thermoplastic starch modification during melt processing: Hydrolysis catalyzed by carboxylic acids. Carbohydr. Polym. 2005, 62, 387–390. [Google Scholar] [CrossRef]
- Genovese, L.; Dominici, F.; Gigli, M.; Armentano, I.; Lotti, N.; Torre, L.; Munari, A. Processing, thermo-mechanical characterization and gas permeability of thermoplastic starch/poly(butylene trans-1,4-cyclohexanedicarboxylate) blends. Polym. Degr. Stab. 2018, 157, 100–107. [Google Scholar] [CrossRef]
- Olivato, J.B.; Grossmann, M.V.E.; Yamashita, F.; Eiras, D.; Pessan, L.A. Citric acid and maleic anhydride as compatibilizers in starch/poly(butylene adipate-co-terephthalate) blends by one-step reactive extrusion. Carbohydr. Polym. 2012, 87, 2614–2618. [Google Scholar] [CrossRef]
- Jiugao, Y.; Ning, W.; Xiaofei, M. The Effects of Citric Acid on the Properties of Thermoplastic Starch Plasticized by Glycerol. Starch/Stärke 2005, 57, 494–504. [Google Scholar] [CrossRef]
- Lagrain, B.; Thewissen, B.G.; Brijs, K.; Delcour, J.A. Mechanism of gliadin–glutenin cross-linking during hydrothermal treatment. Food Chem. 2008, 107, 753–760. [Google Scholar] [CrossRef]
- Basiak, E.; Lenart, A.; Debeaufort, F. How Glycerol and Water Contents Affect the Structural and Functional Properties of Starch-Based Edible Films. Polymers 2018, 10, 412. [Google Scholar] [CrossRef] [Green Version]
- Khamthong, P.; Lumdubwong, N. Effects of heat-moisture treatment on normal and waxy rice flours and production of thermoplastic flour materials. Carbohydr. Polym. 2012, 90, 340–347. [Google Scholar] [CrossRef]
- Jbilou, F.; Ayadi, F.; Galland, S.; Joly, C.; Dole, P.; Belard, L.; Degraeve, P. Effect of Shear Stress Extrusion Intensity on Plasticized Corn Flour Structure: Proteins Role and Distribution. J. Appl. Polym. Sci. 2012, 123, 2177–2186. [Google Scholar] [CrossRef]
- Sasimowski, E.; Majewski, L.; Grochowicz, M. Influence of the Design Solutions of Extruder Screw Mixing Tip on Selected Properties of Wheat Bran-Polyethylene Biocomposite. Polymers 2019, 11, 2120. [Google Scholar] [CrossRef] [Green Version]
- Carmona, V.B.; Corrêa, A.C.; Marconcini, J.M.; Mattoso, L.H.C. Properties of a Biodegradable Ternary Blend of Thermoplastic Starch (TPS), Poly(ε-Caprolactone) (PCL) and Poly(Lactic Acid) (PLA). J. Polym. Environ. 2014, 23, 83–89. [Google Scholar] [CrossRef]
- Sin, L.T.; Rahman, W.A.W.A.; Rahmat, A.R.; Mokhtar, M. Determination of thermal stability and activation energy of polyvinyl alcohol-cassava starch blends. Carbohydr. Polym. 2011, 83, 303–305. [Google Scholar] [CrossRef]


| Sample | Flour * | Bran ** | Plasticizable Fraction (PF) | Unplasticizable Fraction (UF) |
|---|---|---|---|---|
| F0 | 100 | 0 | 100.0 | 0.0 |
| F1 | 80 | 20 | 86 | 14 |
| F2 | 65 | 35 | 75.5 | 24.5 |
| F3 | 50 | 50 | 65.0 | 35.0 |
| Sample | Flour | Glycerol (% wt.) | Biopolymer (% wt.) | Citric Acid (% wt.) | Tset * | Screw Speed (Rpm) |
|---|---|---|---|---|---|---|
| TPF0 | F0 | 23 | 0 | 0 | 2 | 30 |
| TPF1 | F1 | 23 | 0 | 0 | 2 | 30 |
| TPF2 | F2 | 23 | 0 | 0 | 2 | 30 |
| TPF3 | F3 | 23 | 0 | 0 | 2 | 30 |
| TPF2_CA | F2 | 23 | 0 | 0.8 | 2 | 30 |
| TPF2_20BAT | F2 | 23 | 20 PBAT | 0 | 2 | 30 |
| TPF2_20CL | F2 | 23 | 20 PCL | 0 | 2 | 30 |
| TPF2_CA20BAT | F2 | 23 | 20 PBAT | 0.8 | 2 | 30 |
| TPF2_CA20CL | F2 | 23 | 20 PCL | 0.8 | 2 | 30 |
| F0_CA2 | F0 | 17 | 0 | 0.8 | 2 | 30 |
| F0_CA3 | F0 | 17 | 0 | 0.8 | 3 | 30 |
| F0_CA20CL2 | F0 | 17 | 20 PCL | 0.8 | 2 | 30 |
| F0_CA20CL3 | F0 | 17 | 20 PCL | 0.8 | 3 | 30 |
| F2_CA20CL2 | F2 | 17 | 20 PCL | 0.8 | 2 | 30 |
| F2_CA20CL3 | F2 | 17 | 20 PCL | 0.8 | 3 | 30 |
| F2_20CL | F2 | 17 | 20 PCL | 0.8 | 2 | 30 |
| F2_20CL120R | F2 | 17 | 20 PCL | 0.8 | 2 | 120 |
| F2_25CL | F2 | 17 | 25 PCL | 0.8 | 2 | 30 |
| F2_25CL120R | F2 | 17 | 25 PCL | 0.8 | 2 | 120 |
| F2_30CL | F2 | 17 | 30 PCL | 0.8 | 2 | 30 |
| F2_30CL120R | F2 | 17 | 30 PCL | 0.8 | 2 | 120 |
| F2_40CL | F2 | 17 | 40 PCL | 0.8 | 2 | 30 |
| F2_40CL120R | F2 | 17 | 40 PCL | 0.8 | 2 | 120 |
| F0_25CL120R | F0 | 17 | 25 PCL | 0.8 | 2 | 120 |
| F1_25CL120R | F1 | 17 | 25 PCL | 0.8 | 2 | 120 |
| F3_25CL120R | F3 | 17 | 25 PCL | 0.8 | 2 | 120 |
| Sample | Flour | Glycerol (% wt.) | Biopolymer (% wt.) | Citric Acid (% wt.) | Tset * | Screw Speed (rpm) | Ultimate Tensile Strength (MPa) | Strain at Break (%) |
|---|---|---|---|---|---|---|---|---|
| TPF0 | F0 | 23 | 0 | 0 | 2 | 30 | 1.23 ± 0.05 | 54.13 ± 4.39 |
| TPF1 | F1 | 23 | 0 | 0 | 2 | 30 | 2.63 ± 0.10 | 32.23 ± 0.64 |
| TPF2 | F2 | 23 | 0 | 0 | 2 | 30 | 2.62 ± 0.40 | 23.84 ± 2.45 |
| TPF3 | F3 | 23 | 0 | 0 | 2 | 30 | 3.83 ± 0.20 | 19.64 ± 1.60 |
| TPF2_CA | F2 | 23 | 0 | 0.8 | 2 | 30 | 1.61 ± 0,08 | 34.89 ± 2.44 |
| TPF2_20BAT | F2 | 23 | 20 PBAT | 0 | 2 | 30 | 2.21 ± 0,17 | 6.93 ± 0.47 |
| TPF2_20CL | F2 | 23 | 20 PCL | 0 | 2 | 30 | 1.96 ± 0.06 | 16.80 ± 1.98 |
| TPF2_CA20BAT | F2 | 23 | 20 PBAT | 0.8 | 2 | 30 | 1.50 ± 0.05 | 10.44 ± 0.17 |
| TPF2_CA20CL | F2 | 23 | 20 PCL | 0.8 | 2 | 30 | 1.66 ± 0.34 | 60.39 ± 13.00 |
| F0_CA2 | F0 | 17 | 0 | 0.8 | 2 | 30 | 1.54 ± 0.02 | 75.47 ± 11.66 |
| F0_CA3 | F0 | 17 | 0 | 0.8 | 3 | 30 | 1.05 ± 0.14 | 31.08 ± 6.07 |
| F0_CA20CL2 | F0 | 17 | 20 PCL | 0.8 | 2 | 30 | 2.89 ± 0.23 | 61.80 ± 11,87 |
| F0_CA20CL3 | F0 | 17 | 20 PCL | 0.8 | 3 | 30 | 2.69 ± 0.22 | 47.04 ± 18.15 |
| F2_CA20CL2 | F2 | 17 | 20 PCL | 0.8 | 2 | 30 | 3,10 ± 0,24 | 12,42 ± 1,43 |
| F2_CA20CL3 | F2 | 17 | 20 PCL | 0.8 | 3 | 30 | 2,72 ± 0,23 | 13,83 ± 1,12 |
| F2_20CL | F2 | 17 | 20 PCL | 0.8 | 2 | 30 | 3.10 ± 0.24 | 12.42 ± 1.43 |
| F2_20CL120R | F2 | 17 | 20 PCL | 0.8 | 2 | 120 | 3.17 ± 0.20 | 14.15 ± 2.46 |
| F2_25CL | F2 | 17 | 25 PCL | 0.8 | 2 | 30 | 3.05 ± 0.03 | 16.27 ± 1.47 |
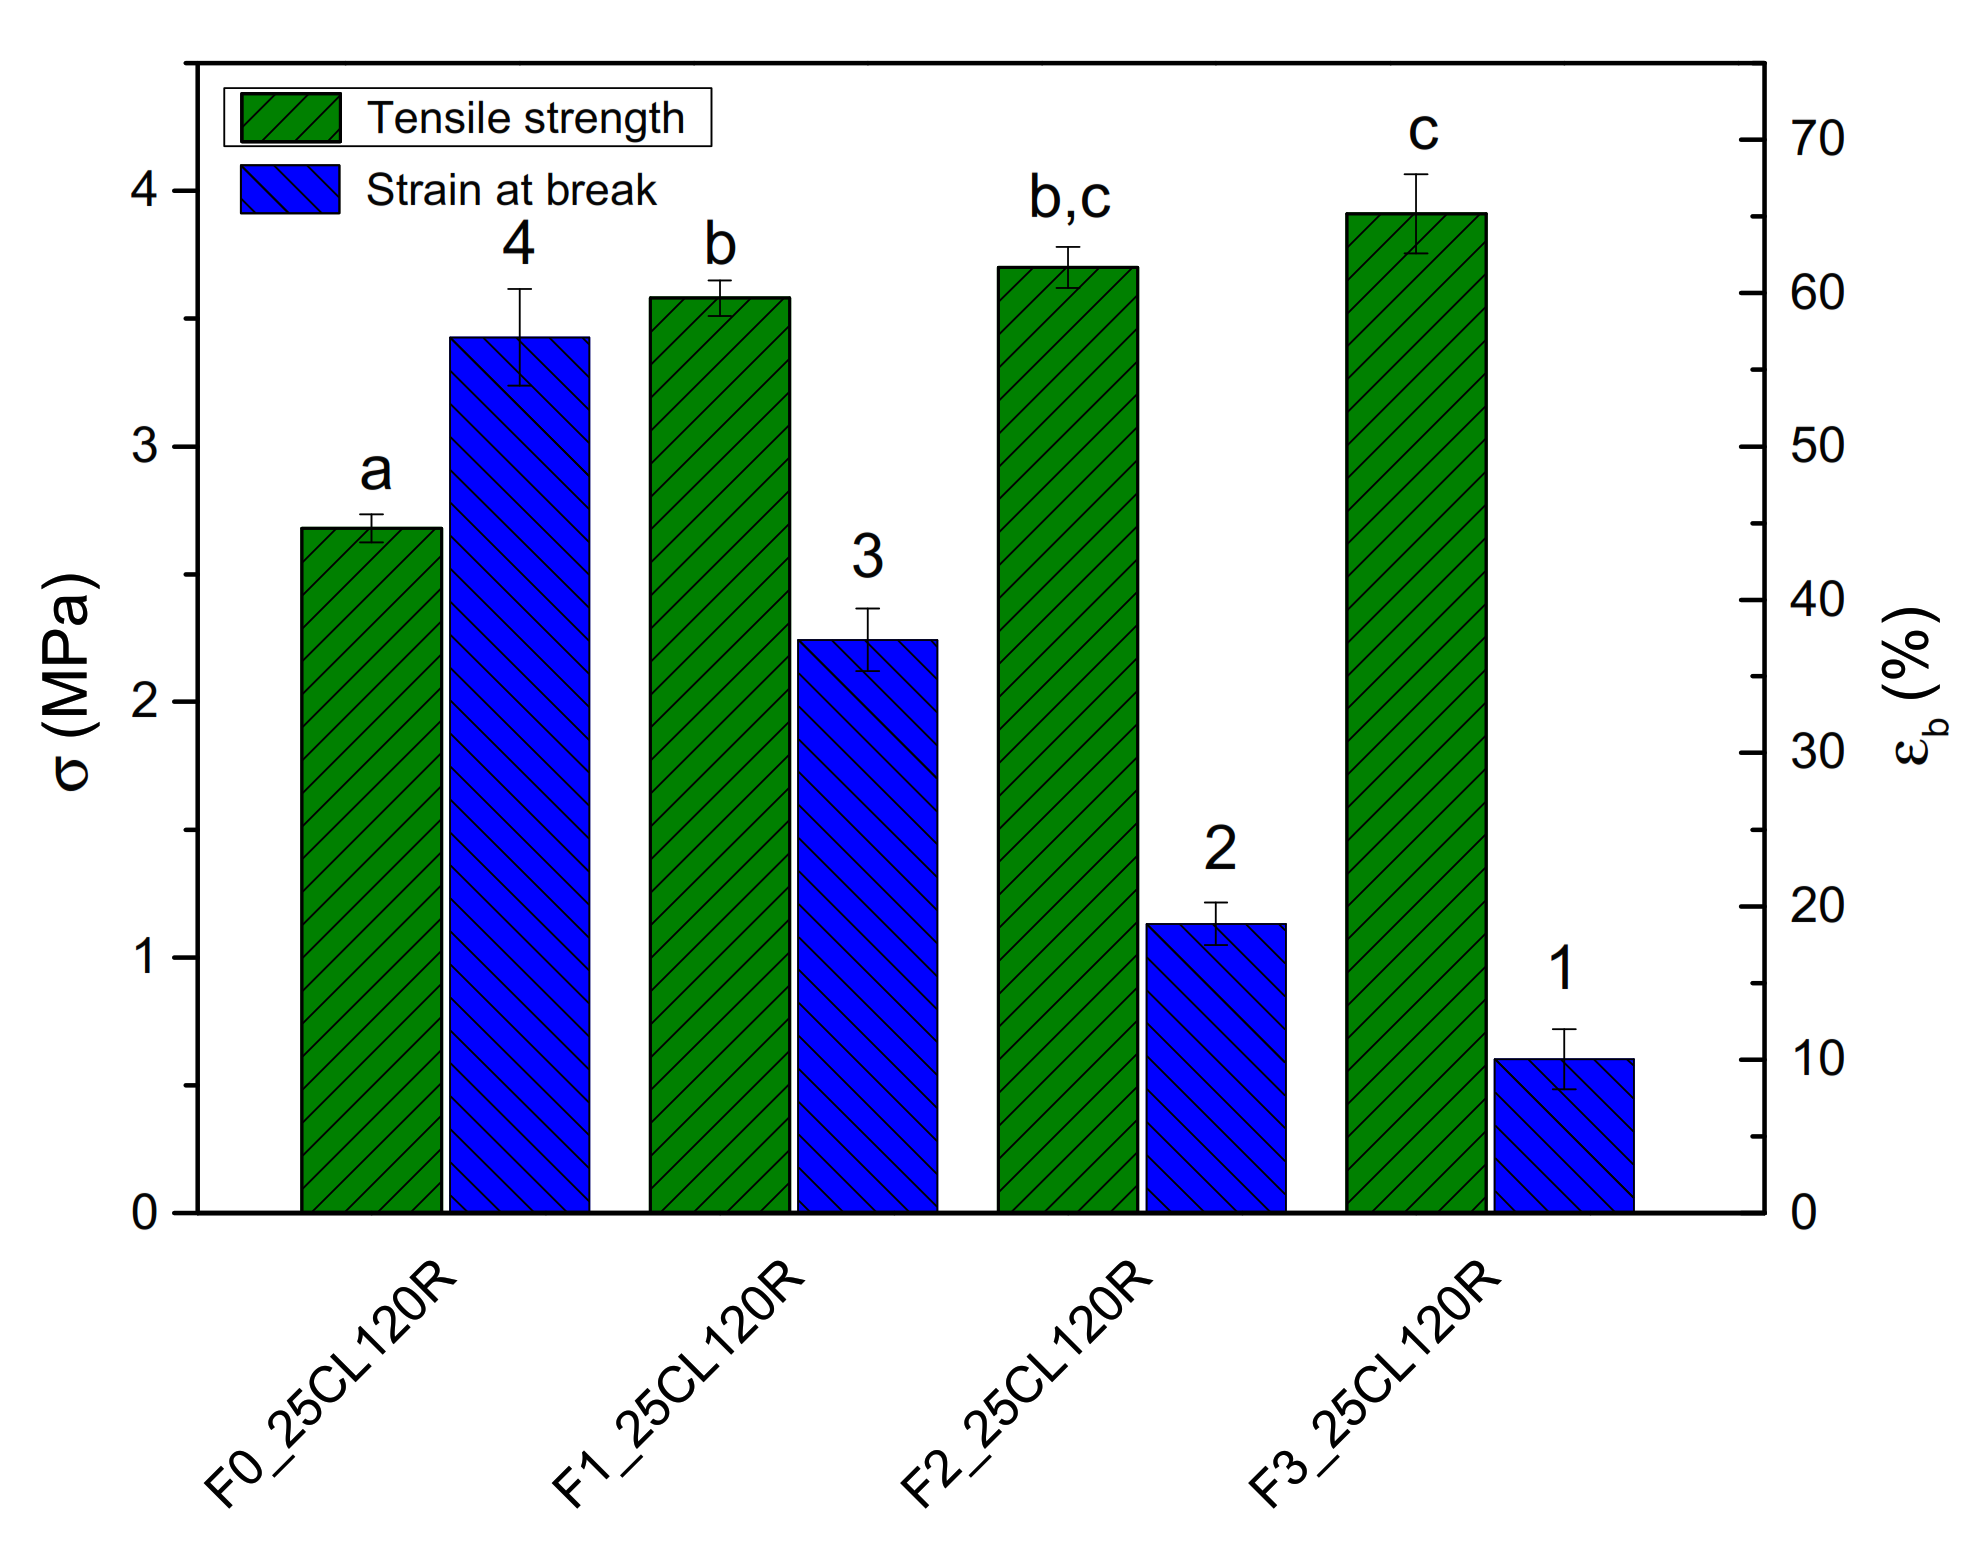
| F2_25CL120R | F2 | 17 | 25 PCL | 0.8 | 2 | 120 | 3.70 ± 0.16 | 18.87 ± 2.77 |
| F2_30CL | F2 | 17 | 30 PCL | 0.8 | 2 | 30 | 3.69 ± 0.43 | 12.49 ± 1.03 |
| F2_30CL120R | F2 | 17 | 30 PCL | 0.8 | 2 | 120 | 3.43 ± 0.36 | 11.73 ± 0.99 |
| F2_40CL | F2 | 17 | 40 PCL | 0.8 | 2 | 30 | 4,57 ± 0.36 | 30.75 ± 1.97 |
| F2_40CL120R | F2 | 17 | 40 PCL | 0.8 | 2 | 120 | 4,63 ± 0.13 | 52.64 ± 4.02 |
| F0_25CL120R | F0 | 17 | 25 PCL | 0.8 | 2 | 120 | 2.68 ± 0.11 | 57.11 ± 6.29 |
| F1_25CL120R | F1 | 17 | 25 PCL | 0.8 | 2 | 120 | 3.58 ± 0.14 | 37.39 ± 4.07 |
| F3_25CL120R | F3 | 17 | 25 PCL | 0.8 | 2 | 120 | 3.91 ± 0.31 | 10.04 ± 3.92 |
| 40 Days | 60 Days | |||
|---|---|---|---|---|
| Samples | G×L | Ig (%) | G×L | Ig (%) |
| C | 37.0 | 233 | ||
| TPF3_50 | 20.0 | 54 | 229 | 98 |
| TPF1_50 | 21.0 | 57 | 251 | 108 |
| TPF0_50 | 9.5 | 26 | 183 | 79 |
| TPF3_75 | 13.3 | 36 | 197 | 85 |
| TPF1_75 | 12.5 | 34 | 213 | 91 |
| TPF0_75 | 1.9 | 5 | 171 | 73 |
© 2020 by the authors. Licensee MDPI, Basel, Switzerland. This article is an open access article distributed under the terms and conditions of the Creative Commons Attribution (CC BY) license (http://creativecommons.org/licenses/by/4.0/).
Share and Cite
Dominici, F.; Luzi, F.; Benincasa, P.; Torre, L.; Puglia, D. Biocomposites Based on Plasticized Wheat Flours: Effect of Bran Content on Thermomechanical Behavior. Polymers 2020, 12, 2248. https://doi.org/10.3390/polym12102248
Dominici F, Luzi F, Benincasa P, Torre L, Puglia D. Biocomposites Based on Plasticized Wheat Flours: Effect of Bran Content on Thermomechanical Behavior. Polymers. 2020; 12(10):2248. https://doi.org/10.3390/polym12102248
Chicago/Turabian StyleDominici, Franco, Francesca Luzi, Paolo Benincasa, Luigi Torre, and Debora Puglia. 2020. "Biocomposites Based on Plasticized Wheat Flours: Effect of Bran Content on Thermomechanical Behavior" Polymers 12, no. 10: 2248. https://doi.org/10.3390/polym12102248