Fouling Mitigation by Cationic Polymer Addition into a Pilot-Scale Anaerobic Membrane Bioreactor Fed with Blackwater

 ,
,  ,
,  ,
,
Abstract
:
1. Introduction
2. Materials and Methods
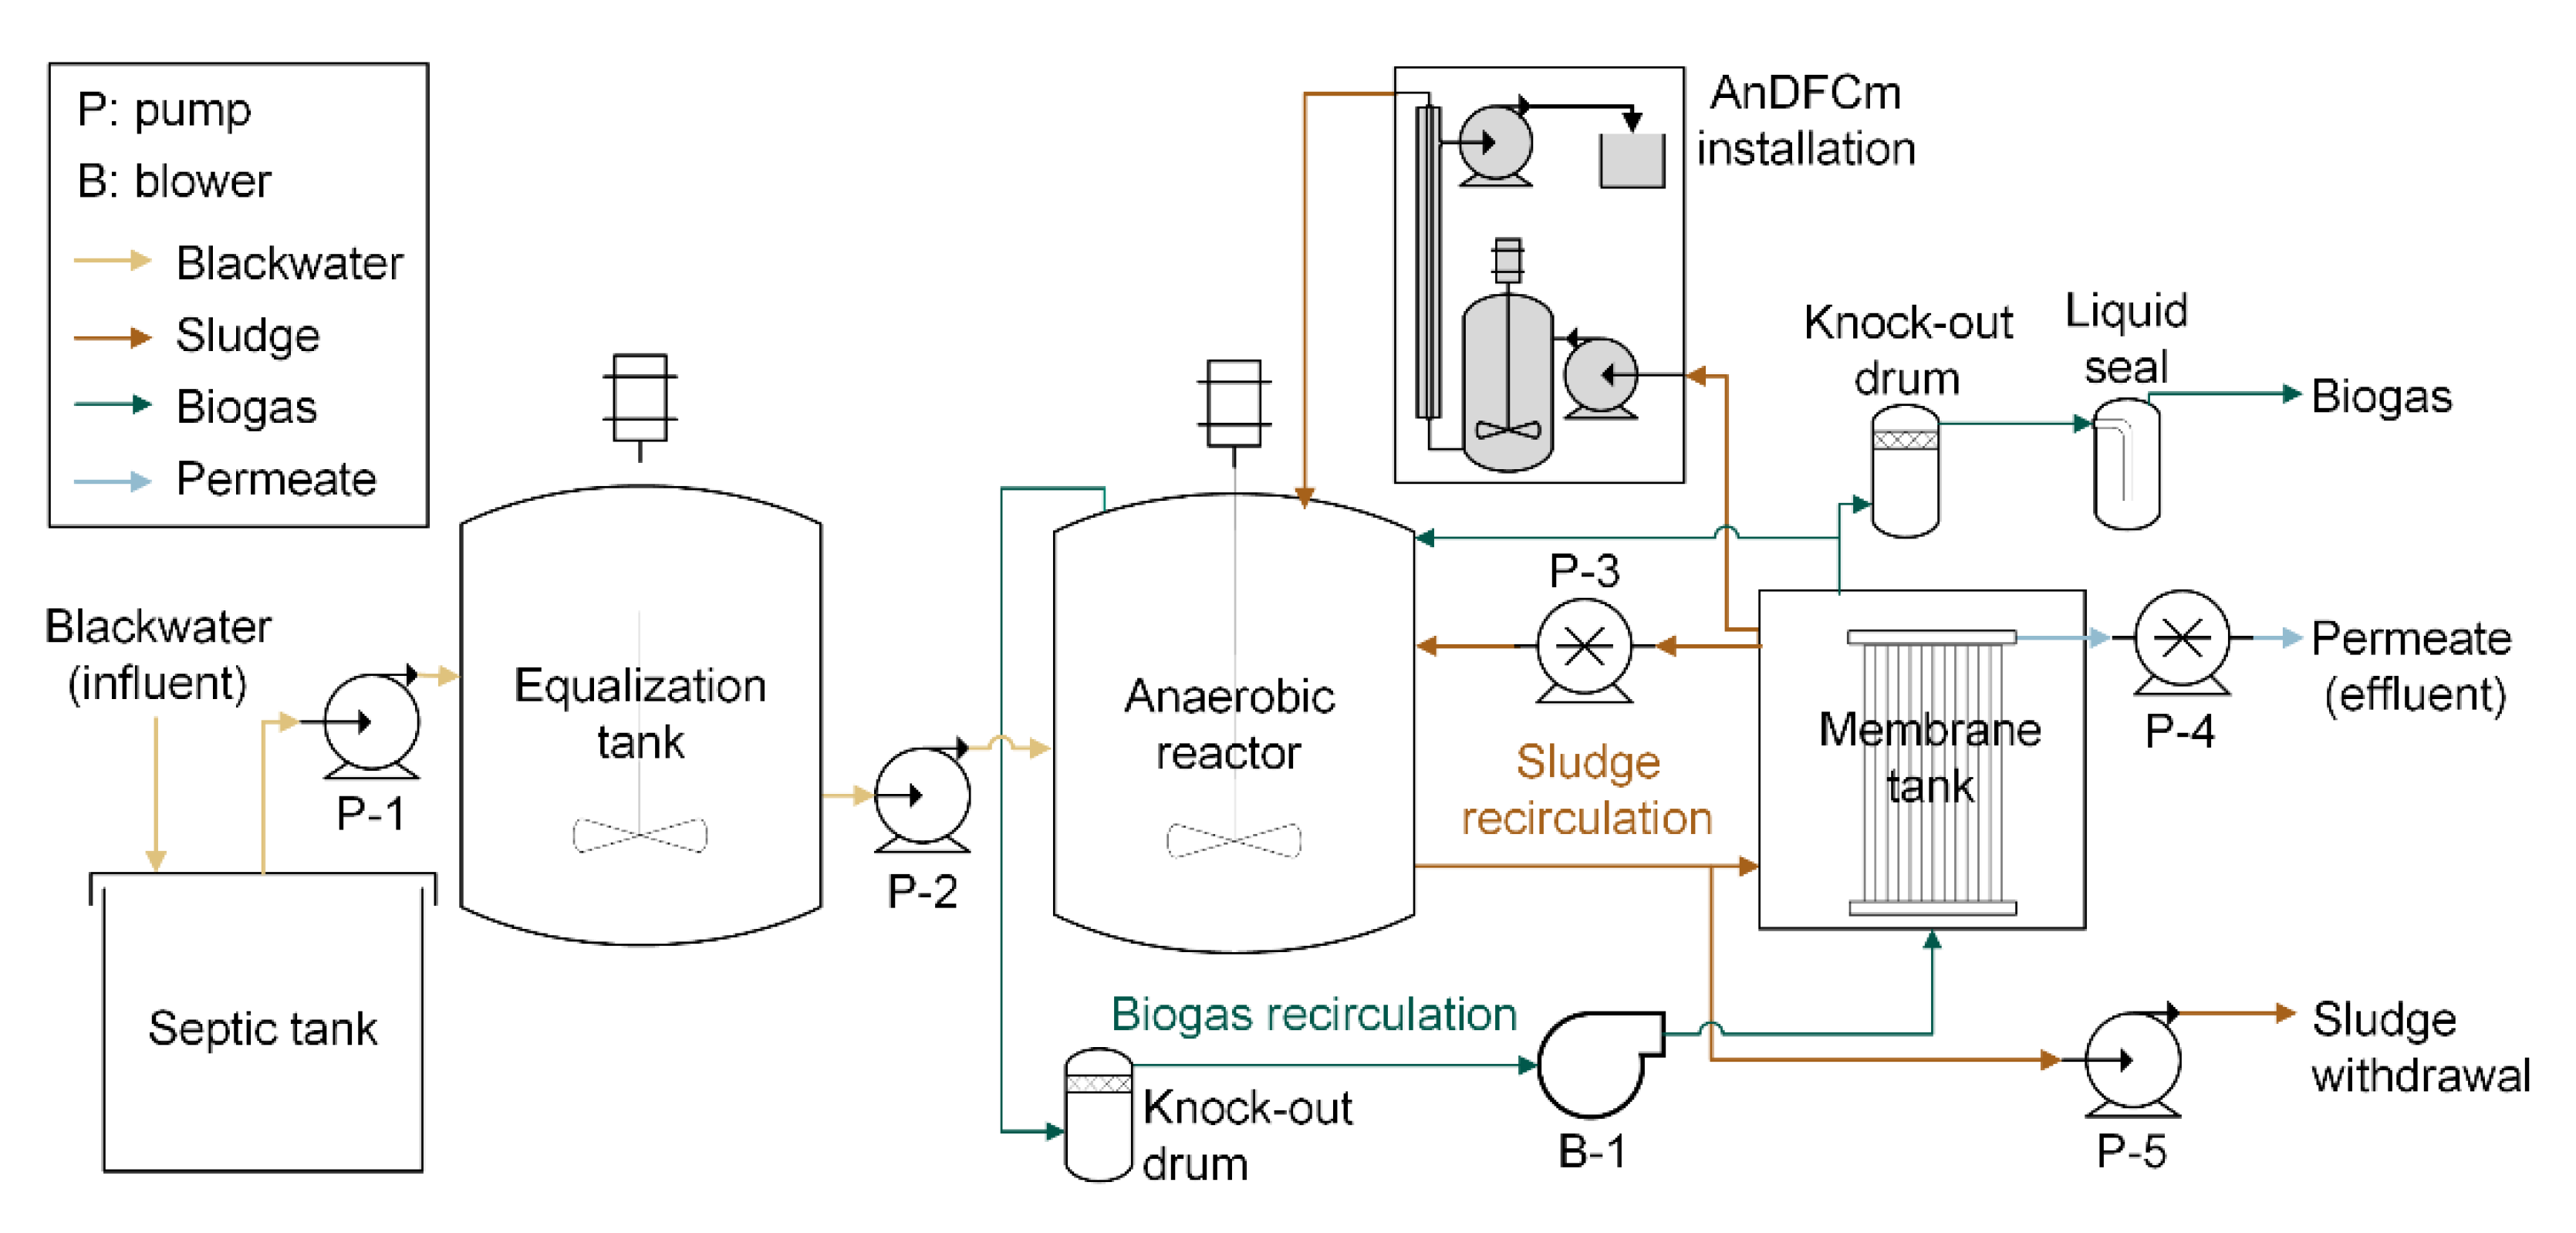
2.1. Pilot AnMBR Plant Description
2.2. Specific Gas Demand ( ) Model
2.3. Flux Enhancer Dosing
2.4. Monitoring Phases
2.5. Analytical Methods
2.5.1. Physicochemical Characterization
2.5.2. Specific Methanogenic Activity (SMA)
2.6. AnMBR Filtration Performance Indices
2.7. Statistical Analysis
3. Results
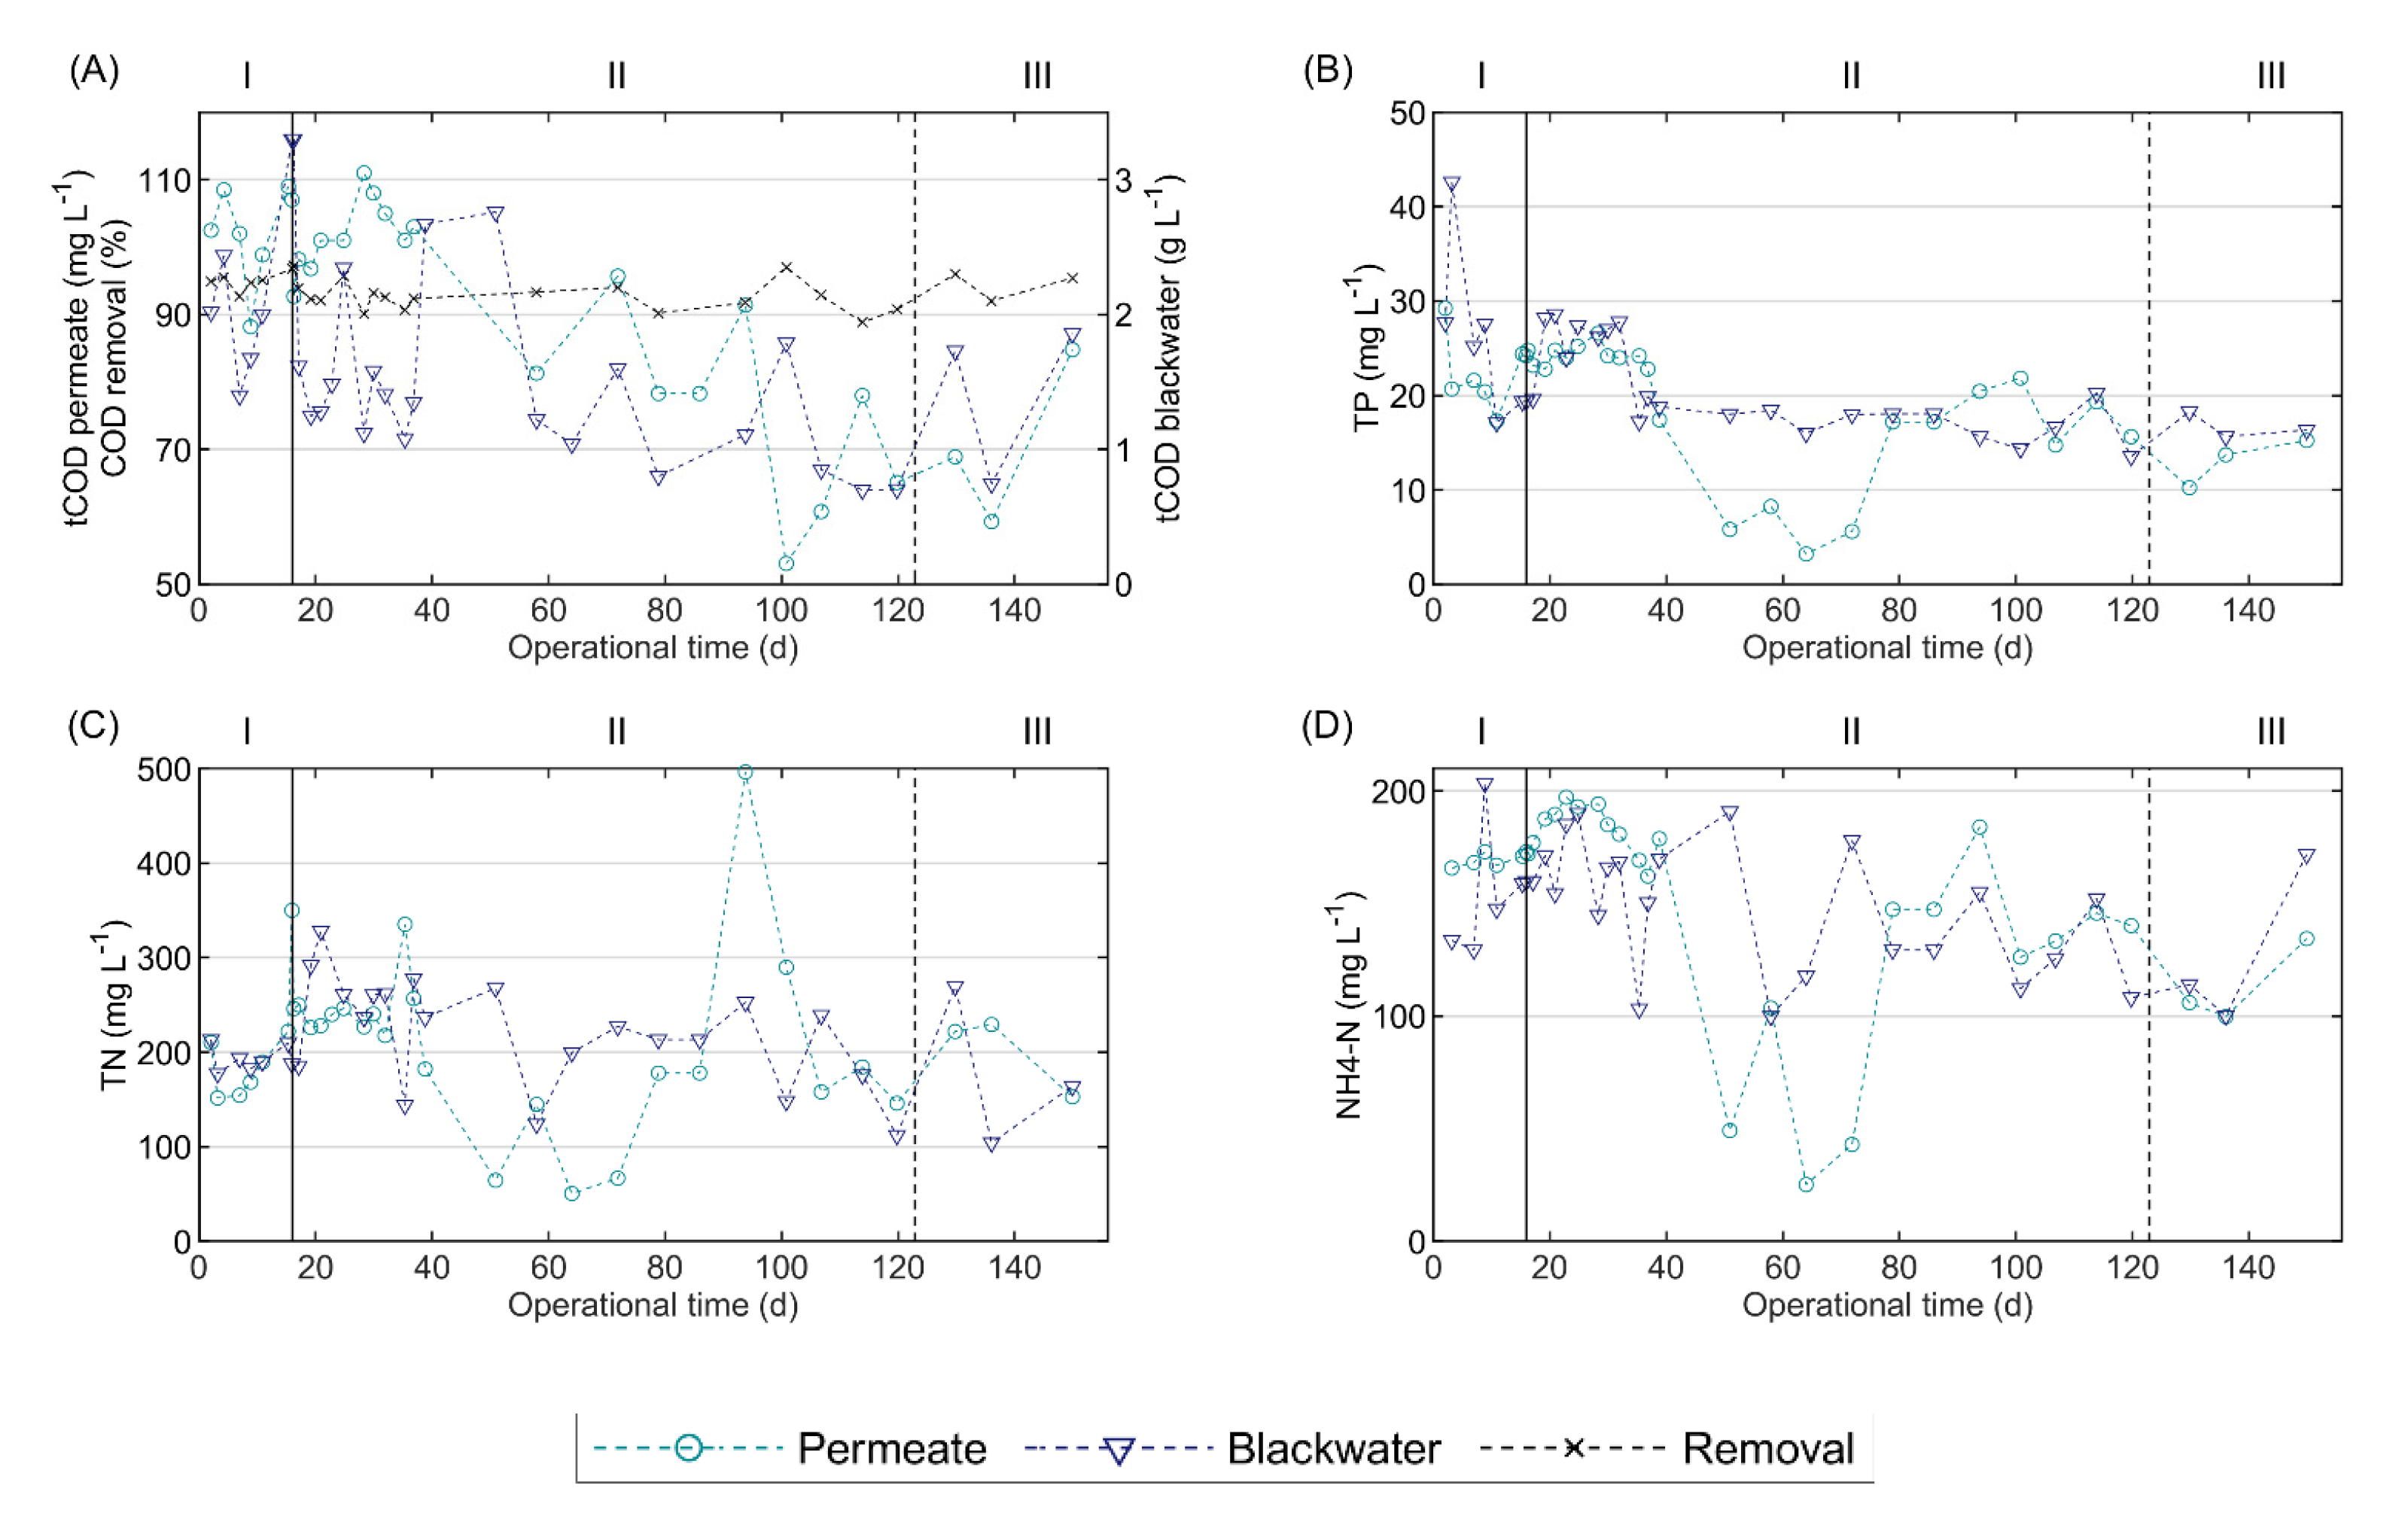
3.1. Blackwater and Permeate Characteristics
3.2. Sludge Characteristics
3.3. SMA Tests
3.4. Model Calibration
3.5. AnMBR Filtration Performance
3.6. Correlation Analysis
4. Discussion
4.1. Potential Foulants and the Role of Flux Enhancer
4.1.1. Soluble and Colloidal Organic Matter
4.1.2. Floc Size
4.2. Extent of Flux Enhancer Effect
4.3. Flux Enhancer Effect on Permeate Quality
4.4. Flux Enhancer Effect on Biological Activity
4.5. Sludge Withdrawal as an Alternative Strategy for Fouling Control
4.6. Filterability as Input Variable for Fouling Control and Flux Enhancer Dosing
5. Conclusions
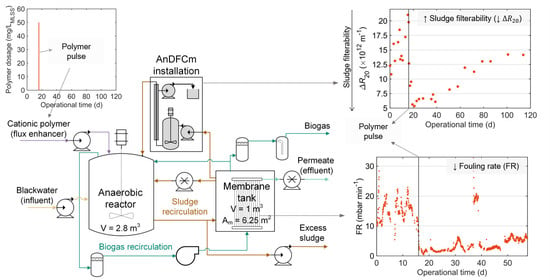
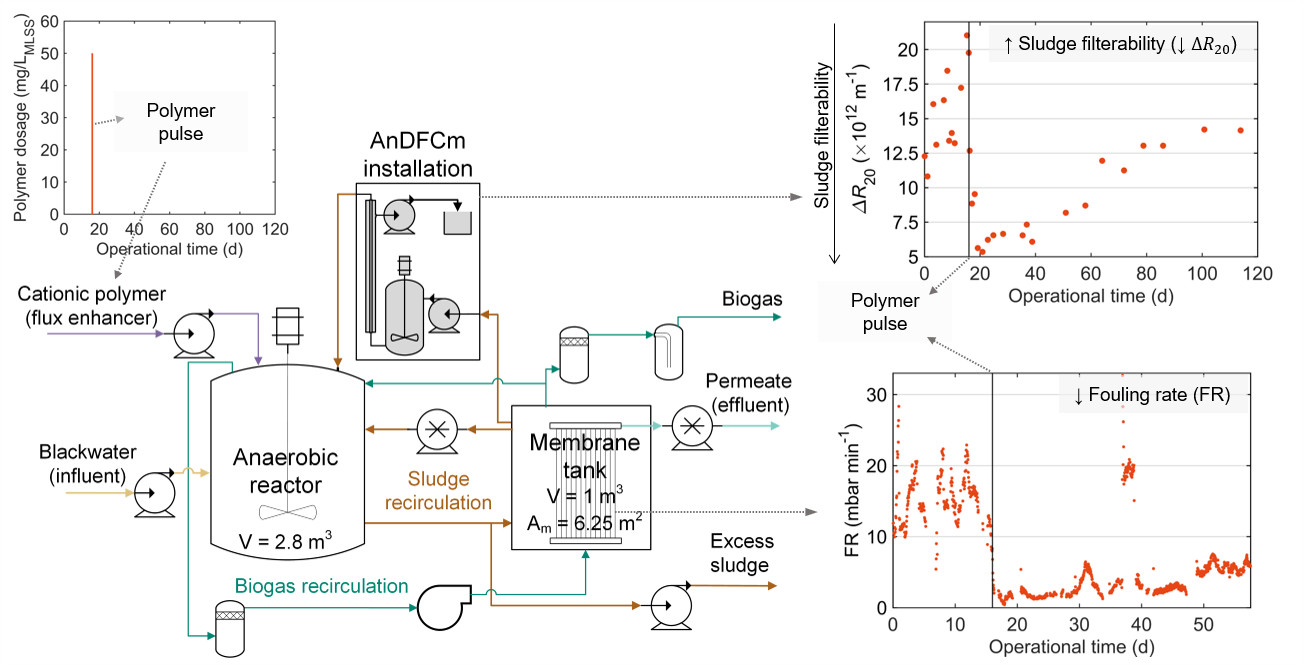
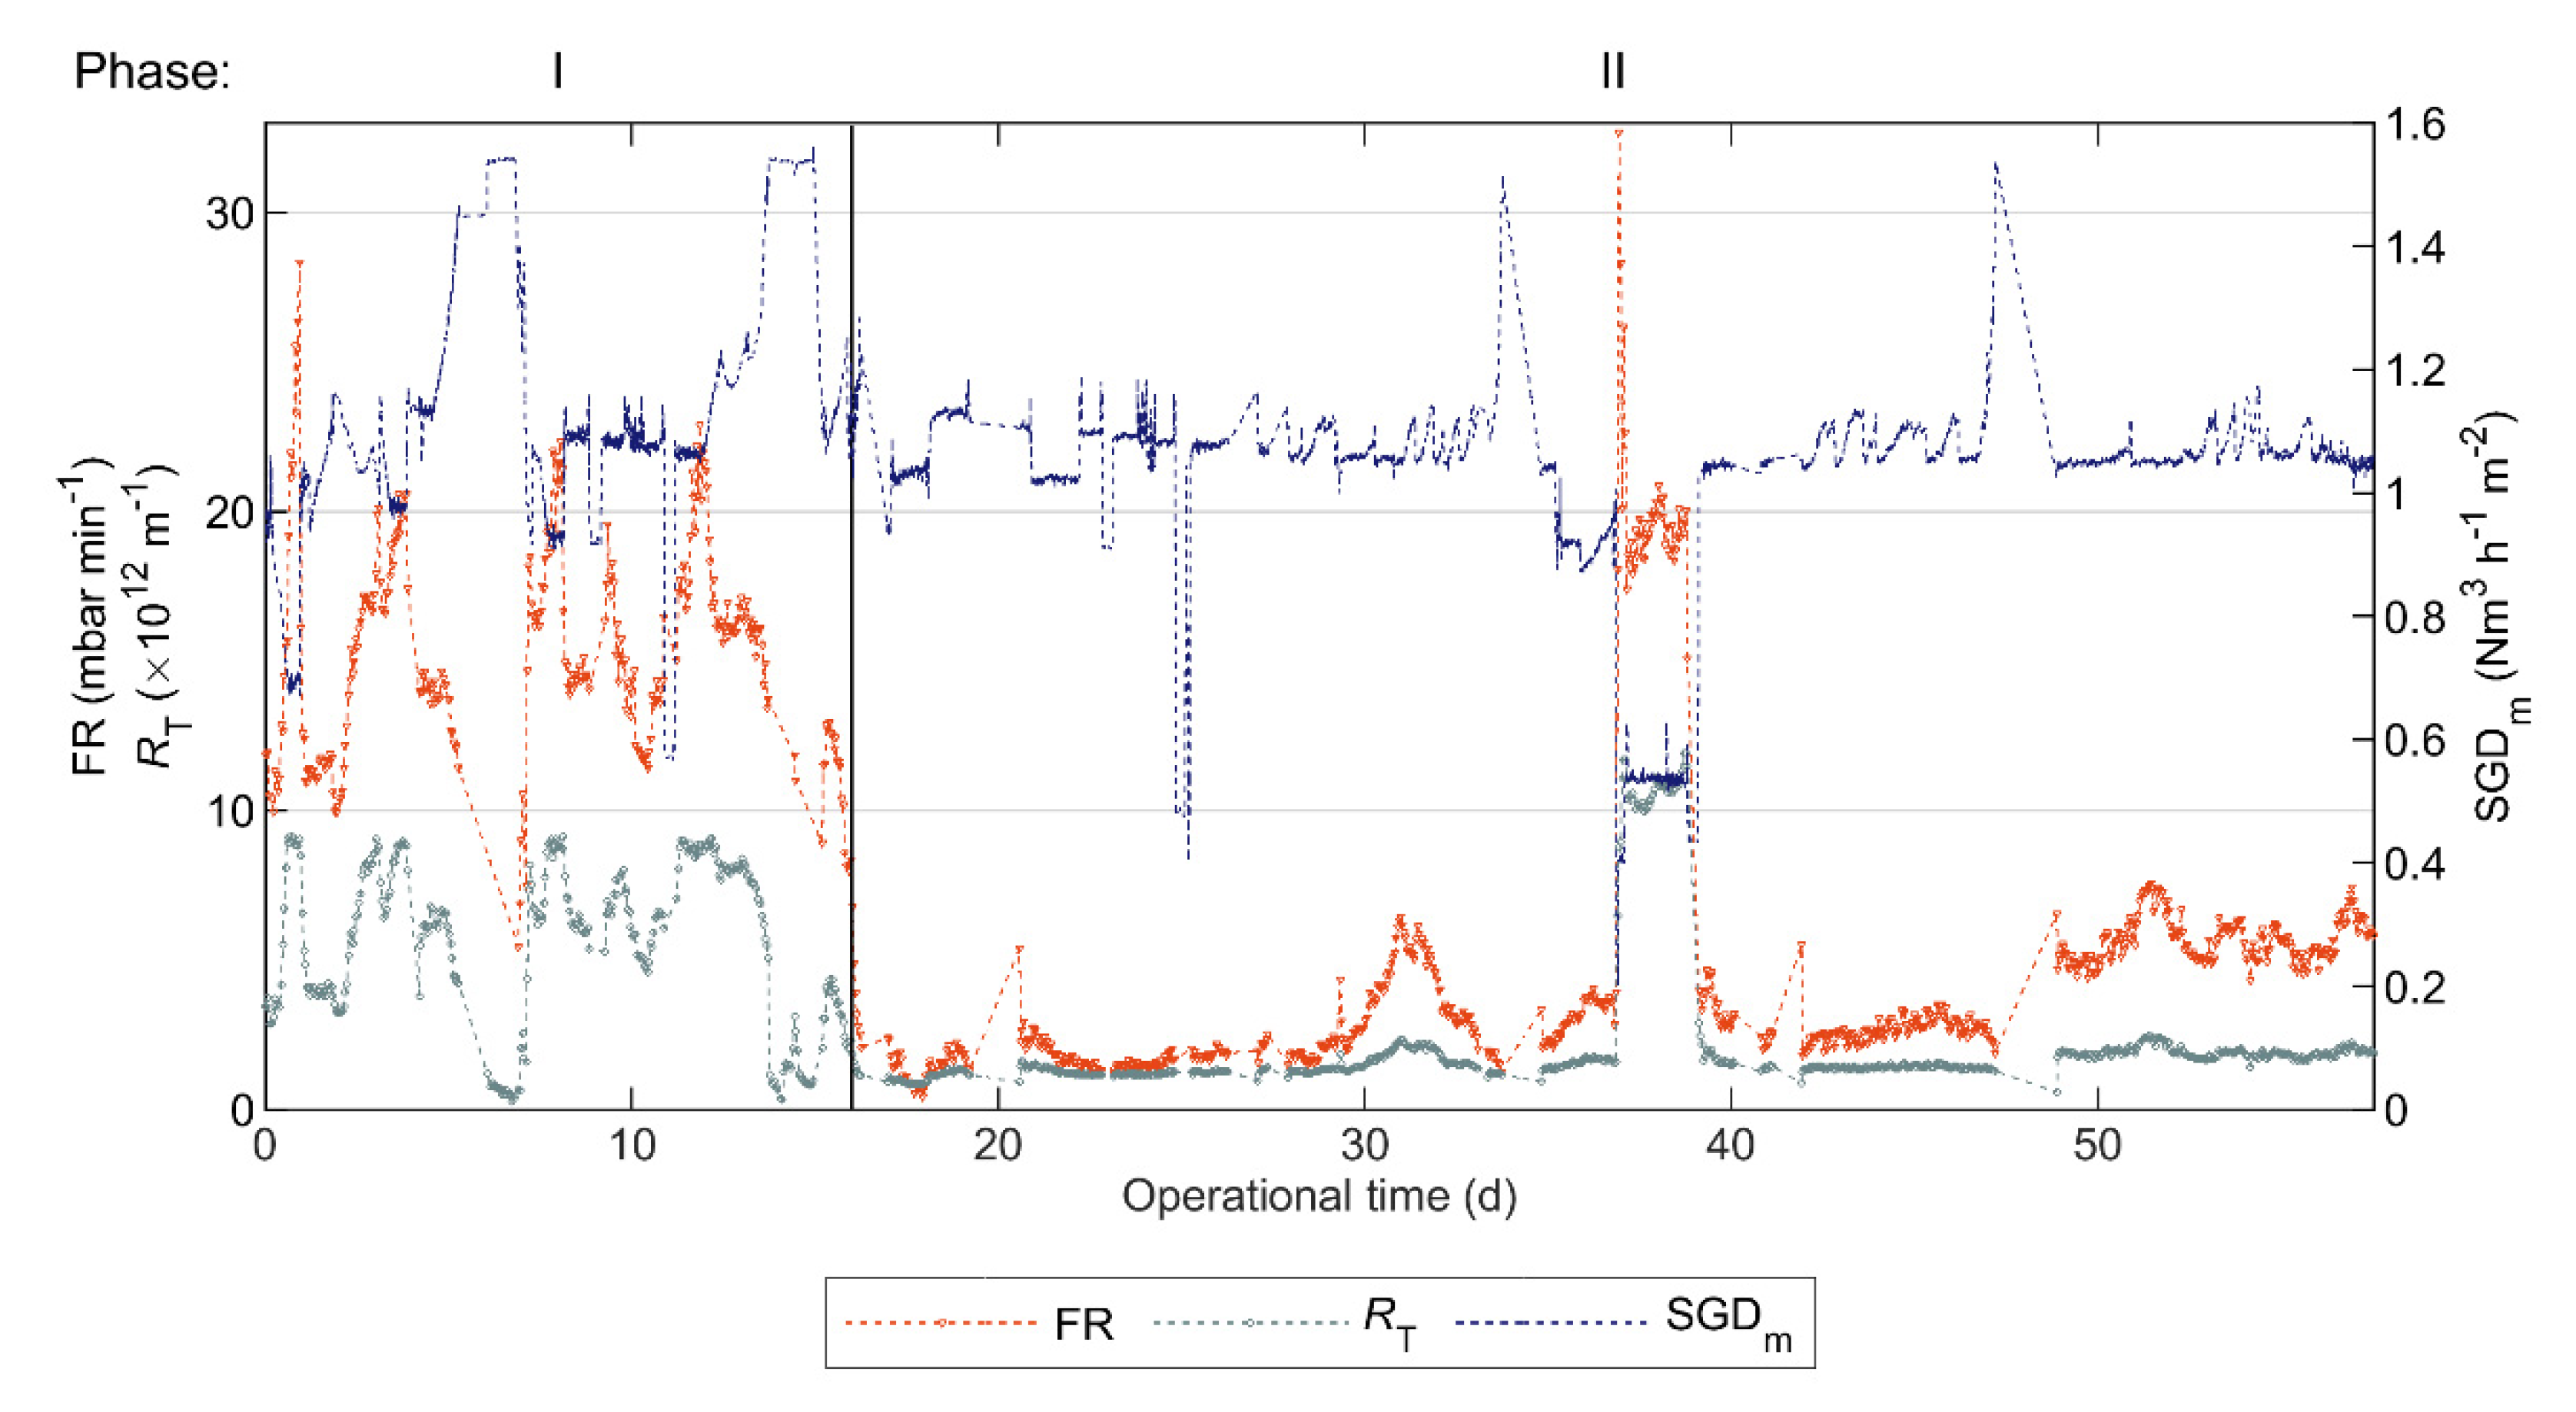
- FE addition improved the filtration performance of the AnMBR, as indicated by the 82% and 89% FR reductions, without significantly affecting COD removal and permeate quality. The improvement was sustained in the long term—the FR and values stayed below the ones registered during the control phase (i.e., Phase I) for at least 42 days, and after this period the SCADA system failed to measure FR and .
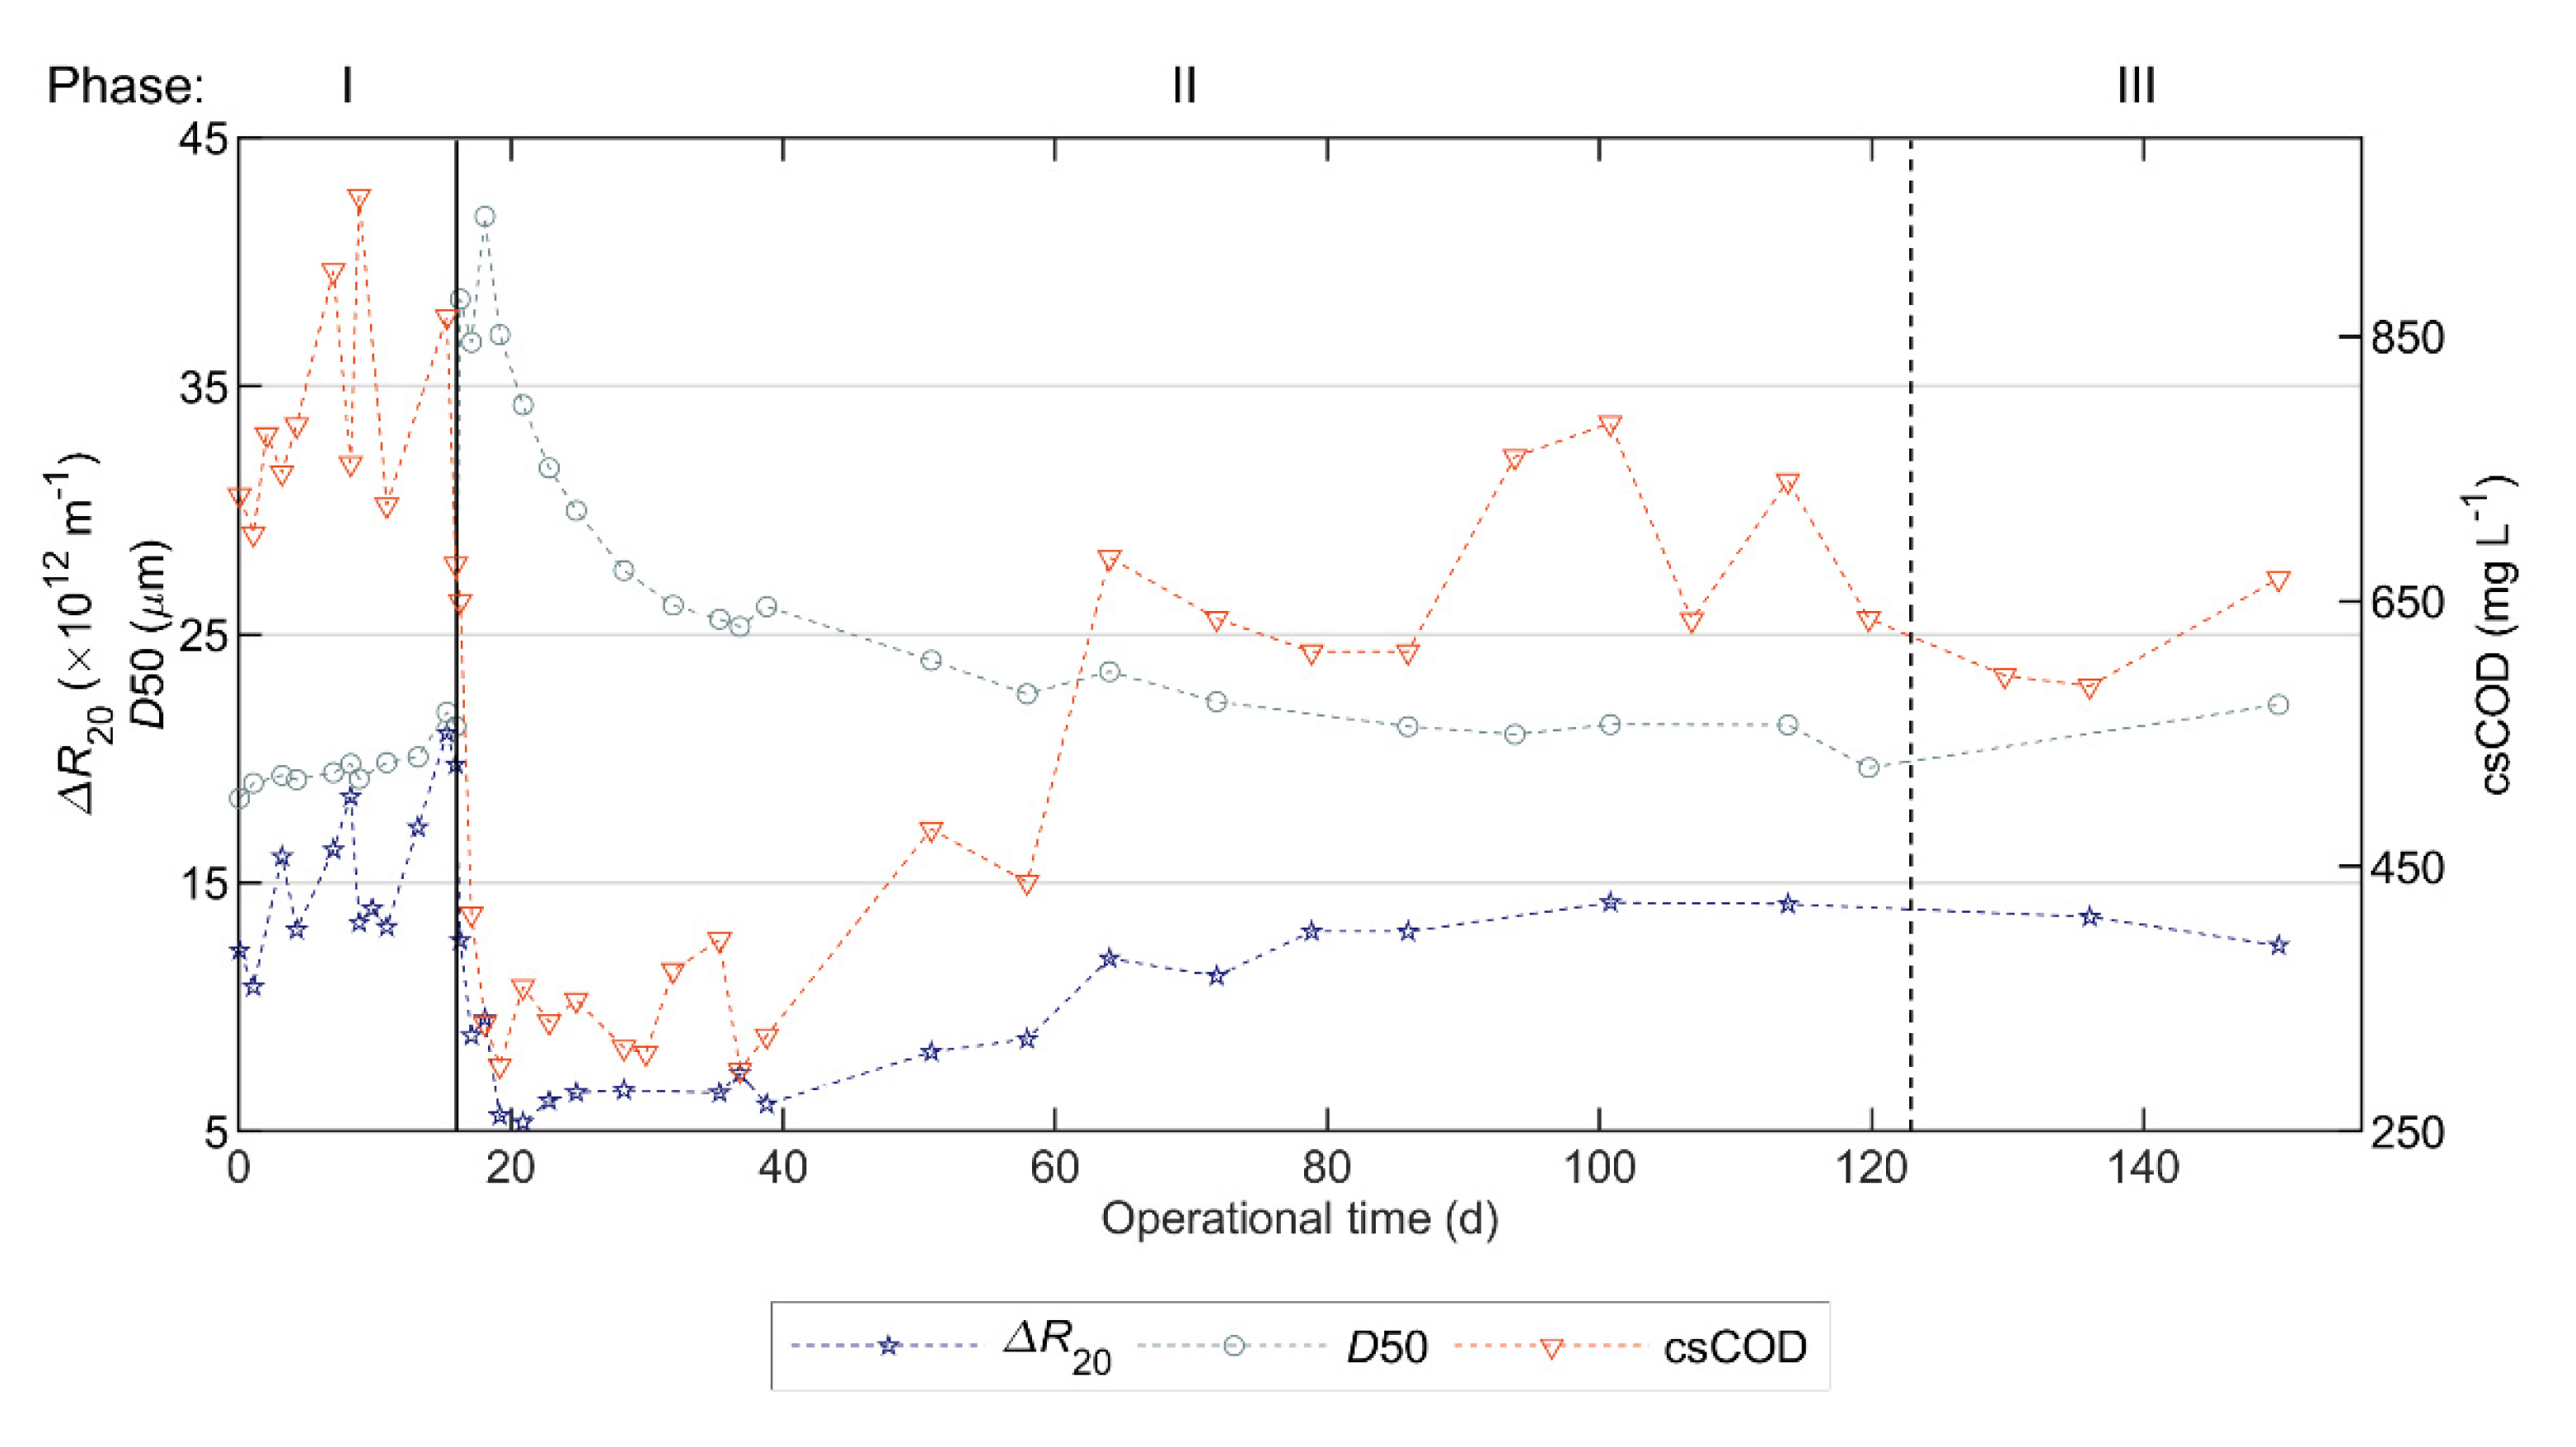
- The improved filtration performance was attributed to increased floc size and reduced csCOD (i.e., colloidal + soluble organic matter concentration), thereby improving sludge filterability. The filterability returned to similar values as in the control phase 85 days after FE addition.
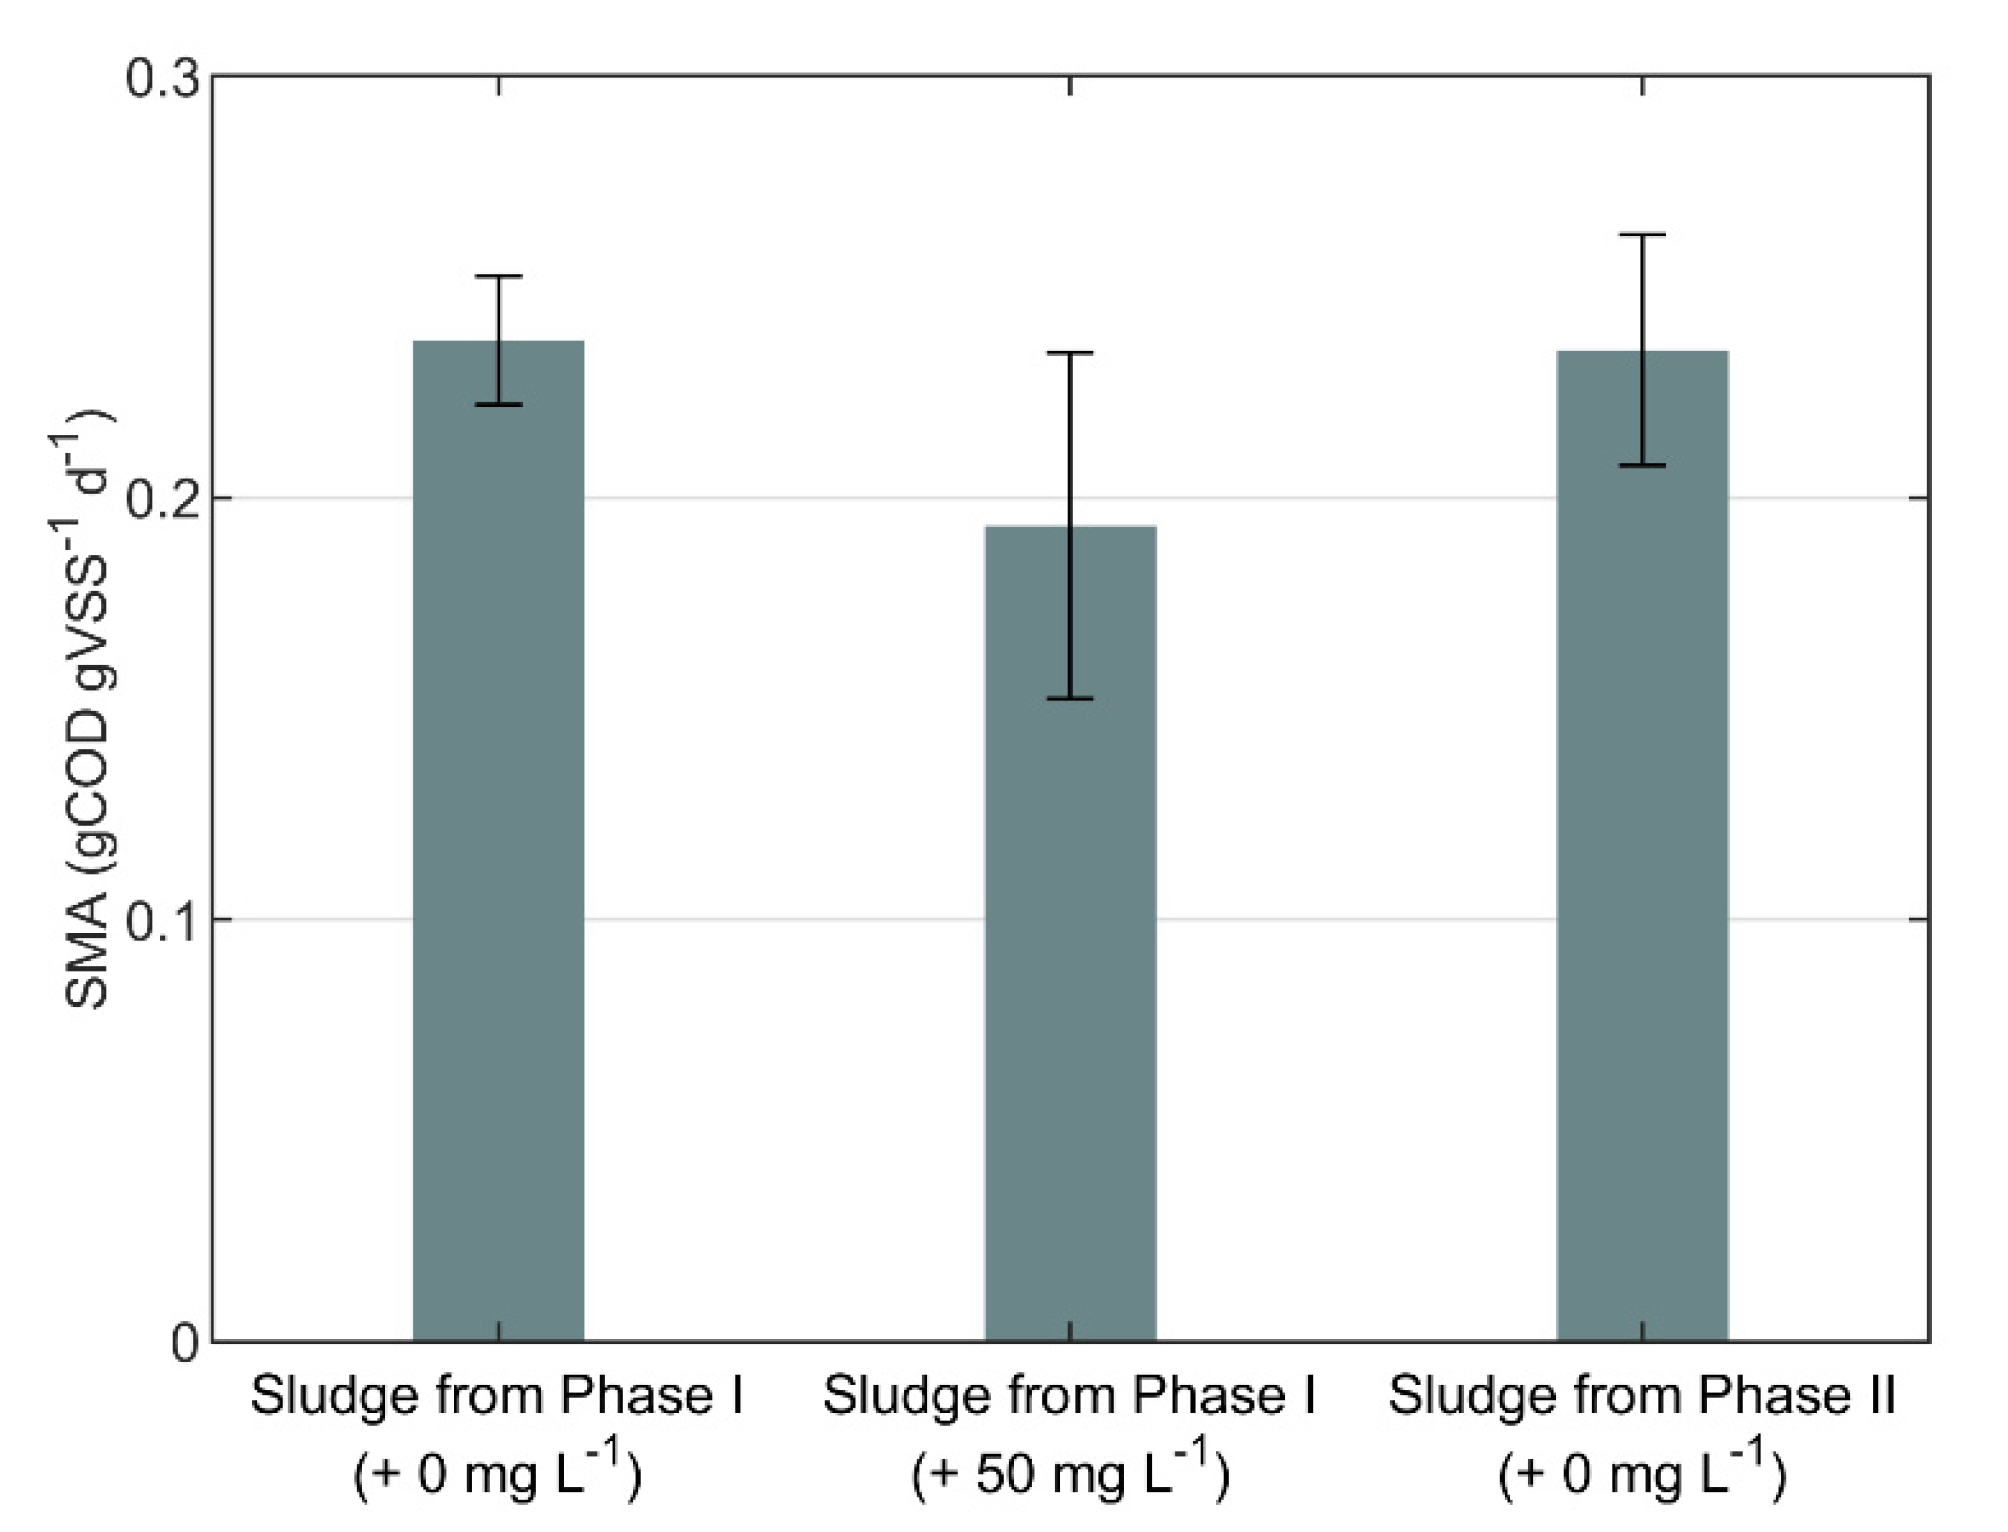
- The SMA values of the sludge samples collected immediately before and 3 weeks after FE addition were statistically similar; however, in batch tests, 50 mg L−1 of Adifloc KD451 caused an 18% SMA inhibition. Thus, the FE had a modest immediate effect on the SMA, which, however, had no significant impact on the AnMBR performance. Moreover, the drop in SMA was reversible.
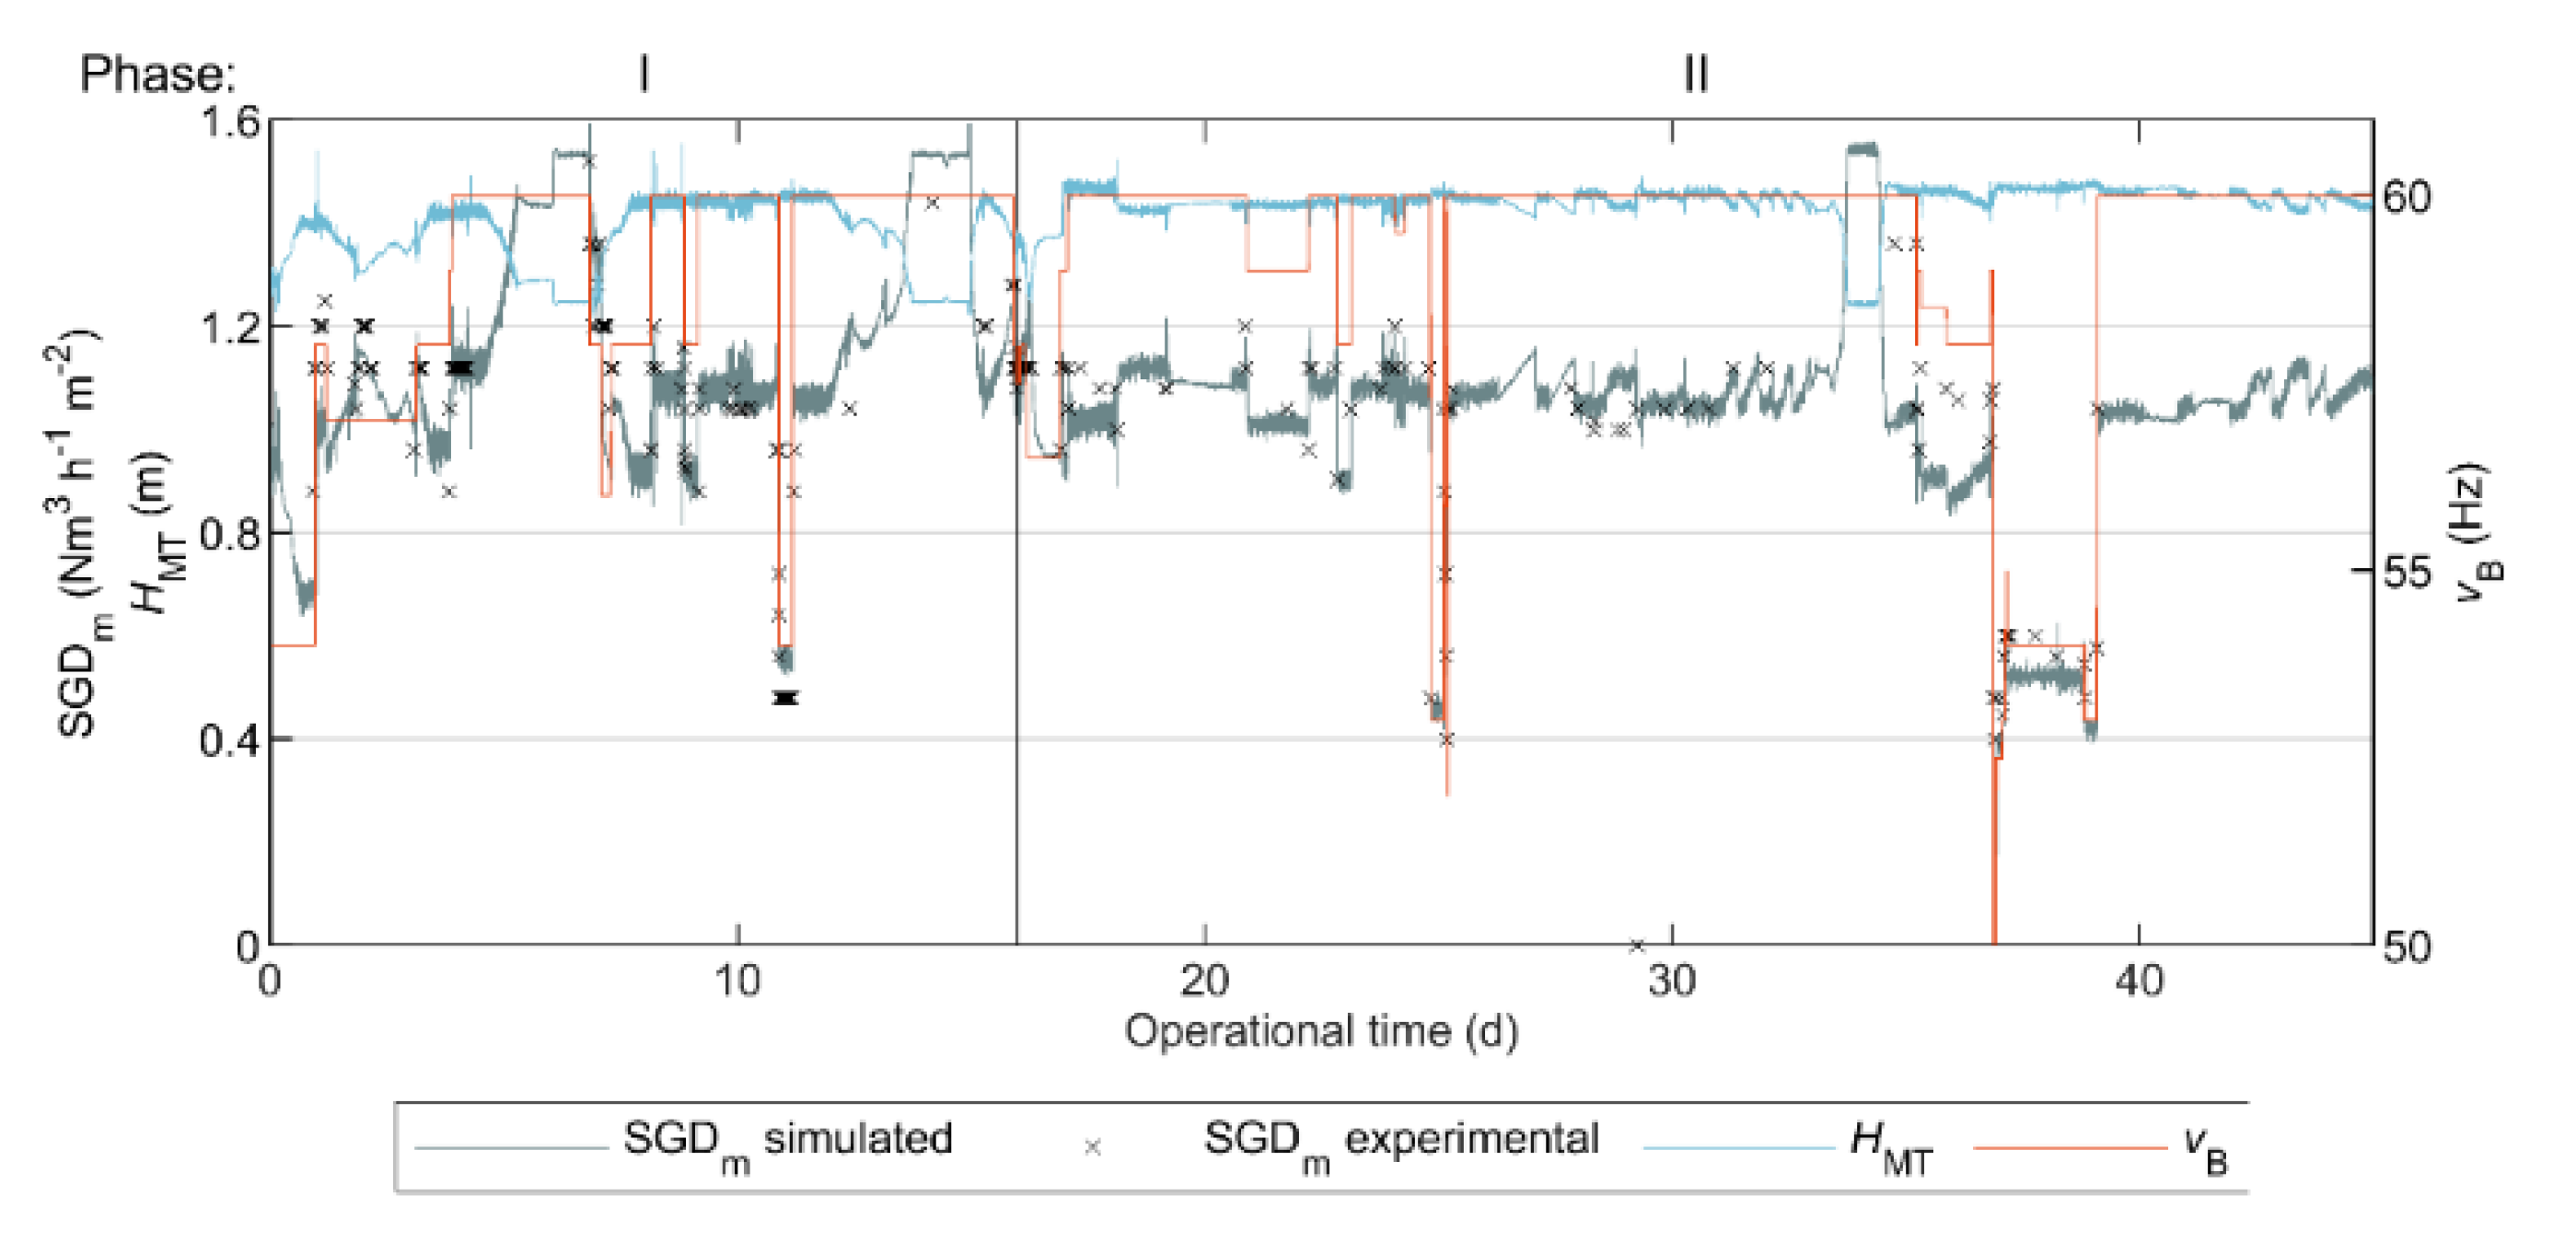
- Relating in-situ measurements of sludge filterability with AnMBR filtration performance indices, i.e., FR and , allowed us to identify the prevailing gas sparging rate as being the cause of filtration performance deterioration or improvement in the AnMBR.
- In-situ measurements of sludge filterability with the AnDFCm proved an appropriate input variable for manipulating FE dosage for fouling control in AnMBRs.
Supplementary Materials
Author Contributions
Funding
Acknowledgments
Conflicts of Interest
References
- Skouteris, G.; Hermosilla, D.; López, P.; Negro, C.; Blanco, Á. Anaerobic membrane bioreactors for wastewater treatment: A review. Chem. Eng. J. 2012, 198–199, 138–148. [Google Scholar] [CrossRef]
- Ozgun, H.; Dereli, R.K.; Ersahin, M.E.; Kinaci, C.; Spanjers, H.; van Lier, J.B. A review of anaerobic membrane bioreactors for municipal wastewater treatment: Integration options, limitations and expectations. Sep. Purif. Technol. 2013, 118, 89–104. [Google Scholar] [CrossRef]
- Judd, S.; Judd, C. (Eds.) The MBR Book: Principles and Applications of Membrane Bioreactors for Water and Wastewater Treatment, 2nd ed.; Butterworth-Heinemann: Oxford, UK, 2011; ISBN 9780080966823. [Google Scholar]
- Deng, L.; Guo, W.; Ngo, H.H.; Zhang, H.; Wang, J.; Li, J.; Xia, S.; Wu, Y. Biofouling and control approaches in membrane bioreactors. Bioresour. Technol. 2016, 221, 656–665. [Google Scholar] [CrossRef] [PubMed]
- Dereli, R.K.; Ersahin, M.E.; Ozgun, H.; Ozturk, I.; Jeison, D.; van der Zee, F.; van Lier, J.B. Potentials of anaerobic membrane bioreactors to overcome treatment limitations induced by industrial wastewaters. Bioresour. Technol. 2012, 122, 160–170. [Google Scholar] [CrossRef]
- Stuckey, D.C. Recent developments in anaerobic membrane reactors. Bioresour. Technol. 2012, 122, 137–148. [Google Scholar] [CrossRef]
- Koseoglu, H.; Yigit, N.O.; Iversen, V.; Drews, A.; Kitis, M.; Lesjean, B.; Kraume, M. Effects of several different flux enhancing chemicals on filterability and fouling reduction of membrane bioreactor (MBR) mixed liquors. J. Memb. Sci. 2008, 320, 57–64. [Google Scholar] [CrossRef]
- Iversen, V. Comprehensive Assessment of Flux Enhancers in Membrane Bioreactors for Wastewater Treatment; Technische Universität Berlin: Berlin, Germany, 2010. [Google Scholar]
- Iversen, V.; Mehrez, R.; Horng, R.Y.; Chen, C.H.; Meng, F.; Drews, A.; Lesjean, B.; Ernst, M.; Jekel, M.; Kraume, M. Fouling mitigation through flocculants and adsorbents addition in membrane bioreactors: Comparing lab and pilot studies. J. Memb. Sci. 2009, 345, 21–30. [Google Scholar] [CrossRef]
- Kulesha, O.; Maletskyi, Z.; Ratnaweera, H. State-of-the-art of membrane flux enhancement in membrane bioreactor. Cogent Eng. 2018, 5, 1–30. [Google Scholar] [CrossRef]
- Dong, Q.; Parker, W.; Dagnew, M. Impact of FeCl₃ dosing on AnMBR treatment of municipal wastewater. Water Res. 2015, 80, 281–293. [Google Scholar] [CrossRef]
- Dong, Q.; Parker, W.; Dagnew, M. Dynamic characterization of a FeCl3-dosed anaerobic membrane bioreactor (AnMBR) treating municipal wastewater. Water Sci. Technol. 2018, 2017, 481–491. [Google Scholar] [CrossRef]
- Teli, A.; Antonelli, M.; Bonomo, L.; Malpei, F. MBR fouling control and permeate quality enhancement by polyaluminium chloride dosage: A case study. Water Sci. Technol. 2012, 66, 1289–1295. [Google Scholar] [CrossRef]
- Alkmim, A.R.; da Costa, P.R.; Moser, P.B.; França Neta, L.S.; Santiago, V.M.J.; Cerqueira, A.C.; Amaral, M.C.S. Long-term evaluation of different strategies of cationic polyelectrolyte dosage to control fouling in a membrane bioreactor treating refinery effluent. Environ. Technol. 2016, 37, 1026–1035. [Google Scholar] [CrossRef]
- Collins, J.H.; Yoon, S.-H.; Musale, D.; Kong, J.F.; Koppes, J.; Sundararajan, S.; Tsai, S.-P.; Hallsby, G.A.; Cachia, P.; Kronoveter, K. Membrane performance enhancer evaluations on pilot- and full-scale membrane bioreactors. Water Environ. J. 2006, 20, 43–47. [Google Scholar] [CrossRef]
- Wozniak, T. MBR design and operation using MPE-technology (Membrane Performance Enhancer). Desalination 2010, 250, 723–728. [Google Scholar] [CrossRef]
- Yoon, S.; Collins, J.H. A novel flux enhancing method for membrane bioreactor (MBR) process using polymer. Desalination 2006, 191, 52–61. [Google Scholar] [CrossRef]
- Munz, G.; Gori, R.; Mori, G.; Lubello, C. Powdered activated carbon and membrane bioreactors (MBRPAC) for tannery wastewater treatment: Long term effect on biological and filtration process performances. Desalination 2007, 207, 349–360. [Google Scholar] [CrossRef]
- Remy, M.J.J. Low concentration of powdered activated carbon decreases fouling in membrane bioreactors, Wageningen University, the Netherlands, 2012. Ph.D. Thesis, Wageningen University, Wageningen, the Netherlands, 2012. [Google Scholar]
- Xiong, Y.; Harb, M.; Hong, P.-Y. Characterization of biofoulants illustrates different membrane fouling mechanisms for aerobic and anaerobic membrane bioreactors. Sep. Purif. Technol. 2016, 157, 192–202. [Google Scholar] [CrossRef] [Green Version]
- Díaz, H.; Azócar, L.; Torres, A.; Lopes, S.I.C.; Jeison, D. Use of flocculants for increasing permeate flux in anaerobic membrane bioreactors. Water Sci. Technol. 2014, 69, 2237–2242. [Google Scholar] [CrossRef]
- Kooijman, G.; Lopes, W.; Zhou, Z.; Guo, H.; de Kreuk, M.; Spanjers, H.; van Lier, J. Impact of coagulant and flocculant addition to an anaerobic dynamic membrane bioreactor (AnDMBR) treating waste-activated sludge. Membranes (Basel) 2017, 7, 18. [Google Scholar] [CrossRef] [Green Version]
- Braguglia, C.M.; Mininni, G.; Rolle, E. Influence of anaerobic digestion on particle surface charge and optimal polymer dosage. Water Sci. Technol. 2006, 54, 43–50. [Google Scholar] [CrossRef]
- Odriozola, M.; Lousada-Ferreira, M.; Spanjers, H.; van Lier, J.B. Effect of sludge characteristics on optimal required dosage of flux enhancer in anaerobic membrane bioreactors. J. Memb. Sci. 2020, 619, 118776. [Google Scholar] [CrossRef]
- Zhang, Q.; Singh, S.; Stuckey, D.C. Fouling reduction using adsorbents/flocculants in a submerged anaerobic membrane bioreactor. Bioresour. Technol. 2017, 239, 226–235. [Google Scholar] [CrossRef] [PubMed]
- Brauns, E.; Van Hoof, E.; Huyskens, C.; De Wever, H. On the concept of a supervisory, fuzzy set logic based, advanced filtration control in membrane bioreactors. Desalin. Water Treat. 2011, 29, 119–127. [Google Scholar] [CrossRef]
- Meng, F.; Zhang, S.; Oh, Y.; Zhou, Z.; Shin, H.-S.S.; Chae, S.-R.R. Fouling in membrane bioreactors: An updated review. Water Res. 2017, 114, 151–180. [Google Scholar] [CrossRef] [PubMed]
- American Public Health Association; American Water Works Association; Water Environment Federation. Standard Methods for the Examination of Water and Wastewater, 20th ed.; Cleseceri, L.S., Greenberg, A.E., Eaton, A.D., Eds.; APHA/AWWA/WEF: Washington, DC, USA, 1999. [Google Scholar]
- Muñoz Sierra, J.D.; Oosterkamp, M.J.; Wang, W.; Spanjers, H.; van Lier, J.B. Impact of long-term salinity exposure in anaerobic membrane bioreactors treating phenolic wastewater: Performance robustness and endured microbial community. Water Res. 2018, 141, 172–184. [Google Scholar] [CrossRef] [PubMed]
- Spanjers, H.; Vanrolleghem, P.A. Respirometry. In Experimental Methods in Wastewater Treatment; van Loosdrecht, M.C., Nielsen, P.H., Lopez-Vazquez, C.M., Brdjanovic, D., Eds.; IWA Publishing: London, UK, 2016. [Google Scholar]
- Janssen, L.P.B.; Warmoeskerken, M.M.C. Transport Phenomena Data Companion, 3rd ed.; Delftse Universitaire Pers: Delft, The Netherlands, 1997; ISBN1 9040713022. ISBN2 9789040713026. [Google Scholar]
- Wendland, C.; Deegener, S.; Behrendt, J.; Toshev, P.; Otterpohl, R. Anaerobic digestion of blackwater from vacuum toilets and kitchen refuse in a continuous stirred tank reactor (CSTR). Water Sci. Technol. 2007, 55, 187–194. [Google Scholar] [CrossRef] [Green Version]
- De Graaff, M.S.; Temmink, H.; Zeeman, G.; Buisman, C.J.N. Anaerobic Treatment of Concentrated Black Water in a UASB Reactor at a Short HRT. Water 2010, 2, 101–119. [Google Scholar] [CrossRef]
- Hendriks, A.T.W.M.; van Lier, J.B.; de Kreuk, M.K. Growth media in anaerobic fermentative processes: The underestimated potential of thermophilic fermentation and anaerobic digestion. Biotechnol. Adv. 2018, 36, 1–13. [Google Scholar] [CrossRef] [Green Version]
- Tervahauta, T.; van der Weijden, R.D.; Flemming, R.L.; Hernández Leal, L.; Zeeman, G.; Buisman, C.J.N. Calcium phosphate granulation in anaerobic treatment of black water: A new approach to phosphorus recovery. Water Res. 2014, 48, 632–642. [Google Scholar] [CrossRef]
- Cunha, J.R.; Tervahauta, T.; van der Weijden, R.D.; Hernández Leal, L.; Zeeman, G.; Buisman, C.J.N. Simultaneous recovery of calcium phosphate granules and methane in anaerobic treatment of black water: Effect of bicarbonate and calcium fluctuations. J. Environ. Manag. 2018, 216, 399–405. [Google Scholar] [CrossRef]
- Christensen, M.L.; Niessen, W.; Sørensen, N.B.; Hansen, S.H.; Jørgensen, M.K.; Nielsen, P.H. Sludge fractionation as a method to study and predict fouling in MBR systems. Sep. Purif. Technol. 2018, 194, 329–337. [Google Scholar] [CrossRef]
- Gil, J.A.; Krzeminski, P.; Van Lier, J.B.; Van Der Graaf, J.H.J.M.; Wijffels, T.; Prats, D. Analysis of the filterability in industrial MBRs. Influence of activated sludge parameters and constituents on filterability. J. Memb. Sci. 2011, 385–386, 96–109. [Google Scholar] [CrossRef]
- Huang, B.C.; Guan, Y.F.; Chen, W.; Yu, H.Q. Membrane fouling characteristics and mitigation in a coagulation-assisted microfiltration process for municipal wastewater pretreatment. Water Res. 2017, 123, 216–223. [Google Scholar] [CrossRef]
- Hamedi, H.; Ehteshami, M.; Mirbagheri, S.A.; Rasouli, S.A.; Zendehboudi, S. Current Status and Future Prospects of Membrane Bioreactors (MBRs) and Fouling Phenomena: A Systematic Review. Can. J. Chem. Eng. 2019, 97, 32–58. [Google Scholar] [CrossRef] [Green Version]
- Belfort, G.; Davis, R.H.; Zydney, A.L. The behavior of suspensions and macromolecular solutions in crossflow microfiltration. J. Memb. Sci. 1994, 96, 1–58. [Google Scholar] [CrossRef]
- Shen, L.G.; Lei, Q.; Chen, J.R.; Hong, H.C.; He, Y.M.; Lin, H.J. Membrane fouling in a submerged membrane bioreactor: Impacts of floc size. Chem. Eng. J. 2015, 269, 328–334. [Google Scholar] [CrossRef]
- De Temmerman, L.; Maere, T.; Temmink, H.; Zwijnenburg, A.; Nopens, I. The effect of fine bubble aeration intensity on membrane bioreactor sludge characteristics and fouling. Water Res. 2015, 76, 99–109. [Google Scholar] [CrossRef]
- Huyskens, C.; Lenaerts, S.; Brauns, E.; Diels, L.; De Wever, H. Study of (ir)reversible fouling in MBRs under various operating conditions using new on-line fouling sensor. Sep. Purif. Technol. 2011, 81, 208–215. [Google Scholar] [CrossRef]
- Zhang, J.S.; Zhou, J.T.; Su, Y.; Fane, A.G. Transient Performance of MBR with Flux Enhancing Polymer Addition. Sep. Sci. Technol. 2010, 45, 982–992. [Google Scholar] [CrossRef]
- Koseoglu, H.; Yigit, N.O.; Civelekoglu, G.; Harman, B.I.; Kitis, M. Effects of chemical additives on filtration and rheological characteristics of MBR sludge. Bioresour. Technol. 2012, 117, 48–54. [Google Scholar] [CrossRef]
- Krzeminski, P.; Iglesias-Obelleiro, A.; Madebo, G.; Garrido, J.M.; van der Graaf, J.H.J.M.; van Lier, J.B. Impact of temperature on raw wastewater composition and activated sludge filterability in full-scale MBR systems for municipal sewage treatment. J. Memb. Sci. 2012, 423–424, 348–361. [Google Scholar] [CrossRef]
- Wu, J.; Chen, F.; Huang, X.; Geng, W.; Wen, X. Using inorganic coagulants to control membrane fouling in a submerged membrane bioreactor. Desalination 2006, 197, 124–136. [Google Scholar] [CrossRef]
- Chae, S.-R.; Ahn, Y.-T.; Kang, S.-T.; Shin, H.-S. Mitigated membrane fouling in a vertical submerged membrane bioreactor (VSMBR). J. Memb. Sci. 2006, 280, 572–581. [Google Scholar] [CrossRef]
- Naessens, W. Towards Improved Membrane Fouling Modelling: From an Empirical to a Spatially Explicit Framework. Ph.D. Thesis, Ghent University, Ghent, Belgium, 2018. [Google Scholar]
- Iversen, V.; Mohaupt, J.; Drews, A.; Kraume, M.; Lesjean, B. Side effects of flux enhancing chemicals in membrane bioreactors (MBRs): Study on their biological toxicity and their residual fouling propensity. Water Sci. Technol. 2008, 57, 117–123. [Google Scholar] [CrossRef]
- Odriozola, M.; Abraham, E.; Lousada-Ferreira, M.; Spanjers, H.; van Lier, J.B. Identification of the Methanogenesis Inhibition Mechanism Using Comparative Analysis of Mathematical Models. Front. Bioeng. Biotechnol. 2019, 7, 93. [Google Scholar] [CrossRef] [Green Version]
- Yoon, S.H.; Collins, J.H.; Musale, D.; Sundararajan, S.; Tsai, S.P.; Hallsby, G.A.; Kong, J.F.; Koppes, J.; Cachia, P. Effects of flux enhancing polymer on the characteristics of sludge in membrane bioreactor process. Water Sci. Technol. 2005, 51, 151–157. [Google Scholar] [CrossRef]
- Iversen, V.; Koseoglu, H.; Yigit, N.O.; Drews, A.; Kitis, M.; Lesjean, B.; Kraume, M. Impacts of membrane flux enhancers on activated sludge respiration and nutrient removal in MBRs. Water Res. 2009, 43, 822–830. [Google Scholar] [CrossRef]
- Kooijman, G.; De Kreuk, M.K.; Van Lier, J.B. Influence of chemically enhanced primary treatment on anaerobic digestion and dewaterability of waste sludge. Water Sci. Technol. 2017, 76, 1629–1639. [Google Scholar] [CrossRef]
- Kraume, M.; Wedi, D.; Schaller, J.; Iversen, V.; Drews, A. Fouling in MBR: What use are lab investigations for full scale operation? Desalination 2009, 236, 94–103. [Google Scholar] [CrossRef]


| Variable | FR | csCOD | |||
|---|---|---|---|---|---|
| 1 | |||||
| FR | 0.96 * (8 × 10−12) | 1 | |||
| 0.64 * (8 × 10−5) | 0.75 * (8 × 10−5) | 1 | |||
| csCOD | 0.75 * (9 × 10−5) | 0.82 * (5 × 10−6) | 0.82 * (5 × 10−6) | 1 | |
| −0.89 * (8 × 10−8) | −0.84 * (2 × 10−6) | −0.58 * (6 × 10−3) | −0.74 * (1 × 10−4) | 1 |
Publisher’s Note: MDPI stays neutral with regard to jurisdictional claims in published maps and institutional affiliations. |
© 2020 by the authors. Licensee MDPI, Basel, Switzerland. This article is an open access article distributed under the terms and conditions of the Creative Commons Attribution (CC BY) license (http://creativecommons.org/licenses/by/4.0/).
Share and Cite
Odriozola, M.; Morales, N.; Vázquez-Padín, J.R.; Lousada-Ferreira, M.; Spanjers, H.; van Lier, J.B. Fouling Mitigation by Cationic Polymer Addition into a Pilot-Scale Anaerobic Membrane Bioreactor Fed with Blackwater. Polymers 2020, 12, 2383. https://doi.org/10.3390/polym12102383
Odriozola M, Morales N, Vázquez-Padín JR, Lousada-Ferreira M, Spanjers H, van Lier JB. Fouling Mitigation by Cationic Polymer Addition into a Pilot-Scale Anaerobic Membrane Bioreactor Fed with Blackwater. Polymers. 2020; 12(10):2383. https://doi.org/10.3390/polym12102383
Chicago/Turabian StyleOdriozola, Magela, Nicolás Morales, Jose R. Vázquez-Padín, Maria Lousada-Ferreira, Henri Spanjers, and Jules B. van Lier. 2020. "Fouling Mitigation by Cationic Polymer Addition into a Pilot-Scale Anaerobic Membrane Bioreactor Fed with Blackwater" Polymers 12, no. 10: 2383. https://doi.org/10.3390/polym12102383