Interactions of Casein and Polypeptides in Multilayer Films Studied by FTIR and Molecular Dynamics


Abstract
:
1. Introduction
2. Materials and Methods
2.1. Materials
2.2. Method
2.2.1. Fourier Transform Infrared-Attenuated Total Reflection
2.2.2. Molecular Dynamics Simulations
3. Results and Discussion
4. Conclusions
Supplementary Materials
Author Contributions
Funding
Conflicts of Interest
References
- Decher, G.; Schlenoff, J. (Eds.) Multilayer Thin Films; Wiley-VCH: Weinheim, Germany, 2012. [Google Scholar]
- Richardson, J.J.; Björnmalm, M.; Caruso, F. Technology-driven layer-by-layer assembly of nanofilms. Science 2015, 348, aaa2491. [Google Scholar] [CrossRef] [PubMed] [Green Version]
- Wright, P.E.; Dyson, H.J. Intrinsically unstructured proteins: Re-assessing the protein structure-function paradigm. J. Mol. Biol. 1999, 293, 321–331. [Google Scholar] [CrossRef]
- Tompa, P. Intrinsically unstructured proteins. Trends Biochem. Sci. 2002, 27, 527–533. [Google Scholar] [CrossRef]
- Dyson, H.J.; Wright, P.E. Coupling of folding and binding for unstructured proteins. Curr. Opin. Struct. Biol. 2002, 12, 54–60. [Google Scholar] [CrossRef]
- Szyk-Warszyńska, L.; Gergely, C.; Jarek, E.; Cuisinier, F.; Socha, R.P.; Warszyński, P. Calcium uptake by casein embedded in polyelectrolyte multilayer. Colloids Surf. A Physicochem. Eng. Asp. 2009, 343, 118–126. [Google Scholar] [CrossRef]
- Szyk-Warszyńska, L.; Piekoszewska, J.; Warszyński, P. Formation and stability of poly-l-lysine/casein multilayers. Adsorption 2010, 16, 241–248. [Google Scholar] [CrossRef]
- Lundin, M.; Elofsson, U.M.; Blomberg, E.; Rutland, M.W. Adsorption of lysozyme, β-casein and their layer-by-layer formation on hydrophilic surfaces: Effect of ionic strength. Colloids Surf. B Biointerfaces 2010, 77, 1–11. [Google Scholar] [CrossRef]
- Swaisgood, H.E. Chemistry of the caseins. In Advanced Diary Chemistry, Proteins; McSweeney, P.F.F., Paul, L.H., Eds.; Kluwer Academic/Plenum Publishers: New York, NY, USA, 2003; pp. 139–202. ISBN 978-0-306-47271-8. [Google Scholar]
- Holt, C. Structure and stability of bovine Casein Micelles. Adv. Protein Chem. 1992, 43, 63–151. [Google Scholar]
- Holt, C.; Carver, J.A.; Ecroyd, H.; Thorn, D.C. Invited review: Caseins and the casein micelle: Their biological functions, structures, and behavior in foods. J. Dairy Sci. 2013, 96, 6127–6146. [Google Scholar] [CrossRef] [PubMed]
- Horne, D.S. Casein Micelle Structure and Stability. Milk Proteins 2014, 169–200. [Google Scholar]
- Lucey, J.A.; Horne, D.S. Perspectives on casein interactions. Int. Dairy J. 2018, 85, 56–65. [Google Scholar] [CrossRef]
- Sahu, A.; Kasoju, N.; Bora, U. Fluorescence study of the curcumin-casein micelle complexation and its application as a drug nanocarrier to cancer cells. Biomacromolecules 2008, 9, 2905–2912. [Google Scholar] [CrossRef] [PubMed]
- Elzoghby, A.O.; Abo El-Fotoh, W.S.; Elgindy, N.A. Casein-based formulations as promising controlled release drug delivery systems. J. Control. Release 2011, 153, 206–216. [Google Scholar] [CrossRef] [PubMed]
- Głąb, T.K.; Boratyński, J. Potential of Casein as a Carrier for Biologically Active Agents. Top. Curr. Chem. 2017, 375, 71. [Google Scholar] [CrossRef]
- Kull, T.; Nylander, T.; Tiberg, F.; Wahlgren, N.M. Effect of Surface Properties and Added Electrolyte on the Structure of -Casein Layers Adsorbed at the Solid/Aqueous Interface. Langmuir 1997, 13, 5141–5147. [Google Scholar] [CrossRef]
- Horne, D.S. Casein interactions: Casting light on the black boxes, the structure in dairy products. Int. Dairy J. 1998, 8, 171–177. [Google Scholar] [CrossRef]
- Semo, E.; Kesselman, E.; Danino, D.; Livney, Y.D. Casein micelle as a natural nano-capsular vehicle for nutraceuticals. Food Hydrocoll. 2007, 21, 936–942. [Google Scholar] [CrossRef]
- Tavares, G.M.; Croguennec, T.; Carvalho, A.F.; Bouhallab, S. Milk proteins as encapsulation devices and delivery vehicles: Applications and trends. Trends Food Sci. Technol. 2014, 37, 5–20. [Google Scholar] [CrossRef]
- Penalva, R.; Esparza, I.; Agüeros, M.; Gonzalez-Navarro, C.J.; Gonzalez-Ferrero, C.; Irache, J.M. Casein nanoparticles as carriers for the oral delivery of folic acid. Food Hydrocoll. 2015, 44, 399–406. [Google Scholar] [CrossRef] [Green Version]
- Song, F.; Zhang, L.-M.; Yang, C.; Yan, L. Genipin-crosslinked casein hydrogels for controlled drug delivery. Int. J. Pharm. 2009, 373, 41–47. [Google Scholar] [CrossRef]
- Livney, Y.D. Milk proteins as vehicles for bioactives. Curr. Opin. Colloid Interface Sci. 2010, 15, 73–83. [Google Scholar] [CrossRef]
- Zhang, A.; Xie, H.; Liu, N.; Chen, B.L.; Ping, H.; Fu, Z.Y.; Su, B.L. Crystallization of calcium carbonate under the influences of casein and magnesium ions. RSC Adv. 2016, 6, 110362–110366. [Google Scholar] [CrossRef]
- Mishra, S.P.; Tiwari, D.; Dubey, R.S.; Mishra, M. Biosorptive behaviour of casein for Zn2+, Hg2+ and Cr3+: Effects of physico-chemical treatments. Bioresour. Technol. 1998, 63, 1–5. [Google Scholar] [CrossRef]
- Svensson, O.; Kurut, A.; Skepö, M. Adsorption of β-casein to hydrophilic silica surfaces. Effect of pH and electrolyte. Food Hydrocoll. 2014, 36, 332–338. [Google Scholar] [CrossRef]
- Doster, W.; Gebhardt, R.; Gehrke, R.; Müller-Buschbaum, P.; Maurer, E.; Bauer, E. Thin Casein Films as Prepared by Spin-Coating: Influence of Film Thickness and of pH. Biomacromolecules 2006, 7, 1773–1780. [Google Scholar]
- Curley, D.M.; Kumosinski, T.F.; Unruh, J.J.; Farrell, H.M. Changes in the Secondary Structure of Bovine Casein by Fourier Transform Infrared Spectroscopy: Effects of Calcium and Temperature. J. Dairy Sci. 1998, 81, 3154–3162. [Google Scholar] [CrossRef]
- Nylander, T.; Wahlgren, N.M. Competitive and Sequential Adsorption of β-Casein and β-Lactoglobulin on Hydrophobic Surfaces and the Interfacial Structure of β-Casein. J. Colloid Interface Sci. 1994, 162, 151–162. [Google Scholar] [CrossRef]
- Imamura, K.; Shimomura, M.; Nagai, S.; Akamatsu, M.; Nakanishi, K. Adsorption characteristics of various proteins to a titanium surface. J. Biosci. Bioeng. 2008, 106, 273–278. [Google Scholar] [CrossRef]
- Tercinier, L.; Ye, A.; Anema, S.; Singh, A.; Singh, H. Characterisation of milk protein adsorption onto hydroxyapatite. Int. Dairy J. 2017, 66, 27–33. [Google Scholar] [CrossRef]
- Szyk-Warszyńska, L.; Kilan, K.; Socha, R.P. Characterization of casein and poly-l-arginine multilayer films. J. Colloid Interface Sci. 2014, 423, 76–84. [Google Scholar] [CrossRef] [Green Version]
- Khademhosseini, A.; Suh, K.Y.; Yang, J.M.; Eng, G.; Yeh, J.; Levenberg, S.; Langer, R. Layer-by-layer deposition of hyaluronic acid and poly-L-lysine for patterned cell co-cultures. Biomaterials 2004, 25, 3583–3592. [Google Scholar] [CrossRef]
- Choi, Y.H.; Liu, F.; Kim, J.-S.; Choi, Y.K.; Jong, S.P.; Kim, S.W. Polyethylene glycol-grafted poly-l-lysine as polymeric gene carrier. J. Control. Release 1998, 54, 39–48. [Google Scholar] [CrossRef]
- Lan, Q.; Wang, Y.; Wang, S.; Liu, Y. In vitro study of alginate/poly-l-arginine microcapsules as a protein or anticancer drug carrier. In Proceedings of the 7th Asian-Pacific Conference on Medical and Biological Engineering, Beijing, China, 22–25 April 2008; Volume 19, pp. 32–35. [Google Scholar]
- Mattner, F.; Fleitmann, J.K.; Lingnau, K.; Schmidt, W.; Egyed, A.; Fritz, J.; Zauner, W.; Wittmann, B.; Gorny, I.; Berger, M.; et al. Vaccination with poly-l-arginine as immunostimulant for peptide vaccines: Induction of potent and long-lasting T-cell responses against cancer antigens. Cancer Res. 2002, 62, 1477–1480. [Google Scholar]
- Sukhorukov, G.B.; Montrel, M.M.; Petrov, A.; Shabarchina, L.I.; Sukhorukov, B.I. Spectroscopic Study of Thin Multilaver Films of the Complexes of Nucleic Acids with Cationic Amphiphiles and Polycations: Their Possible Use as Sensor Elements. In Proceedings of the International Solid-State Sensors and Actuators Conference, TRANSDUCERS ’95, Stockholm, Sweden, 25–29 June 1995; Volume 2, pp. 524–527. [Google Scholar]
- Kim, E.J.; Shim, G.; Kim, K.; Kwon, I.C.; Oh, Y.K.; Shim, C.K. Hyaluronic acid complexed to biodegradable poly L-arginine for targeted delivery of siRNAs. J. Gene Med. 2009, 11, 791–803. [Google Scholar] [CrossRef]
- Mai, J.C.; Shen, H.; Watkins, S.C.; Cheng, T.; Robbins, P.D. Efficiency of protein transduction is cell type-dependent and is enhanced by dextran sulfate. J. Biol. Chem. 2002, 277, 30208–30218. [Google Scholar] [CrossRef]
- Mitchell, D.J.; Steinman, L.; Kim, D.T.; Fathman, C.G.; Rothbard, J.B. Polyarginine enters cells more efficiently than other polycationic homopolymers. J. Pept. Res. 2000, 56, 318–325. [Google Scholar] [CrossRef] [PubMed]
- Futaki, S.; Suzuki, T.; Ohashi, W.; Yagami, T.; Tanaka, S.; Ueda, K.; Sugiura, Y. Arginine-rich peptides. An abundant source of membrane-permeable peptides having potential as carriers for intracellular protein delivery. J. Biol. Chem. 2001, 276, 5836–5840. [Google Scholar] [CrossRef]
- Takechi, Y.; Tanaka, H.; Kitayama, H.; Yoshii, H.; Tanaka, M.; Saito, H. Comparative study on the interaction of cell-penetrating polycationic polymers with lipid membranes. Chem. Phys. Lipids 2012, 165, 51–58. [Google Scholar] [CrossRef]
- Reuter, M.; Schwieger, C.; Meister, A.; Karlsson, G.; Blume, A. Poly-l-lysines and poly-l-arginines induce leakage of negatively charged phospholipid vesicles and translocate through the lipid bilayer upon electrostatic binding to the membrane. Biophys. Chem. 2009, 144, 27–37. [Google Scholar] [CrossRef] [Green Version]
- Woods, A.S.; Ferré, S. Amazing stability of the arginine-phosphate electrostatic interaction. J. Proteome Res. 2005. [Google Scholar] [CrossRef]
- Pantos, A.; Tsogas, I.; Paleos, C.M. Guanidinium group: A versatile moiety inducing transport and multicompartmentalization in complementary membranes. Biochim. Biophys. Acta Biomembr. 2008, 1778, 811–823. [Google Scholar] [CrossRef] [PubMed] [Green Version]
- Li, L.; Vorobyov, I.; Allen, T.W. The different interactions of lysine and arginine side chains with lipid membranes. J. Phys. Chem. B 2013, 117, 11906–11920. [Google Scholar] [CrossRef] [PubMed]
- Hashimoto, T.; Kawazu, T.; Nagasaki, T.; Murakami, A.; Yamaoka, T. Quantitative comparison between poly(L-arginine) and poly(l-lysine) at each step of polyplex-based gene transfection using a microinjection technique. Sci. Technol. Adv. Mater. 2012, 13, 8. [Google Scholar] [CrossRef] [PubMed]
- Naik, R.J.; Chandra, P.; Mann, A.; Ganguli, M. Exogenous and cell surface glycosaminoglycans alter DNA delivery efficiency of arginine and lysine homopeptides in distinctly different ways. J. Biol. Chem. 2011, 286, 18982–18993. [Google Scholar] [CrossRef]
- Willard, H.H.; Merritt, L.L.; Dean, J.A.; Settle, F.A. Infrared Spectroscopy. In Instrumental Methods of Analysis; CBS Publishers & Distributors: New Delhi, India, 1981; pp. 177–216. ISBN 8123909438. [Google Scholar]
- Al-Jowder, O.; Defernez, M.; Kemsley, E.K.; Wilson, R.H. Mid-infrared spectroscopy and chemometrics for the authentication of meat products. J. Agric. Food Chem. 1999, 47, 3210–3218. [Google Scholar] [CrossRef] [PubMed]
- Kumosinski, T.F.; Farrell, H.M. Determination of the global secondary structure of proteins by Fourier transform infrared (FTIR) spectroscopy. Trends Food Sci. Technol. 1993, 4, 169–175. [Google Scholar] [CrossRef]
- Šašić, S.; Ozaki, Y. Short-Wave Near-Infrared Spectroscopy of Biological Fluids. 1. Quantitative Analysis of Fat, Protein, and Lactose in Raw Milk by Partial Least-Squares Regression and Band Assignment. Anal. Chem. 2001, 73, 64–71. [Google Scholar] [CrossRef]
- Goormaghtigh, E.; Gasper, R.; Bénard, A.; Goldsztein, A.; Raussens, V. Protein secondary structure content in solution, films and tissues: Redundancy and complementarity of the information content in circular dichroism, transmission and ATR FTIR spectra. Biochim. Biophys. Acta Proteins Proteomics 2009, 1794, 1332–1343. [Google Scholar] [CrossRef] [PubMed]
- Grewal, M.K.; Huppertz, T.; Vasiljevic, T. FTIR fingerprinting of structural changes of milk proteins induced by heat treatment, deamidation and dephosphorylation. Food Hydrocoll. 2018, 80, 160–167. [Google Scholar] [CrossRef]
- Krieger, E.; Vriend, G. New ways to boost molecular dynamics simulations. J. Comput. Chem. 2015, 36, 996–1007. [Google Scholar] [CrossRef] [PubMed]
- Case, D.A.; Babin, V.; Berryman, J.T.; Betz, R.M.; Cai, Q.; Cerutti, D.S.; Cheatham, T.E.; Darden, T.A.; Duke, R.E.; Gohlke, H.; et al. AMBER 14; University of California: San Francisco, CA, USA, 2014. [Google Scholar]
- Kumosinski, T.F.; Brown, E.M.; Farrell, H.M. Predicted Energy-Minimized α s1-Casein Working Model. In Molecular Modeling; Thomas, F., Kumosinski, M.N.L., Eds.; American Chemical Society: Washington, DC, USA, 1994; pp. 368–390. [Google Scholar]
- Kumosinski, T.F.; Brown, E.M.; Farrell, H.M. Three-dimensional molecular modeling of bovine caseins: An energy-minimized beta-casein structure. J. Dairy Sci. 1993, 76, 931–945. [Google Scholar] [CrossRef]
- Xie, Y.; Jiang, Y.; Ben-Amotz, D. Detection of amino acid and peptide phosphate protonation using Raman spectroscopy. Anal. Biochem. 2005, 343, 223–230. [Google Scholar] [CrossRef] [PubMed]
- Krieger, E.; Nielsen, J.E.; Spronk, C.A.E.M.; Vriend, G. Fast empirical pKa prediction by Ewald summation. J. Mol. Graph. Model. 2006, 25, 481–486. [Google Scholar] [CrossRef] [PubMed]
- Wu, Z.; Cu, Q.; Yethiraj, A. Why do Arginine and Lysine Organize Lipids Differently? Insights from Coarse-Grained and Atomistic Simulations. J. Phys. Chem. B. 2013, 117, 12145–12156. [Google Scholar] [CrossRef] [PubMed]
- Bakshi, K.; Liyanage, M.R.; Volkin, D.B.; Middaugh, C.R. Fourier transform infrared spectroscopy of peptides. Methods Mol. Biol. 2014, 1088, 255–269. [Google Scholar] [PubMed]
- Barth, A. Infrared spectroscopy of proteins. Biochim. Biophys. Acta Bioenerg. 2007, 1767, 1073–1101. [Google Scholar] [CrossRef] [PubMed] [Green Version]
- Barth, A.; Zscherp, C. What vibrations tell us about proteins. Q. Rev. Biophys. 2002, 35, 369–430. [Google Scholar] [CrossRef] [PubMed]
- Parikh, S.J.; Kubicki, J.D.; Jonsson, C.M.; Jonsson, C.L.; Hazen, R.M.; Sverjensky, D.A.; Sparks, D.L. Evaluating Glutamate and Aspartate Binding Mechanisms to Rutile (α-TiO2) via ATR-FTIR Spectroscopy and Quantum Chemical Calculations. Langmuir 2011, 27, 1778–1787. [Google Scholar] [CrossRef] [PubMed]
- Pohle, W. The PO-2moiety—A hydrogen bonding acceptor in biological molecules. J. Mol. Struct. 1990, 219, 281–286. [Google Scholar] [CrossRef]
- Hübner, W.; Blume, A. Interactions at the lipid-water interface. Chem. Phys. Lipids 1998, 96, 99–123. [Google Scholar] [CrossRef]
- Pohle, W.; Bohl, M.; Böhlig, H. Interpretation of the influence of hydrogen bonding on the stretching vibrations of the PO-2 moiety. J. Mol. Struct. 1991, 242, 333–342. [Google Scholar] [CrossRef]
- Fernández, C.; Ausar, S.F.; Badini, R.G.; Castagna, L.F.; Bianco, I.D.; Beltramo, D.M. An FTIR spectroscopy study of the interaction between α s-casein-bound phosphoryl groups and chitosan. Int. Dairy J. 2003, 13, 897–901. [Google Scholar] [CrossRef]


| Casein Type | Sequence Name | Aminoacid Sequence | Aminoacid Number | Net Charge [e] |
|---|---|---|---|---|
| αs1-casein | Seq-A1 | ASP-ILE-LYS-GLN-MET-GLU-ALA-GLU-PSE-ILE-PSE-PSE-PSE-GLU-GLU-ILE-VAL-PRO- ASN-PSE-VAL | 56–76 | −14 |
| Seq-A2 | VAL-ASN-GLU-LEU-SER-LYS-ASP-ILE-GLY-PSE-GLU-PSE-THR-GLU-ASP-GLN- ALA-MET-GLU-ASP-ILE | 37–57 | −11 | |
| Seq-A3 | TYR-THR-ASP-ALA-PRO-SER-PHE-SER- ASP-ILE-PRO-ASN-PRO-ILE-GLY-SER-GLU-ASN-SER-GLU-LYS-THR-THR-MET-PRO-LYS-TRP | 173–199 | −3 | |
| β-casein | Seq-B1 | GLY-GLU-ILE-VAL-GLU-PSE-LEU-PSE-PSE- PSE-GLU-GLU-SER-ILE-THR-ARG-ILE-ASN-LYS-LYS-ILE | 10–30 | −9 |
| Seq-B2 | ILE-ASN-LYS-LYS-ILE-GLU-LYS-PHE-GLN- PSE-GLU-GLU-GLN-GLN-GLN-THR-GLU-ASP-GLU-LEU-GLN-ASP | 26–47 | −6 |
| Band Assignment | α-Casein | β-Casein | PLArg | PLL |
|---|---|---|---|---|
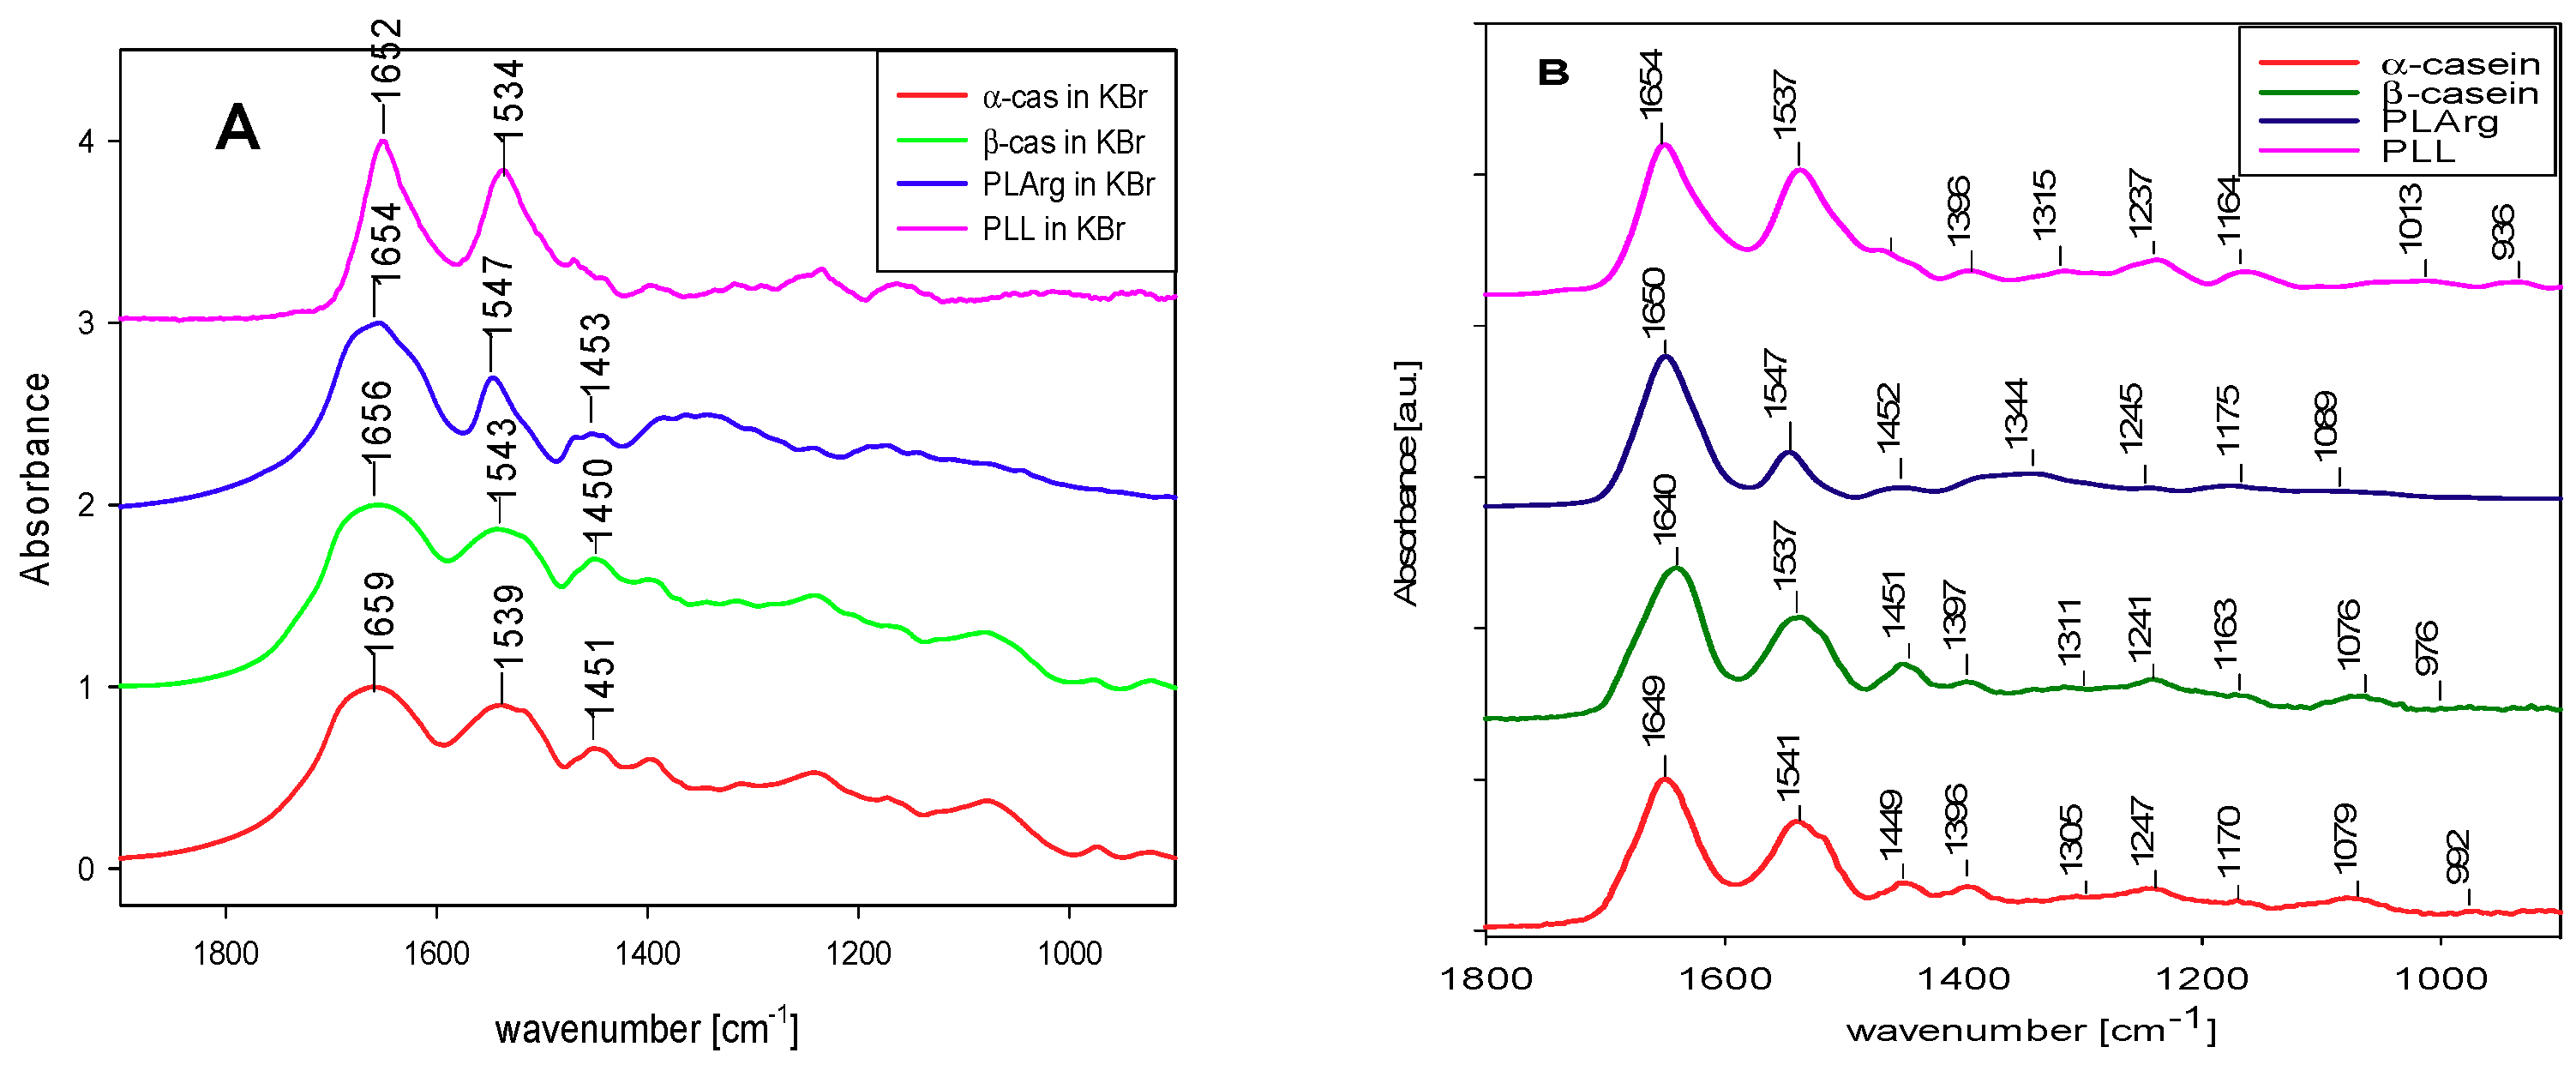
| Amide I in KBr | 1659 cm−1 | 1656 cm−1 | 1654 cm−1 | 1652 cm−1 |
| Amide I dry film | 1649 cm−1 | 1640 cm−1 | 1650 cm−1 | 1654 cm−1 |
| Amide II in KBr | 1539 cm−1 | 1543 cm−1 | 1547 cm−1 | 1534 cm−1 |
| Amide II dry film | 1541 cm−1 | 1537 cm−1 | 1547 cm−1 | 1537 cm−1 |
| Band Assignment | α-Casein in KBr | α-Casein Film on Ge | β-Casein in KBr | β-Casein Film on Ge | ||||
|---|---|---|---|---|---|---|---|---|
| cm−1 | % area | cm−1 | % area | cm−1 | % area | cm−1 | % area | |
| β-sheet aggregation | 1615 | 7 | 1615 | 6 | 1611 | 5 | 1615 | 9 |
| β-sheet | 1630 | 12 | 1631 | 25 | 1627 | 15 | 1633 | 27 |
| disordered structure | 1644 | 14 | 1646 | 24 | 1644 | 16 | 1646 | 24 |
| large loops | 1657 | 17 | 1658 | 20 | 1657 | 15 | 1658 | 19 |
| turns | 1672 | 22 | 1671 | 15 | 1672 | 23 | 1672 | 14 |
| β-sheet antiparallel | 1687 | 27 | 1686 | 10 | 1692 | 26 | 1686 | 7 |
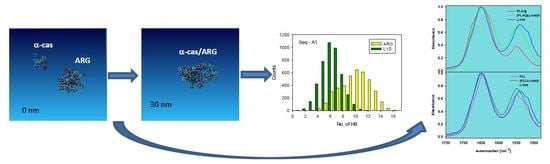
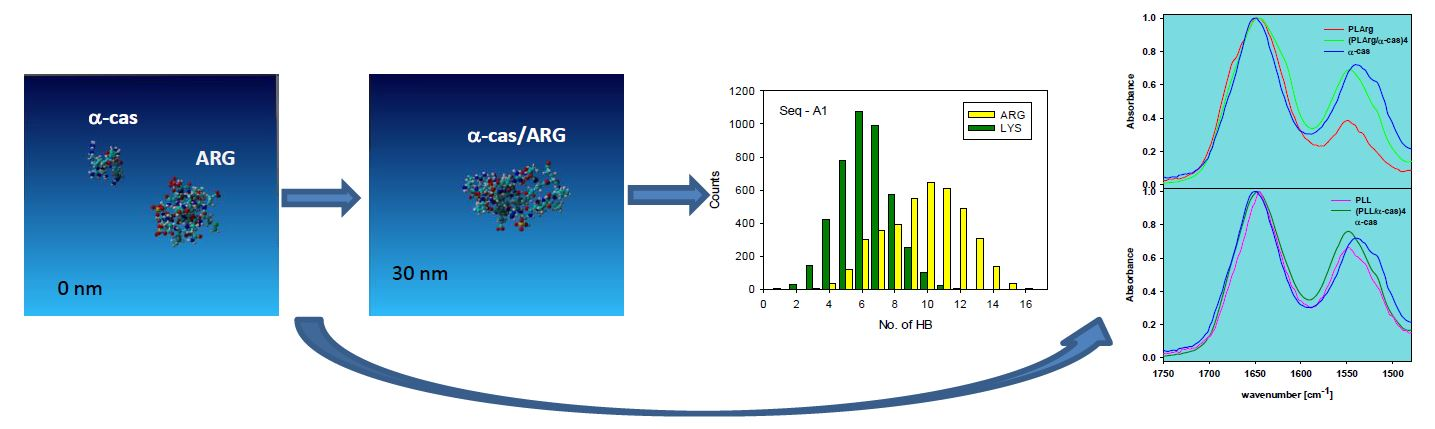
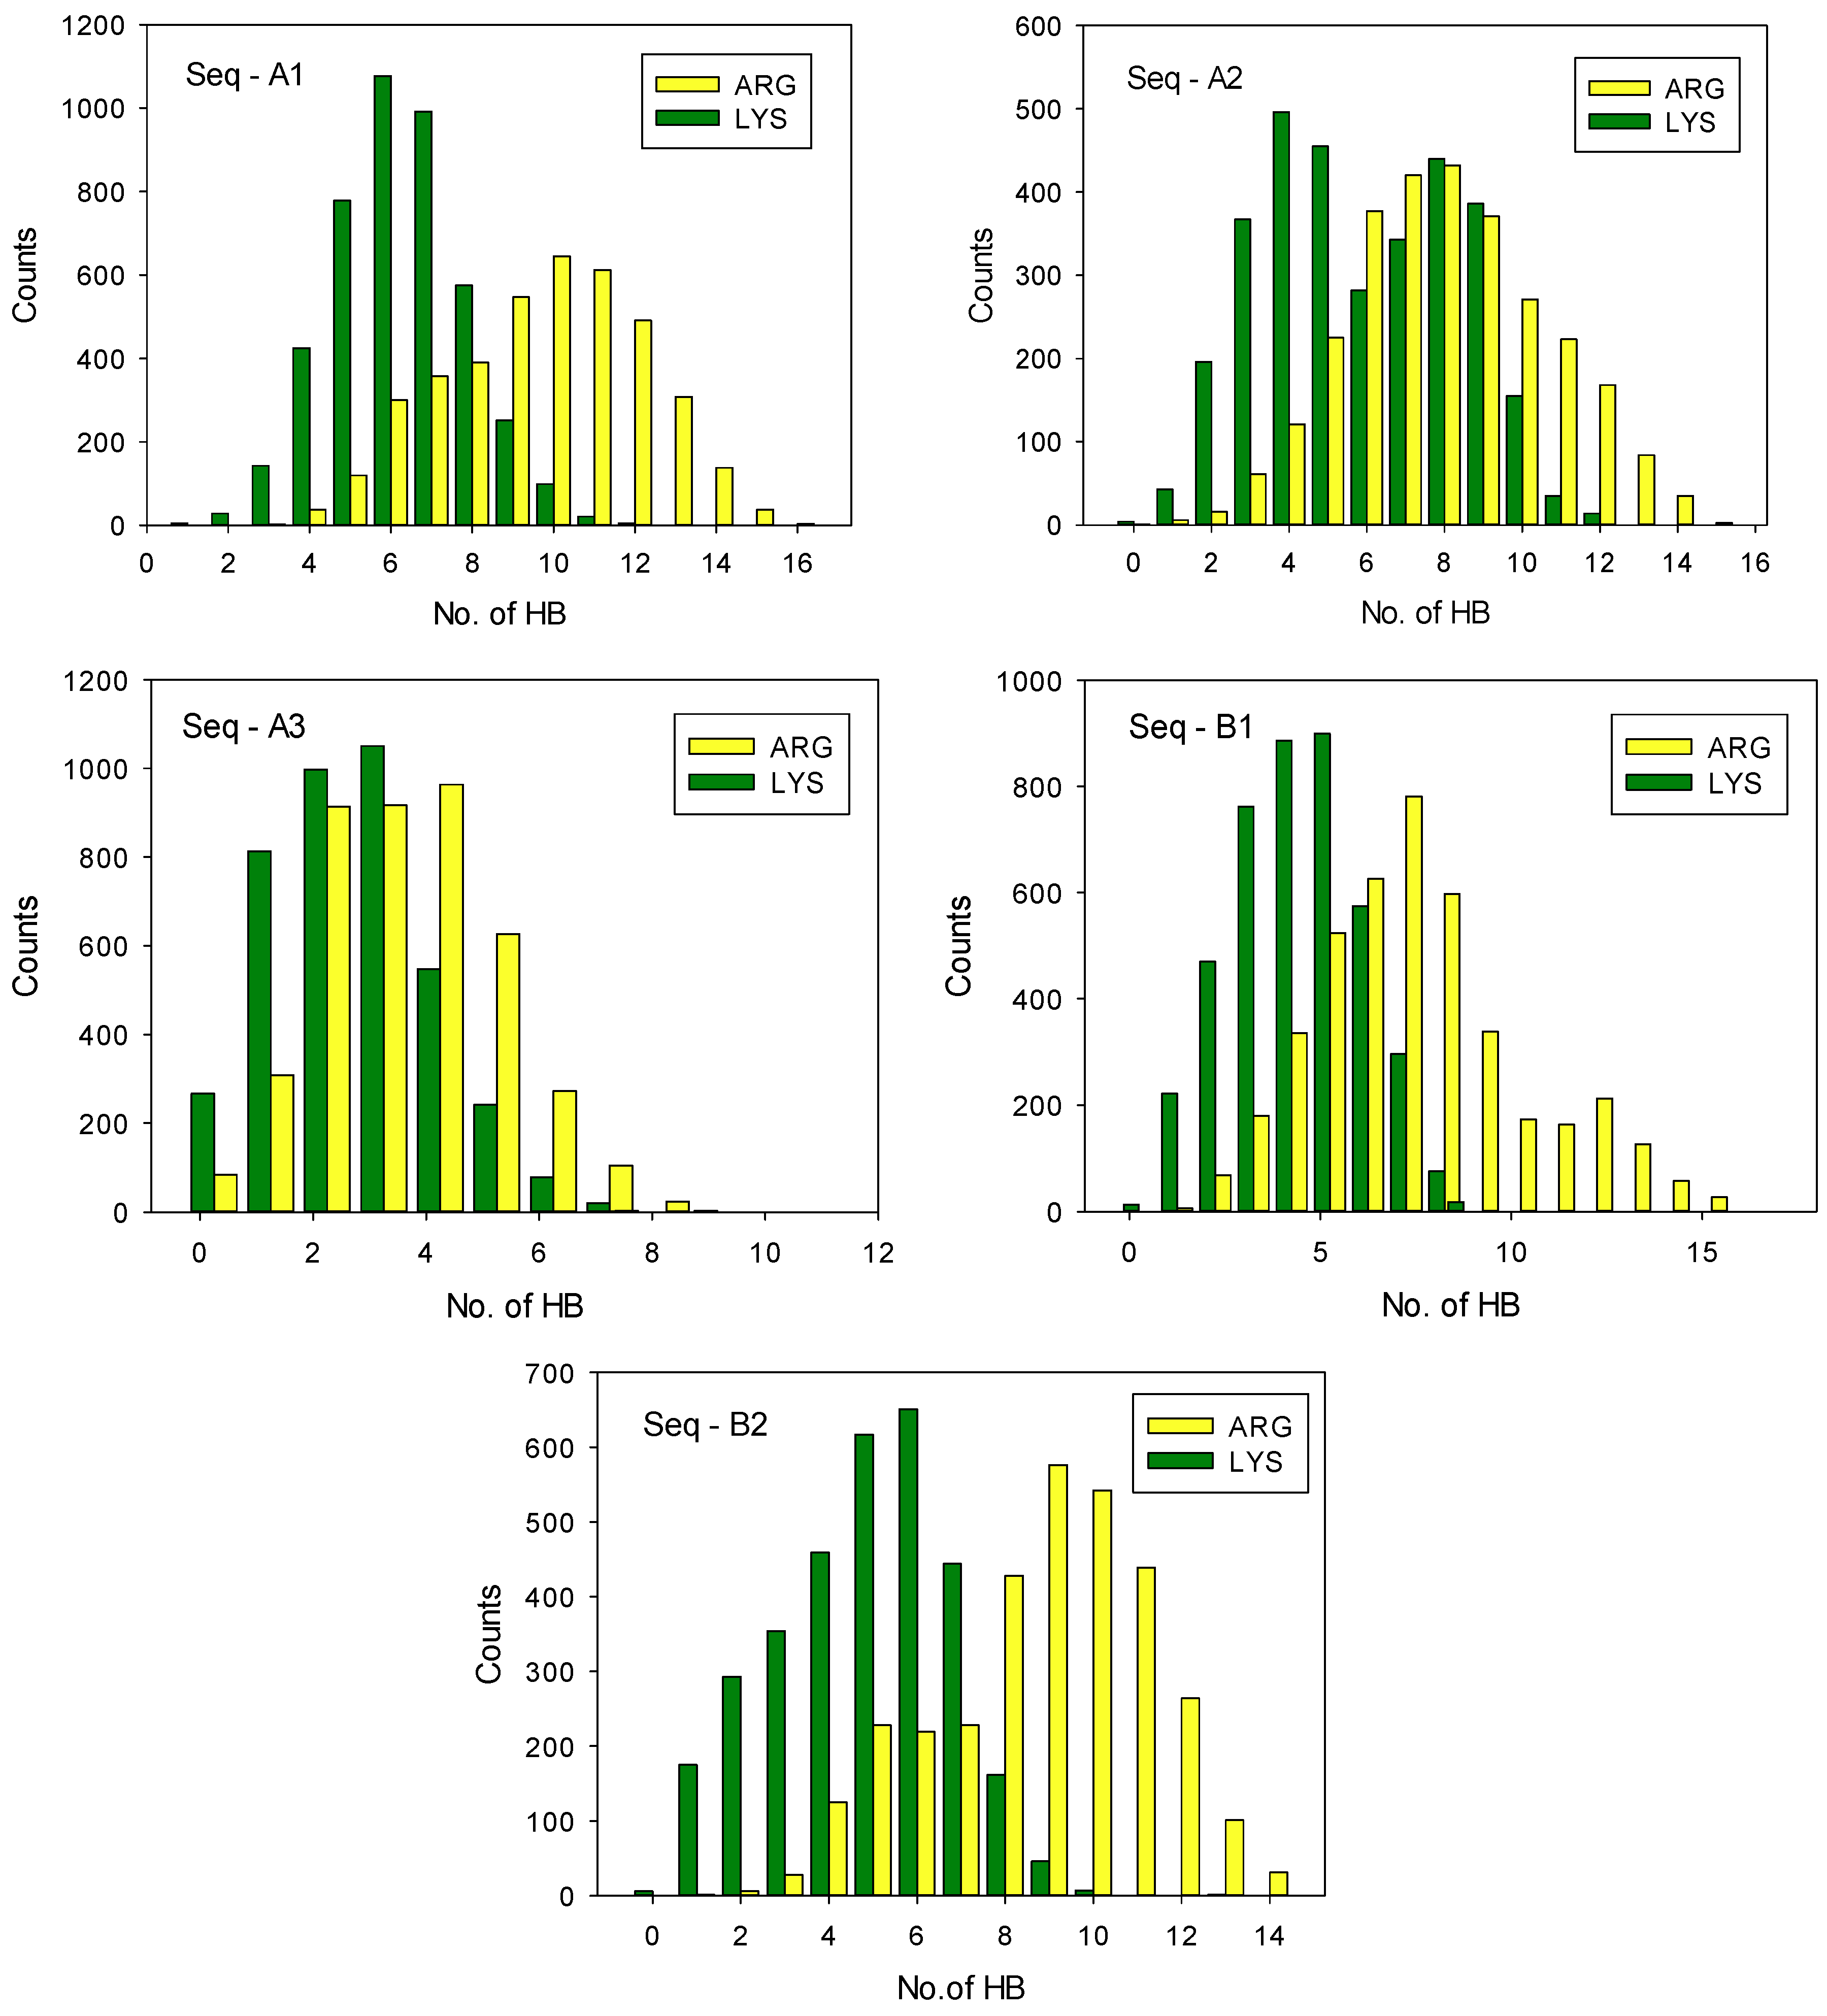
| Sequence | No. of PSE | No. of GLU | No. of ASP | Charge [e] | <HB> PLArg | <HB> PLL | ΔEHB [kcal/mol] |
|---|---|---|---|---|---|---|---|
| Seq–A1 | 5 | 4 | 1 | 14 | 10 | 6 | 17 ± 4 |
| Seq–A2 | 2 | 4 | 3 | 10 | 8 | 6 | 12 ± 3 |
| Seq–A3 | 0 | 2 | 2 | 3 | 4 | 3 | 5 ± 2 |
| Seq–B1 | 4 | 4 | 0 | 9 | 8 | 5 | 16 ± 4 |
| Seq–B2 | 1 | 5 | 2 | 6 | 9 | 5 | 18 ± 4 |
| Band assignment | Band frequency [cm−1] | α-cas [%] | (PLArg/α-cas) [%] | (PArg/α-cas)4 [%] | (PLL/α-cas) [%] | (PLL/α-cas)4 [%] |
| aggregate intermolecular | 1610–1620 | 6 | 10 | 14 | 9 | 11 |
| β-sheet | 1620–1642 | 24 | 19 | 19 | 17 | 21 |
| random coil | 1644–1648 | 24 | 19 | 21 | 23 | 20 |
| large loops | 1654–1658 | 20 | 20 | 23 | 24 | 22 |
| β-turns | 1667–1685 | 15 | 25 | 15 | 18 | 16 |
| β-sheet | 1688–1697 | 10 | 7 | 8 | 9 | 10 |
| Band assignment | Band frequency [cm−1] | β cas | (PLL/β-cas) | (PLArg/β-cas) | (PLL/β-cas) | (PLArg/β-cas)4 |
| aggregation intermolecular | 1610–1620 | 9 | 10 | 15 | 11 | 12 |
| β-sheet | 1620–1642 | 27 | 23 | 24 | 23 | 25 |
| random coil | 1644–1648 | 24 | 21 | 20 | 18 | 20 |
| large loops | 1654–1658 | 19 | 23 | 20 | 24 | 21 |
| β-turn | 1667–1685 | 14 | 17 | 16 | 20 | 18 |
| β-sheet | 1688–1697 | 7 | 6 | 5 | 4 | 4 |
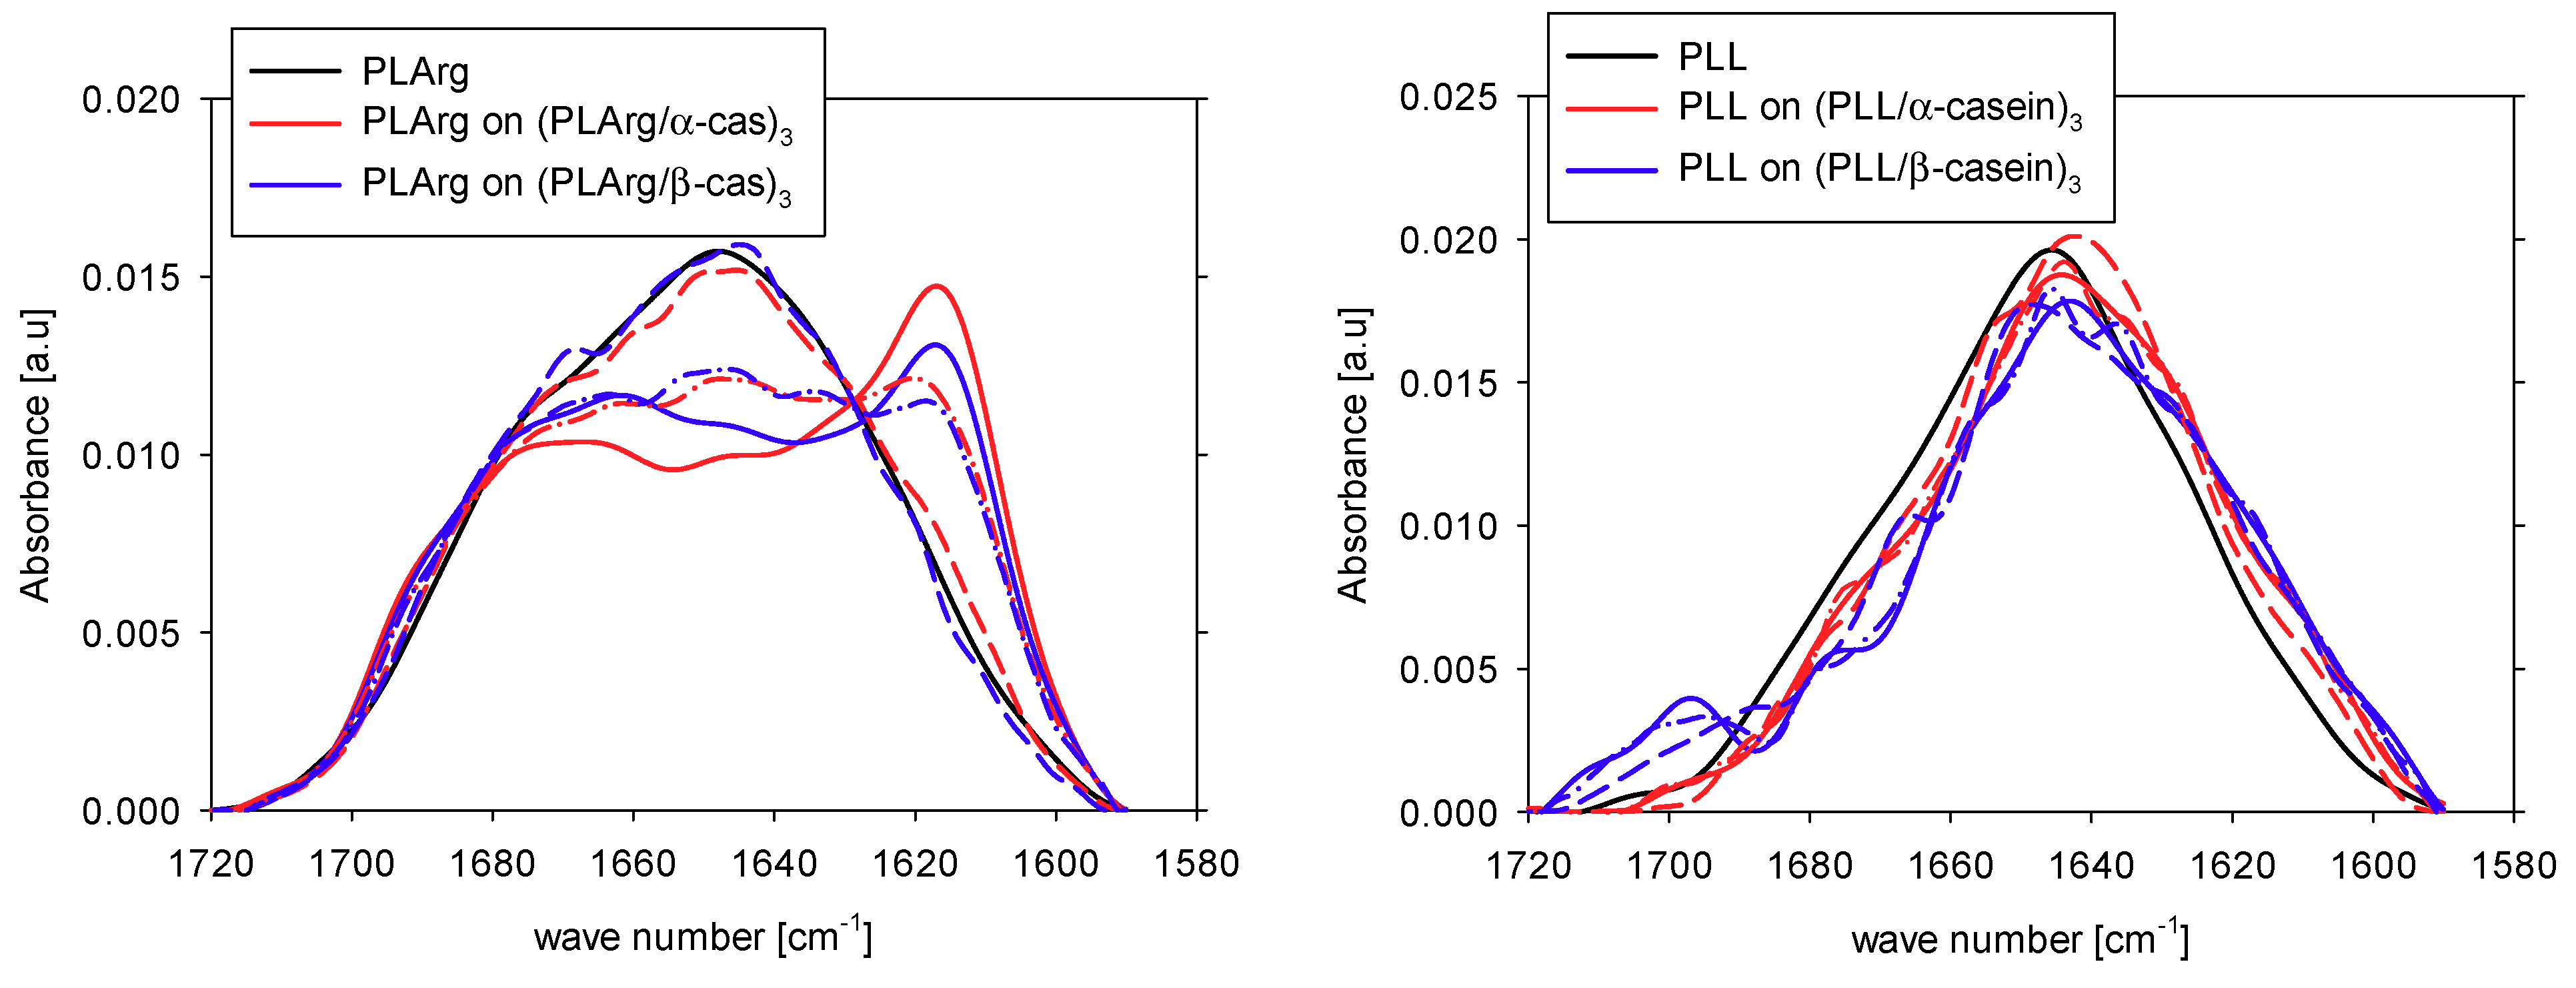
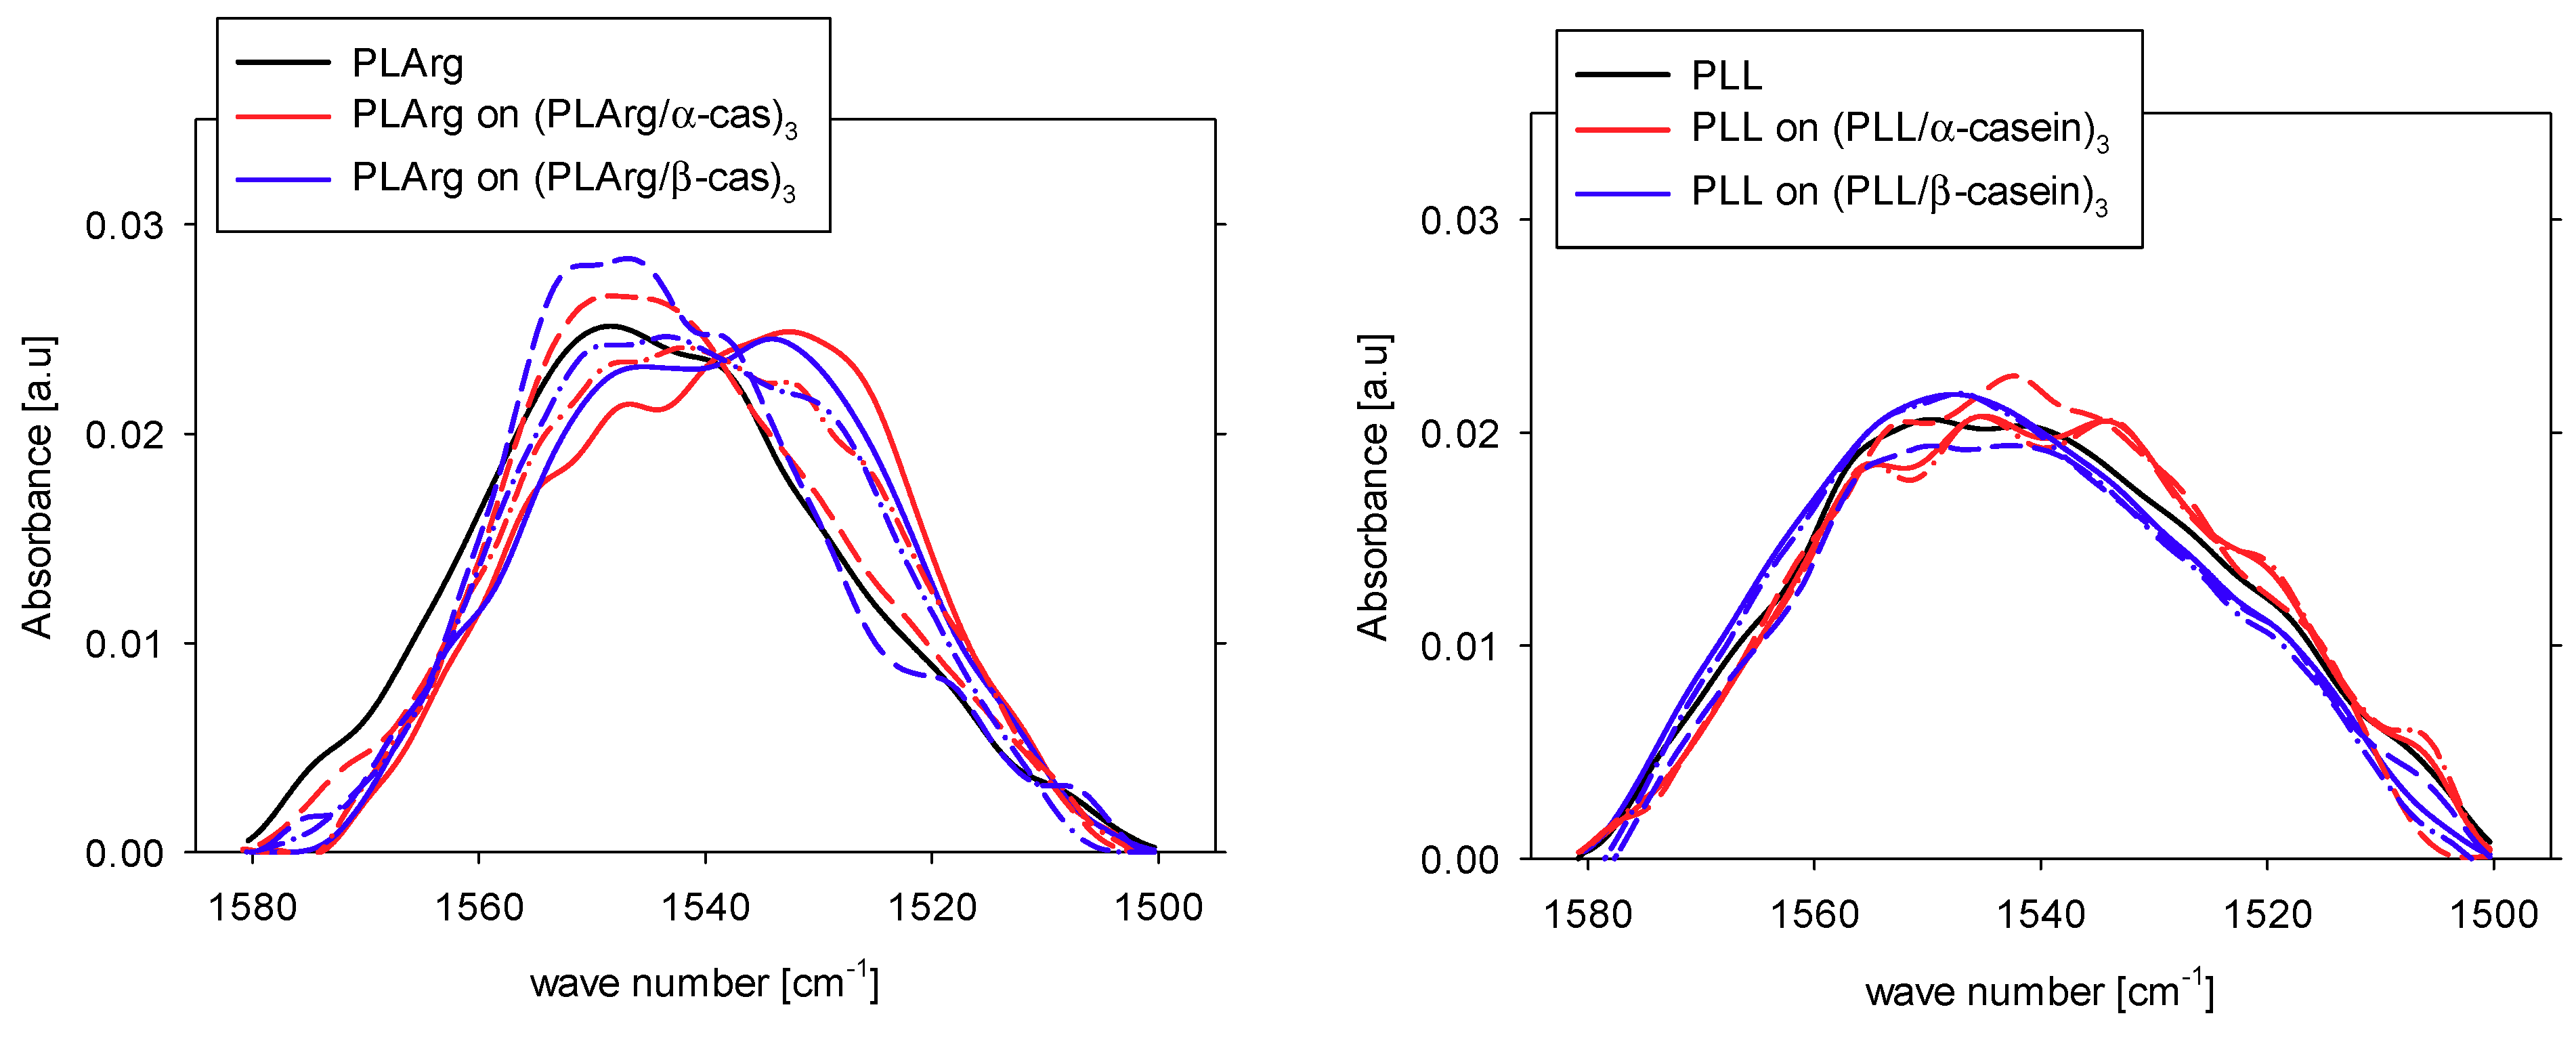
| Band assignment | Band frequency [cm−1] | PLArg [%] | PLArg(PLArg/α-cas)3 [%] | PLArg(PLArg/β-cas)3 [%] |
| aggregation intermolecular | 1610–1620 | 12 | 34 | 31 |
| β-sheet | 1620–1642 | 21 | 8 | 10 |
| Arginine | 1633 | |||
| random coil | 1644–1648 | 19 | 16 | 17 |
| large loops | 1654–1658 | 16 | 8 | 13 |
| β-turns | 1667–1685 | 21 | 24 | 15 |
| Arginine | 1673 | |||
| β-sheet | 1688–1697 | 10 | 10 | 14 |
| Band assignment | Band frequency [cm−1] | PLL | PLL(PLL/α-cas)3 | PLL(PLL/β-cas)3 |
| aggregation intermolecular | 1610–1620 | 8 | 18 | 16 |
| β-sheet | 1620–1642 | 22 | 19 | 21 |
| Lysine | 1629 | |||
| random coil | 1644–1648 | 23 | 30 | 25 |
| large loops | 1654–1658 | 24 | 21 | 20 |
| β-turn | 1667–1685 | 17 | 10 | 12 |
| β-sheet | 1688–1697 | 6 | 2 | 6 |
© 2019 by the authors. Licensee MDPI, Basel, Switzerland. This article is an open access article distributed under the terms and conditions of the Creative Commons Attribution (CC BY) license (http://creativecommons.org/licenses/by/4.0/).
Share and Cite
Szyk-Warszyńska, L.; Raszka, K.; Warszyński, P. Interactions of Casein and Polypeptides in Multilayer Films Studied by FTIR and Molecular Dynamics. Polymers 2019, 11, 920. https://doi.org/10.3390/polym11050920
Szyk-Warszyńska L, Raszka K, Warszyński P. Interactions of Casein and Polypeptides in Multilayer Films Studied by FTIR and Molecular Dynamics. Polymers. 2019; 11(5):920. https://doi.org/10.3390/polym11050920
Chicago/Turabian StyleSzyk-Warszyńska, Lilianna, Katarzyna Raszka, and Piotr Warszyński. 2019. "Interactions of Casein and Polypeptides in Multilayer Films Studied by FTIR and Molecular Dynamics" Polymers 11, no. 5: 920. https://doi.org/10.3390/polym11050920