Potential of Liquid Extraction Surface Analysis Mass Spectrometry (LESA—MS) for the Characterization of Polymer-Based Materials

Abstract
:
1. Introduction
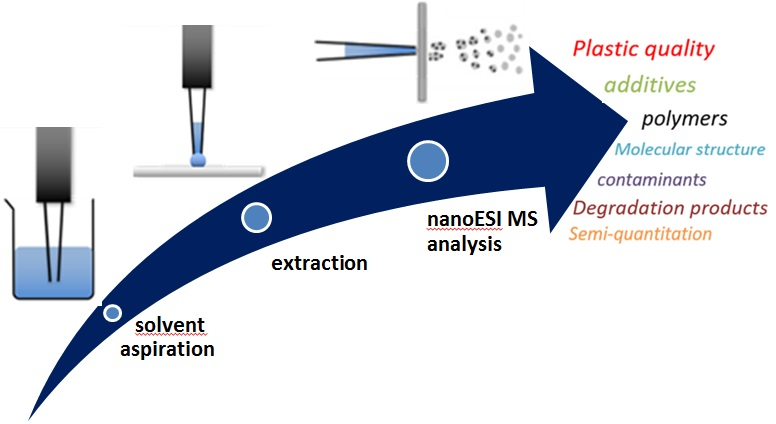
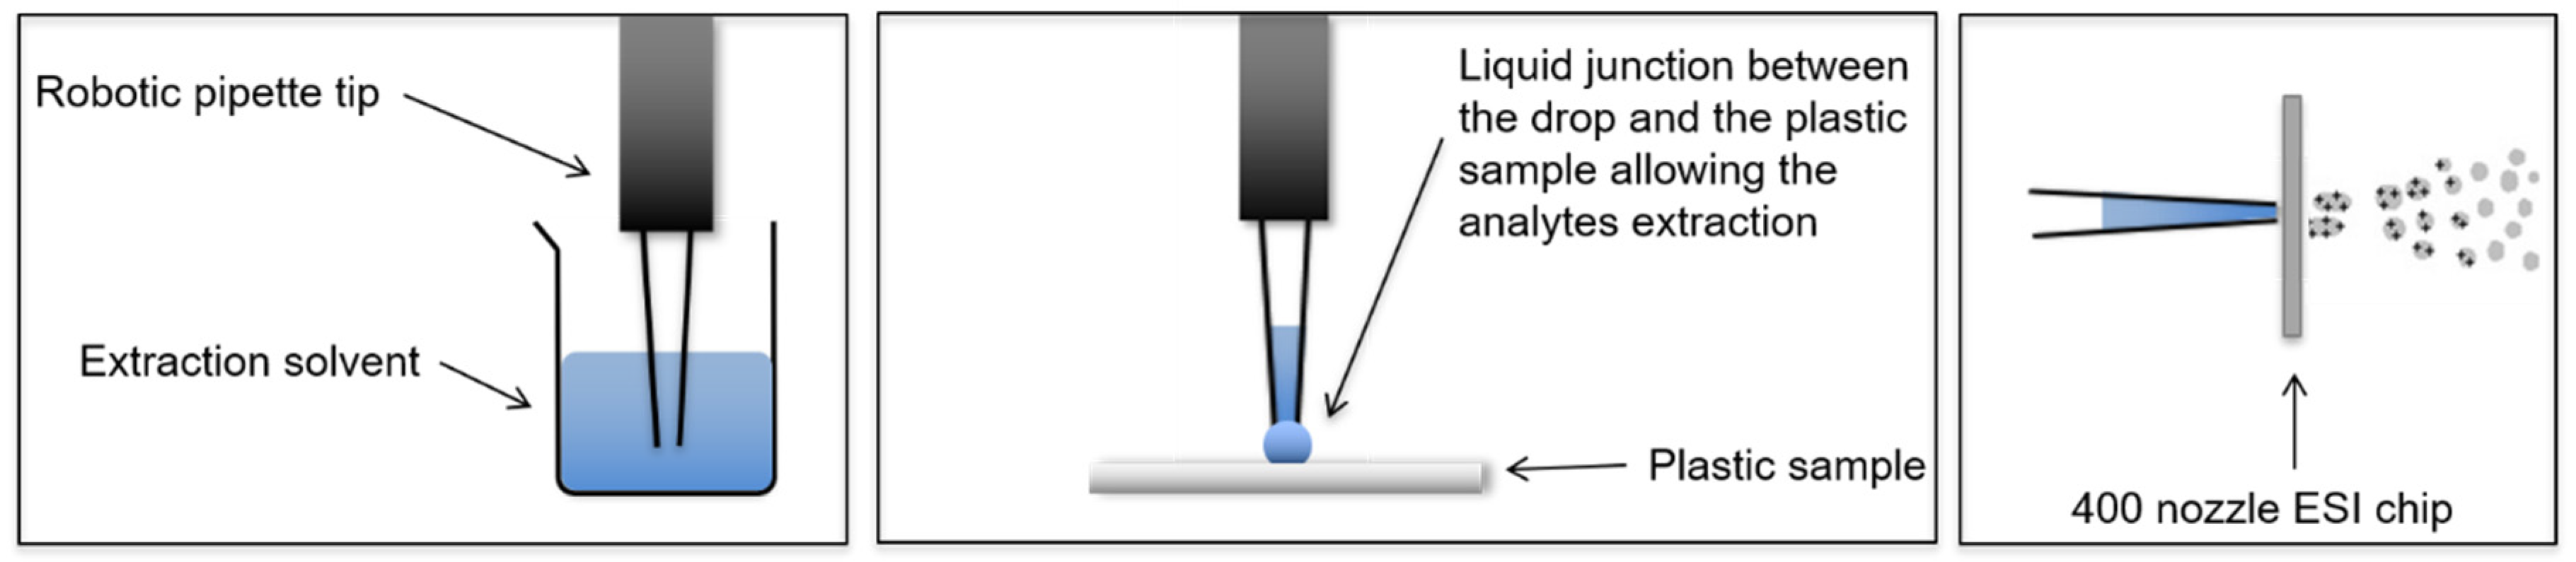
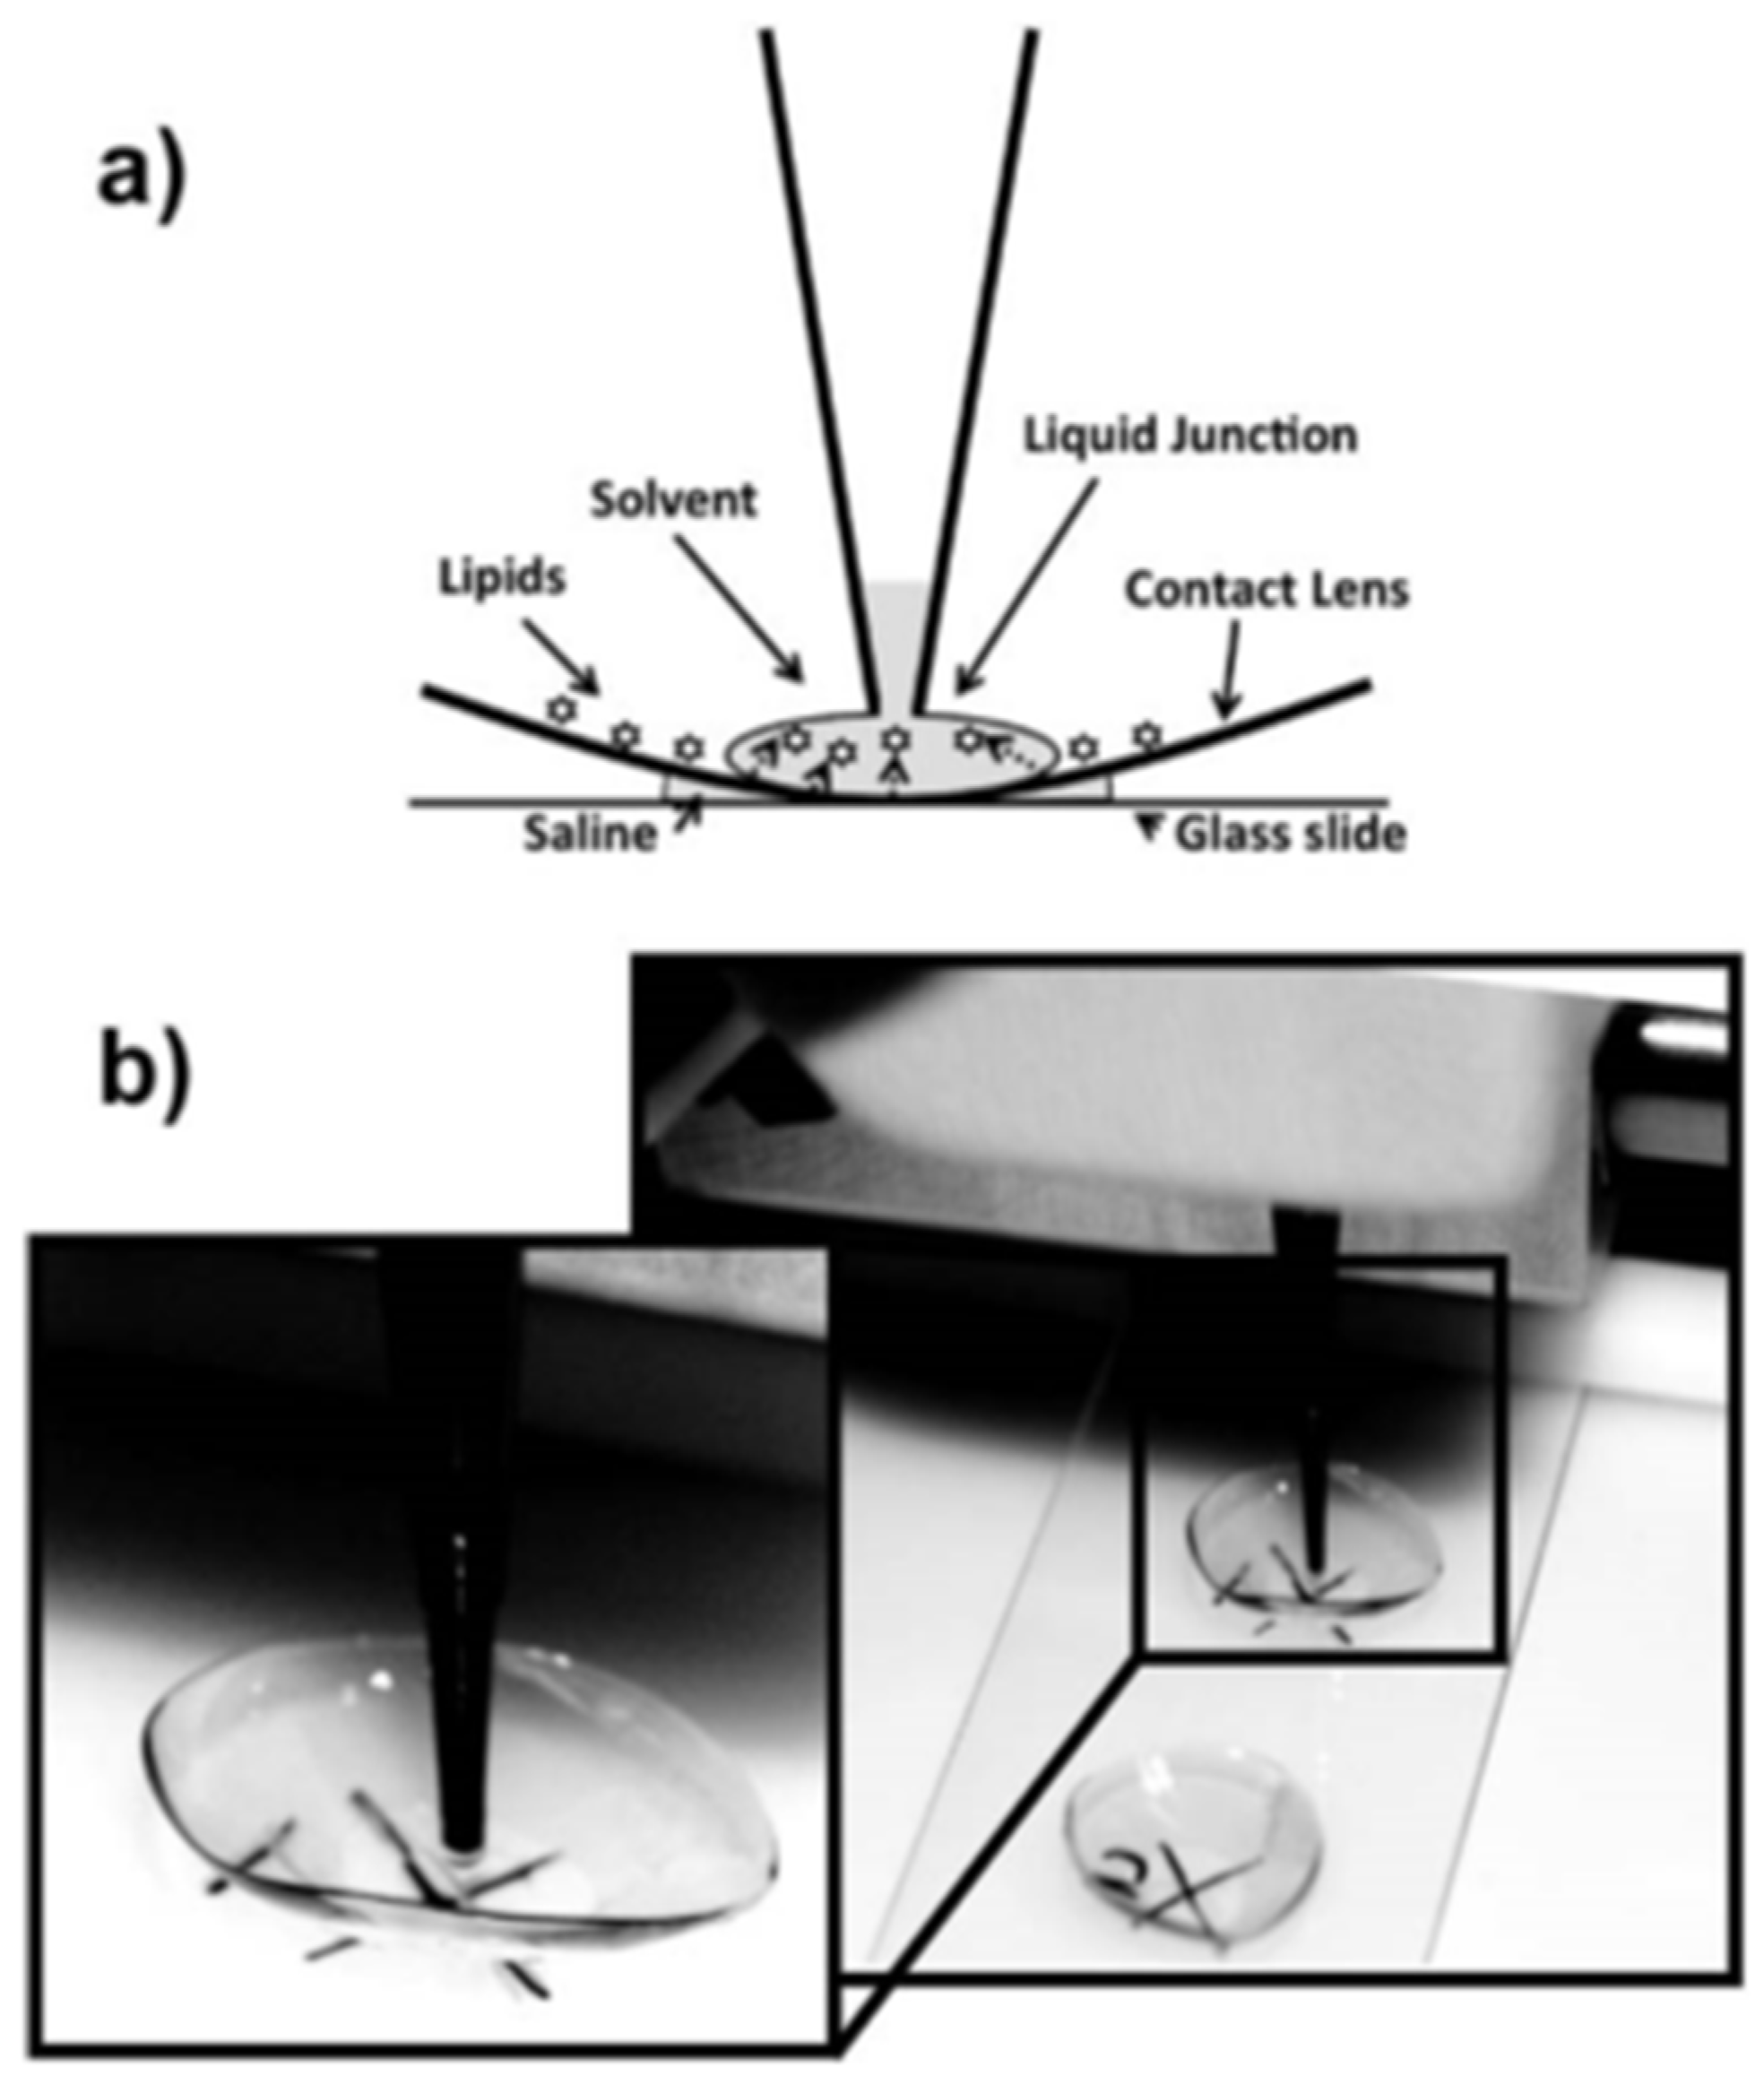
2. LESA—Operation Principle and Critical Parameters
3. Application Areas
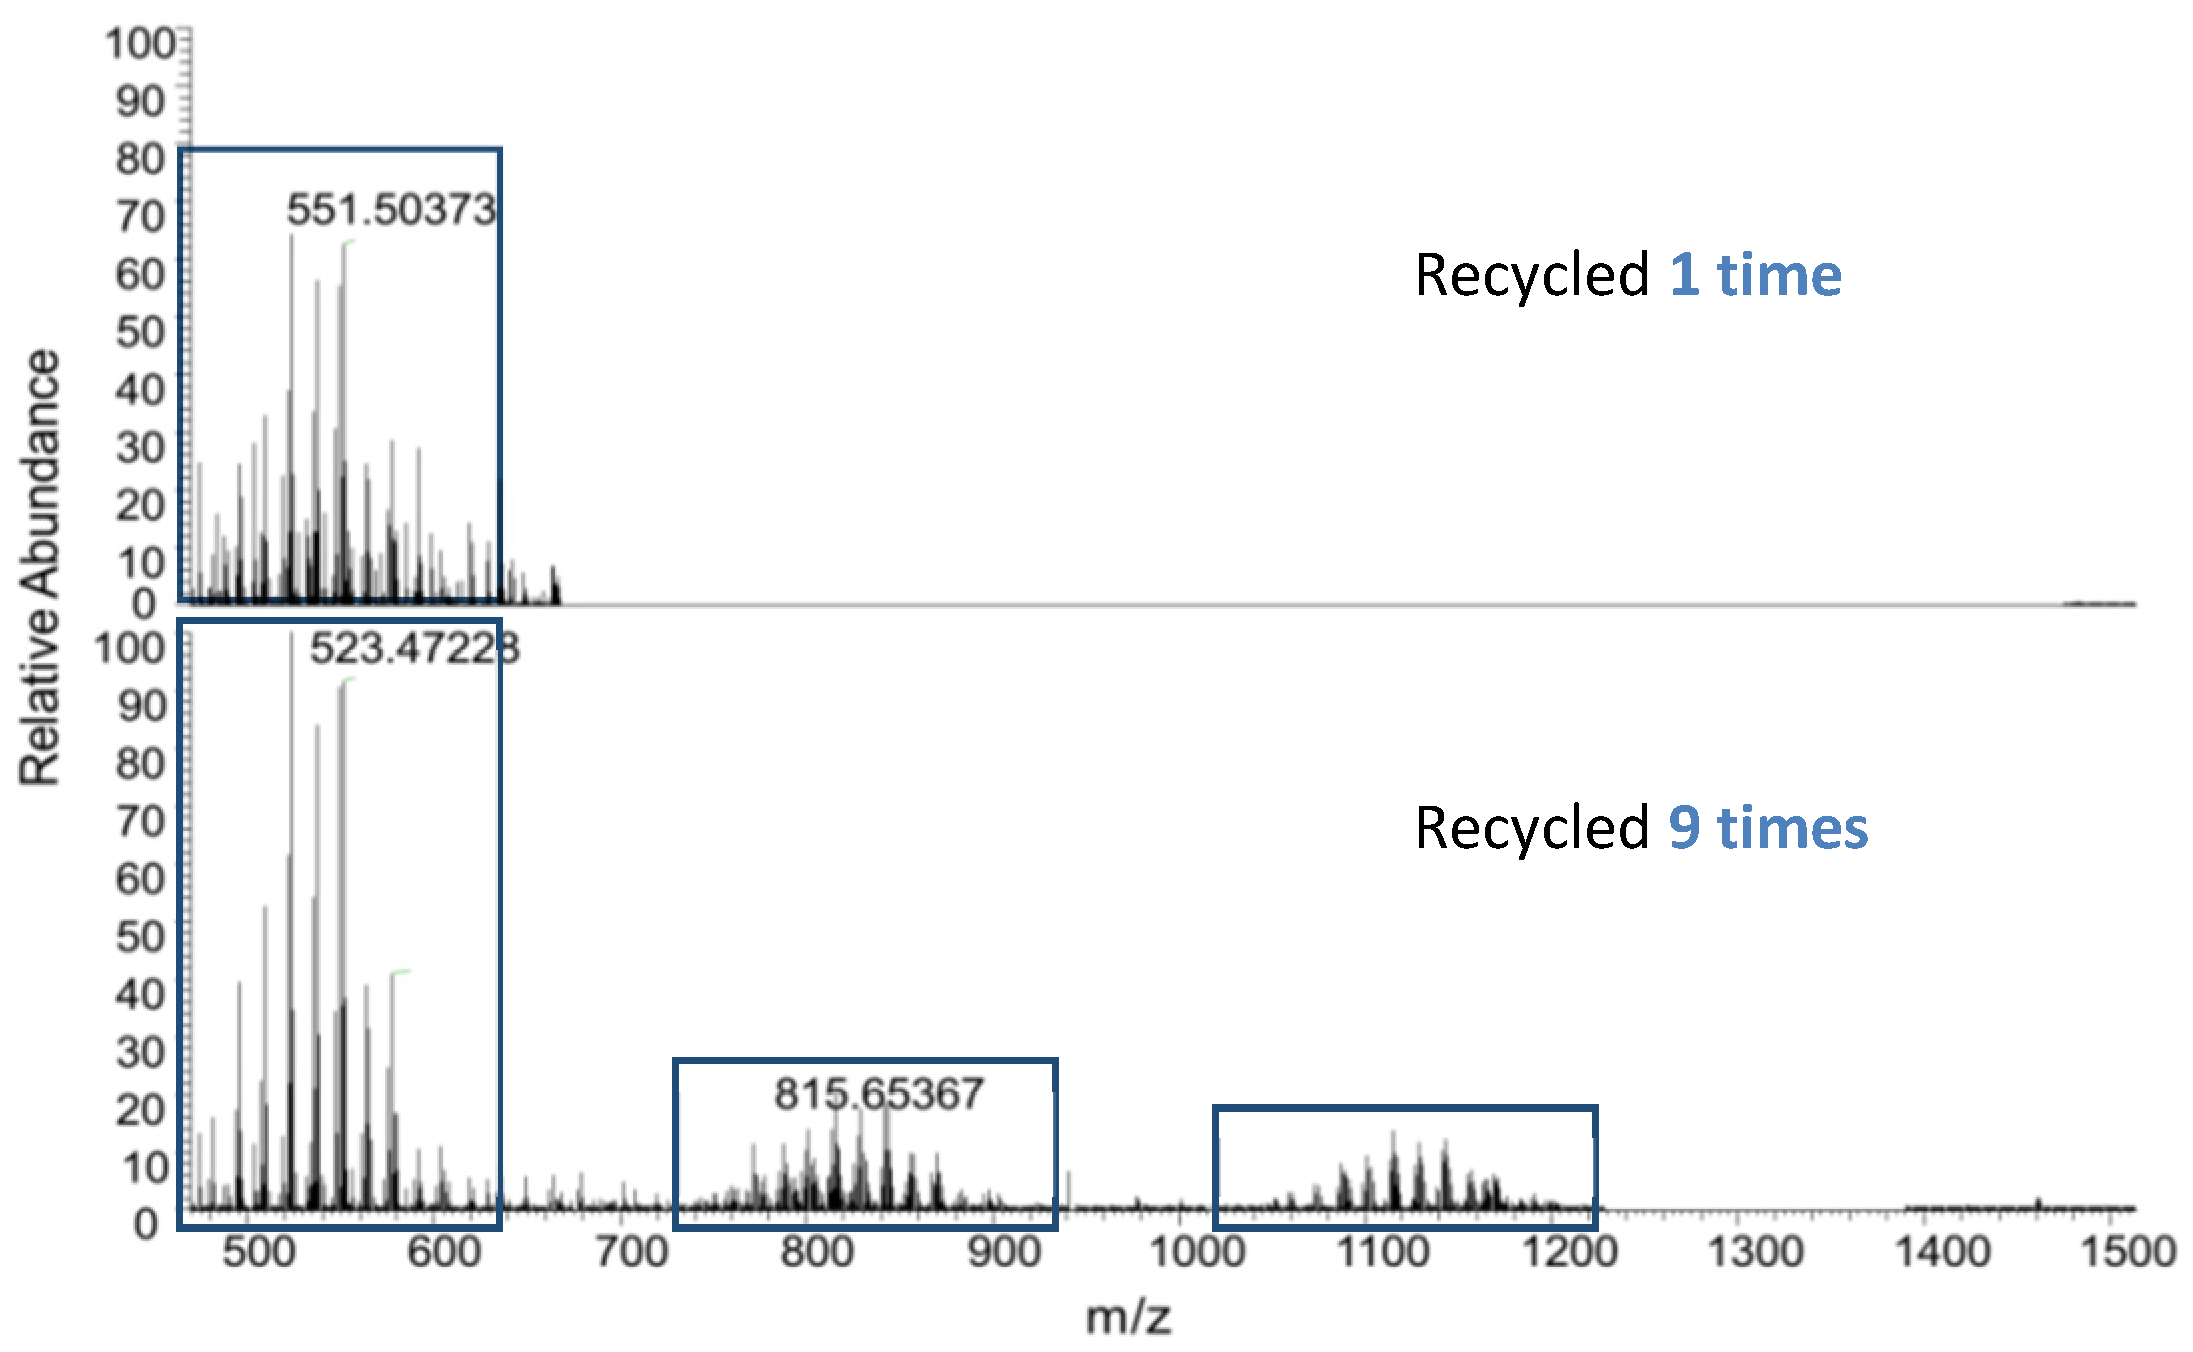
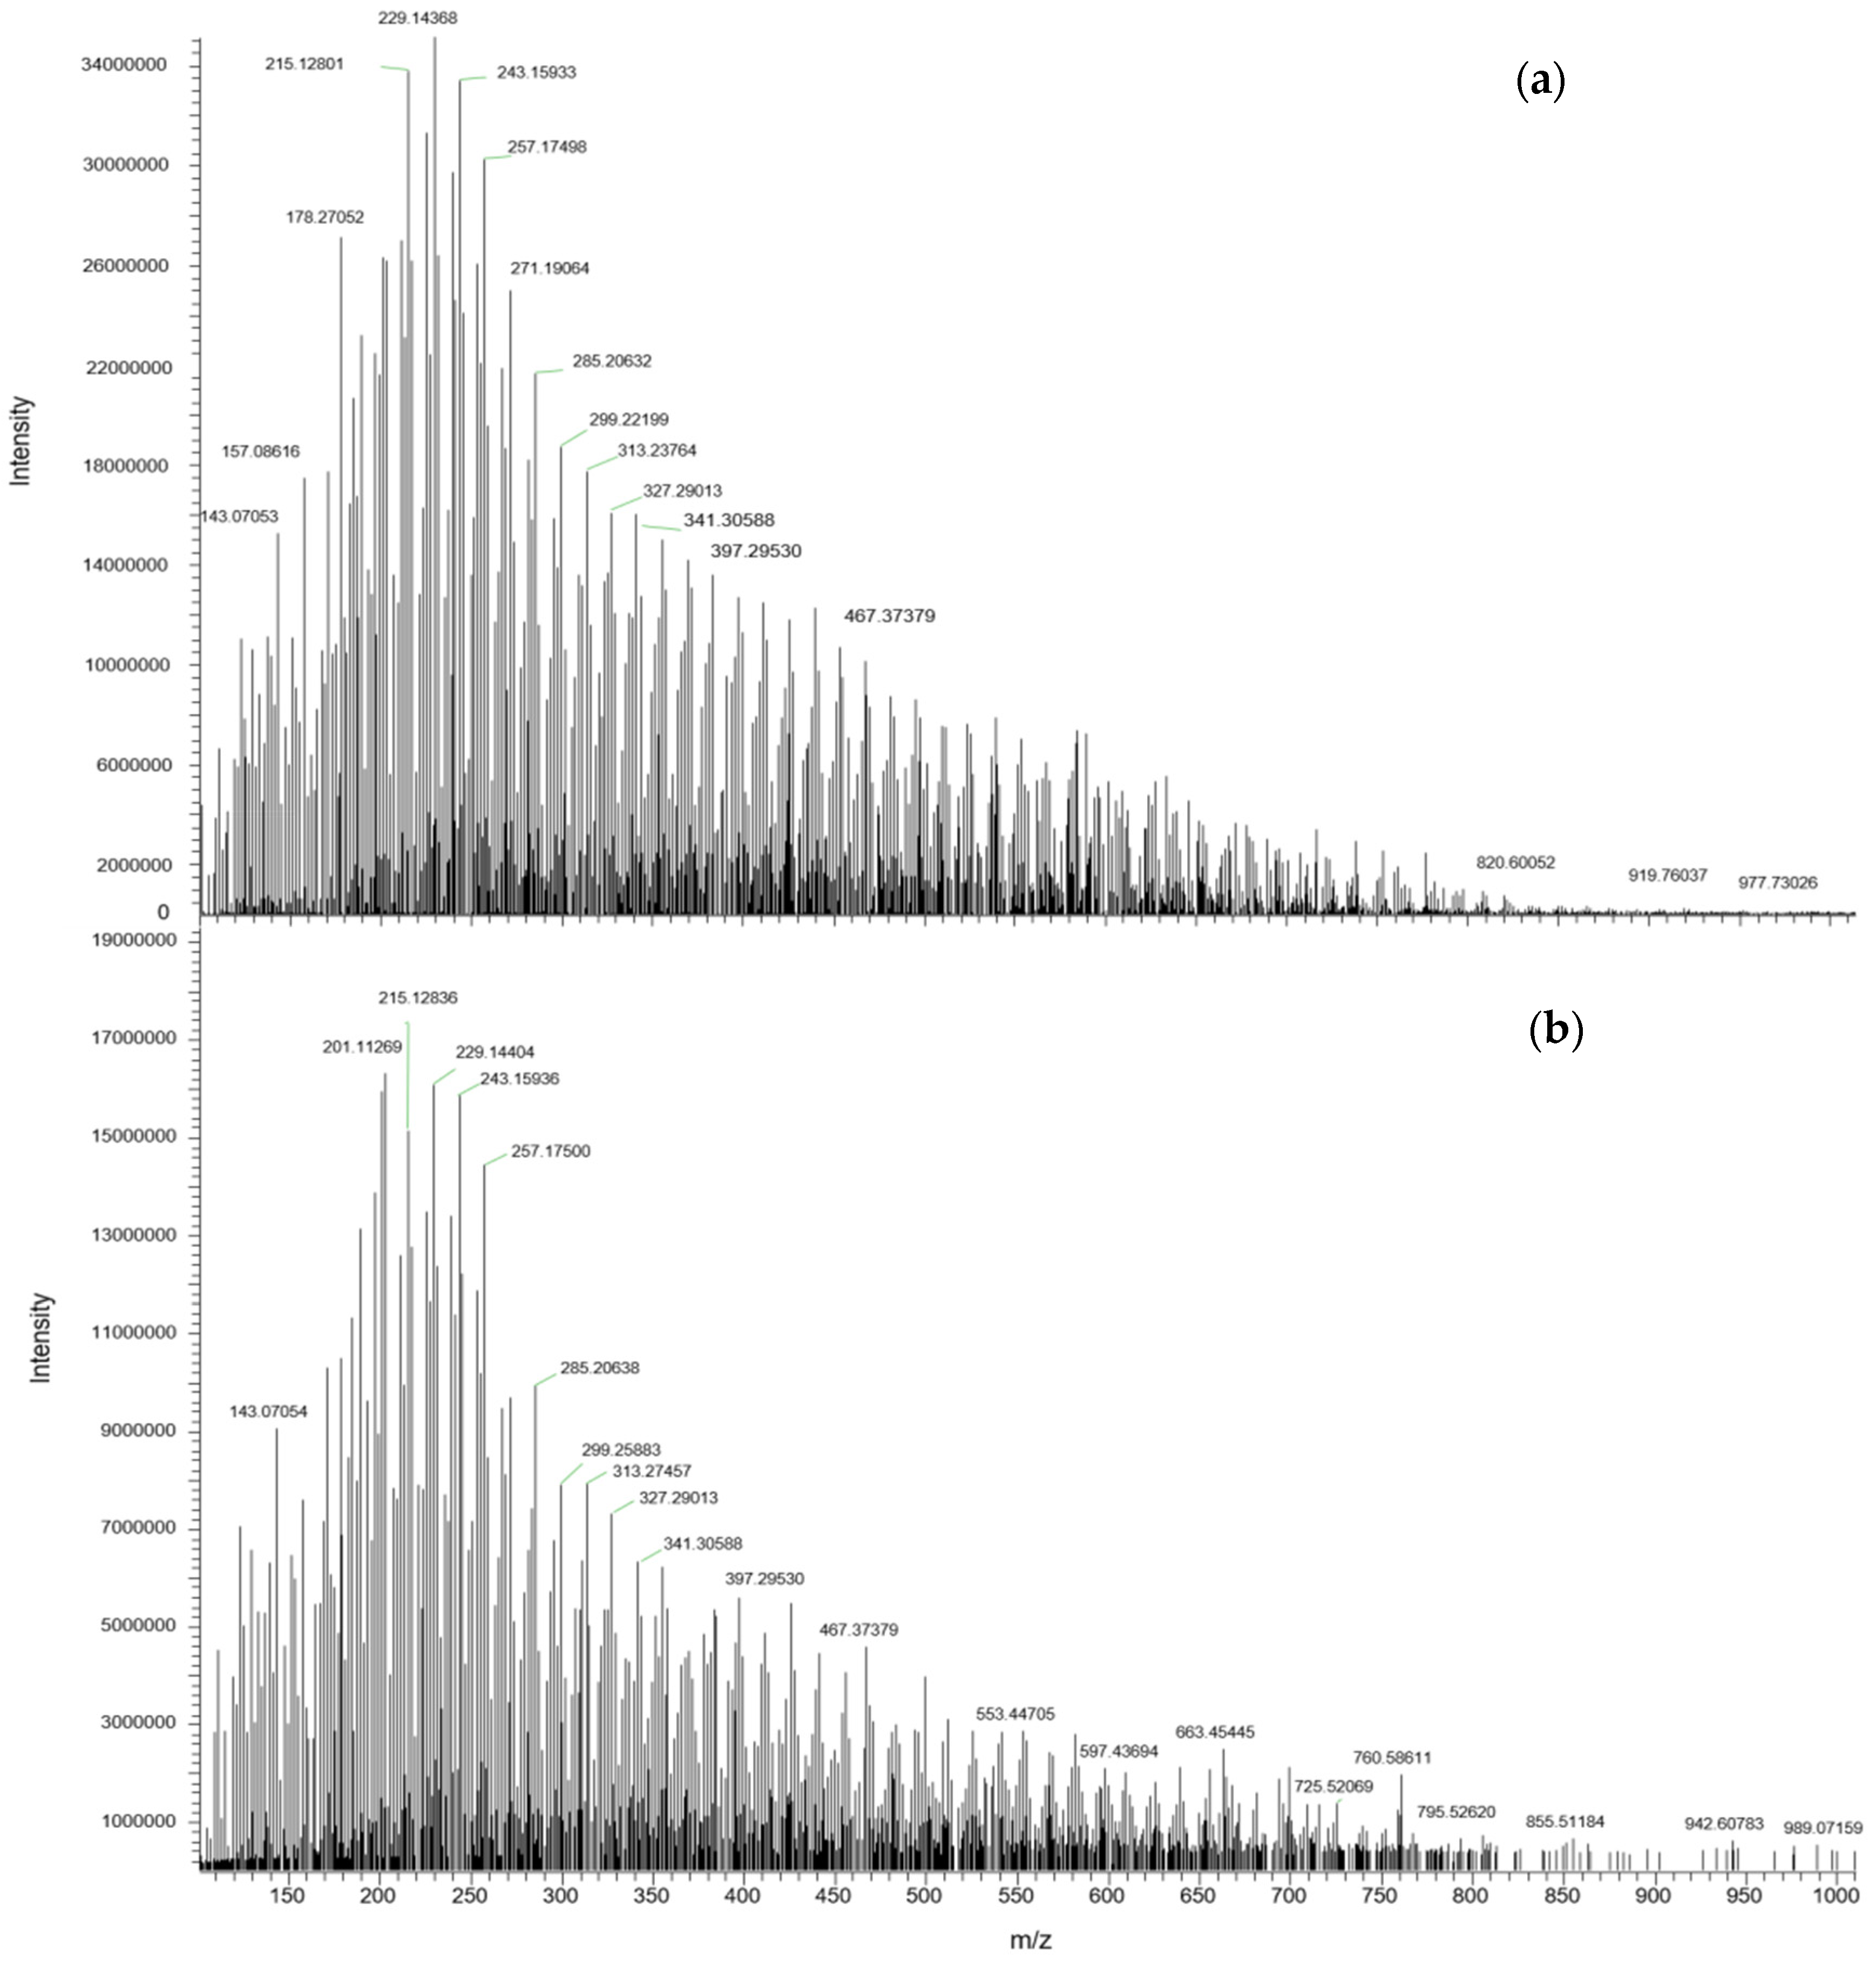
3.1. Characterisations of Polymer Matrices
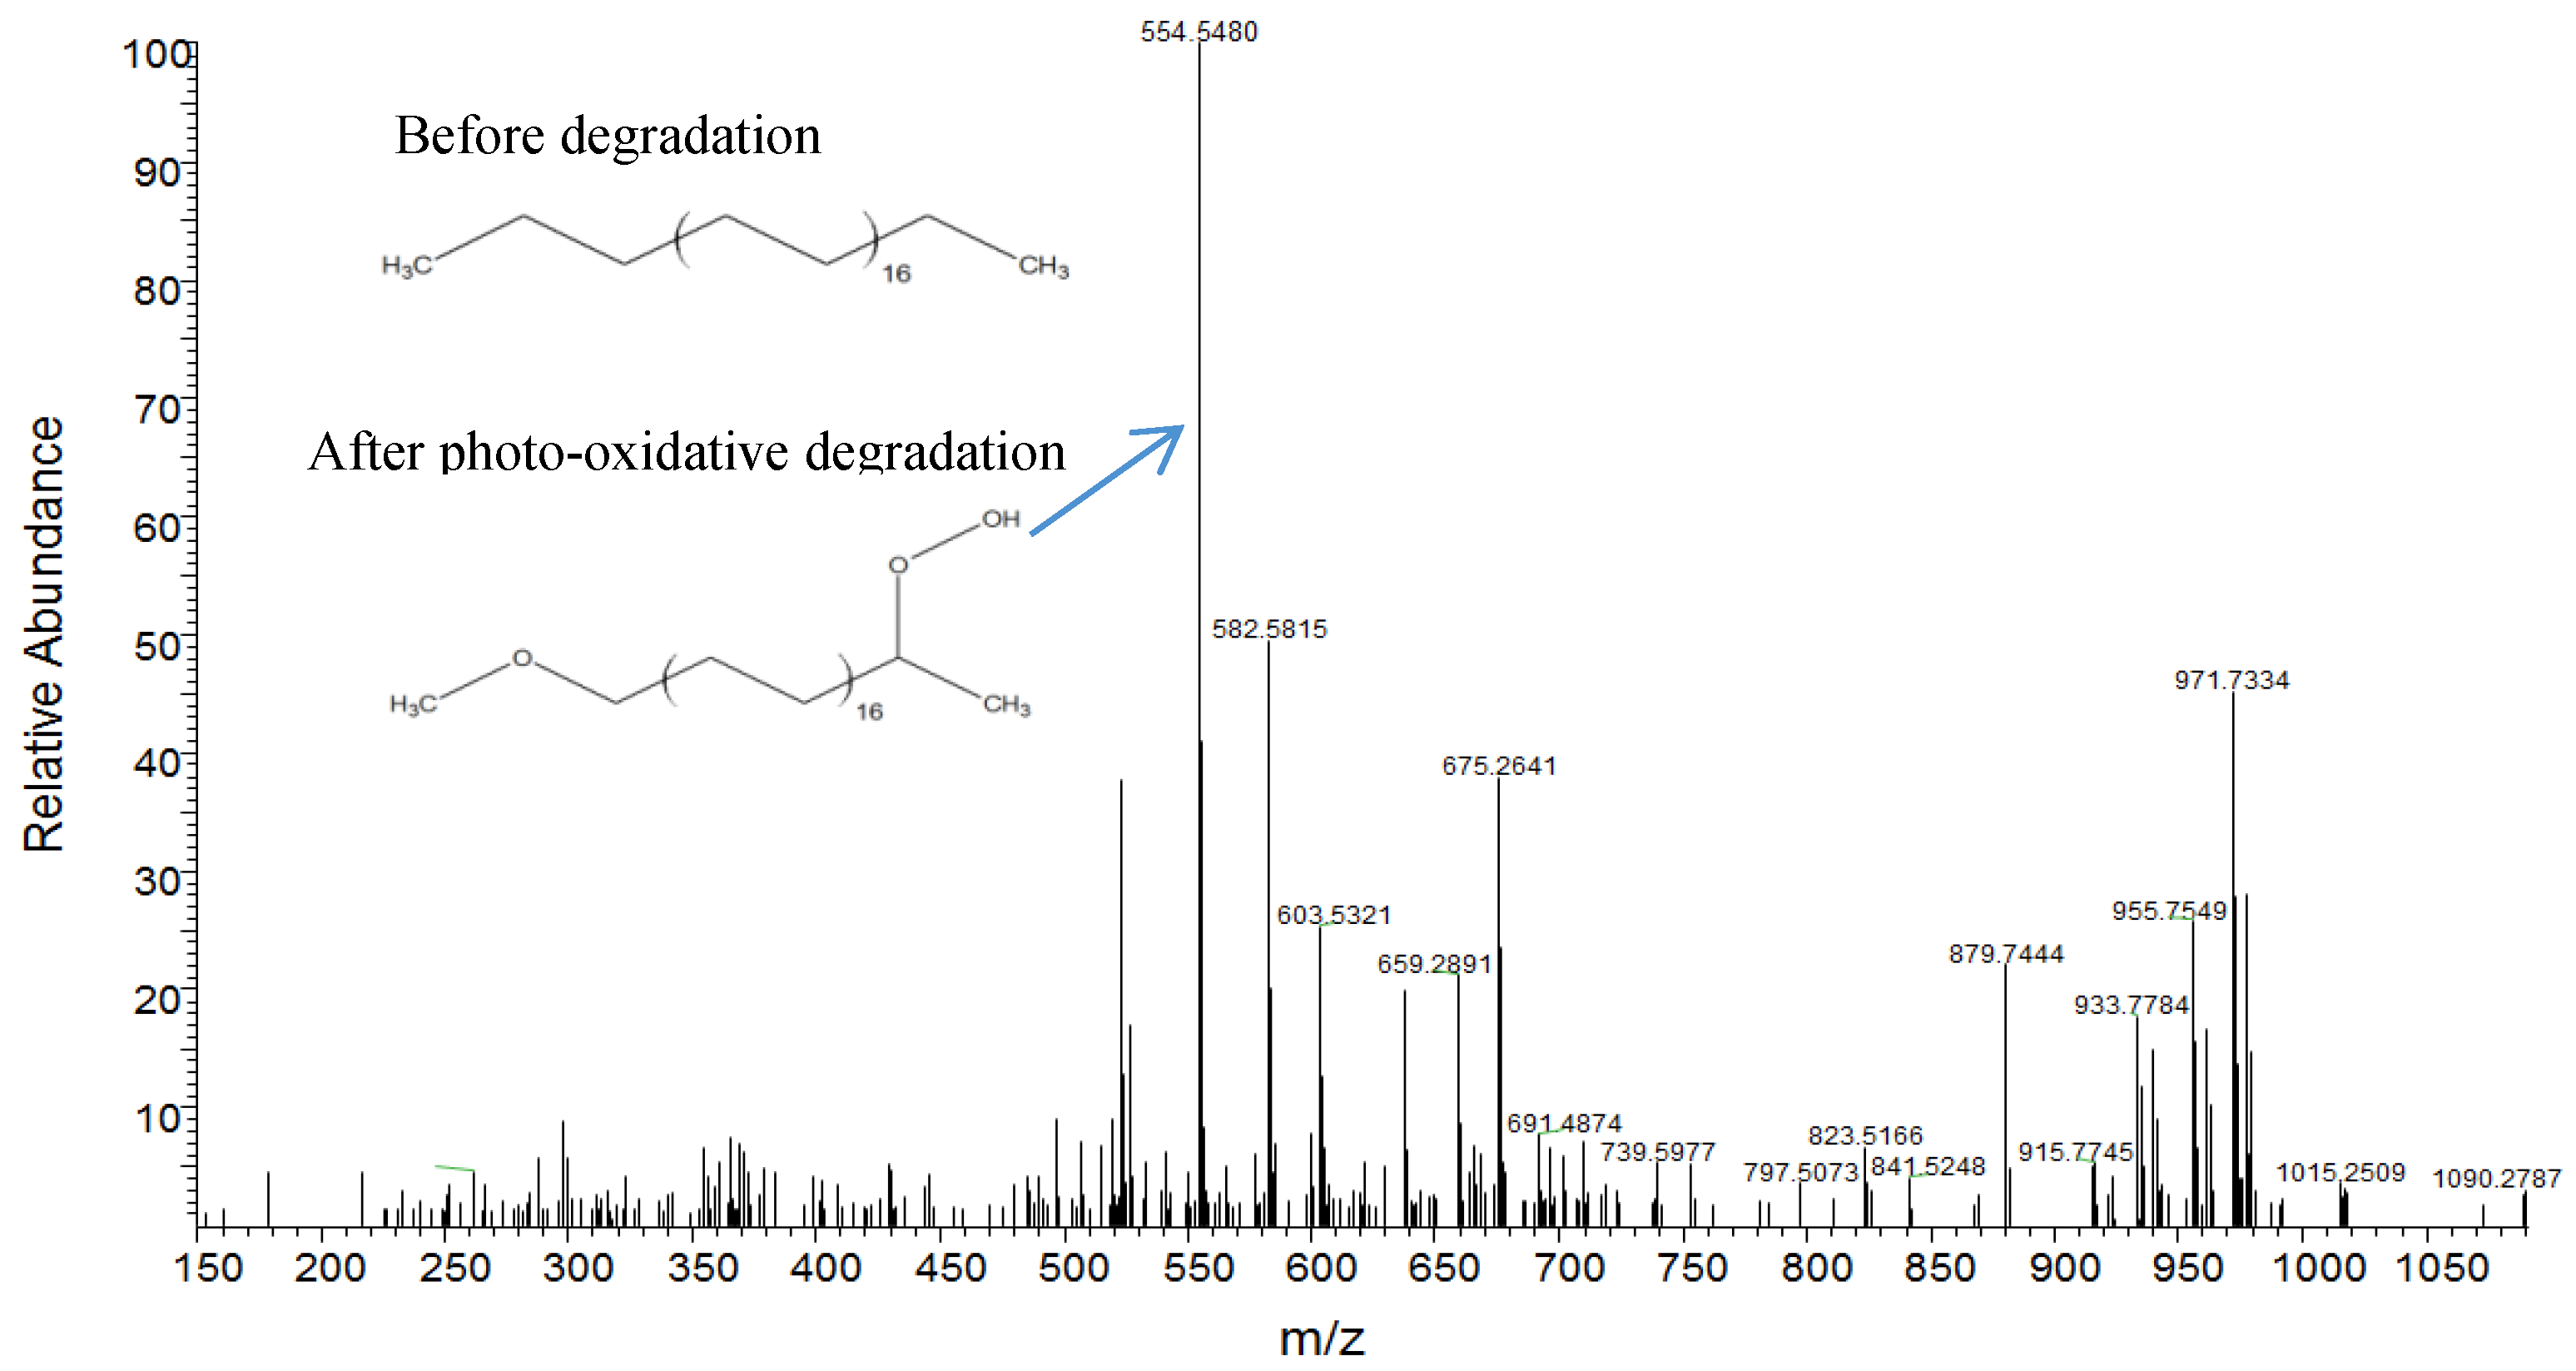
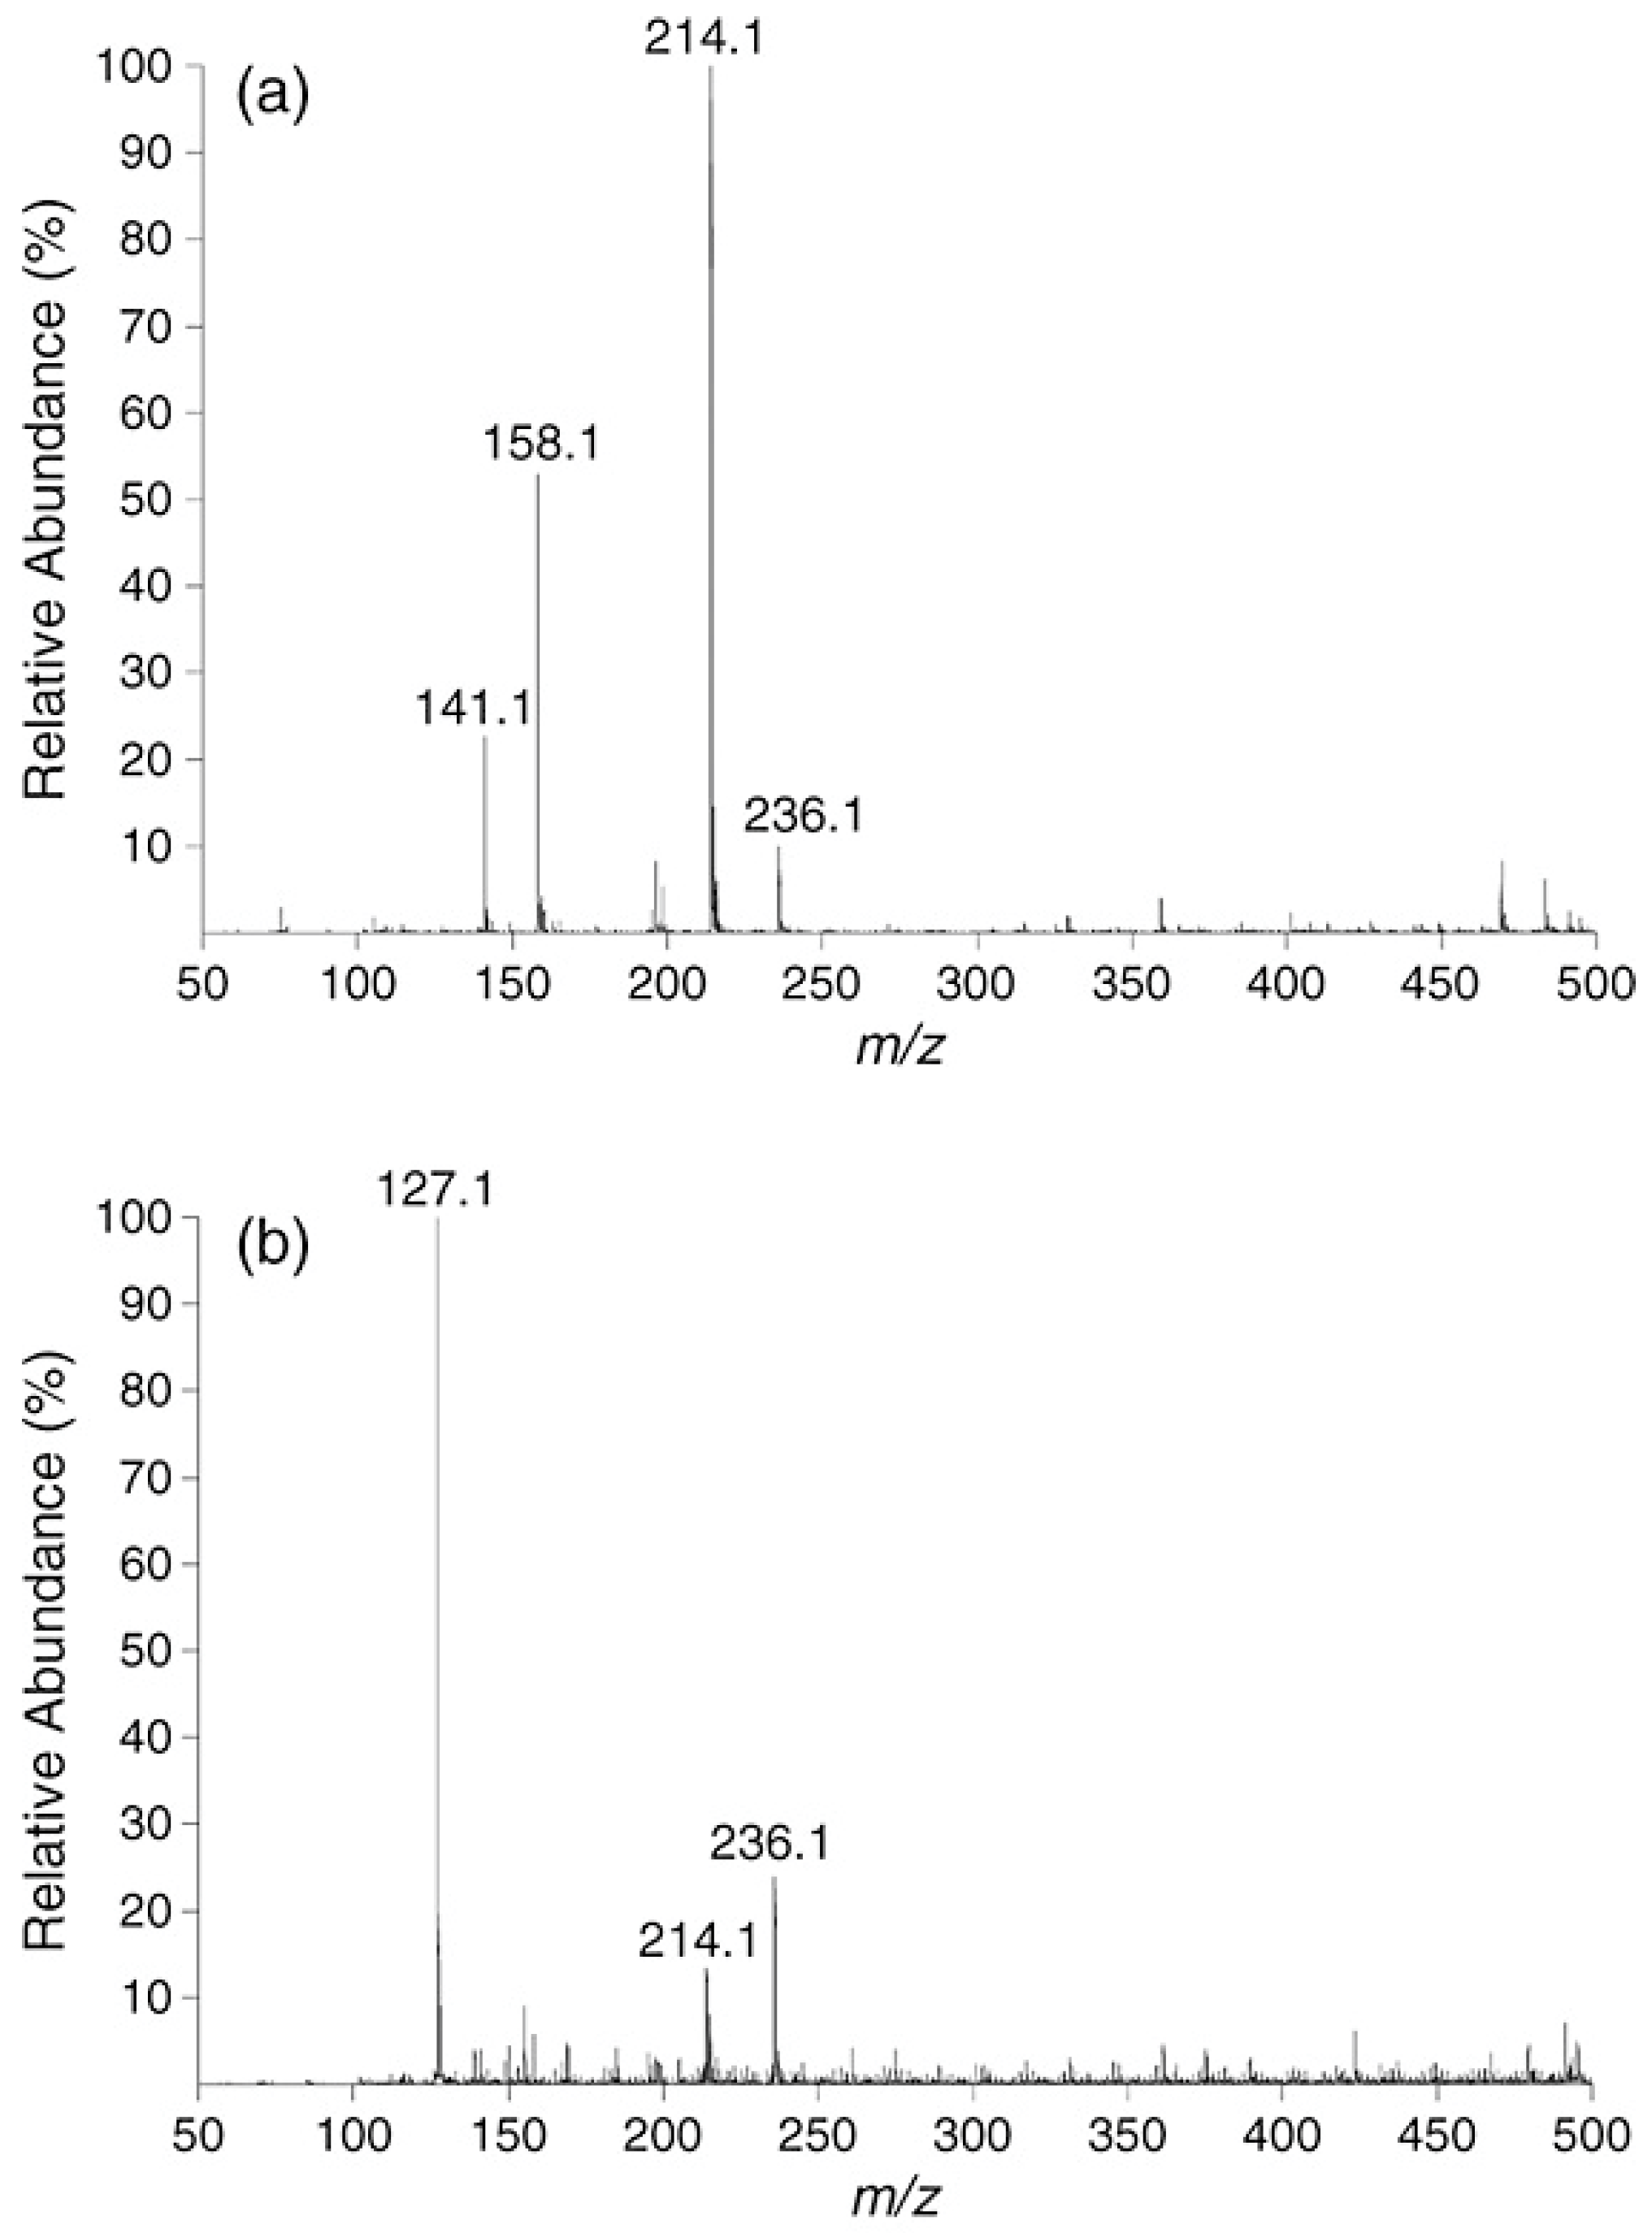
3.2. Detection of Polymer Additives
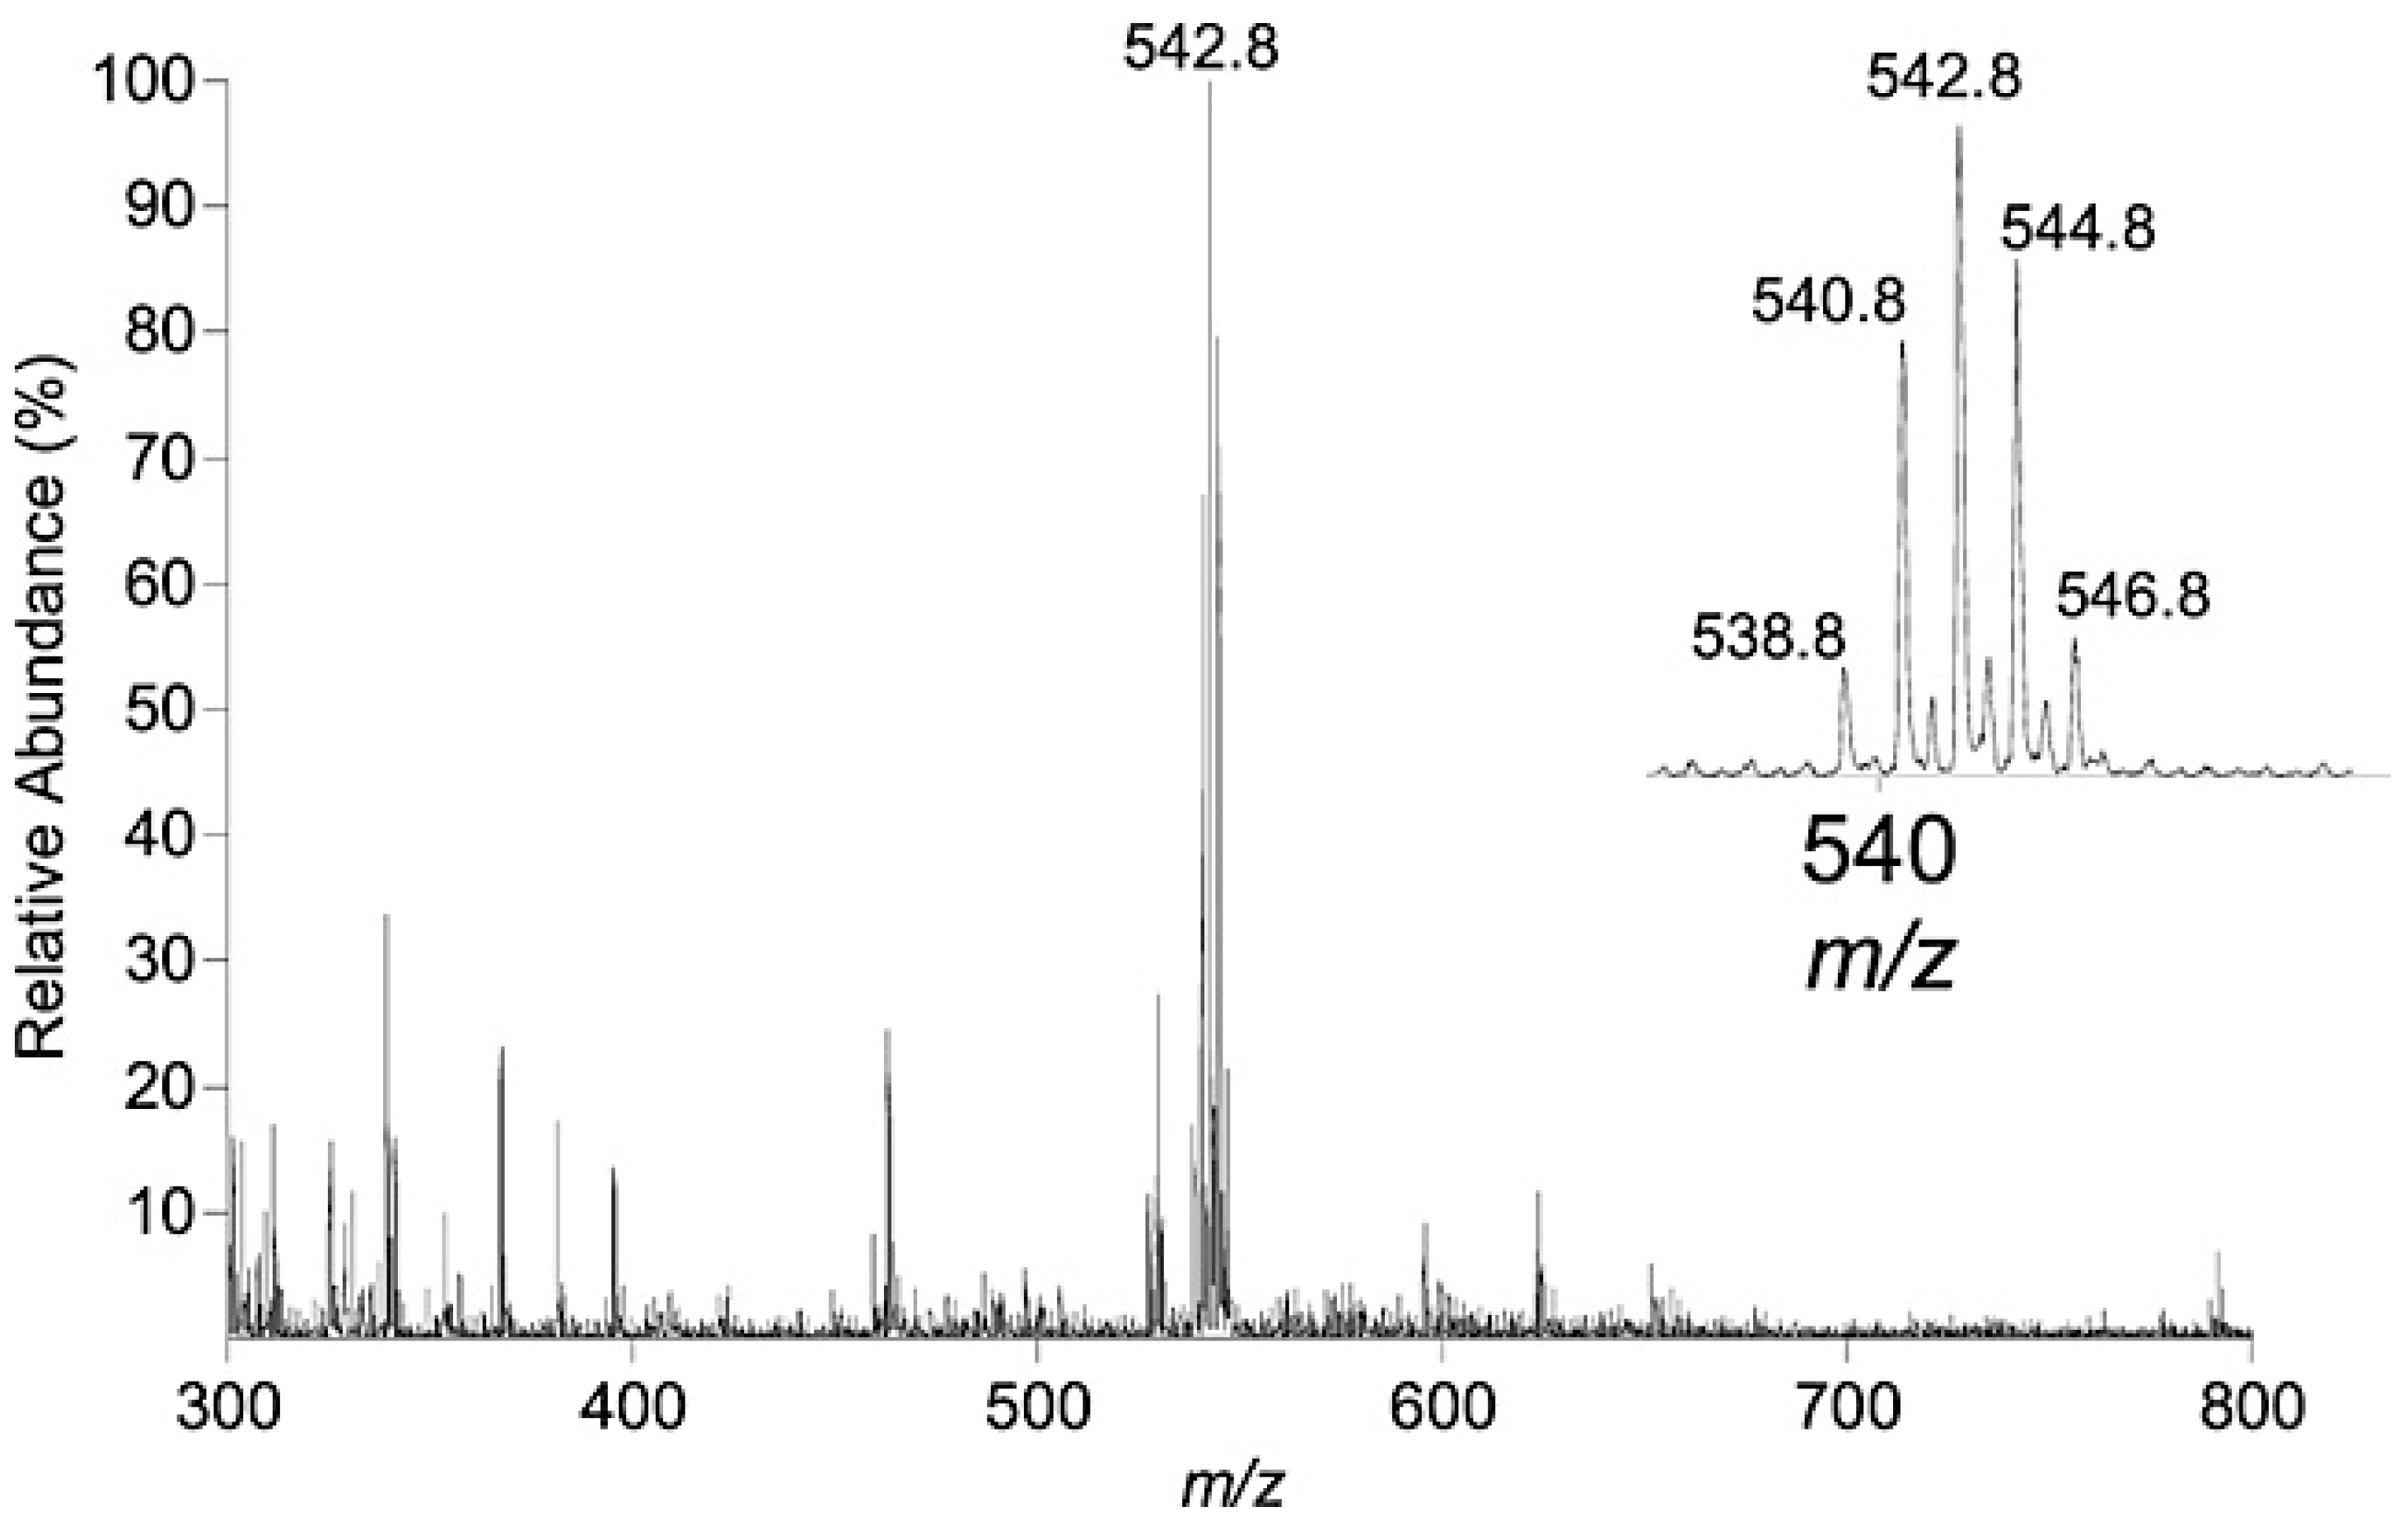
3.3. Species Resulting from Specific Use
4. Confirmatory (MS/MS) vs. Exploratory Aspects
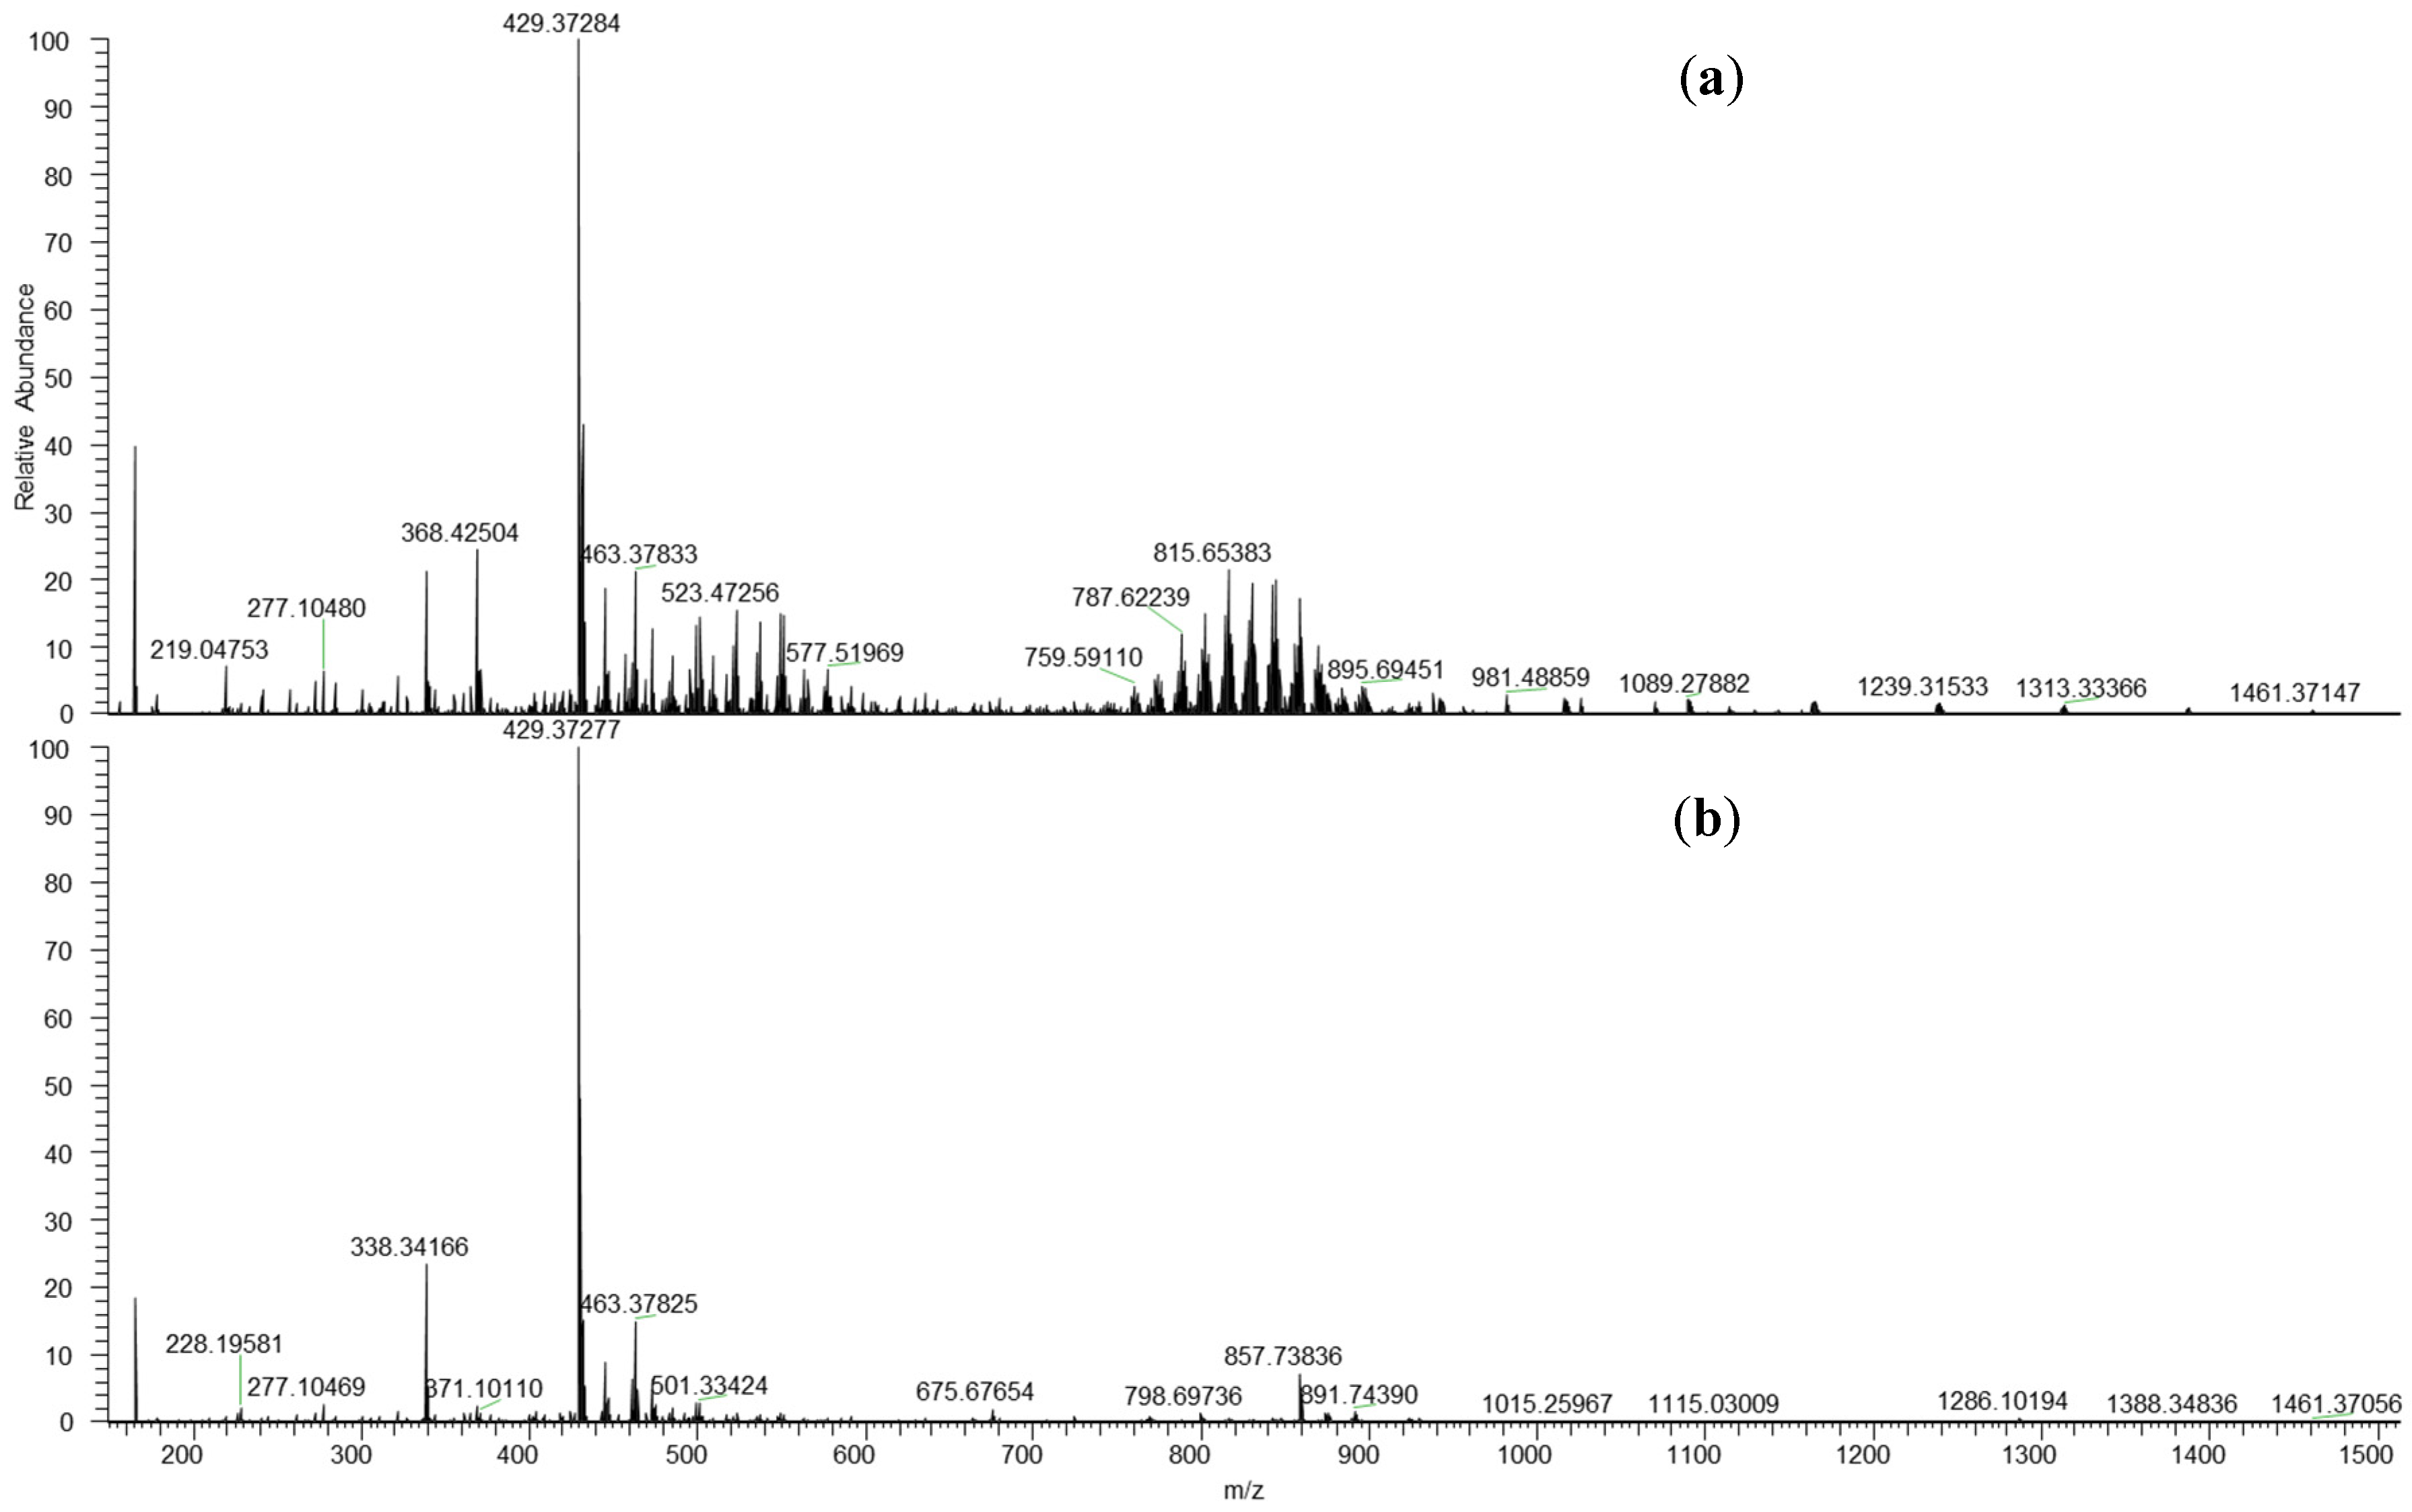
5. Semi-Quantitation
6. Conclusions
Author Contributions
Funding
Acknowledgments
Conflicts of Interest
Abreviations
| LESA-nanoESI-MS | Liquid Extraction Surface Analysis nanoelectrospray Mass Spectrometry |
| NIAS | Non-Intentionally Added Species |
| ESI | Electrospray Ionization |
| MALDI | Matrix-Assisted Laser Desorption/Ionization |
| DESI | Desorption Electrospray Ionization |
| DART | Direct Analysis in Real Time |
| RSD | Relative Standard Deviation |
| PP | PolyPropylene |
| iPP | isotactic PolyPropylene |
| HDPE | High Density PolyEthylene |
| LDPE | Low Density PolyEthylene |
| PET | Polyethylene Terephthalate |
| PEO | PolyEthylene Oxyde |
| HALS | Hindered Amine Light Stabilizers |
| BFR | Brominated Flame-Retardant |
| TBBP-A | Tetrabromobisphenol A |
| CE | cholesterol esters |
References
- Standnes, D.C.; Skjevrak, I. Literature review of implemented polymer field projects. J. Pet. Sci. Eng 2014, 122, 761–775. [Google Scholar] [CrossRef]
- Breddermann, K.; Drescher, P.; Polzin, C.; Seitz, H.; Paschen, M. Printed pressure housings for underwater applications. Ocean Eng. 2016, 113, 57–63. [Google Scholar] [CrossRef] [Green Version]
- Smith, C.A. Thermochemical and physical properties of printed circuit board laminates and other polymers used in the electronics industry. Polym. Test. 2016, 52, 234–245. [Google Scholar] [CrossRef]
- Fuchs, E.R.H.; Field, F.R.; Roth, R.; Kirchain, R.E. Strategic materials selection in the automobile body: Economic opportunities for polymer composite design. Compos. Sci. Technol. 2008, 68, 1989–2002. [Google Scholar] [CrossRef]
- Halden, R.U. Plastics and health risks. Ann. Rev. Public Health 2010, 31, 179–194. [Google Scholar] [CrossRef] [PubMed]
- Perugini, F.; Mastellone, M.L.; Arena, U. A life cycle assessment of mechanical and feedstock recycling options for management of plastic packaging wastes. Environ. Prog. 2005, 24, 137–154. [Google Scholar] [CrossRef]
- Jean-Baptiste, E.; Blanchemain, N.; Martel, B.; Neut, C.; Hildebrand, H.F.; Haulon, S. Safety, healing, and efficacy of vascular prostheses coated with hydroxypropyl-β-cyclodextrin polymer: Experimental in Vitro and animal studies. Eur. J. Vasc. Endovasc. Surg. 2012, 43, 188–197. [Google Scholar] [CrossRef] [PubMed]
- Wong, M.H.; Wu, S.C.; Deng, W.J.; Yu, X.Z.; Luo, Q.; Leung, A.O.W.; Wong, C.S.C.; Luksemburg, W.J.; Wong, A.S. Export of toxic chemicals—A review of the case of uncontrolled electronic-waste recycling. Environ. Pollut. 2007, 149, 131–140. [Google Scholar] [CrossRef]
- Du, Z.; Zhang, S.; Zhou, Q.; Yuen, K.F.; Wong, Y.D. Hazardous materials analysis and disposal procedures during ship recycling. Resour. Conserv. Recycl. 2018, 131, 158–171. [Google Scholar] [CrossRef]
- Fang, X.; Vitrac, O. Predicting diffusion coefficients of chemicals in and through packaging materials. Crit. Rev. Food Sci. Nutr. 2017, 57, 275–312. [Google Scholar] [CrossRef]
- Bach, C.; Dauchy, X.; Chagnon, M.-C.; Etienne, S. Chemical compounds and toxicological assessments of drinking water stored in polyethylene terephthalate (PET) bottles: A source of controversy reviewed. Water Res. 2012, 46, 571–583. [Google Scholar] [CrossRef]
- Mendes Siqueira, A.L.; Beaumesnil, M.; Hubert-Roux, M.; Loutelier-Bourhis, C.; Afonso, C.; Bai, Y.; Courtiade, M.; Racaud, A. Atmospheric solid analysis probe coupled to ion mobility spectrometry-mass spectrometry, a fast and simple method for polyalphaolefin characterization. J. Am. Soc. Mass Spectrom. 2018, 29, 1678–1687. [Google Scholar] [CrossRef] [PubMed]
- Learner, T. The analysis of synthetic paints by pyrolysis–gas chromatography–mass spectrometry (PyGCMS). Stud. Conserv. 2001, 46, 225–241. [Google Scholar]
- Gruendling, T.; Weidner, S.; Falkenhagen, J.; Barner-Kowollik, C. Mass spectrometry in polymer chemistry: A state-of-the-art up-date. Polym. Chem. 2010, 1, 599–617. [Google Scholar] [CrossRef]
- Yol, A.M.; Dabney, D.E.; Wang, S.-F.; Laurent, B.A.; Foster, M.D.; Quirk, R.P.; Grayson, S.M.; Wesdemiotis, C. Differentiation of linear and cyclic polymer architectures by MALDI tandem mass spectrometry (MALDI-MS2). J. Am. Soc. Mass Spectrom. 2013, 24, 74–82. [Google Scholar] [CrossRef]
- Nie, H.Y.; Walzak, M.J.; Berno, B.; McIntyre, N.S. Atomic force microscopy study of polypropylene surfaces treated by UV and ozone exposure: Modification of morphology and adhesion force. Appl. Surf. Sci. 1999, 144, 627–632. [Google Scholar] [CrossRef]
- Crecelius, A.C.; Baumgaertel, A.; Schubert, U.S. Tandem mass spectrometry of synthetic polymers. J. Mass Spectrom. 2009, 44, 1277–1286. [Google Scholar] [CrossRef] [PubMed]
- Payne, M.E.; Grayson, S.M. Characterization of synthetic polymers via matrix assisted laser desorption ionization time of flight (MALDI-TOF) mass spectrometry. J. Vis. Exp. 2018, 57174. [Google Scholar] [CrossRef] [PubMed]
- Zhao, B.; Serrano, M.A.C.; Gao, J.; Zhuang, J.; Vachet, R.W.; Thayumanavan, S. Self-assembly of random co-polymers for selective binding and detection of peptides. Polym. Chem. 2018, 9, 1066–1071. [Google Scholar] [CrossRef]
- Gruendling, T.; Hart-Smith, G.; Davis, T.P.; Stenzel, M.H.; Barner-Kowollik, C. Enhanced ionization in electrospray ionization mass spectrometry of labile end-group-containing polystyrenes using silver(I) tetrafluoroborate as doping salt. Macromolecules 2008, 41, 1966–1971. [Google Scholar] [CrossRef]
- Cody, R.B.; Laramée, J.A.; Durst, H.D. Versatile new ion source for the analysis of materials in open air under ambient conditions. Anal. Chem. 2005, 77, 2297–2302. [Google Scholar] [CrossRef]
- Hintersteiner, I.; Sternbauer, L.; Beissmann, S.; Buchberger, W.W.; Wallner, G.M. Determination of stabilisers in polymeric materials used as encapsulants in photovoltaic modules. Polym. Test. 2014, 33, 172–178. [Google Scholar] [CrossRef]
- Ackerman, L.K.; Noonan, G.O.; Begley, T.H. Assessing direct analysis in real-time-mass spectrometry (DART-MS) for the rapid identification of additives in food packaging. Food Addit. Contam. Part A 2009, 26, 1611–1618. [Google Scholar] [CrossRef]
- Grasso, G.; Mineo, P.; Rizzarelli, E.; Spoto, G. MALDI, AP/MALDI and ESI techniques for the MS detection of amyloid β-peptides. Int. J. Mass Spectrom. 2009, 282, 50–55. [Google Scholar] [CrossRef]
- Cotte-Rodríguez, I.; Takáts, Z.; Talaty, N.; Chen, H.; Cooks, R.G. Desorption electrospray ionization of explosives on surfaces: Sensitivity and selectivity enhancement by reactive desorption electrospray ionization. Anal. Chem. 2005, 77, 6755–6764. [Google Scholar] [CrossRef]
- Advion BioSystems. Advion BioSystems Announces the Launch of a Novel Liquid Extraction Surface Analysis System; Advion: Ithaca, NY, USA, 2010; Volume 2019. [Google Scholar]
- Eikel, D.; Vavrek, M.; Smith, S.; Bason, C.; Yeh, S.; Korfmacher, W.A.; Henion, J.D. Liquid extraction surface analysis mass spectrometry (LESA-MS) as a novel profiling tool for drug distribution and metabolism analysis: The terfenadine example. Rapid Commun. Mass Spectrom. 2011, 25, 3587–3596. [Google Scholar] [CrossRef] [PubMed]
- Menezes, R.C.; Kai, M.; Krause, K.; Matthäus, C.; Svatoš, A.; Popp, J.; Kothe, E. Monitoring metabolites from Schizophyllum commune interacting with Hypholoma fasciculare combining LESA–HR mass spectrometry and Raman microscopy. Anal. Bioanal. Chem. 2015, 407, 2273–2282. [Google Scholar] [CrossRef] [PubMed]
- Parson, W.B.; Koeniger, S.L.; Johnson, R.W.; Erickson, J.; Tian, Y.; Stedman, C.; Schwartz, A.; Tarcsa, E.; Cole, R.; Van Berkel, G.J. Analysis of chloroquine and metabolites directly from whole-body animal tissue sections by liquid extraction surface analysis (LESA) and tandem mass spectrometry. J. Mass Spectrom. 2012, 47, 1420–1428. [Google Scholar] [CrossRef]
- Sarsby, J.; Martin, N.J.; Lalor, P.F.; Bunch, J.; Cooper, H.J. Top-down and bottom-up identification of proteins by liquid extraction surface analysis mass spectrometry of healthy and diseased human liver tissue. J. Am. Soc. Mass Spectrom. 2014, 25, 1953–1961. [Google Scholar] [CrossRef]
- Montowska, M.; Rao, W.; Alexander, M.R.; Tucker, G.A.; Barrett, D.A. Tryptic digestion coupled with ambient desorption electrospray ionization and liquid extraction surface analysis mass spectrometry enabling identification of skeletal muscle proteins in mixtures and distinguishing between beef, pork, horse, chicken, and turkey meat. Anal. Chem. 2014, 86, 4479–4487. [Google Scholar]
- Paine, M.R.L.; Rae, I.D.; Blanksby, S.J. Direct detection of brominated flame retardants from plastic e-waste using liquid extraction surface analysis mass spectrometry. Rapid Commun. Mass Spectrom. 2014, 28, 1203–1208. [Google Scholar] [CrossRef]
- Brown, S.H.J.; Huxtable, L.H.; Willcox, M.D.P.; Blanksby, S.J.; Mitchell, T.W. Automated surface sampling of lipids from worn contact lenses coupled with tandem mass spectrometry. Analyst 2013, 138, 1316–1320. [Google Scholar] [CrossRef] [Green Version]
- Paine, M.R.L.; Barker, P.J.; Blanksby, S.J. Characterising in situ activation and degradation of hindered amine light stabilisers using liquid extraction surface analysis-mass spectrometry. Anal. Chim. Acta 2014, 808, 190–198. [Google Scholar] [CrossRef]
- Paine, M.R.L.; Barker, P.J.; Maclauglin, S.A.; Mitchell, T.W.; Blanksby, S.J. Direct detection of additives and degradation products from polymers by liquid extraction surface analysis employing chip-based nanospray mass spectrometry. Rapid Commun. Mass Spectrom. 2012, 26, 412–418. [Google Scholar] [CrossRef] [Green Version]
- Issart, A.; Godin, S.; Preud’homme, H.; Bierla, K.; Allal, A.; Szpunar, J. Direct screening of food packaging materials for post-polymerization residues, degradation products and additives by liquid extraction surface analysis nanoelectrospray mass spectrometry (LESA-nESI-MS). Anal. Chim. Acta 2019, 117–126. [Google Scholar] [CrossRef]
- Martin, R.L.; Paine, P.J.B.; Stephen, J.; Blanksby, S.J. Ambient ionisation mass spectrometry for the characterisation of polymers and polymer additives: A review. Anal. Chim. Acta 2014, 808, 70–82. [Google Scholar] [Green Version]
- Vilaplana, F.; Karlsson, S. Quality concepts for the improved use of recycled polymeric materials: A review. Macromol. Mater. Eng. 2008, 293, 274–297. [Google Scholar] [CrossRef]
- Michal, J.; Mitera, J.; Tardon, S. Toxicity of thermal degradation products of polyethylene and polypropylene. Fire Mater. 1976, 1, 160–168. [Google Scholar] [CrossRef]
- Kaminsky, W.; Zorriqueta, I.-J.N. Catalytical and thermal pyrolysis of polyolefins. J. Anal. Appl. Pyrolysis 2007, 79, 368–374. [Google Scholar] [CrossRef]
- Hinsken, H.; Moss, S.; Pauquet, J.-R.; Zweifel, H. Degradation of polyolefins during melt processing. Polym. Degrad. Stab. 1991, 34, 279–293. [Google Scholar] [CrossRef]
- Radecka, I.; Irorere, V.; Jiang, G.; Hill, D.; Williams, C.; Adamus, G.; Kwiecień, M.; Marek, A.; Zawadiak, J.; Johnston, B.; et al. Oxidized polyethylene wax as a potential carbon source for PHA production. Materials 2016, 9, 367. [Google Scholar] [CrossRef]
- Gerlock, J.L.; Mielewski, D.F.; Bauer, D.R. Photo-initiation rate behavior of weathered coatings: ESR-nitroxide decay assay. Polym. Degrad. Stab. 1988, 20, 123–134. [Google Scholar] [CrossRef]
- Choi, S.-S.; Chung, H.-S. Novel co-matrix systems for the MALDI-MS analysis of polystyrene using a UV absorber and stabilizer. Analyst 2013, 138, 1256–1261. [Google Scholar] [CrossRef]
- Gerlock, J.L.; Kucherov, A.V.; Smith, C.A. Determination of active HALS in automotive paint systems II: HALS distribution in weathered clearcoat/basecoat paint systems. Polym. Degrad. Stab. 2001, 73, 201–210. [Google Scholar] [CrossRef]
- Tollbäck, J.; Crescenzi, C.; Dyremark, E. Determination of the flame retardant tetrabromobisphenol A in air samples by liquid chromatography-mass spectrometry. J. Chromatogr. A 2006, 1104, 106–112. [Google Scholar] [CrossRef]
- Abb, M.; Stahl, B.; Lorenz, W. Analysis of brominated flame retardants in house dust. Chemosphere 2011, 85, 1657–1663. [Google Scholar] [CrossRef]
- Hwang, I.K.; Kang, H.H.; Lee, I.S.; Oh, J.E. Assessment of characteristic distribution of PCDD/Fs and BFRs in sludge generated at municipal and industrial wastewater treatment plants. Chemosphere 2012, 88, 888–894. [Google Scholar] [CrossRef] [PubMed]
- Toms, L.M.L.; Guerra, P.; Eljarrat, E.; Barceló, D.; Harden, F.A.; Hobson, P.; Mueller, J.F. Brominated flame retardants in the Australian population: 1993–2009. Chemosphere 2012, 89, 398–403. [Google Scholar] [CrossRef] [PubMed]
- Abdallah, M.A.-E.H.; Stuart, J. Tetrabromobisphenol-A, hexabromocyclododecane and its degradation products in UK human milk: Relationship to external exposure. Environ. Int. 2011, 37, 443–448. [Google Scholar] [CrossRef] [PubMed]
- Cariou, R.A.J.; Zalko, D.; Berrebi, A.; Cravedi, J.P.; Maume, D.; Marchand, P.; Monteau, F.; Riu, A.; Andre, F.; Le Bizec, B. Exposure assessment of French women and their newborns to tetrabromobisphenol-A: Occurrence measurements in maternal adipose tissue, serum, breast milk and cord serum. Chemosphere 2008, 73, 1036–1041. [Google Scholar] [CrossRef]
- Shahidi, F.; Zhong, Y. Novel antioxidants in food quality preservation and health promotion. Eur. J. Lipid Sci. Technol. 2010, 112, 930–940. [Google Scholar] [CrossRef]
- Cort, W.M. Antioxidant activity of tocopherols, ascorbyl palmitate, and ascorbic acid and their mode of action. J. Am. Oil Chem. Soc. 1974, 51, 321. [Google Scholar] [CrossRef]
- Robertson, G.L. Active and intelligent packaging. In Food Packaging: Principles and Practice, Chapter 14; CRC Press: Boca Raton, FL, USA, 2006. [Google Scholar]
- Tawfik, M.S.; Huyghebaert, A. Interaction of packaging materials and vegetable oils: Oil stability. Food Chem. 1999, 64, 451–459. [Google Scholar] [CrossRef]
- Graciano-Verdugo, A.Z.; Soto-Valdez, H.; Peralta, E.; Cruz-Zárate, P.; Islas-Rubio, A.R.; Sánchez-Valdes, S.; Sánchez-Escalante, A.; González-Méndez, N.; González-Ríos, H. Migration of α-tocopherol from LDPE films to corn oil and its effect on the oxidative stability. Food Res. Int. 2010, 43, 1073–1078. [Google Scholar] [CrossRef]
- Valdés, A.; Mellinas, A.C.; Ramos, M.; Garrigós, M.C.; Jiménez, A. Natural additives and agricultural wastes in biopolymer formulations for food packaging. Front. Chem. 2014, 2, 6. [Google Scholar] [CrossRef]
- Vermeiren, L.; Devlieghere, F.; van Beest, M.; de Kruijf, N.; Debevere, J. Developments in the active packaging of foods. Trends Food Sci. Technol. 1999, 10, 77–86. [Google Scholar] [CrossRef]
- Dobrucka, R.; Cierpiszewski, R. Active and intelligent packaging food—Research and development—A review. Pol. J. Food Nutr. Sci. 2014, 64, 7. [Google Scholar] [CrossRef]
- Issart, A.; Nerin, C.; Allal, A.; Szpunar, J. Evaluation of the transfert release of natural antioxidants from active packaging to food simulant. 2019; submitted. [Google Scholar]


| Polymer Matrix | Analyte | Solvent Mixture | Contact Time (s) | Repetitions | Ref |
|---|---|---|---|---|---|
| Polyethylene, terephthalate (PET), | Polyethylene oxide (PEO) | 1:1 H2O:ACN + 0.1% formic acid | 8 | - | [36] |
| polypropylene (PP) and polyethylene (PE) | Natural additives | 2:1 MeOH:CHCl3 + 0.1% formic acid | 8 | - | [36] |
| Worn contact lenses | Lipids | (2:1 v/v) MeOH:CHCl3 + 8 mm CH3COONH4 (negative ion mode) | 5 | - | [33] |
| Worn contact lenses | Lipids | isoPrOH:MeOH:CHCl3 (4:2:1 v/v/v) + 20 mm CH3COONH4 (positive-ion mode) | 5 | - | [33] |
| Polyester-based coil coatings | HALS (additive) | MeOH:CHCl3 (2:1) + 0.1% formic acid (v/v) | 1 | 3 | [35] |
| Polyacrylate | HALS | MeOH:CHCl3 (2:1) + 0.1% formic acid (v/v) | 1 | 2 | [34] |
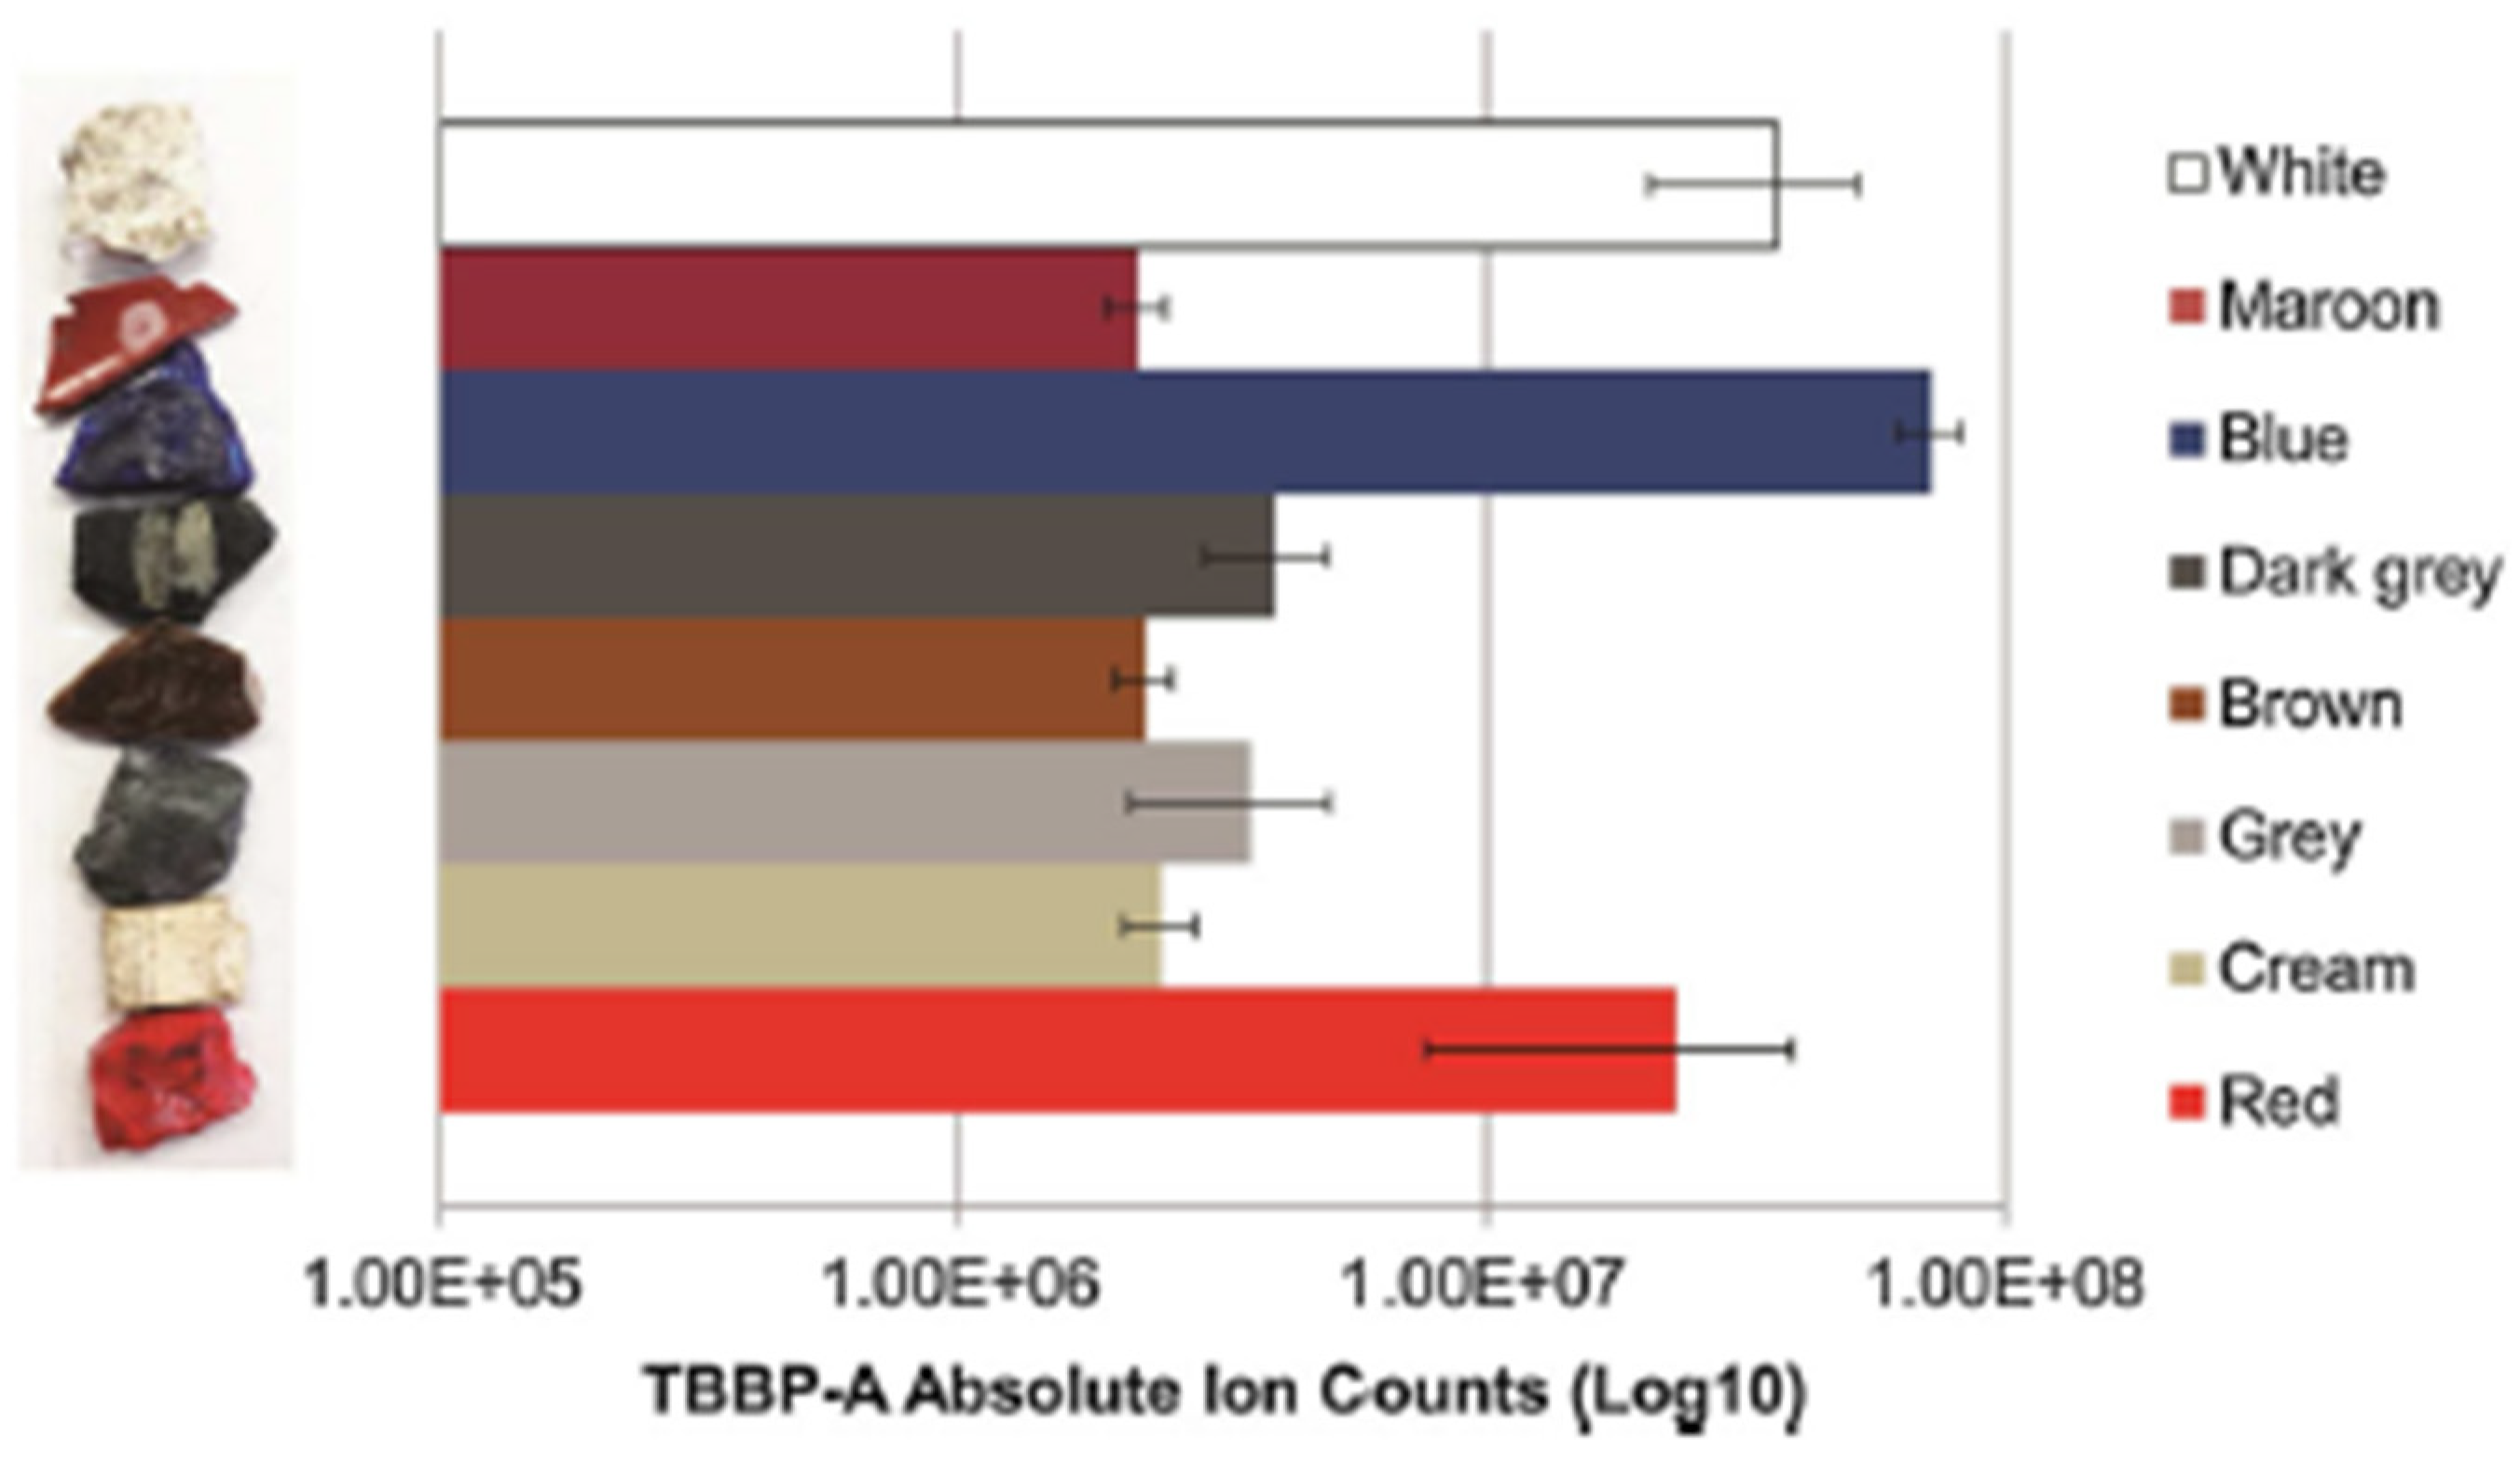
| Plastic e-wastes | Brominated flame-retardant (additives) | MeOH:CHCl3 (2:1) + CH3COONH4 (20 mm) | 1 | 3 | [32] |
© 2019 by the authors. Licensee MDPI, Basel, Switzerland. This article is an open access article distributed under the terms and conditions of the Creative Commons Attribution (CC BY) license (http://creativecommons.org/licenses/by/4.0/).
Share and Cite
Issart, A.; Szpunar, J. Potential of Liquid Extraction Surface Analysis Mass Spectrometry (LESA—MS) for the Characterization of Polymer-Based Materials. Polymers 2019, 11, 802. https://doi.org/10.3390/polym11050802
Issart A, Szpunar J. Potential of Liquid Extraction Surface Analysis Mass Spectrometry (LESA—MS) for the Characterization of Polymer-Based Materials. Polymers. 2019; 11(5):802. https://doi.org/10.3390/polym11050802
Chicago/Turabian StyleIssart, Ambre, and Joanna Szpunar. 2019. "Potential of Liquid Extraction Surface Analysis Mass Spectrometry (LESA—MS) for the Characterization of Polymer-Based Materials" Polymers 11, no. 5: 802. https://doi.org/10.3390/polym11050802