The Influence of Low Shear Microbore Extrusion on the Properties of High Molecular Weight Poly(l-Lactic Acid) for Medical Tubing Applications

 , , ,
, , ,  and
and
Abstract
:
1. Introduction
2. Materials and Methods
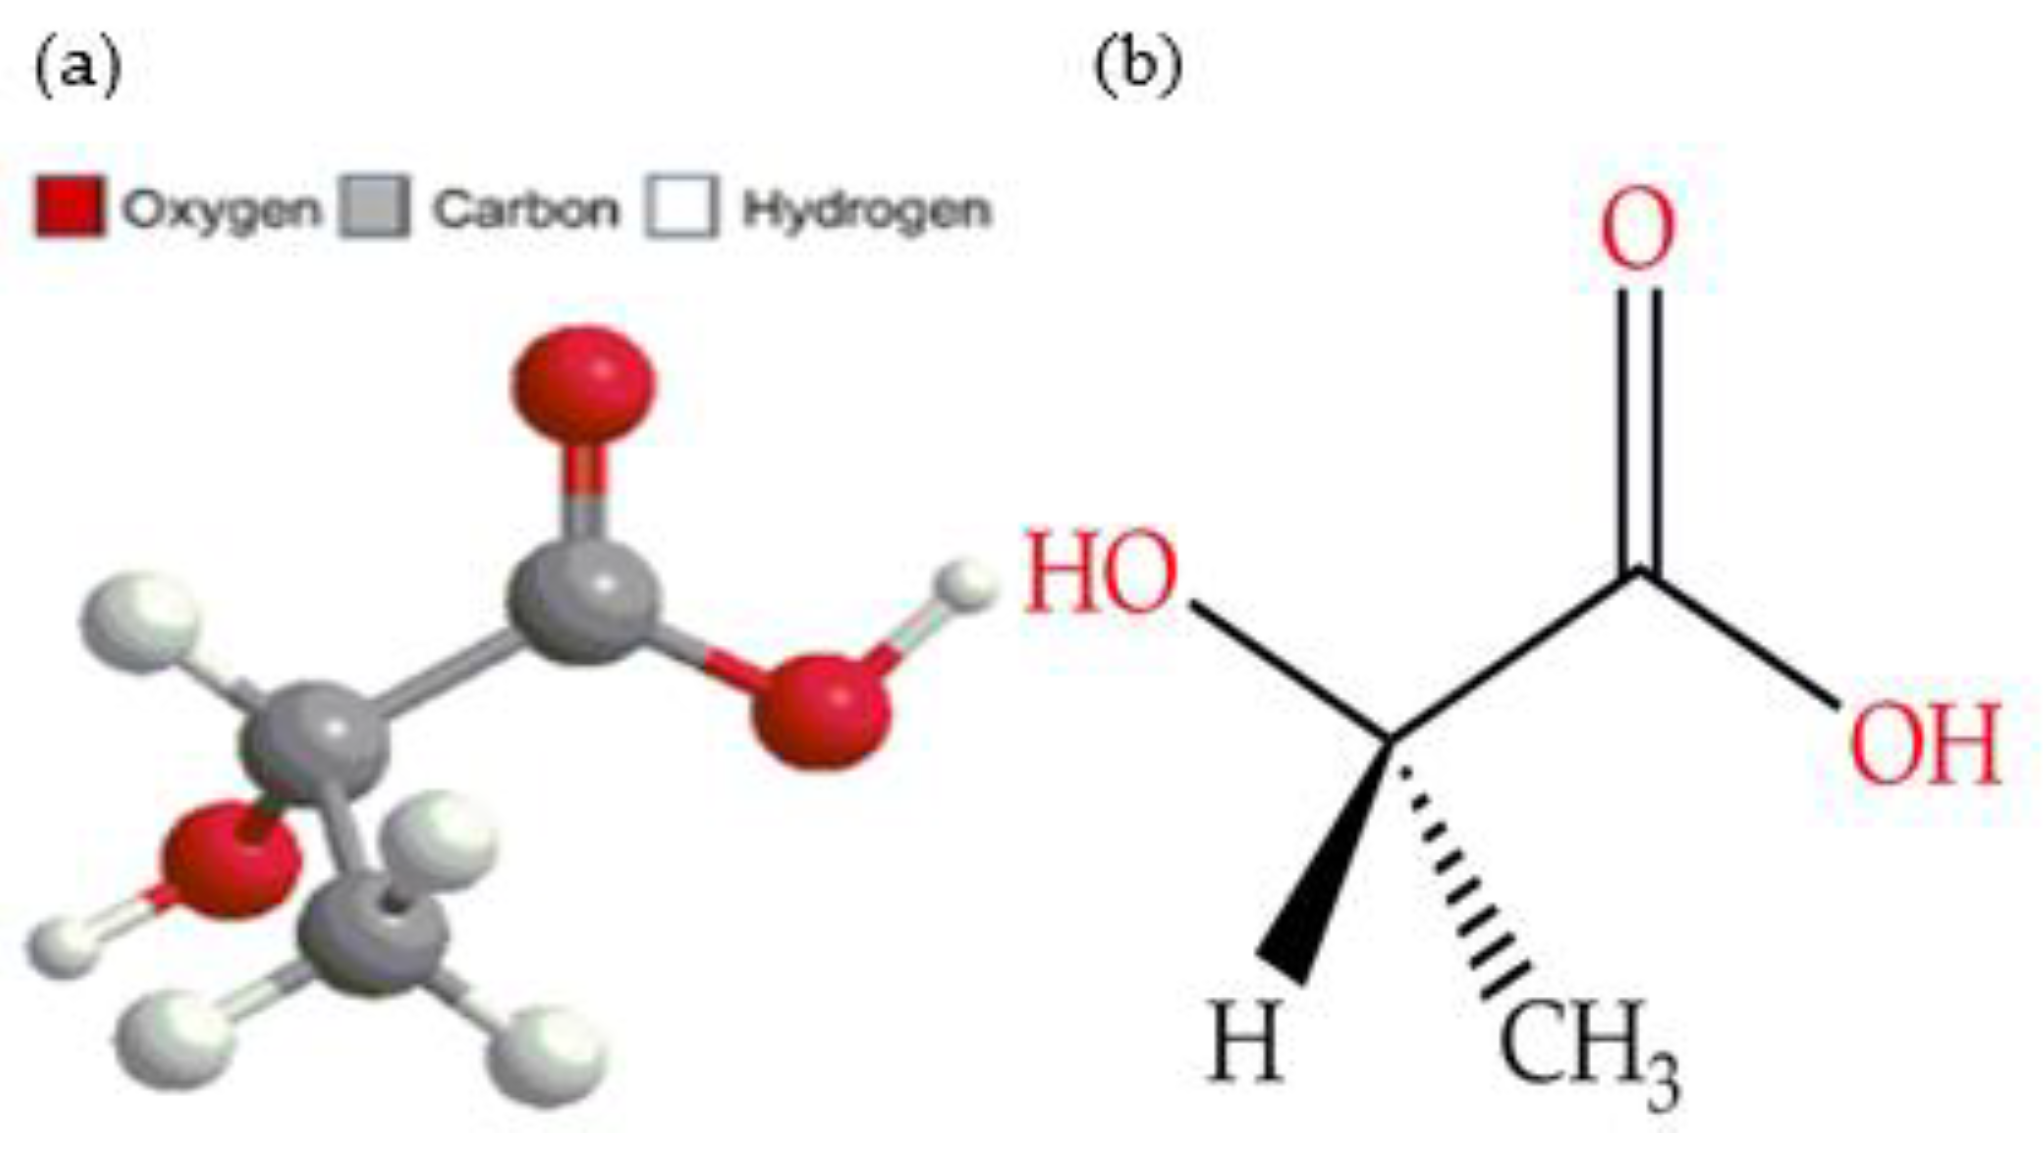
2.1. Materials
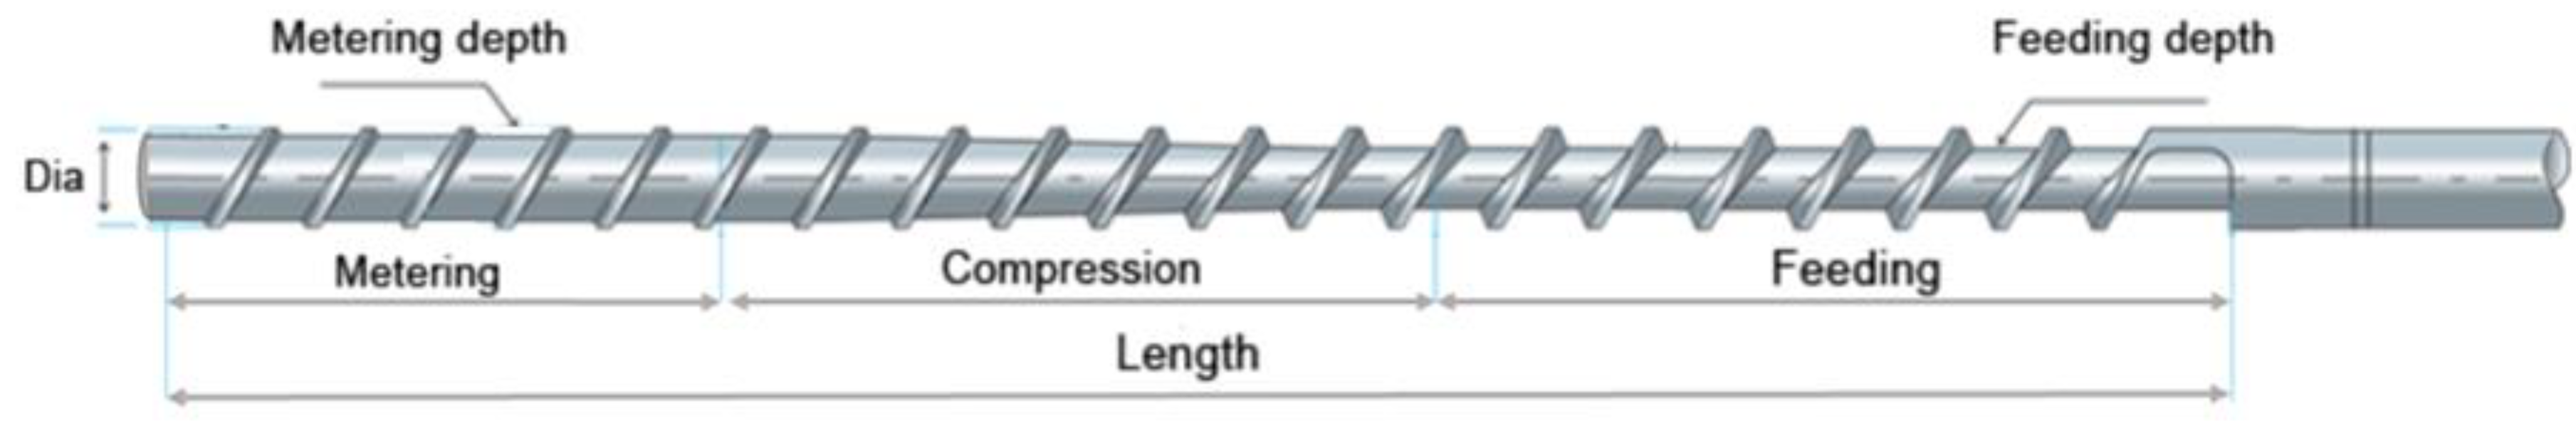
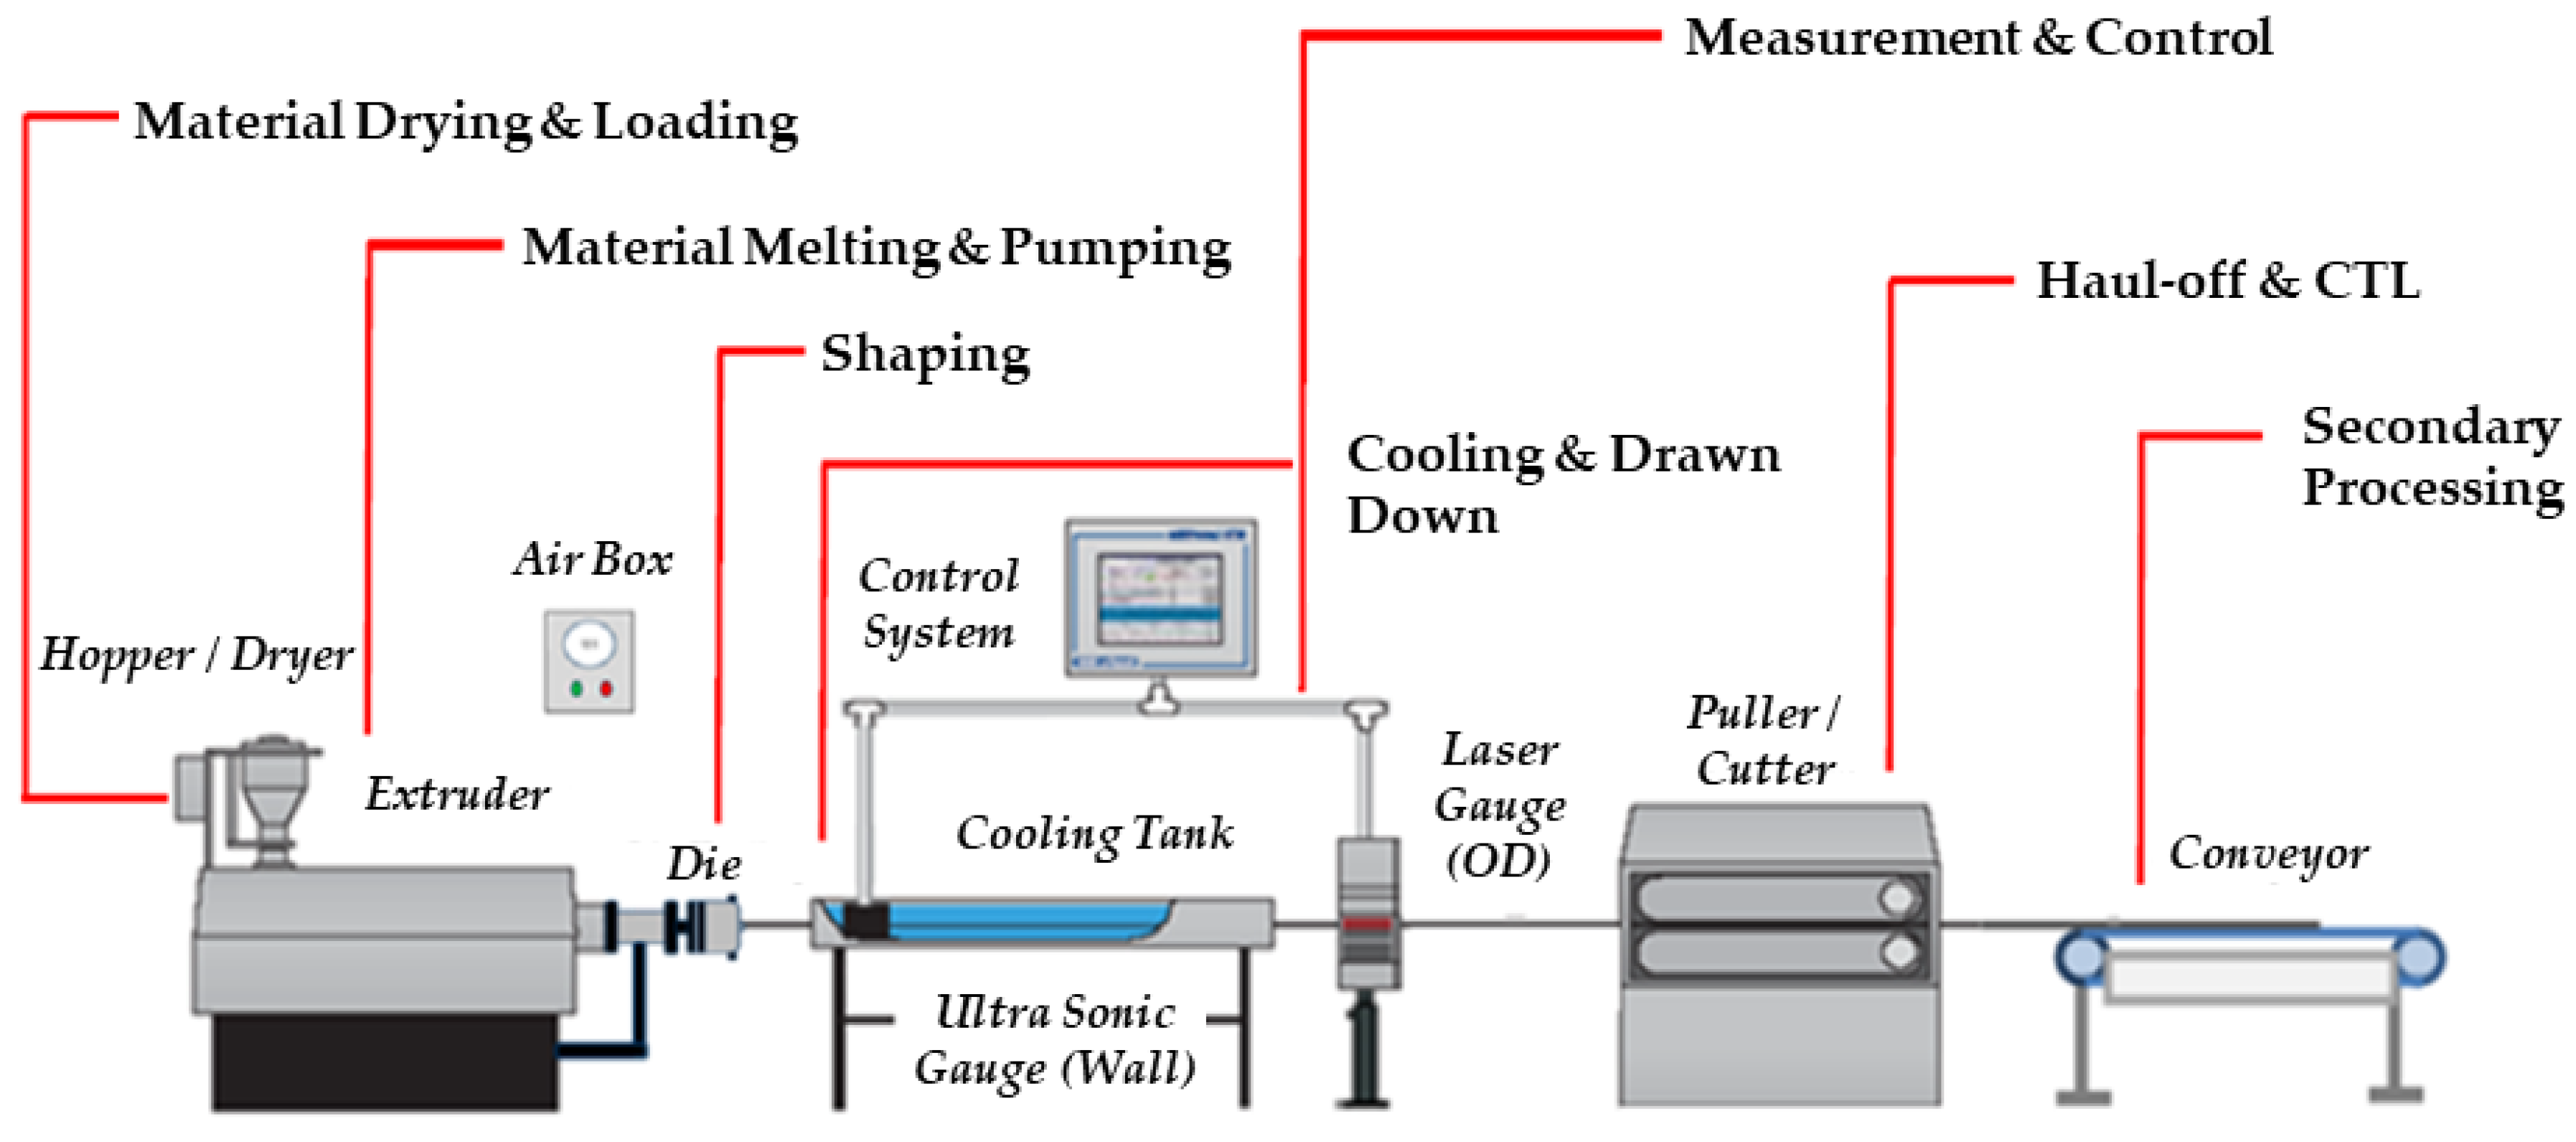
2.2. Processing
2.3. Rheological Properties
2.4. Molecular Weight and Chemical Analysis
2.4.1. Molecular Weight
2.4.2. Chemical Analysis
2.4.3. Residual Monomer
2.5. Thermal and Morphological Properties
Differential Scanning Calorimetry
2.6. Mechanical Properties
2.6.1. Tensile Testing
2.6.2. Dynamic Mechanical Analysis
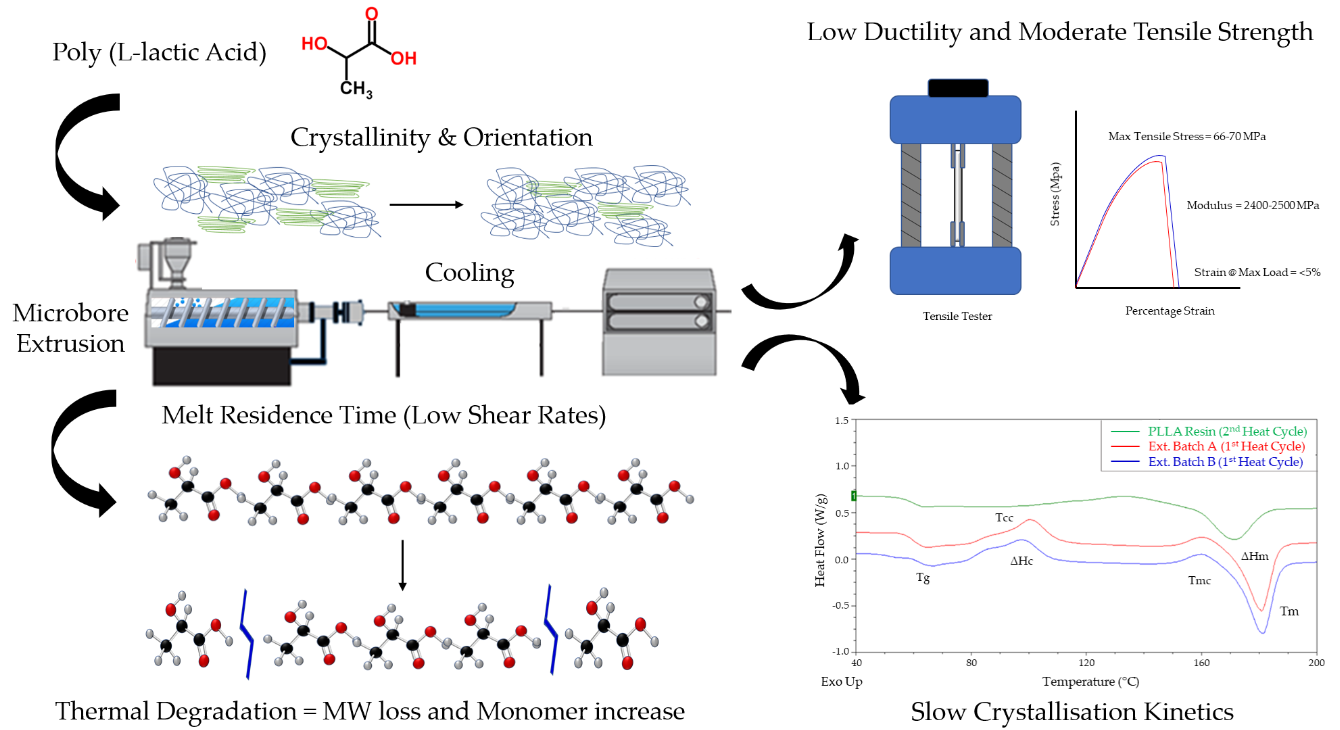
3. Results and Discussion
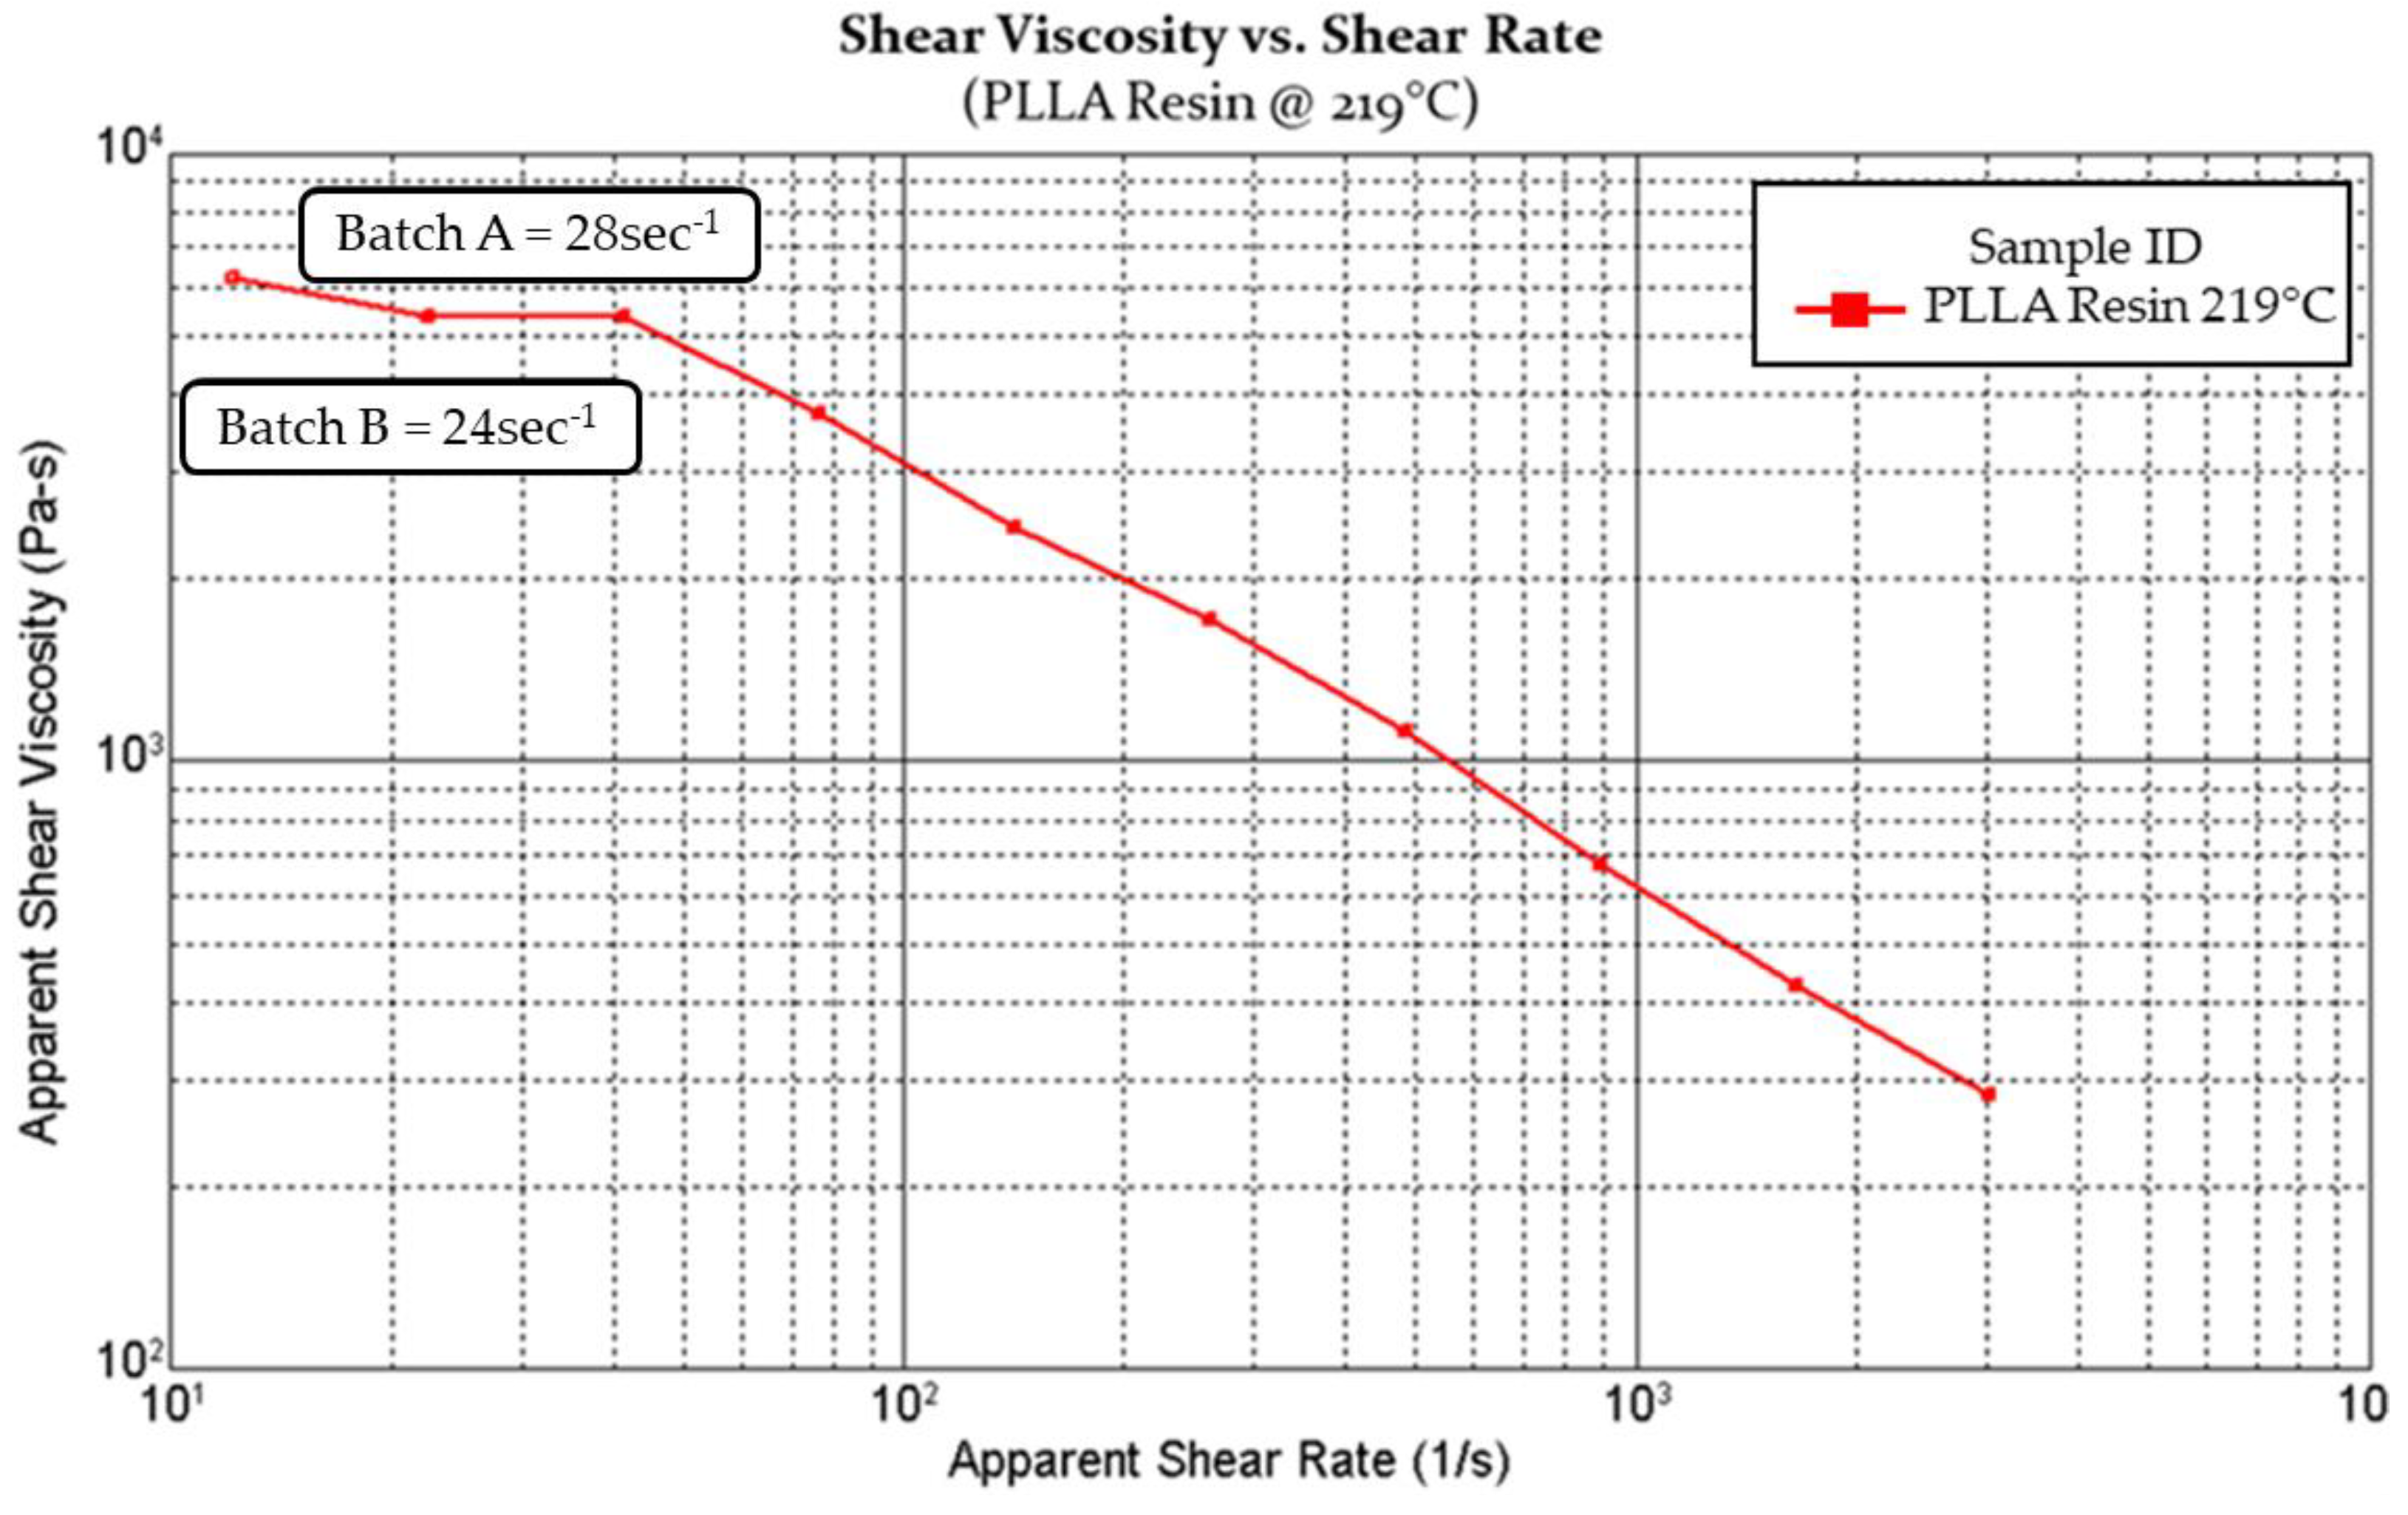
3.1. Rheological Results
3.2. Molecular Weight and Chemical Analysis
3.2.1. Gel Permeation Chromatography
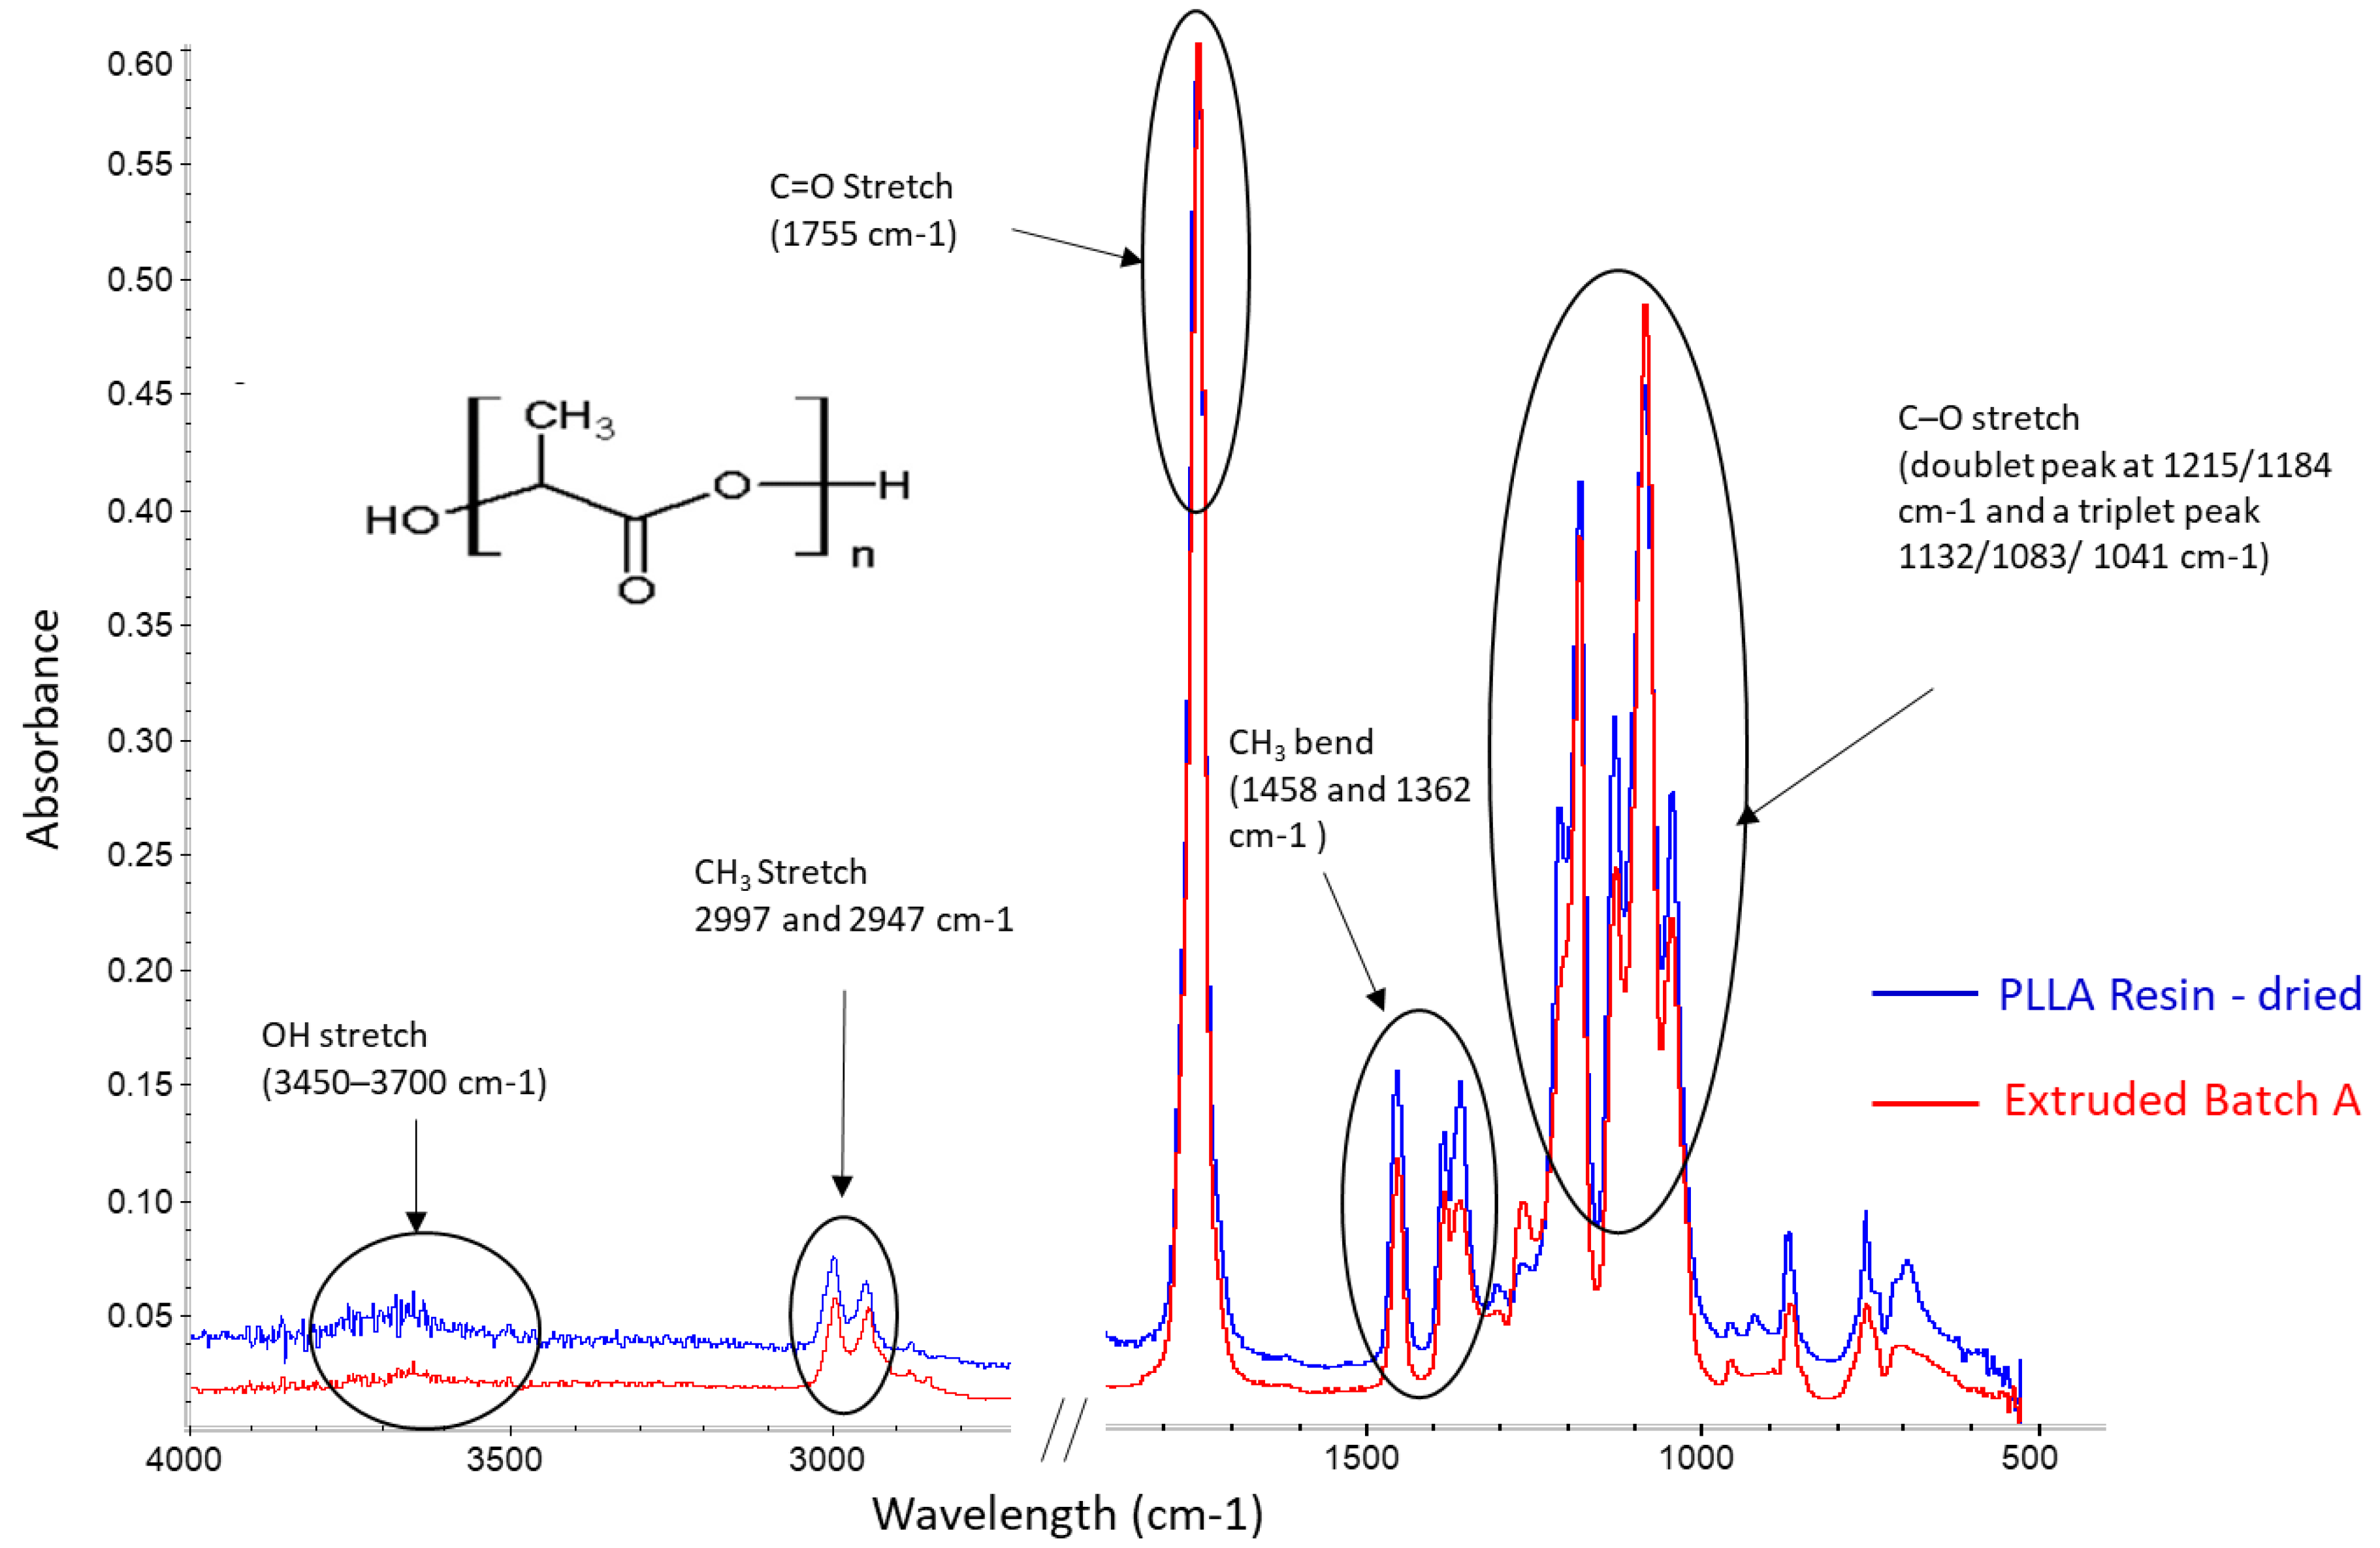
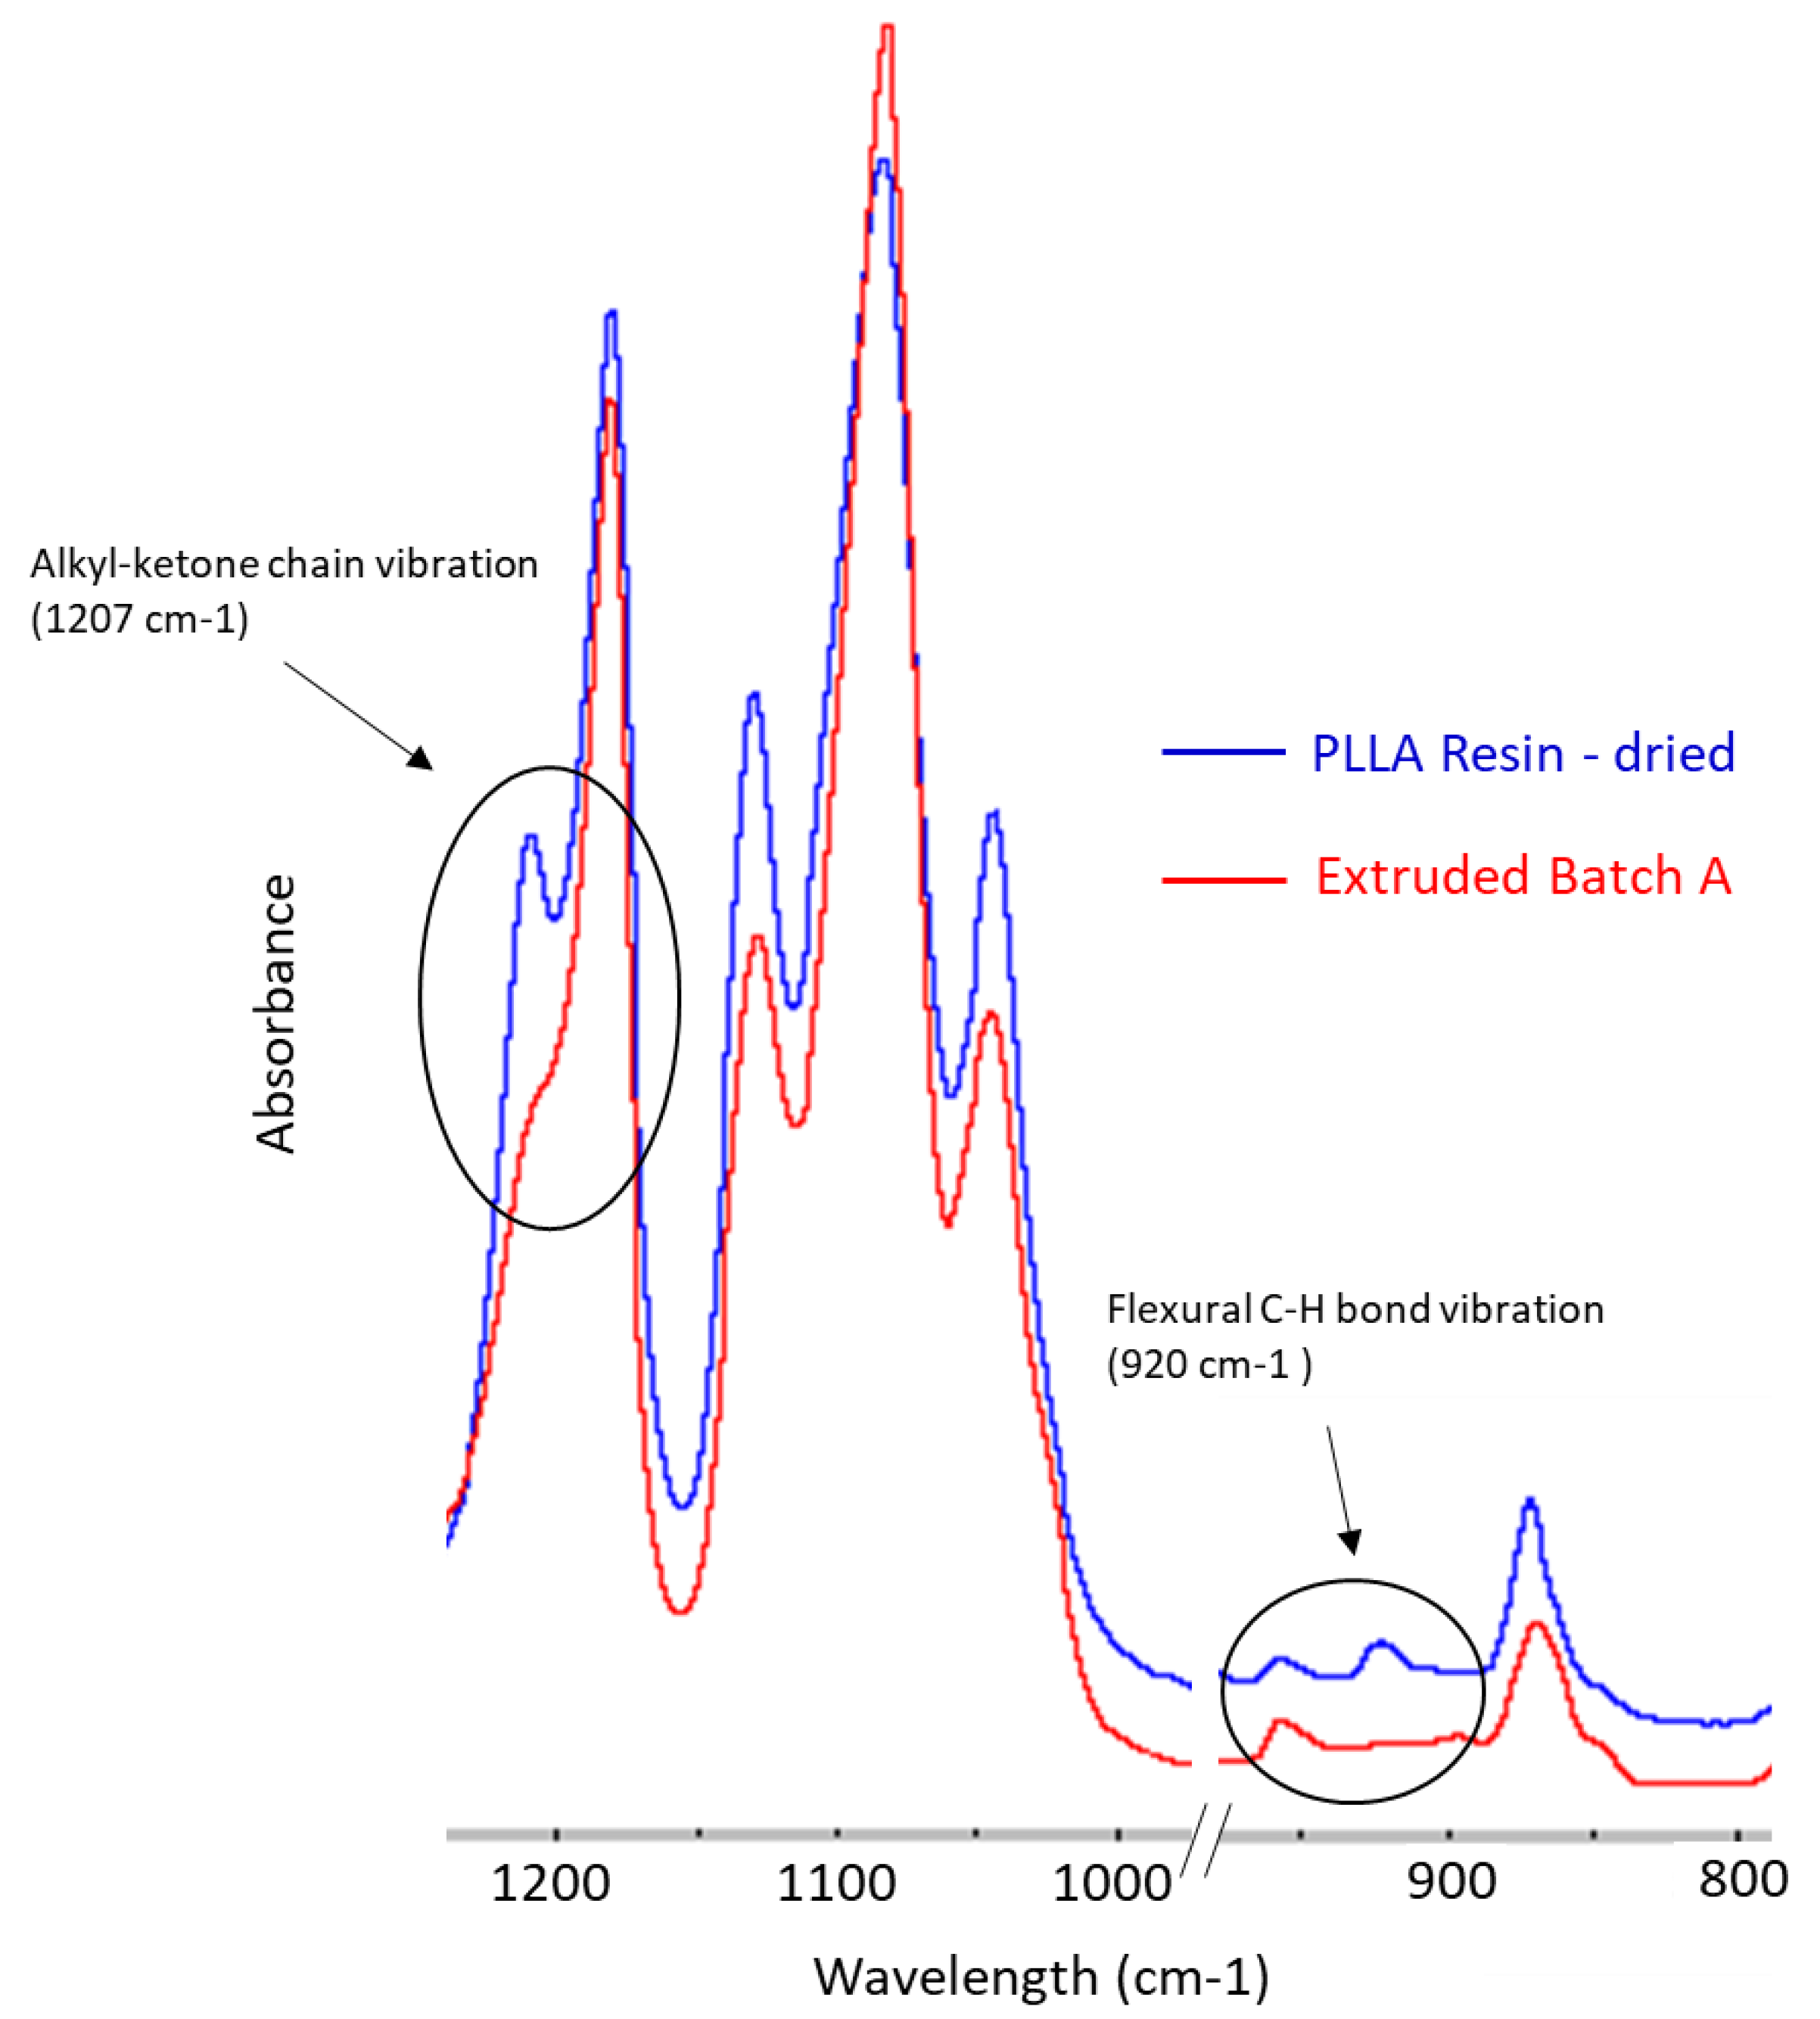
3.2.2. Fourier-Transform Infrared Spectroscopy
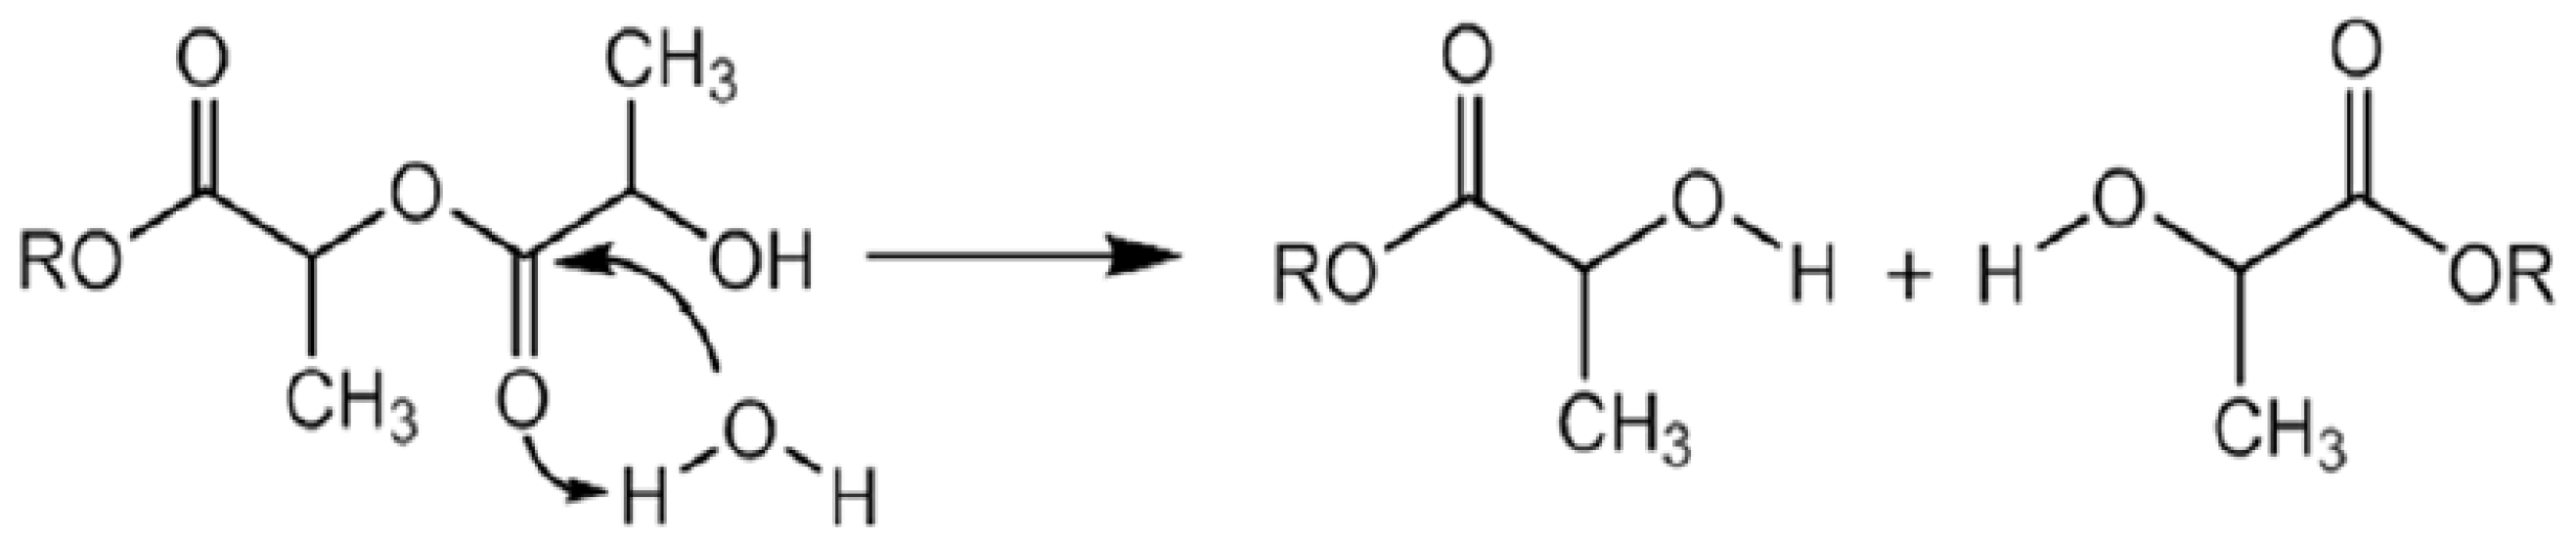
3.2.3. Gas-Chromatography-Flame Ionization Detector
3.3. Thermal and Morphological Results
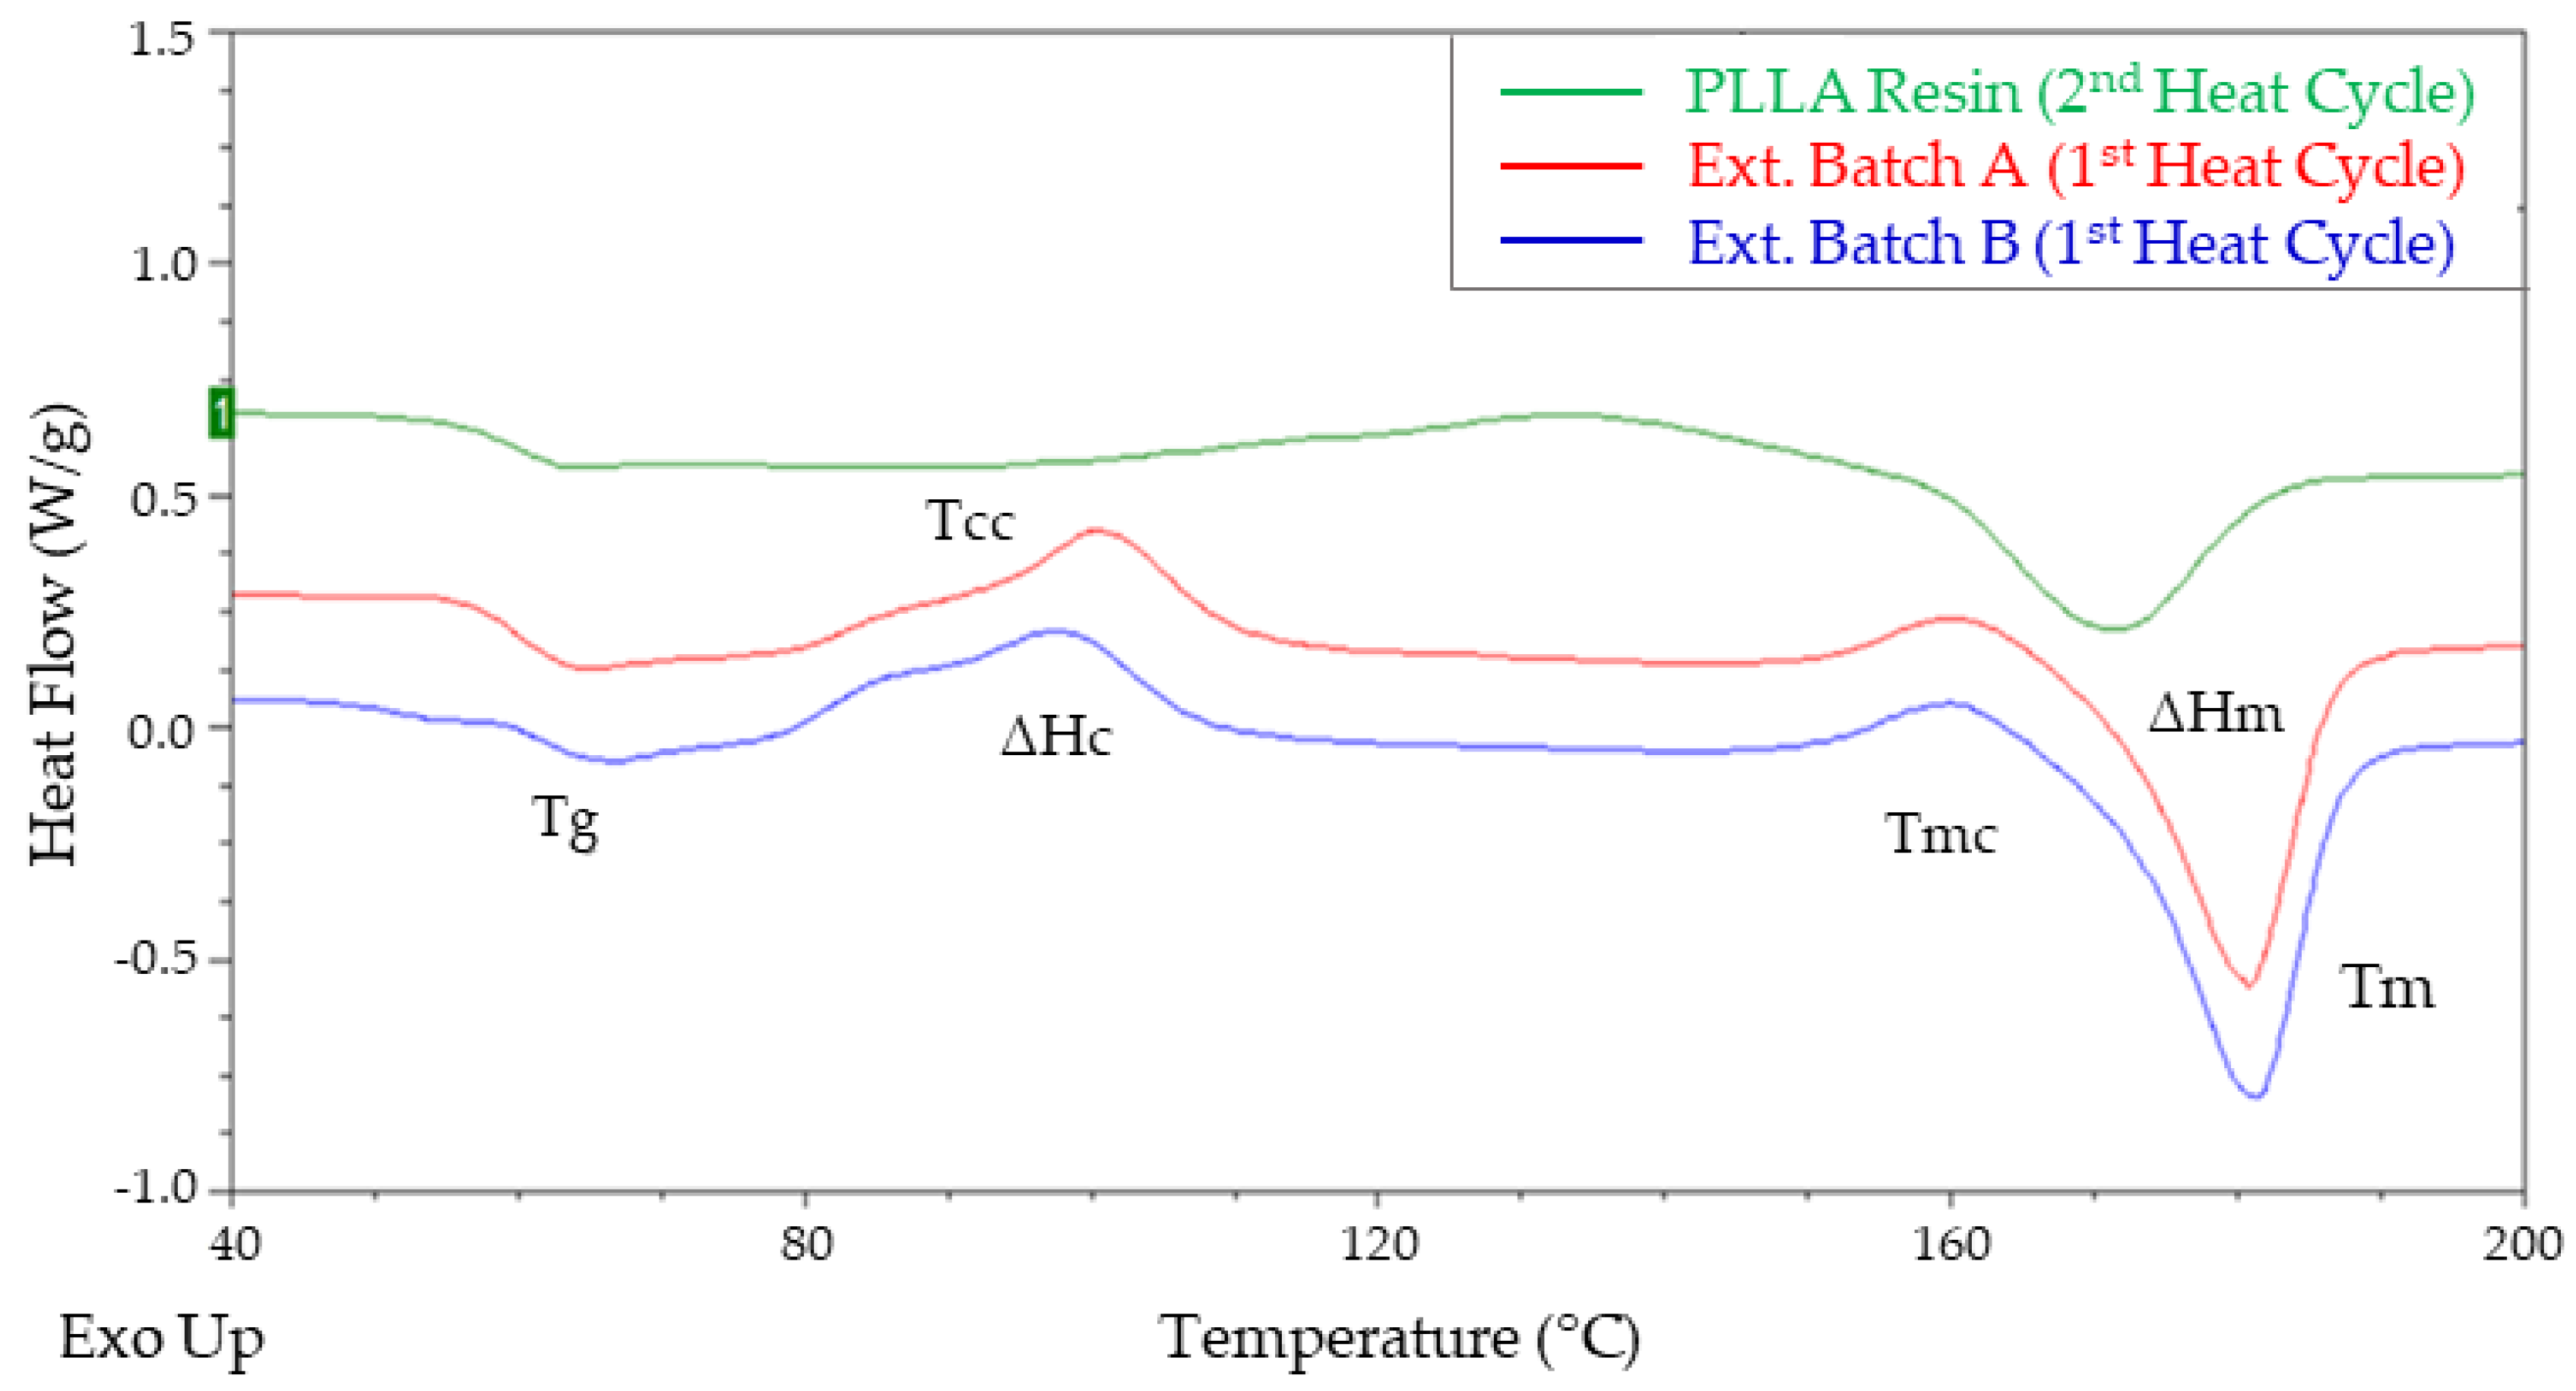
Differential Scanning Calorimetry (DSC)
3.4. Mechanical Results
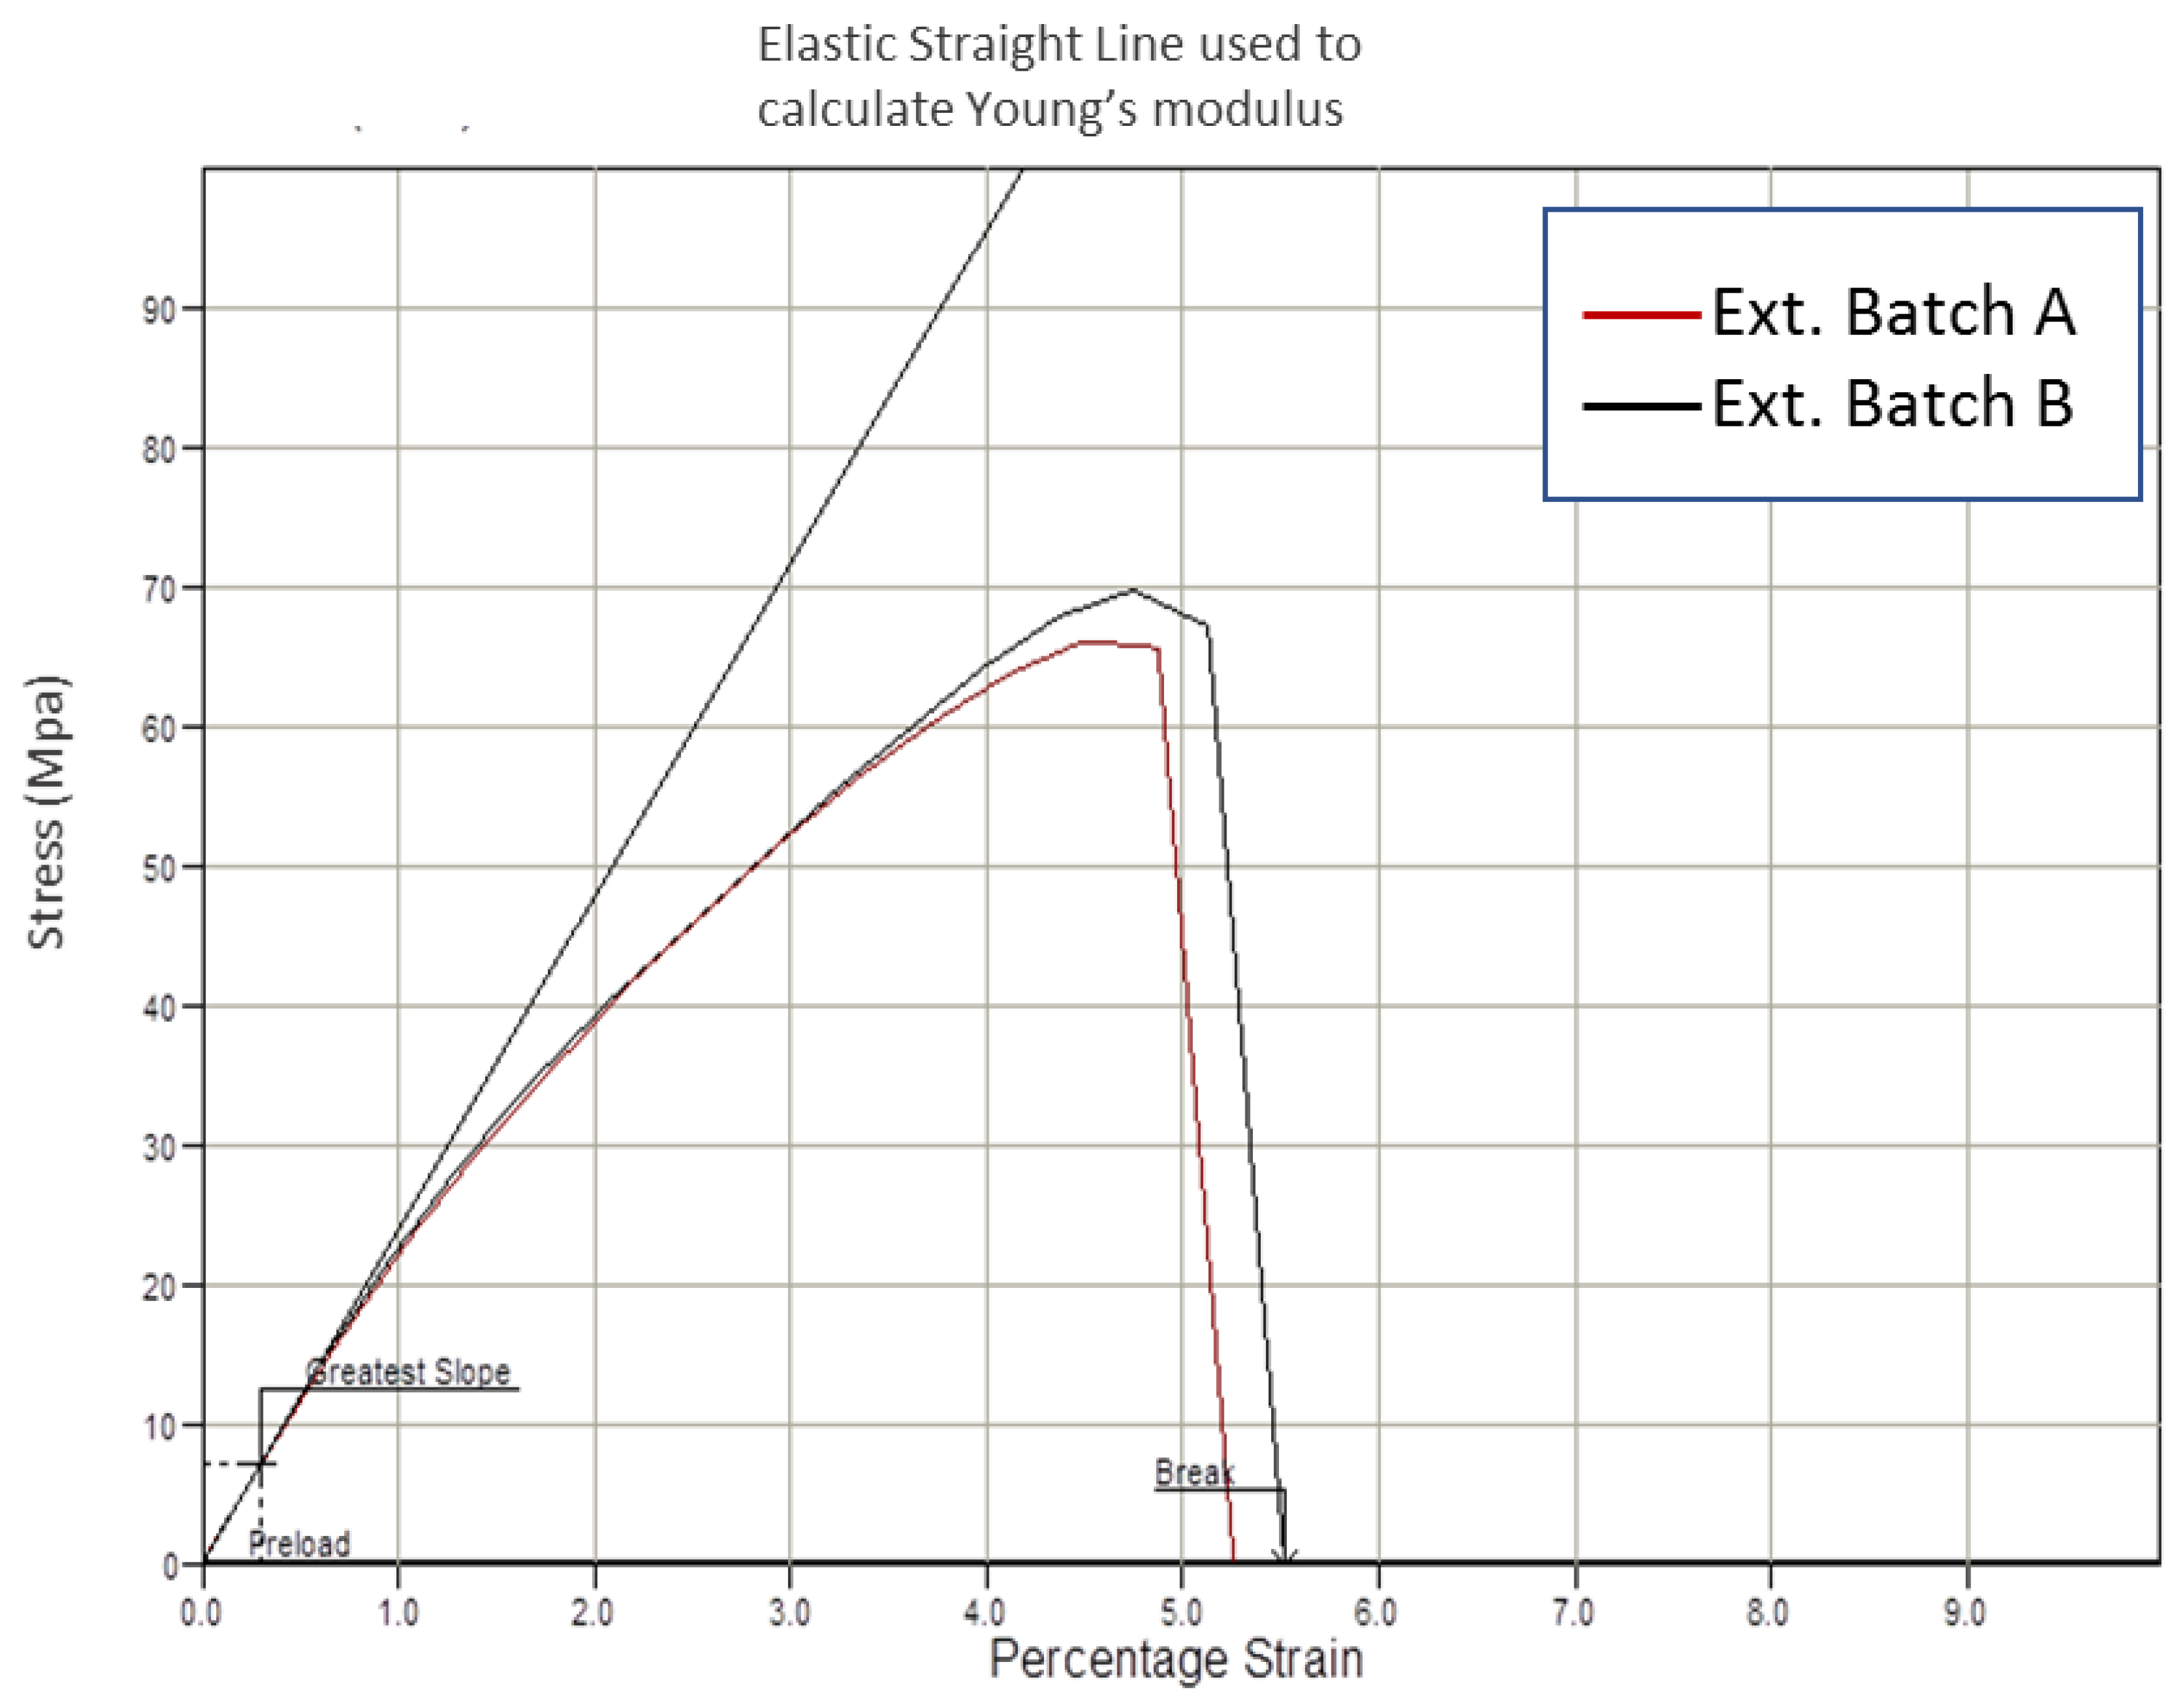
3.4.1. Tensile Testing
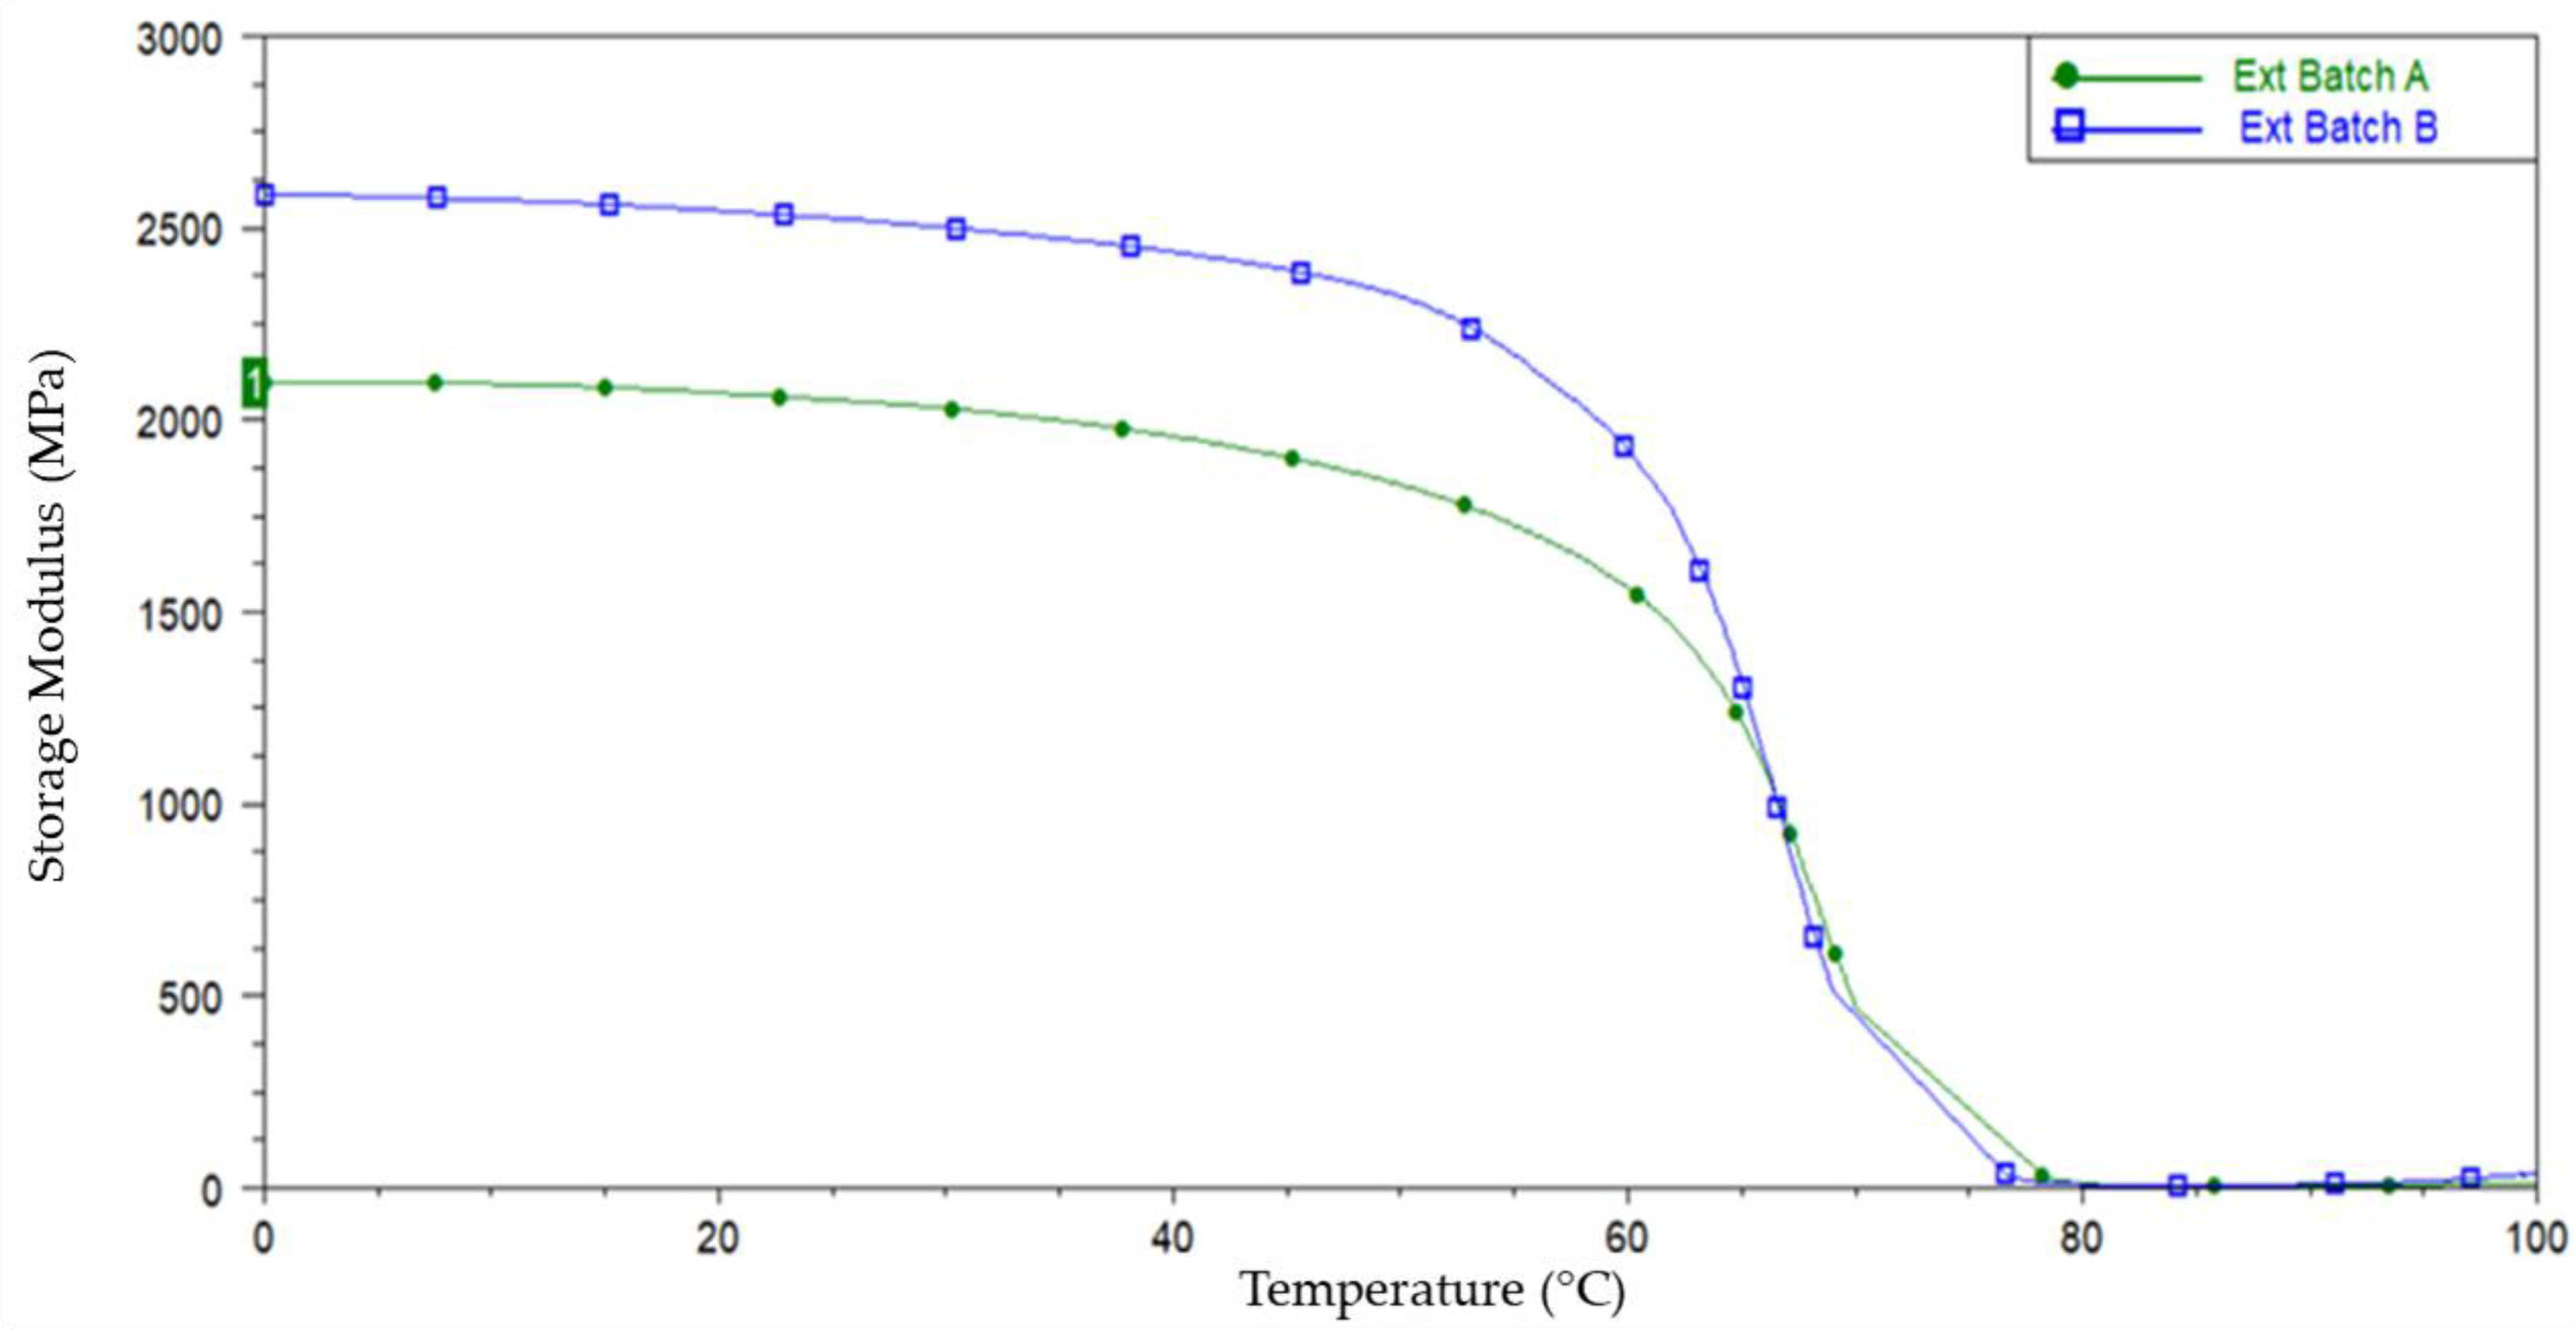
3.4.2. Dynamic Mechanical Analysis (DMA)
4. Conclusions
Author Contributions
Funding
Conflicts of Interest
References
- Tian, H.; Tang, Z.; Zhuang, X.; Chen, X.; Jing, X. Biodegradable synthetic polymers: Preparation, functionalization and biomedical application. Progress in Polymer Science. Prog. Polym. Sci. 2012, 37, 237–280. [Google Scholar] [CrossRef]
- Sin, L.T.; Rahmat, A.R.; Rahman, W.A. Polylactic Acid: PLA Biopolymer Technology and Applications; William Andrew: Norwich, NY, USA, 2012; pp. 71–74. [Google Scholar]
- Kumbar, S.; Laurencin, C.; Deng, M. Natural and Synthetic Biomedical Polymers; Elsevier: Amsterdam, The Netherlands, 2014; pp. 10–11. [Google Scholar]
- Ang, H.Y.; Bulluck, H.; Wong, P.; Venkatraman, S.S.; Huang, Y.; Foin, N. Bioresorbable stents: Current and upcoming bioresorbable technologies. Int. J. Cardiol. 2017, 228, 931–939. [Google Scholar] [CrossRef] [PubMed]
- Middleton, J.C.; Tipton, A.J. Synthetic biodegradable polymers as orthopedic devices. Biomaterials 2000, 21, 2335–2346. [Google Scholar] [CrossRef]
- Celli, A.; Scandola, M. Thermal properties and physical ageing of poly (l-lactic acid). Polymer 1992, 33, 2699–2703. [Google Scholar] [CrossRef]
- Hamad, K.; Kaseem, M.; Yang, H.W.; Deri, F.; Ko, Y.G. Properties and medical applications of polylactic acid: A review. eXPRESS Polym. Lett. 2015, 9, 435–455. [Google Scholar] [CrossRef]
- Perego, G.; Cella, G.D.; Bastloll, C. Effect of molecular weight and crystallinity on poly(lactic acid) mechanical properties. J. Appl. Polym. Sci. 1996, 59, 37–43. [Google Scholar] [CrossRef]
- Renouf-Glauser, A.C.; Rose, J.; Farrar, D.F.; Cameron, R.E. The effect of crystallinity on the deformation mechanism and bulk mechanical properties of PLLA. Biomaterials 2005, 26, 5771–5782. [Google Scholar] [CrossRef] [PubMed]
- Lim, L.T.; Auras, R.; Rubino, M. Processing technologies for poly(lactic acid). Prog. Polym. Sci. 2008, 33, 820–852. [Google Scholar] [CrossRef]
- Shalaby, S.W.; Burg, K.J.L. Absorbable and Biodegradable Polymers; CRC Press: Boca Raton, FL, USA, 2005; pp. 136–138. [Google Scholar]
- Taubner, V.; Shishoo, R. Influence of processing parameters on the degradation of poly(L-lactide) during extrusion. J. Appl. Polym. Sci. 2001, 79, 2128–2135. [Google Scholar] [CrossRef]
- Carrasco, F.; Pagès, P.; Gámez-Pérez, J.; Santana, O.O.; Maspoch, M.L. Processing of poly(lactic acid): Characterization of chemical structure, thermal stability and mechanical properties. Polym. Degrad. Stab. 2010, 95, 116–125. [Google Scholar] [CrossRef]
- Weir, N.A.; Buchanan, F.J.; Orr, J.F.; Farrar, D.F.; Boyd, A. Processing, annealing and sterilisation of poly-L-lactide. Biomaterials 2004, 25, 3939–3949. [Google Scholar] [CrossRef] [PubMed]
- Huttunen, M.; Kellomäki, M. Strength retention behavior of oriented PLLA, 96L/4D PLA, and 80L/20D,L PLA. Biomatter 2013, 3, e26395. [Google Scholar] [CrossRef]
- Hyon, S.H.; Jamshidi, K.; Ikada, Y. Effects of Residual Monomer on the Degradation of DL-Lactide Polymer. Polym. Int. 1998, 46, 196–202. [Google Scholar] [CrossRef]
- Giles, H.F.; Wagner, J.R.; Mount, E.M. Extrusion: The Definitive Processing Guide and Handbook; William Andrew Pub: Norwich, NY, USA, 2005; pp. 161–163. [Google Scholar]
- Zhou, C.; Guo, H.; Li, J.; Huang, S.; Li, H.; Meng, Y.; Yu, D.; de Claville Christiansen, J.; Jiang, S. Temperature dependence of poly(lactic acid) mechanical properties. RSC Adv. 2016, 6, 113762–113772. [Google Scholar] [CrossRef]
- Dorgan, J.R.; Williams, J.S.; Lewis, D.N. Melt rheology of poly(lactic acid): Entanglement and chain architecture effects. J. Rheol. 1999, 43, 1141–1155. [Google Scholar] [CrossRef]
- Palade, L.-I.; Lehermeier, H.J.; Dorgan, J.R. Melt Rheology of High l -Content Poly(lactic acid). Macromolecules 2001, 34, 1384–1390. [Google Scholar] [CrossRef]
- Dorgan, J.R.; Knauss, D.; Janzen, J.; Clayton, M.P.; Hait, S.B.; Knauss, D.M. Melt rheology of variable L-content poly(lactic acid). J. Rheol. 2005, 49, 607–619. [Google Scholar] [CrossRef]
- Cooper-White, J.J.; Mackay, M.E. Rheological properties of poly(lactides). Effect of molecular weight and temperature on the viscoelasticity of poly(l-lactic acid). J. Polym. Sci. Part B Polym. Phys. 1999, 37, 1803–1814. [Google Scholar] [CrossRef]
- Othman, N.; Jazrawi, B.; Mehrkhodavandi, P.; Hatzikiriakos, S.G. Wall slip and melt fracture of poly(lactides). Rheol. Acta 2012, 51, 357–369. [Google Scholar] [CrossRef]
- Kutz, M. Applied Plastics Engineering Handbook—Processing and Materials; William Andrew Pub: Norwich, NY, USA, 2011; pp. 227–258. [Google Scholar]
- Xu, J. A Simple System Analysis For The Small Extrusion Screw And Die. Society of Plastics Engineers. 2018. Available online: https://www.4spe.org (accessed on 14 March 2019).
- Yu, H.; Huang, N.; Wang, C.; Tang, Z. Modeling of poly(L-lactide) thermal degradation: Theoretical prediction of molecular weight and polydispersity index. J. Appl. Polym. Sci. 2003, 88, 2557–2562. [Google Scholar] [CrossRef]
- Siparsky, G.L.; Voorhees, K.J.; Dorgan, J.R.; Schilling, K. Water transport in polylactic acid (PLA), PLA/ polycaprolactone copolymers, and PLA/polyethylene glycol blends. J. Environ. Polym. Degrad. 1997, 5, 125. [Google Scholar] [CrossRef]
- Kang, E.Y.; Lih, E.; Kim, I.H.; Joung, Y.K.; Han, D.K. Effects of poly(l-lactide-ε-caprolactone) and magnesium hydroxide additives on physico-mechanical properties and degradation of poly(l-lactic acid). Biomater. Res. 2016, 20, 7. [Google Scholar] [CrossRef]
- Södergård, A.; Stolt, M. Properties of lactic acid based polymers and their correlation with composition. Prog. Polym. Sci. 2002, 27, 1123–1163. [Google Scholar] [CrossRef]
- Nicolae, C.-A.; Grigorescu, M.A.; Gabor, R.A. An Investigation of Thermal Degradation of Poly(Lactic Acid). Eng. Lett. 2008, 16, 568–571. [Google Scholar]
- Jaafar, I.H.; Li, Q.; Pearson, R.A.; Esposito, G.; Jedlicka, S.S.; Coulter, J.P. Vibration assisted injection molding of poly(lactic acid)-thermal, spectroscopic, and mechanical analysis of hydrolytic degradation. In Proceedings of the SPE ANTEC 2017, Anaheim, CA, USA, 8–10 May 2017; pp. 1652–1661. [Google Scholar]
- Mofokeng, J.P.; Luyt, A.S.; Tábi, T.; Kovács, J. Comparison of injection moulded, natural fibre-reinforced composites with PP and PLA as matrices. J. Thermoplast. Compos. Mater. 2012, 25, 927–948. [Google Scholar] [CrossRef]
- Jiménez-Bonilla, P.; Salas-Arias, J.; Esquivel, M.; Vega-Baudrit, J.R. Optimization of Microwave-Assisted and Conventional Heating Comparative Synthesis of Poly(lactic acid) by Direct Melt Polycondensation from Agroindustrial Banana (Musa AAA Cavendish) and Pineapple (Ananas comosus) Fermented Wastes. J. Polym. Environ. 2014, 22, 393. [Google Scholar] [CrossRef]
- Meaurio, E.; Lo, N. Infrared Spectrum of Poly(l-lactide): Application to Crystallinity Studies. Macromolecules 2006, 39, 9291–9301. [Google Scholar] [CrossRef]
- Gleadall, A.; Pan, J.; Kruft, M.-A.; Kellomäki, M. Degradation mechanisms of bioresorbable polyesters. Part 2. Effects of initial molecular weight and residual monomer. Acta. Biomater. 2014, 10, 2233–2240. [Google Scholar] [CrossRef] [PubMed]
- Gleadall, A.; Pan, J.; Kruft, M.-A.; Kellomäki, M. Degradation mechanisms of bioresorbable polyesters. Part 1. Effects of random scission, end scission and autocatalysis. Acta. Biomater. 2014, 10, 2223–2232. [Google Scholar] [CrossRef]
- Sodergard, A.; Nasman, J.H. Melt stability study of various types of poly(l-lactide). Ind. Eng. Chem. Res. 1996, 35, 732–735. [Google Scholar] [CrossRef]
- Ahmed, J.; Varshney, S.K. Polylactides-Chemistry, Properties and Green Packaging Technology: A Review. Int. J. Food Prop. 2011, 14, 37–58. [Google Scholar] [CrossRef]
- Menczel, J.D.; Prime, R.B. Thermal Analysis of Polymers; John Wiley: Hoboken, NJ, USA, 2009; pp. 58–68. [Google Scholar]
- Crawford, R.J.; Roy, J. Plastics Engineering, 3rd ed.; Butterworth-Heinemann: Oxford, UK, 1998; p. 30. [Google Scholar]
- Cheremisinoff, N.P. Handbook of Polymer Science and Technology: Synthesis and Properties; Marcel Dekker: New York, NY, USA, 1989; Volume 1, pp. 493–496. [Google Scholar]
- Zhu, P.; Ma, D. Double cold crystallization peaks of poly(ethylene terephthalate)—1. Samples isothermally crystallized at low temperature. Eur. Polym. J. 1997, 33, 1817–1818. [Google Scholar] [CrossRef]
- Ling, X. Thermal and X-ray Analysis on the Origin of Double Melting Phenomena of Poly(L-lactic acid) Films. Ph.D. Thesis, University of Tennessee, Knoxville, TN, USA, 2005; pp. 56–57. [Google Scholar]
- Wang, Y.; Mano, J.F. Influence of melting conditions on the thermal behaviour of poly(l-lactic acid). Eur. Polym. J. 2005, 41, 2335–2342. [Google Scholar] [CrossRef]
- Srithep, Y.; Nealey, P.; Turng, L.-S. Effects of annealing time and temperature on the crystallinity and heat resistance behavior of injection-molded poly(lactic acid). Polym. Eng. Sci. 2013, 53, 580–588. [Google Scholar] [CrossRef]
- Mohamed, E.-H.A. The Effect of Annealing Treatments on Spherulitic Morphology and Physical Ageing on Glass Transition of Poly Lactic Acid (PLLA). Mater. Sci. Appl. 2011, 2, 439–443. [Google Scholar] [CrossRef]
- Tábi, T.; Sajó, I.E.; Szabó, F.; Luyt, A.S.; Kovács, J.G. Crystalline structure of annealed polylactic acid and its relation to processing. eXPRESS Polym. Lett. 2010, 4, 659–668. [Google Scholar] [CrossRef]
- Mai, F.; Tu, W.; Bilotti, E.; Peijs, T. The Influence of Solid-State Drawing on Mechanical Properties and Hydrolytic Degradation of Melt-Spun Poly(Lactic Acid) (PLA) Tapes. Fibers 2015, 3, 523–538. [Google Scholar] [CrossRef]
- Arbeiter, D.; Schümann, K.; Sahmel, O.; Eickner, T.; Schmitz, K.-P.; Grabow, N. The effect of thermal treatment on the mechanical properties of PLLA tubular specimens. Curr. Dir. Biomed. Eng. 2016, 2, 27–29. [Google Scholar] [CrossRef]
- Løvdal, A.; Andreasen, J.W.; Mikkelsen, L.P.; Agersted, K.; Almdal, K. Characterization of biaxial strain of poly(l-lactide) tubes. Polym. Int. 2016, 65, 133–141. [Google Scholar] [CrossRef]
- Ellis, A.R. A Study of the Structure and Molecular Dynamics of Oriented, Semi-crystalline Poly(lactic Acid). Master’s Thesis, Pennsylvania State University, University Park, PA, USA, 2012. Available online: https://etda.libraries.psu.edu/catalog/16193 (accessed on 24 July 2018).
- Farah, S.; Anderson, D.G.; Langer, R. Physical and mechanical properties of PLA, and their functions in widespread applications—A comprehensive review. Adv. Drug Deliv. Rev. 2016, 107, 367–392. [Google Scholar] [CrossRef]
- Odian, G.G. Principles of Polymerization, 4th ed.; Wiley-InterScience: Hoboken, NJ, USA, 2004; pp. 19–20. [Google Scholar]
- Sperling, L.H. Introduction to Physical Polymer Science; John Wiley & Sons, Inc.: Hoboken, NJ, USA, 2006; pp. 2–10. [Google Scholar]
- Bergström, J.S.; Hayman, D. An Overview of Mechanical Properties and Material Modeling of Polylactide (PLA) for Medical Applications. Ann. Biomed. Eng. 2016, 44, 330–340. [Google Scholar] [CrossRef]


| Screw Dia. | Feed Depth | Metering Depth | Compression Ratio | l/d Ratio | Feed Section | Compression Section | Metering Section |
|---|---|---|---|---|---|---|---|
| 0.75” | 0.150 | 0.050” | 3:1 | 24/1 | 8 Flights | 8 Flights | 8 Flights |
| 1“ | 0.144 | 0.046” | 3.1:1 | 24/1 | 8 Flights | 8 Flights | 8 Flights |
| Sample Reference | Mn (g/mol) | Mw (g/mol) | PDI |
|---|---|---|---|
| PLLA Resin - as received | 200,073 | 430,409 | 2.16 |
| PLLA Resin - dried | 177,662 | 419,715 | 2.36 |
| Extruded Batch A | 146,177 | 367,575 | 2.51 |
| Extruded Batch B | 165,472 | 413,439 | 2.50 |
| Sample Reference | Lactide wt.% |
|---|---|
| PLLA Resin - dried | 0.016 |
| Extruded Batch A | 0.366 |
| Extruded Batch B | 0.330 |
| Batch Reference | Tg (°C) | ΔCp J/(g°C) | Tcc (°C) | ΔHc (J/g) | Tmc (°C) | Tm (°C) | ΔHm (J/g) | Xc (%) |
|---|---|---|---|---|---|---|---|---|
| Resin – Dried | 60.7 | 0.49 | - | - | - | 171.0 | 34.5 | 37.1 |
| Extruded Batch A | 61.4 | 0.95 | 100.9 | 27.6 | 159.9 | 180.6 | 39.8 | 13.2 |
| Extruded Batch B | 61.6 | 0.62 | 97.7 | 27.4 | 159.4 | 181.5 | 40.2 | 13.8 |
| Batch Reference | Young’s Modulus (MPa) | Maximum Tensile Stress (MPa) | Strain at Maximum Load (%) | Strain at Break (%) | |
|---|---|---|---|---|---|
| Extrusion Batch A | X (σ) | 2408 (66.6) | 66.6 (1.37) | 4.47 (0.288) | 5.54 (1.17) |
| Extrusion Batch B | X (σ) | 2521 (80.8) | 70.5 (0.94) | 4.44 (0.281) | 5.38 (0.33) |
| Batch Reference | Storage Modulus (MPa) @ 21 °C | Storage Modulus (MPa) @ 37 °C | Storage Modulus (MPa) @ 50 °C |
|---|---|---|---|
| Extrusion Batch A | 2067 | 1984 | 1831 |
| Extrusion Batch B | 2541 | 2460 | 2321 |
© 2019 by the authors. Licensee MDPI, Basel, Switzerland. This article is an open access article distributed under the terms and conditions of the Creative Commons Attribution (CC BY) license (http://creativecommons.org/licenses/by/4.0/).
Share and Cite
Dillon, B.; Doran, P.; Fuenmayor, E.; Healy, A.V.; Gately, N.M.; Major, I.; Lyons, J.G. The Influence of Low Shear Microbore Extrusion on the Properties of High Molecular Weight Poly(l-Lactic Acid) for Medical Tubing Applications. Polymers 2019, 11, 710. https://doi.org/10.3390/polym11040710
Dillon B, Doran P, Fuenmayor E, Healy AV, Gately NM, Major I, Lyons JG. The Influence of Low Shear Microbore Extrusion on the Properties of High Molecular Weight Poly(l-Lactic Acid) for Medical Tubing Applications. Polymers. 2019; 11(4):710. https://doi.org/10.3390/polym11040710
Chicago/Turabian StyleDillon, Brian, Patrick Doran, Evert Fuenmayor, Andrew V. Healy, Noel M. Gately, Ian Major, and John G. Lyons. 2019. "The Influence of Low Shear Microbore Extrusion on the Properties of High Molecular Weight Poly(l-Lactic Acid) for Medical Tubing Applications" Polymers 11, no. 4: 710. https://doi.org/10.3390/polym11040710