1. Introduction
The effect of applied stress on the martensitic transformation has been studied for almost one century, Scheil being one of the first researchers who worked on this topic in 1932 [
1]. In 1953, Patel and Cohen [
2] performed a series of experiments on iron–nickel alloys and proposed a physical criterion to quantify the effect. The criterion allows to calculate the change of the martensitic start temperature as a function of the stress applied to the material. In their study, Patel and Cohen showed that if both the application of a uniaxial compressive stress and a uniaxial tensile stress increase the temperature at which martensite forms, the increase due to the latter is more significant. Accordingly, they proposed a criterion for martensite formation based on the work of the shape strain associated with the transformation in the applied stress field. This criterion is now known as the
Patel–Cohen criterion. The shape strain considered is an invariant plane strain, where the invariant plane is the interface between martensite and austenite (habit plane). It can be calculated for any alloy by using the Phenomenological Theory of Martensite Crystallography (PTMC). The PTMC is probably the most famous crystallographic model for the martensitic phase transformation. It is the result of the work of two independent groups of researchers: Liebermann, Wechsler and Read in 1953 [
3], and Bowles and Mackenzie in 1954 [
4]. Both chose to model the transformation using linear algebra, but they came up with two apparently different expressions. A couple of years later, Christian showed that the two models were in fact equivalent [
5]. Expressed in the Bowles and Mackenzie version, the transformation is modelled using four different matrices, each of them accounting for a part of the transformation. The structural phase change and the orientation relationship are characterized respectively, by the Bain strain
[
6] and a rotation
, and their product
gives the
lattice strain. The shape change is described by the matrix
, which is the
shape strain. The last matrix
renders compatible the shape strain with the lattice strain. It is named the
lattice invariant shear. The PTMC stands then in a single equation
. After its publication, this model quickly became very popular and remains as such today. The PTMC calculations allow in particular to study variant selection using the predicted shape strain to evaluate the Patel–Cohen criterion. Such an approach is broadly accepted and commonly used [
7,
8]. However, some experiments indicate that this criterion is not appropriate to explain the phenomenon. As an example, Mishiro et al. applied a compressive stress just above the martensitic start temperature to induce variant selection in a low-carbon steel. They noted that the lattice strain
better accounts for the selection than the shape strain
[
9]. Chiba et al. reported a significant variant selection in Fe–Ni–C lenticular martensite formed after ausforming [
10]. They observed that four variants were preferentially formed in each parent grain. They applied the Patel–Cohen criterion using the residual stress to account for variant selection, but this analysis was not satisfactory. Indeed, the experimentally observed variants had their habit plane oriented rather perpendicularly to the compression direction and the resolved shear stress acting on them was very low. They concluded that variant selection was not related to the residual stress, but to the elongated morphology of the prior austenite grains. Such morphology favours the variants having a habit plane oriented parallel to the elongated direction as they induce less disturbance at the austenite gain boundary.
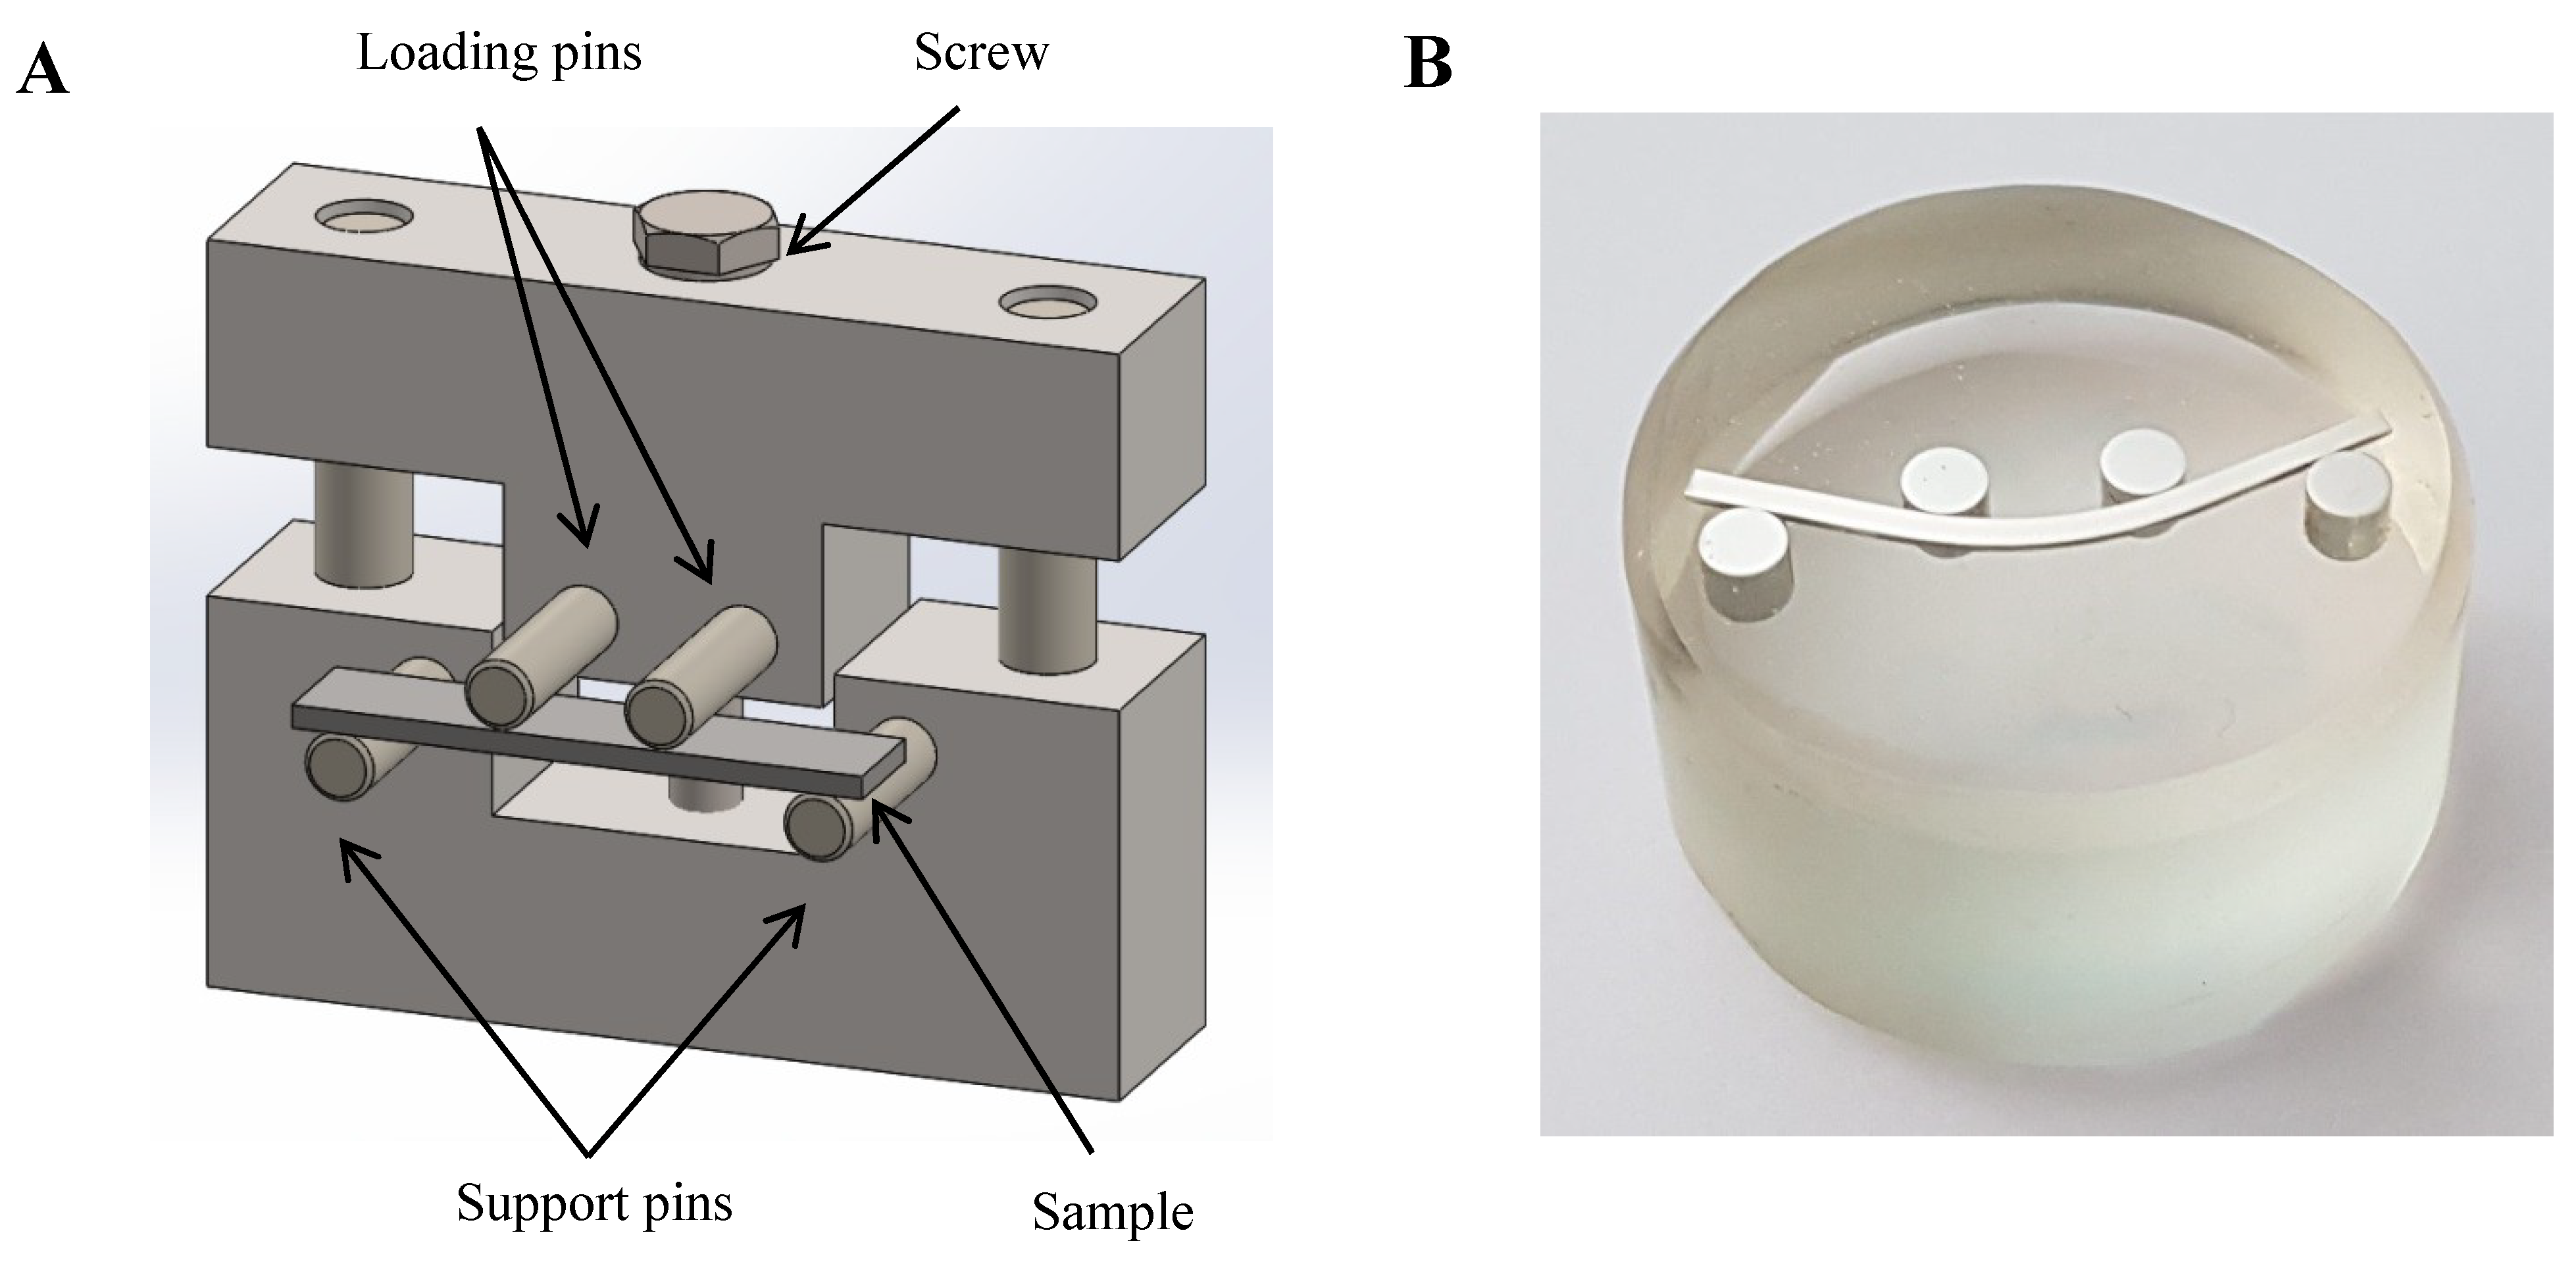
In the present study, we observe similar results in lenticular martensite formed in Fe-20wt%Ni-1.8wt%C under bending. A strong variant selection is measured, and the selection cannot be explained convincingly by the PTMC. The phenomenon is eventually accounted by an empirical crystallographic criterion.
4. Discussion
To address variant selection, two different PTMC calculations are performed using the
PTCLab open-source software [
13]. The first calculation considers an FCC-BCC transformation and the second an FCC-BCT transformation, including the tetragonality
observed in Fe–Ni–C alloys of close compositions [
12,
14]. The lattice parameters
Å and
Å, and
Å,
Å and
Å measured in similar alloys are the inputs for the calculations of the BCC and the BCT models, respectively [
15]. The simple shear version of the PTMC is used and the lattice invariant shear is chosen as suggested in the Bowles and Mackenzie original theory for the Fe–Ni–C martensite, namely a “twinning shear” of type
[
4]. The shape strain
and
and lattice strain
and
matrices are given below for the FCC-BCC and the FCC-BCT transformations, respectively:
In both cases, the orientation relationship predicted by the PTMC is between the Nishiyama–Wassermann OR and the Kurdjumov–Sachs OR. The calculated habit planes are
for the BCC model and
for the BCT. These habit planes are respectively at 10° and 5° from
and 6° and 9° from
, which are the typical habit planes observed in such alloys [
16]. Variant selection is studied using the Patel–Cohen criterion for martensite formation, as suggested in the literature [
7]. The variants selected are the ones that maximize the work
W of the shape strain
, respectively
, in the applied stress field
;
with
and
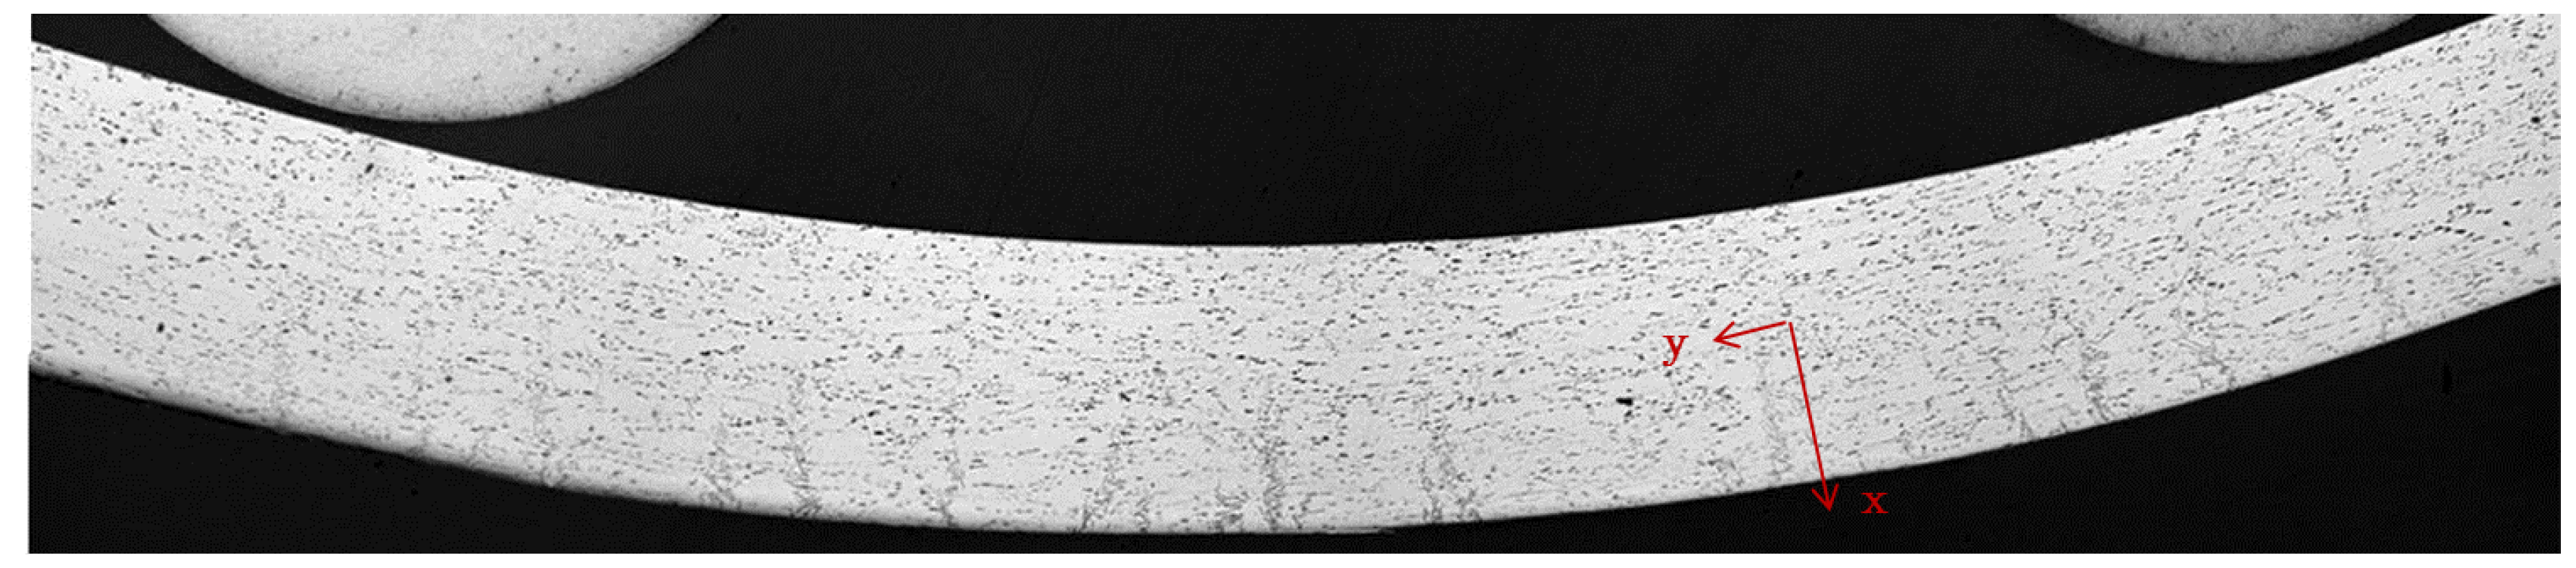
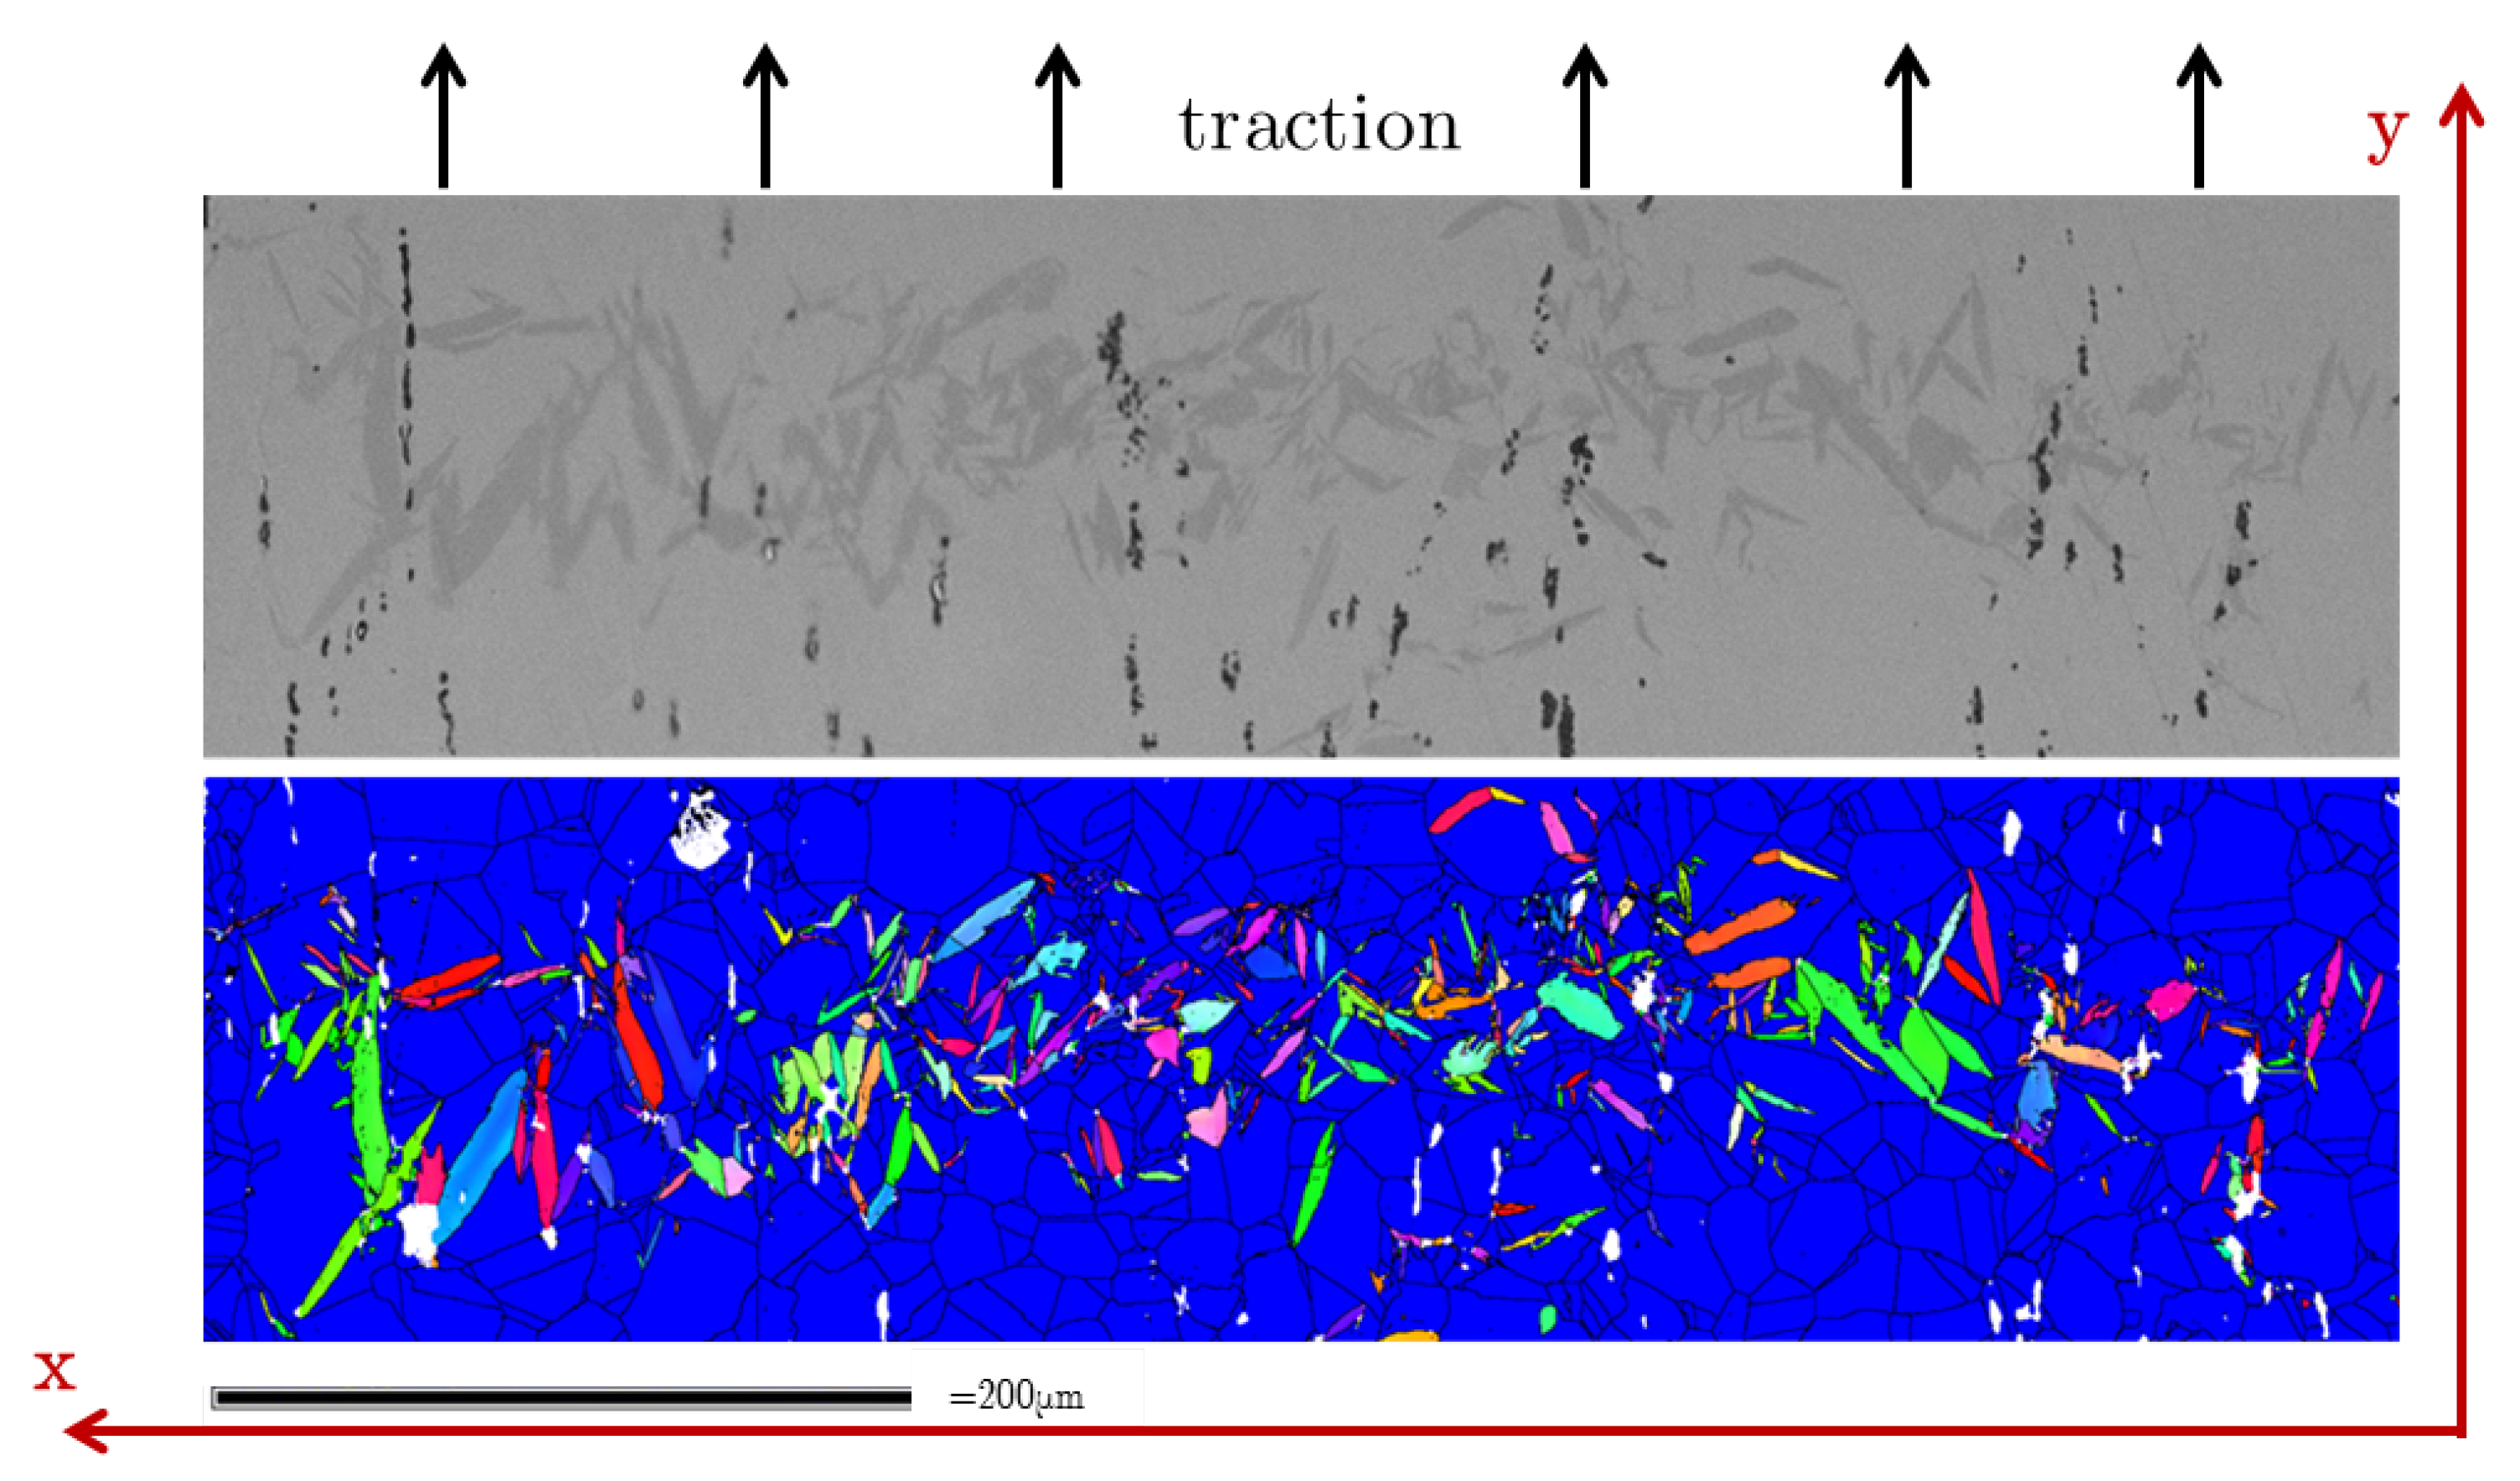
is the generalized stress tensor associated with the external loading. In four-point bending, the generalized stress tensor is reduced to a single non-zero entry, as the material is either in simple compression or simple traction. Here, we choose to orientate the specimen such that the traction/compression axis is aligned with the y-axis. Accordingly, the stress tensor is
if
. For each austenitic grain, the daughter variants are classified in respect with the value of their work. The variant exhibiting the maximal work is ranked first (1) and the one with the lowest work is ranked last (24). The calculations are performed using the
Mtex toolbox [
17].
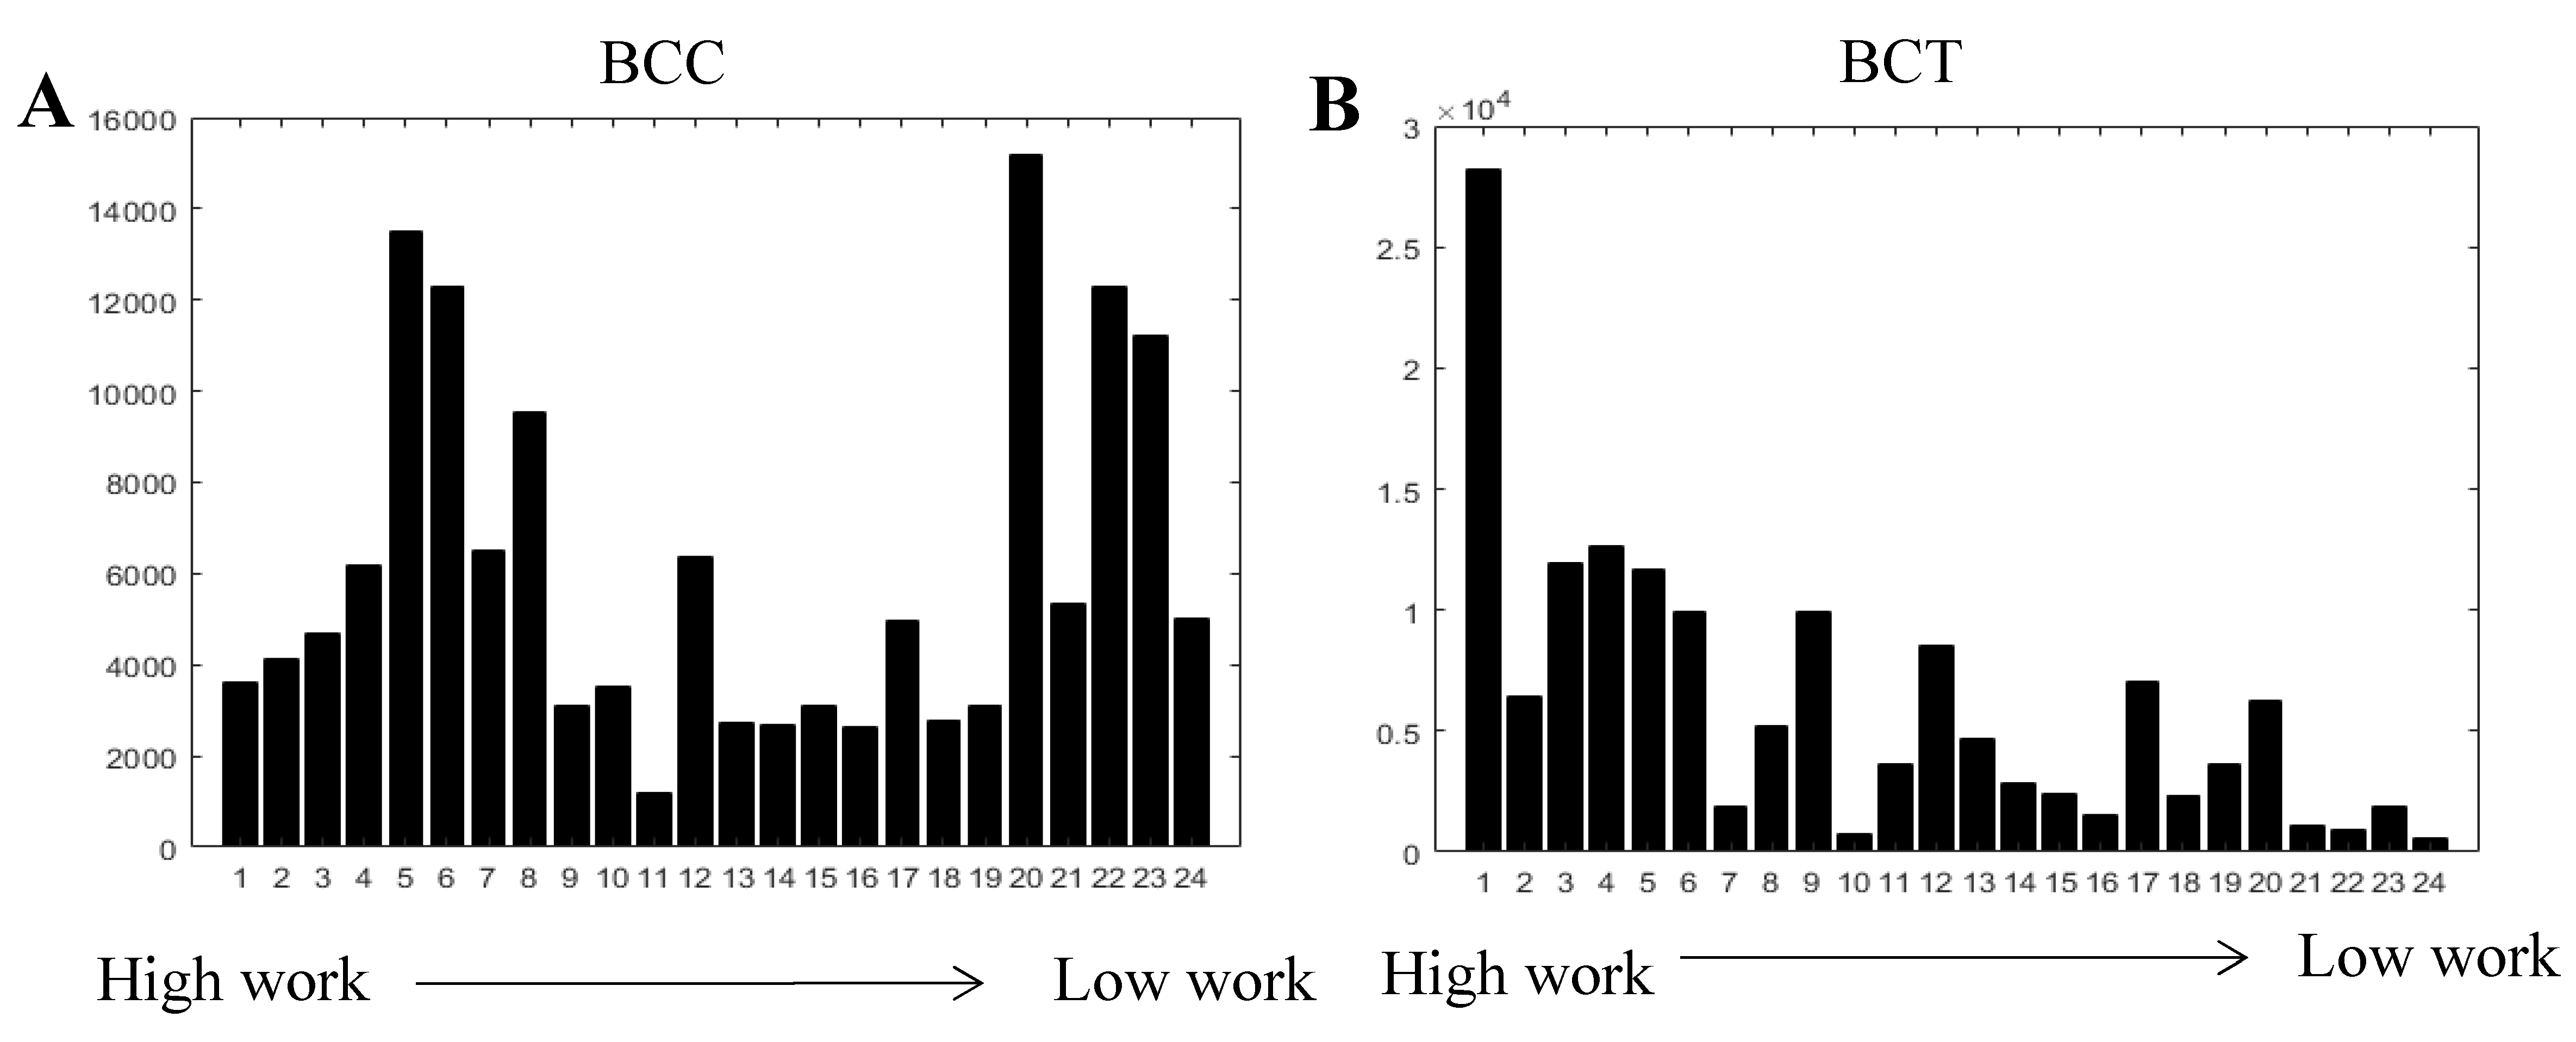
Figure 4A,B present the histograms of the variant occurrence in the EBSD map according to the proposed ranking for the BCC and the BCT models. The occurrence of a given variant is measured by counting the number of pixels associated with the variant.
With such a ranking, if the variant selection is based on the work of the shape strain, one expects that the variant with a small number, and thus exhibiting high work, would be observed more often than those associated with greater numbers. On this basis, it can be concluded that the present experiment does not exhibit a variant selection based on the work of the BCC shape strain, as there is no correlation between the ranking of the variants and their occurrence. On the contrary, the BCT model seems to correctly predict the variant selection, at least for the first variant, i.e., the one with the highest work. A verification of the habit plane prediction is then performed by studying an austenite grain selected from the EBSD map presented in
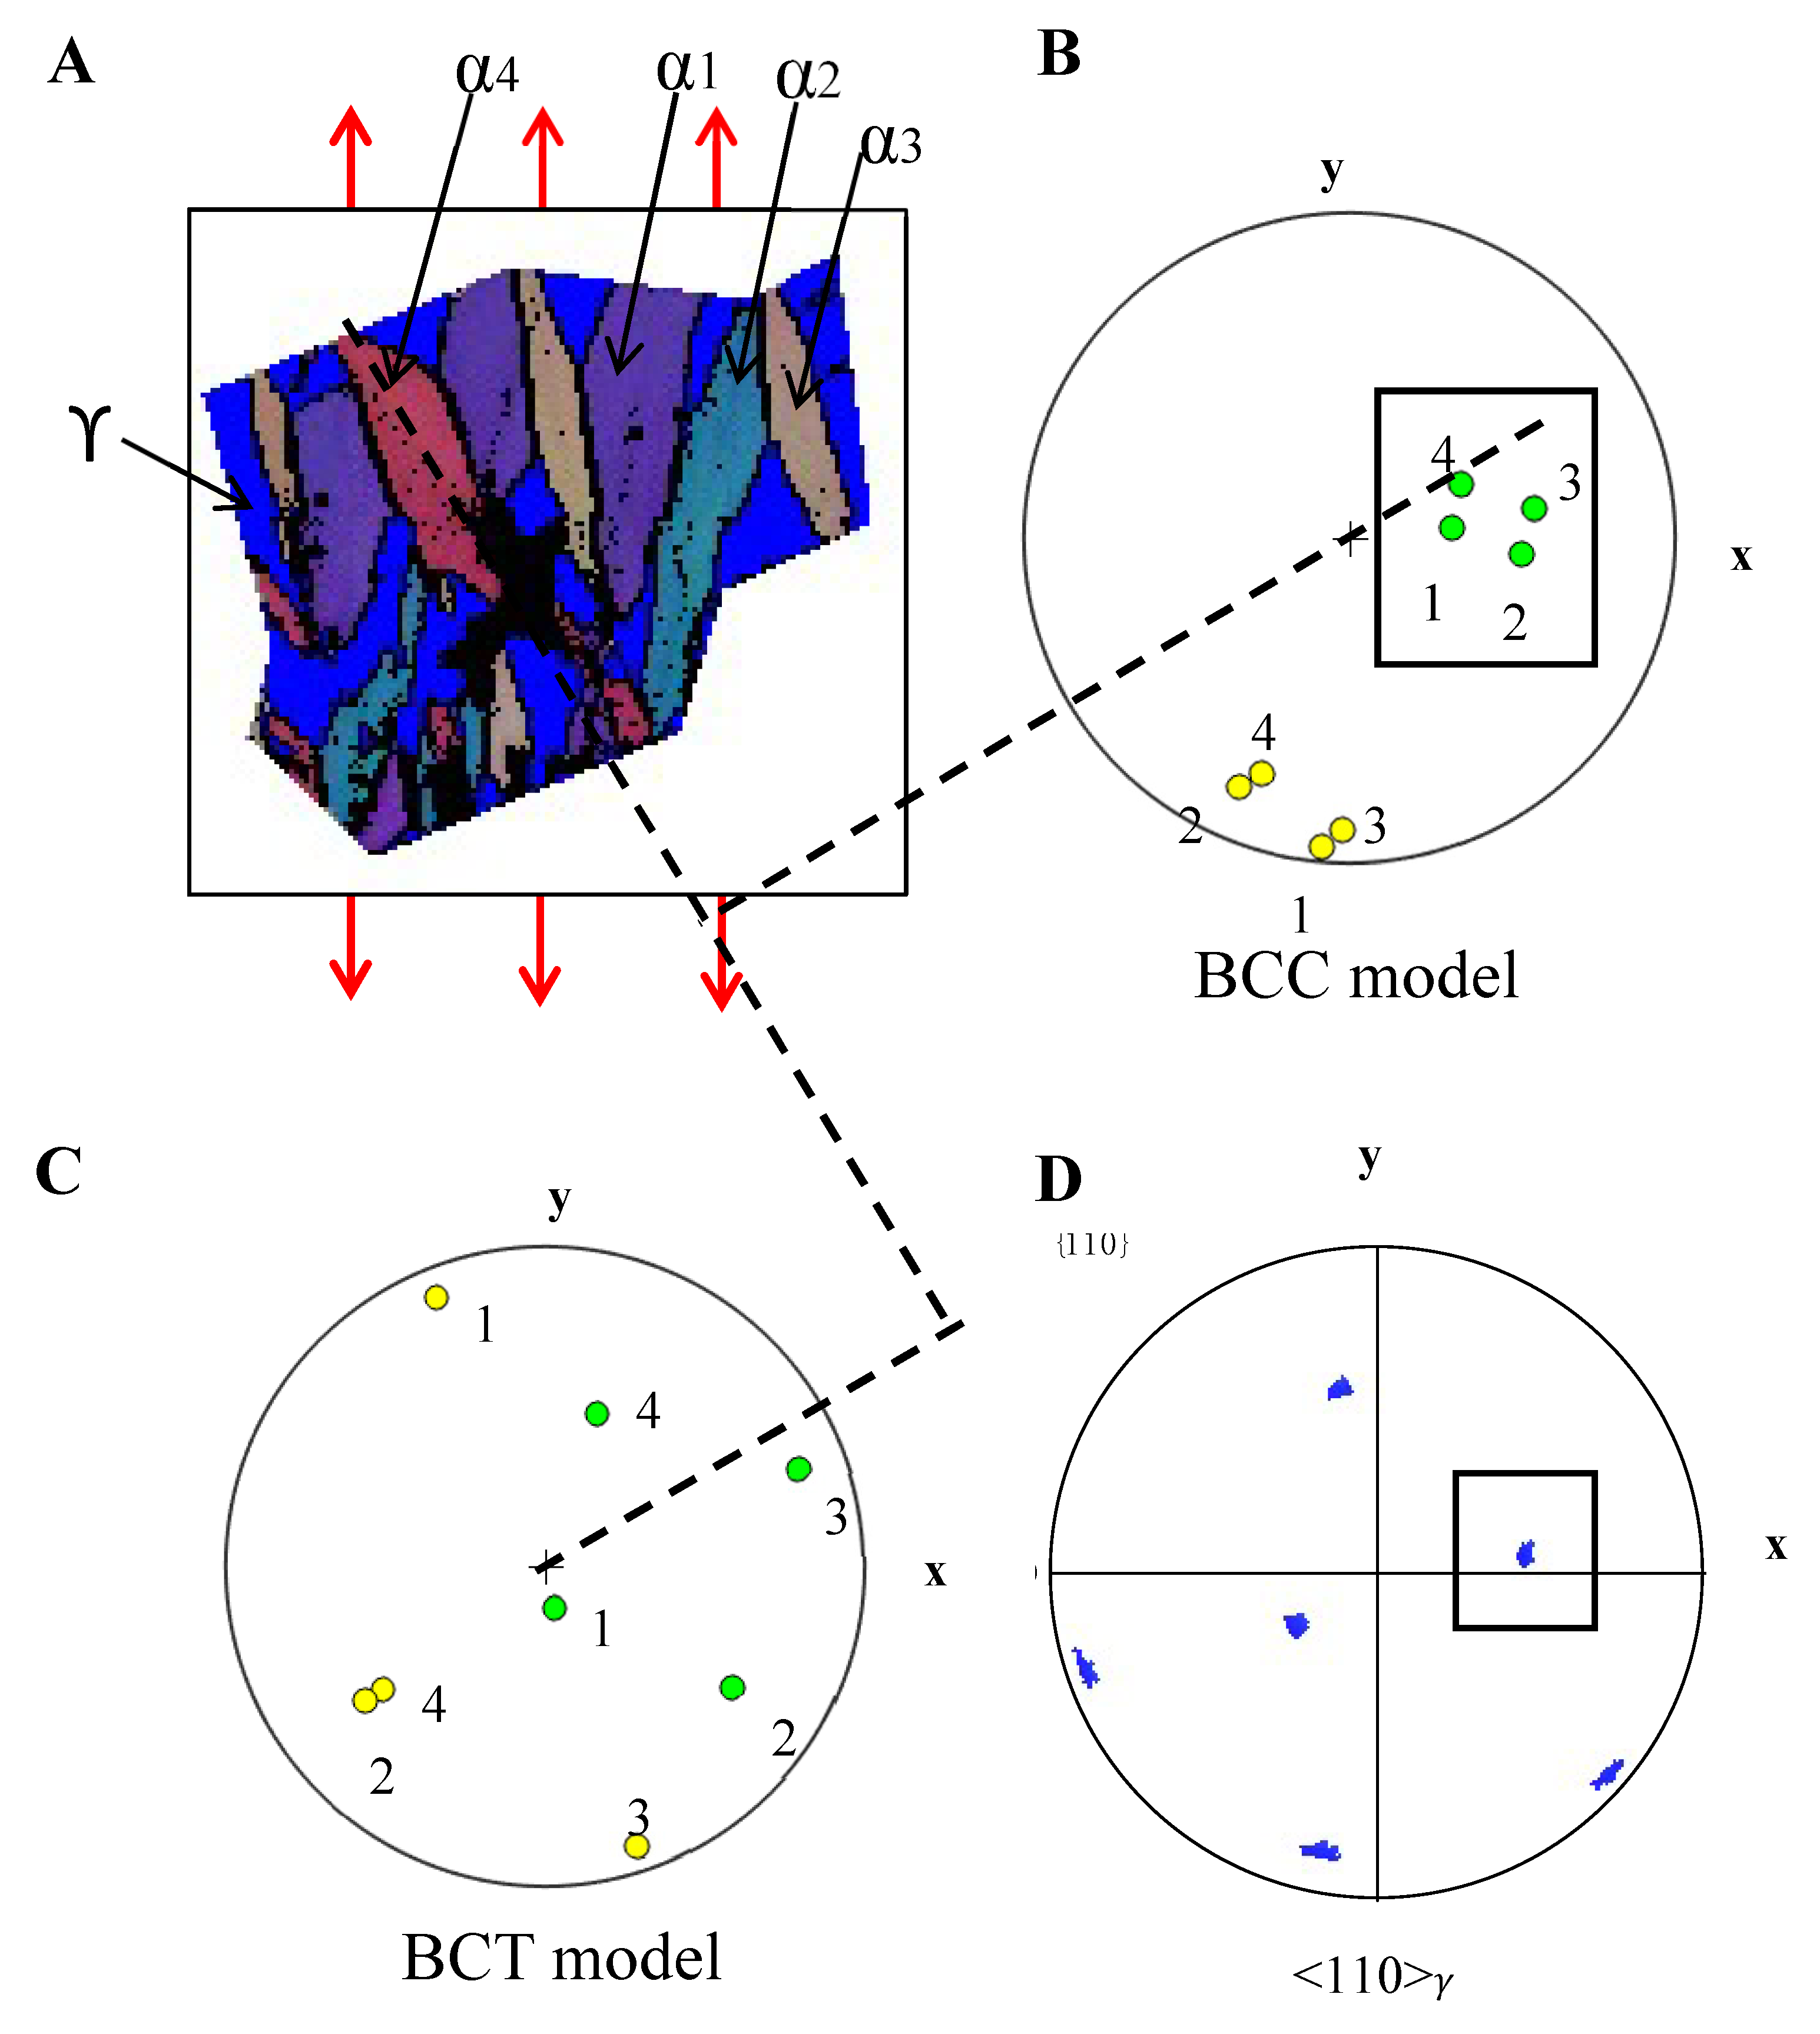
Figure 3. The grain is shown in
Figure 5A with the austenite in blue and the martensite in Euler color coding. In
Figure 5B,C respectively, the shape strains predicted by the PTMC calculations for the BCC and BCT models are shown for all four variants in
Figure 5A. The normals to the predicted habit planes are marked in green and the shear directions are marked in yellow. Numbers are given to each variant to help in associating them with their shape strain.
The midrib is considered as the habit plane of the martensite and a trace analysis is performed to verify the PTMC predictions. As an example, the normal to the habit plane of the red variant
is marked with dashed lines in
Figure 5. Our analysis clearly indicates that the BCT model does not predict the observed habit plane. This model which seemed to correctly account for variant selection is thus not satisfactory. On the contrary, the BCC model which fails to account for the variant selection seems to correctly predict the habit planes. From
Figure 5, we can see that selected habit planes almost contain the traction direction. Hence, the shear resolved on it is almost zero, which explains why the criterion based on the work of the shape strain associated with the BCC model is not able to account for the variant selection. To be exhaustive in our variant selection analysis, we also computed the work of the elastic part of the BCC shape strain using
, the work of the lattice strain
and the work of the lattice invariant shear
. Additionally, we considered the couplings of variants inside the same plate group by computing the work of the average strain resulting from different shape strains, as suggested by Okamoto et al. [
18]. None of these criteria accounts for the variant selection observed in the sample. These features are somewhat coherent with the results presented by Chiba et al. on variant selection in lenticular martensite [
10]. They also observed a lack of correlation between such energetic criteria and the measured variant selection. In agreement with our observations, they noted that the favoured variants have their habit planes normal to the compression axis, with low resolved shear acting on them. They concluded that the selection phenomenon was related to the elongated morphology of the prior austenite grain. In our sample, the parent austenite grains have a quite equiaxed geometry and Chiba et al.’s explanation is thus not applicable. It seems, however, that even though the thermomechanical treatments are different, the results of Chiba et al. have similarities with ours. As illustrated in
Figure 5A, we also observe that four variants form preferentially, these variants belonging to the same
plate group. The variant coupling in plate groups is frequently observed in lenticular martensite [
19,
20,
21]. The plate groups were originally observed by Bokros and Parker in Fe-31%Ni [
21]. They are defined in terms of habit plane orientation, as the group formed by the variants having their habit planes that cluster around a given
direction of the parent crystal. An illustration of such a cluster is proposed in
Figure 5D,B where squares are drawn to indicate the
direction and the associated habit plane normals, respectively. In terms of lattice orientation, the plate group is crystallographically defined in reference [
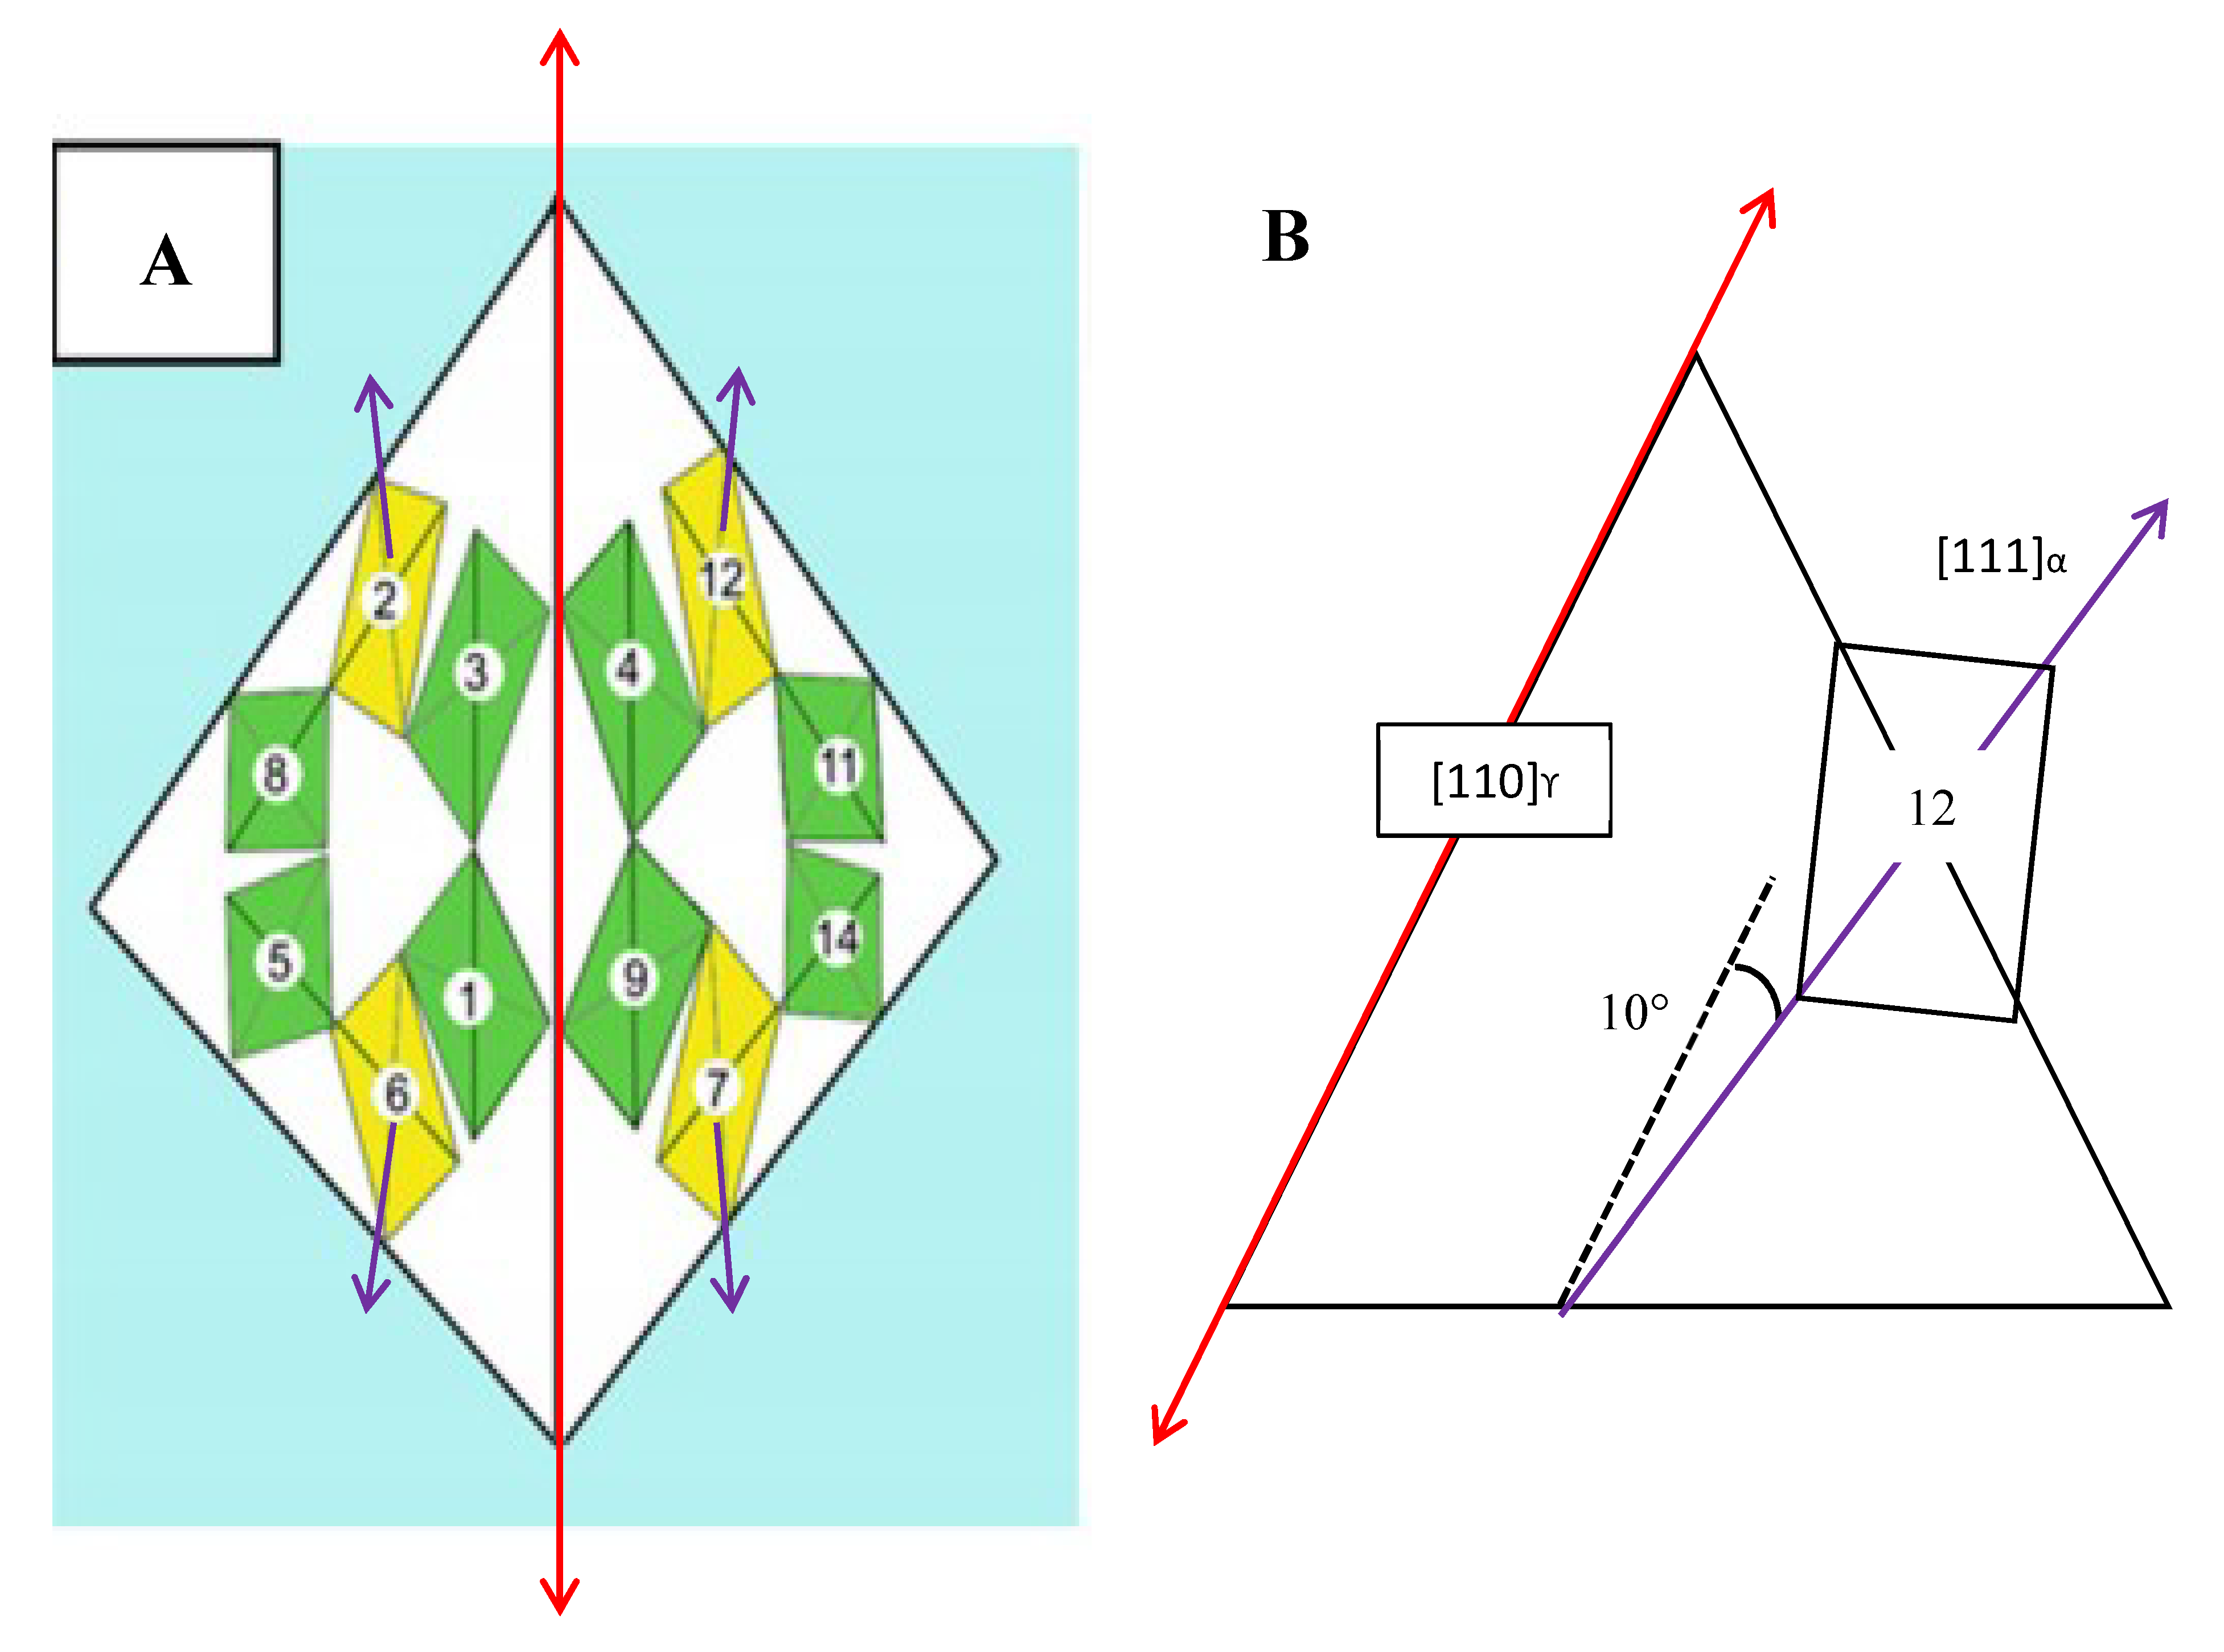
20] and illustrated with the yellow Kurdjumov–Sachs variants in
Figure 6A. This illustration is adapted from Figure 4E of ref. [
20]. The parent austenite is represented by two of the
planes, and the two others are not visible. The Kurdjumov–Sachs variants are illustrated by the green and yellow rectangles, representing the
. The yellow rectangles represent one of the six possible plate groups. According to this definition, the plate group can be defined as the variants that have their
that scatter about 10° from a
. It should be noted that the
direction that defines the plate group in terms of the habit plane or in terms of lattice orientation are different. In
Figure 6A,B, we marked in purple the considered
and in red the associated
.
In our experiment, a single plate group is formed preferentially in each parent grain. Based on this observation, we were able to express an empirical criterion to characterize the plate group that is favoured under traction. This criterion cannot distinguish the different variants inside the same group and thus does not treat the more severe selection that can be observed in some grains, where only one or two variants out of the four appear. Our criterion states that the selected plate group is the one formed by the four variantshaving their
that cluster about the
direction which is closest to the traction axis. In
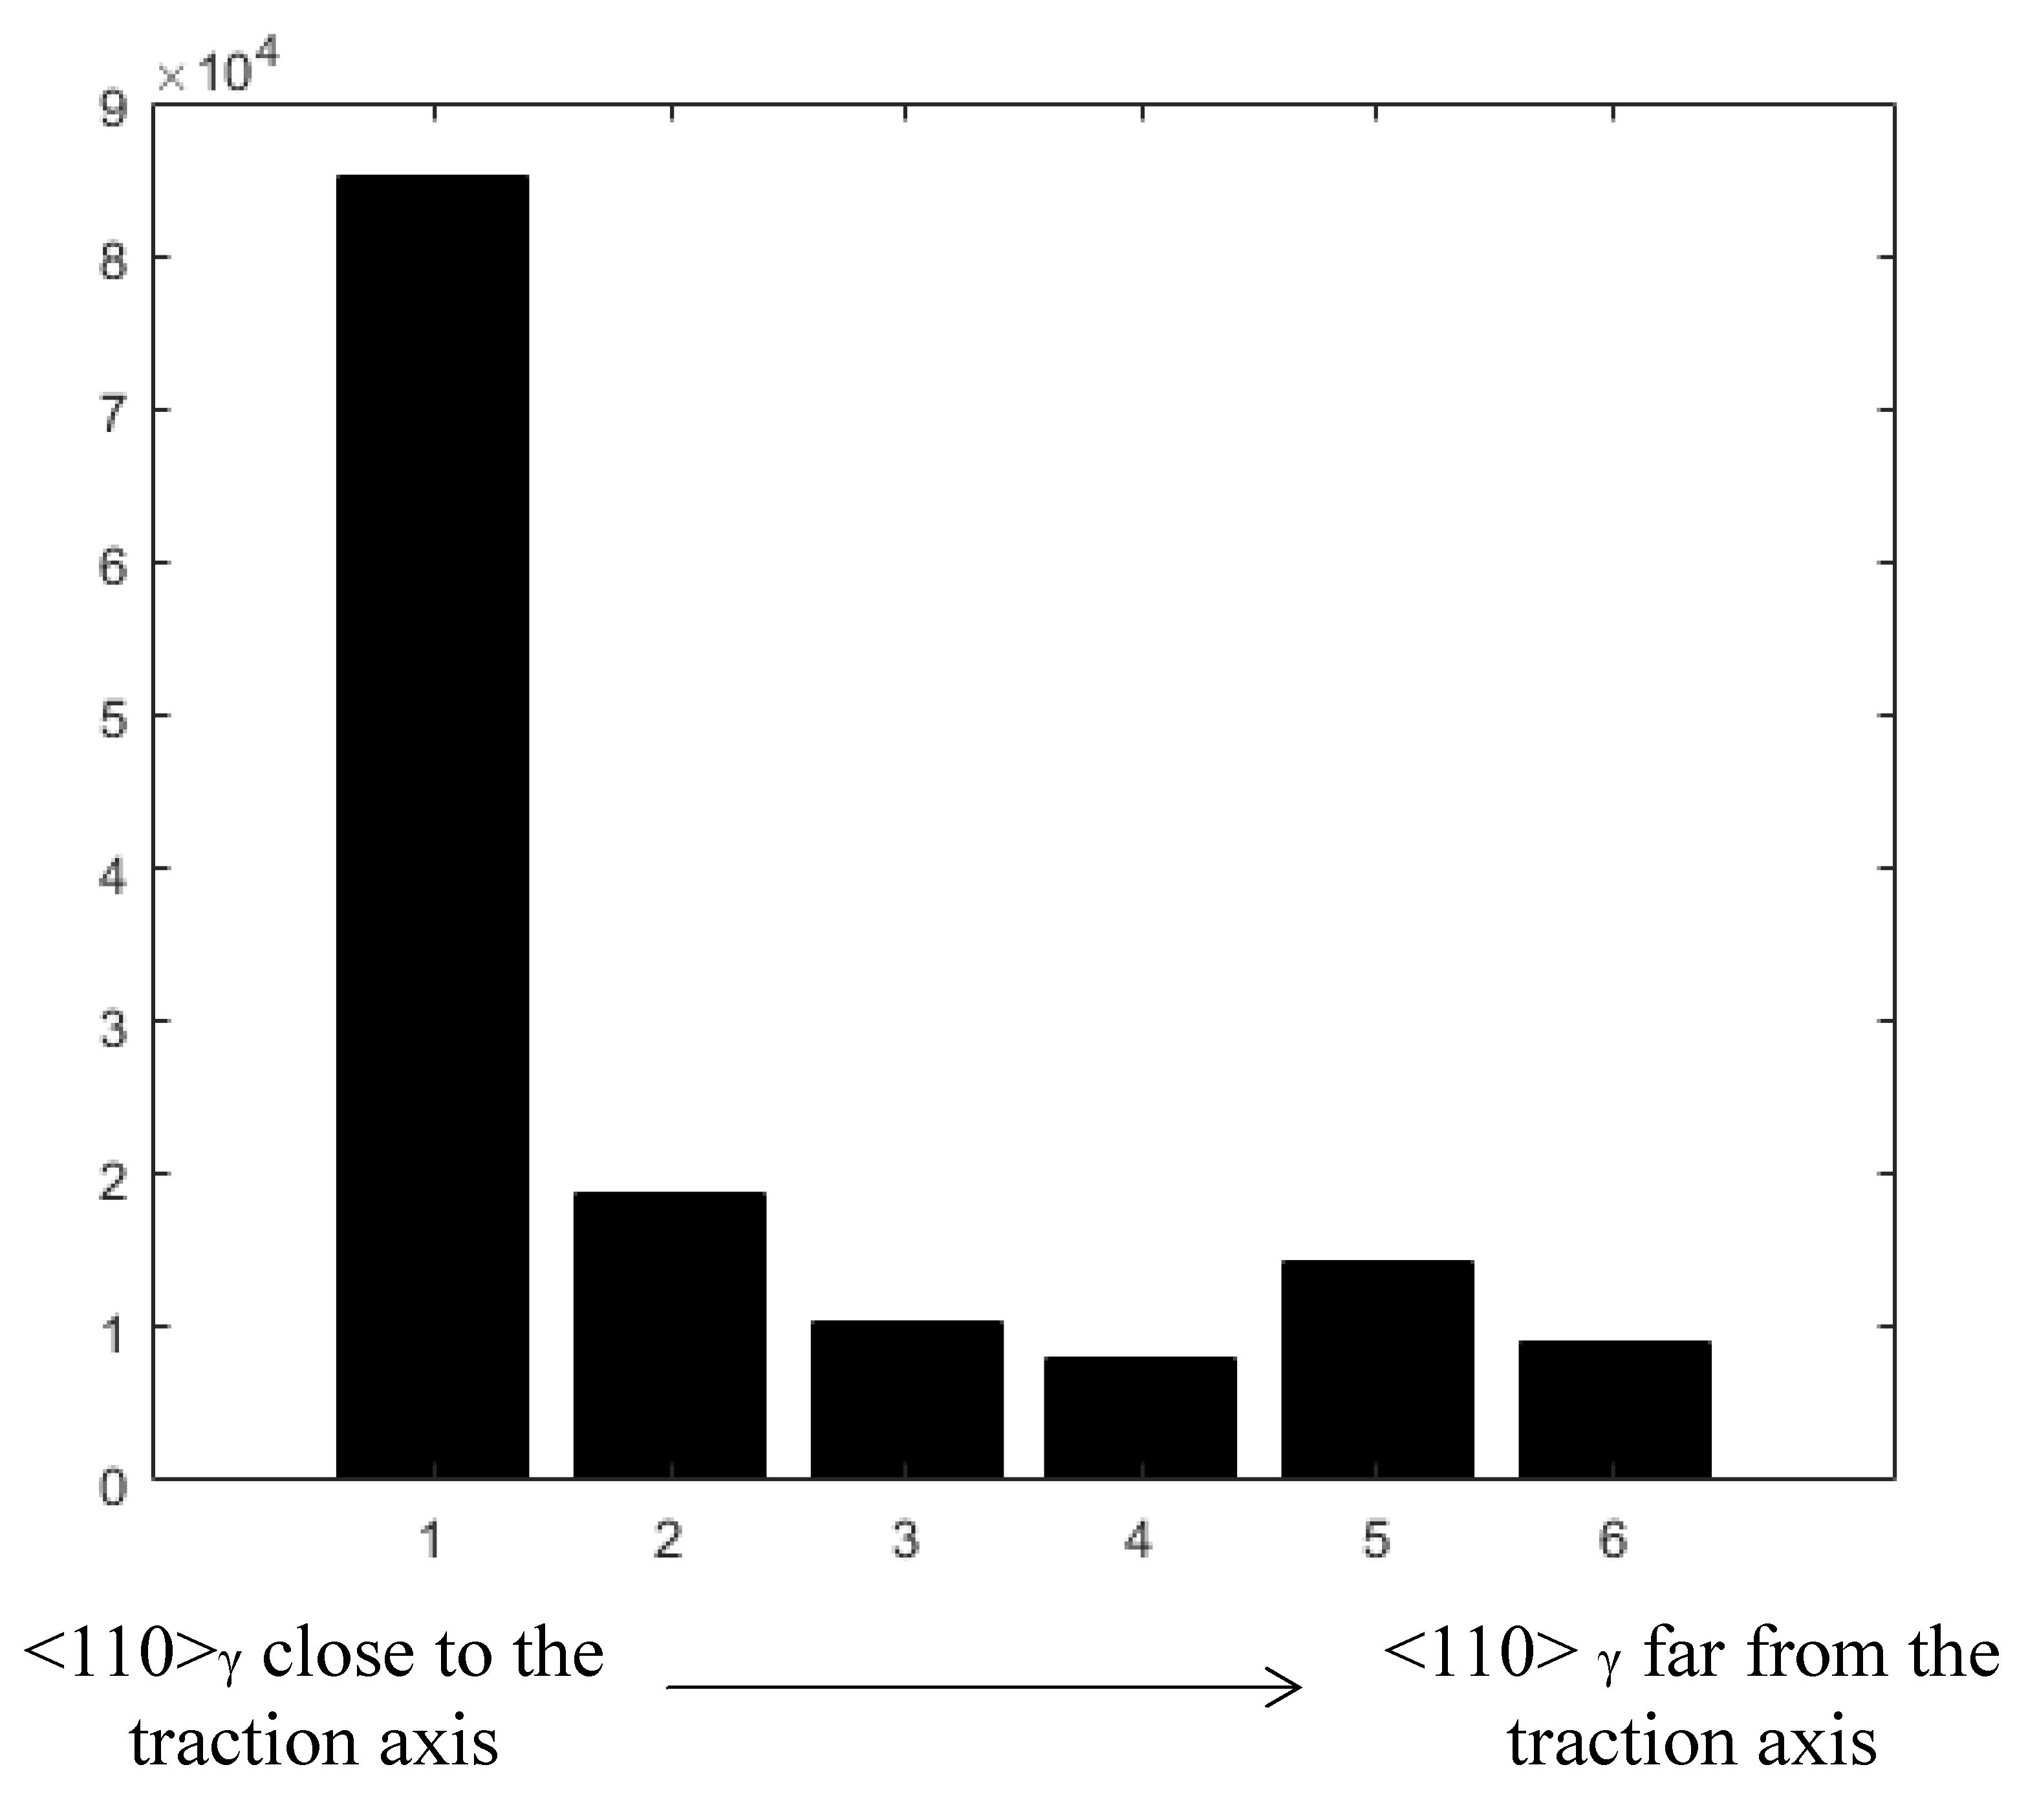
Figure 6A, the yellow plate group would be selected if the traction axis is close to the red arrows. Based on that empirical rule, we classify the plate groups as a function of the angle between the traction direction and the
direction associated with each plate group. The plate group with the lowest angle is ranked first (1) and the plate group with the largest angle is ranked last (6).
Figure 7 shows the histogram of variant occurrence according to the proposed criterion for the entire column of martensite shown in
Figure 3.
It appears that this criterion accounts very well for the variant selection observed in our sample.
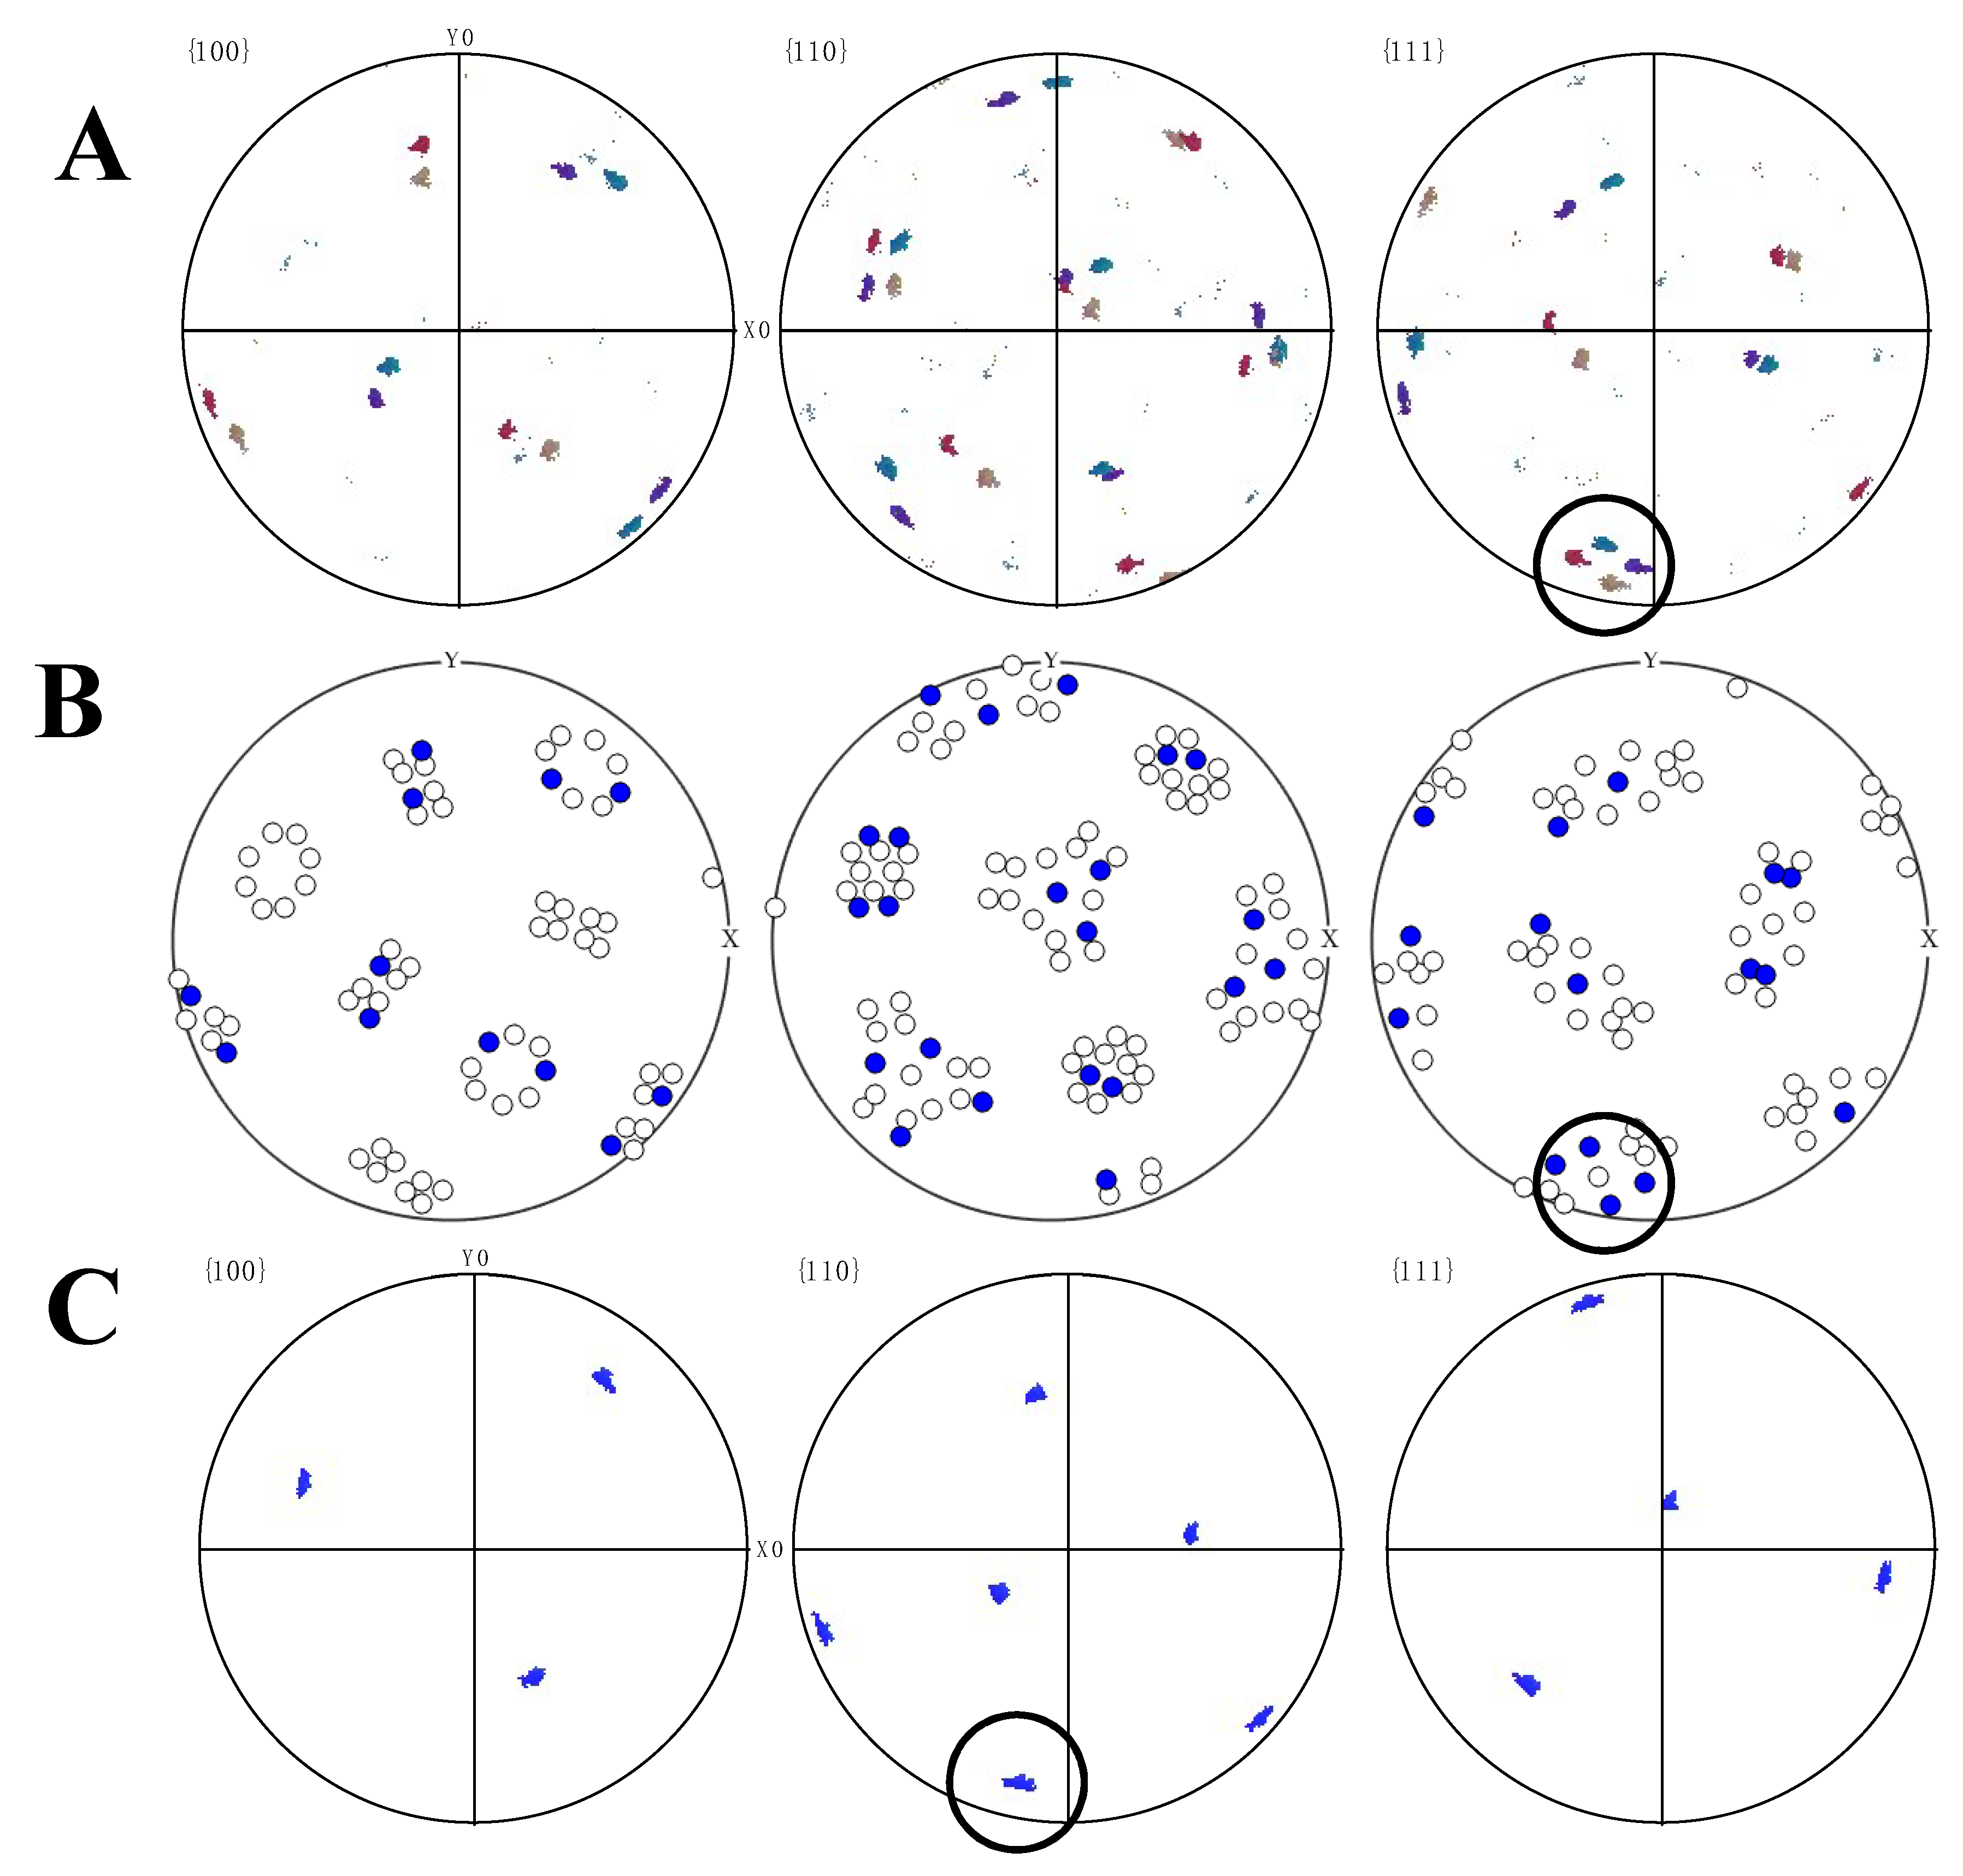
Figure 8 illustrates the selection phenomenon for the grain in
Figure 5A with the austenite in blue and the martensite in Euler color coding.
Figure 8A presents the experimental pole figures of the grain.
Figure 8B shows all Kurdjumov–Sachs variants with empty markers and the variants selected by our criterion with blue markers.
Figure 8C shows the orientation of the parent grain. We marked with a circle the
direction about which the
of the variants of the selected plate group clusters. The circle is reported on the martensite pole figures, in
Figure 8A,B, to indicate the
cluster.
It is quite puzzling to see that even though the BCC model prediction of the orientation relationship and the habit plane orientation are in fairly good agreement with the experimental measurements, the variant selection based on the work of the shape strain does not hold, and that on the contrary, the BCT model accounts for the variant selection but considering a shape strain which is not observed. It seems that the mechanism of the formation of lenticular martensite is not fully understood and that its current modeling is not able to depict all the physics involved in the transformation. The nature of the lattice invariant shear in particular seems to be controversial. The PTMC theory considers that a single shear occurs to accommodate the
martensite. However, Thomas observed that more than one lattice-invariant shear effectively acts in the accommodation process [
22].
In conclusion, variant selection has been studied in a Fe-20Ni-1.8C alloy transformed under bending. The transformation takes place only in the tensile part of the specimen and a significant variant selection is observed. It appears that a single plate group is formed preferentially in each grain. The variant selection is studied using the Patel–Cohen criterion with two different shape strains associated with the FCC-BCC and the FCC-BCT transformations. The shape strains are computed using PTMC. The BCT model is shown to correctly account for the variant selection, but the shape strain does not agree with the experimental data. In contrast, the BCC model predicts well the habit plane orientation, but is not able to explain the variant selection. These discrepancies between the experiment and PTMC predictions need to be further analyzed in order to better understand the mechanism of formation of the lenticular martensite and possibly explain what drives the observed variant selection. An empirical criterion, which captures the selection, is proposed. However, the physical explanation for such a criterion remains mysterious and more advanced characterization techniques to analyze the martensite substructure might be required to rationalize it.


