Article

Structural, Mechanical, and Dynamical Properties of Amorphous Li2CO3 from Molecular Dynamics Simulations

Department of Materials Science and Engineering, University of Utah, Salt Lake City, UT 84112, USA
*
Author to whom correspondence should be addressed.
Crystals 2018, 8(12), 473; https://doi.org/10.3390/cryst8120473
Submission received: 29 November 2018 / Revised: 15 December 2018 / Accepted: 15 December 2018 / Published: 18 December 2018
(This article belongs to the Special Issue New Materials for Li-Ion Batteries)

Abstract

:
Structural, mechanical, and transport properties of amorphous Li2CO3 were studied using molecular dynamics (MD) simulations and a hybrid MD-Monte Carlo (MC) scheme. A many-body polarizable force field (APPLE&P) was employed in all simulations. Dynamic and mechanical properties of Dilithium carbonate, Li2CO3, in amorphous liquid and glassy phases were calculated over a wide temperature range. At higher temperatures, both anion and cation diffusion coefficients showed similar temperature dependence. However, below the glass transition temperature (T < 450 K) the anions formed a glassy matrix, while Li+ continued to be mobile, showing decoupling of cation and anion diffusion. The conductivity of Li+ at room temperature was estimated to be on the order of 10−6 S/cm. Mechanical analysis revealed that at room temperature the amorphous phase had a shear modulus of about 8 GPa, which was high enough to suppress Li metal dendrite growth on an electrode surface.

Graphical Abstract

1. Introduction

Advancement in alternative energy technologies (solar, wind, etc.) and environmental concerns with utilization of limited fossil resources bring a growing demand for the improvement of energy storage for power grid, automotive, and portable electronic device applications [1]. Lithium ion (Li-ion) batteries have been widely used in many technologies, from hybrid and electrical vehicles, to laptops and cellphones [2]. These various applications of Li-ion batteries necessitate improvements in their safety, durability, and efficiency, which in turn depend on designing stable and efficient electrodes [3], requiring understanding of electrode-electrolyte interfaces to enable better engineering of these interfaces [4,5].
Dilithium carbonate, Li2CO3, is an ionic material which plays an important role in defining the performance in Li-ion batteries. It is one of the main components in the solid electrolyte interphase (SEI), an ionically conducting and electronically insulating layer typically formed on the anode surface via carbonate-based electrolyte decomposition during several initial charging cycles. SEI films are known to preserve the anode and improve its cycling properties by protecting the electrolyte from further redox decomposition reactions [2,3,6]. Yet, the SEI also creates additional resistance for Li-ion transport to/from anode during cycling. Typically, the SEIs formed on graphite, Si, and Li metal anodes in contact with carbonate-based electrolytes are thought to consist of inner and outer layers, in which the inner layer principally includes crystalline domains of the fully reduced compounds such as Li2CO3, Li2O, and LiF, [4,7,8] while the outer layer is comprised of much softer and more porous phases of dilithium alkyldicarbonates. Li2CO3 is one of the electrochemically stable and lowest energy products of carbonate based electrolytes’ reductive decomposition and has been reported to be in SEI films formed on both cathode and anode surfaces [9,10,11]. Although recent ab initio simulations demonstrated that thermodynamically it can be unstable at Li metal and Si interfaces [12], it is believed that the presence of Li2CO3 favors the formation of a more compact and ionically conductive SEI [13,14,15]. Iddir et al. believed that the formation of a thin layer of polydomain Li2CO3 on the anode with an appropriate orientation of crystalline domains would offer good ionic conductivity coupled with an improved stability of the battery [2].
In addition to SEI, Li2CO3 blends with other oxides have been considered as potential materials for solid electrolytes. For example, glassy amorphous films of Li2CO3-Li3BO3 formed by atomic layer deposition showed great potential as solid electrolytes demonstrating ionic conductivity on the order of 10-6 S/cm [16]. Sulaiman et al. [17] used sol-gel synthesis to fabricate Li2CO3-Al2O3 composite solid electrolytes in which substantial fraction of Li2CO3 was found to be in the amorphous glassy phase, even when the Li2CO3 comprised the majority of the composite.
Understanding correlations between the underlying molecular structure and Li+ ion transport in Li2CO3 solid phases can provide an important molecular scale insight helping in the design of more efficient solid electrolytes and SEIs. So far, there have only been a few theoretical studies of Li2CO3, most of which focused on the crystalline phase. Shi et al. used Density Functional Theory (DFT) calculations to compute defect thermodynamics associated with Li ion in monoclinic Li2CO3 system and analyzed diffusion of charge carriers at different voltages. They reported a possible diffusion mechanism for Li+ and its vacancies and suggested that the Li+ ion transport in crystalline Li2CO3 can be increased by increasing diffusion carriers’ concentration. According to this study, as the diffusion carriers’ concentration strongly depends on voltage, using different dopants for electrode materials may improve Li+ conductivity through Li2CO3 [1]. In another study done by Shang et al., where lattice dynamics and elastic properties of monoclinic Li2CO3 have been studied using DFT calculations, it was suggested that the reason why Li+ can easily diffuse in Li2CO3 is due to the weak bonding between Li+ and other atoms [18].
While the Li2CO3 crystal phase has been studied in several simulations, to the best of our knowledge, no theoretical studies of amorphous Li2CO3 have been reported. From the thermodynamic point of view, Li2CO3 should be crystalline at any temperatures relevant to Li-ion battery operation (Tm is ~870 K [19]) However, taking into account the kinetics of assembly of redox products at electrode surface, as well as polydomain structure of inner SEI [20], it is quite likely that some regions of amorphous Li2CO3 are also present, particularly in between the boundaries of crystalline domains. Moreover, as was demonstrated in recent works on solid electrolytes, glassy amorphous Li2CO3 with high ionic conductivity can be stabilized by adding relatively small fractions of other oxides and using atomic layer deposition or sol-gel synthesis. [17]
In this paper, by using classical atomistic molecular dynamics (MD) simulations and a polarizable force field, we specifically focus on the properties of amorphous Li2CO3 phase and predict structural, dynamical, and mechanical properties of Li2CO3 as a function of temperature.

2. Materials and Methods

In this study, we investigate model SEI systems of bulk amorphous Li2CO3 comprised of 600 carbonate anions and 1200 Li+ cations. Initially, each system was set up at low density with random distribution of ions in a large simulation cell (300 Å). Then it was condensed to approximately correct dimensions over 10ps at 900 K. An equilibration run for 5 ns was conducted at 900 K and atmospheric pressure using an NPT ensemble simulation to obtain the corresponding liquid phase. Ten independent configurations were created this way. Then, each system was cooled down to 300 K in 50 K steps followed by a 5 ns equilibration run at each temperature (i.e., 850, 800, 750, … 300 K). The coordinates of amorphous Li2CO3 systems equilibrated at 900, 600, and 300 K are given in the Supplementary Materials. Subsequently, each configuration (at each temperature) was further equilibrated over 10−70 ns in the NPT ensemble. Simulations have been conducted using a revised version of the many-body polarizable force field (APPLE&P) force field [21]. The APPLE&P force field has been extensively used to predict ion dynamics in various electrolytes and model SEI systems [22]. Ewald summation was employed for the long-range electrostatic interactions (charge−charge and charge−induced dipoles), with a cutoff radius of 12 Å for non-bonded van der Waals interactions and the real part of Ewald summation. Induced dipole−induced dipole interactions were computed directly in the cutoff range and screened out using a reaction field approach beyond the defined cutoff radius. Simulations were done with a multiple time step approach [23]: a 0.5 fs time step was used for integrating valence degrees of freedom (bonds, bends, and out-of-plane deformations), a 1.5 fs time step for consideration of short-range (within a 7 Å range cutoff) non-bonded interactions and dihedral potentials, and a 3 fs time step for integration of the remaining non-bonded interactions within the cutoff radius, calculation of induced dipoles and interactions between them, and the reciprocal part of the Ewald summation for electrostatic interactions. Production that ran between 15 and 100 ns were conducted depending on temperature.
To sample the mechanical properties of the investigated amorphous phase, we also conducted combined MD−MC simulations [24,25,26]. In this method, the system evolution was accomplished using standard MD simulations, with fixed shape/dimensions of the simulation box (i.e., in the NVT ensemble). This evolution was periodically (every 1ps) interrupted with a number of MC attempts (10) to arbitrarily perturb both the simulation cell lattice vector lengths and the angles between them, relative to the current simulation cell. If the MC attempt to change box dimension was accepted according to Metropolis criterion, it was followed by rescaling the center-of-mass projection of each molecule within the cell to fit the new cell geometry. In comparison to regular flexible-cell MD simulation in the NPT ensemble, this MD-MC approach provides a more effective sampling of distributions of simulation cell dimensions, as has been confirmed in our earlier studies of other SEI systems. [4,24]

3. Results and Discussion

3.1. Structural Properties

3.1.1. Density

For most amorphous systems, the cooling down from 900 K to lower temperatures and then the subsequent long-time sampling at those temperatures preserved the amorphous structure of the system. However, in two systems at 550 K, after run times of approximately 15 ns, we observed a formation of an ordered, crystal-like phase with an enthalpy about –2.2 kcal per mol of Li2CO3 lower than in the amorphous phase. The snapshots of amorphous and ordered phases at 550 K are shown in Figure 1. None of the system at 600 K and higher temperatures showed such behavior, nor did the systems at lower temperatures. This indicates that at 550 K there was the right balance between thermodynamic driving forces that favor the crystal phase at this temperature (experimental Tm for Li2CO3 was around 1000 K) and dynamic fluctuations in the system, creating favorable conditions for nucleation and growth of the crystal phase on time and length scales accessible to MD simulations. At higher temperatures, nuclei are forming but are not stable due to large thermodynamic fluctuations. Therefore, in order to create a stable crystal phase nucleus, it might require a larger system or longer simulation times. At lower temperatures, the dynamics becomes too slow for the system to generate nuclei on the time scale of simulation. It is important to note that simulations in which we initially started from a well-defined crystal cell observed a stable bulk crystal phase in the 300–800 K temperature range in the MD-MC simulations. Only T = 900 K showed melting on the time scale of our simulations.
Figure 2 shows the resulting temperature dependence of average (over 10 independent systems) density for the amorphous phase as obtained from MD simulations. At 550 K, we report two density values: one averaged from systems that remained amorphous during entire simulation and another from two systems that showed an apparent crystallization/ordering. These simulations were conducted in a conventional cubic simulation cell and therefore systems that crystallized would not be able to form the expected monoclinic structure in the entire system. Instead, a somewhat frustrated ordered phase with an average density of 2.5% higher than amorphous phase was formed, as illustrated in Figure 1c. In the amorphous liquid phase (>500 K), the density dependence is almost linear and in agreement (within 2%) with available experimental data above 1000 K [27,28]. However, as the temperature decreases (below 500 K), we observe a change in the slope (decreasing) for the density-temperature dependence. Such behavior is consistent with the glass transition of the amorphous phase with an approximate glass transition temperature (Tg) of 470 K. Moreover, at 300 K, the density of glassy state predicted by MD simulations is about 1% denser than the reported experimental value for the crystal phase [29]. However, this is consistent with the systematic overestimation of density from simulations seen at higher temperatures. If one assumes the same temperature dependence for amorphous phase as obtained from simulations for experimental data, then expected glassy density would be about 1% lower than in the crystal (see dotted line extrapolating experimental liquid densities to lower temperatures in Figure 2).

3.1.2. Radial Distribution Functions

Next, we analyzed the Li+ cation coordination by calculating the radial distribution functions ((g(r)) at temperatures ranging between 500 and 700 K. Figure 3a shows Li+ and carbonate oxygen and carbon atoms of CO32− correlations. There was a sharp peak at about 2.0 Å in the gLi−O(r), showing a strong preference for the Li-O interaction, which was expected because of a relatively high negative partial charge (~–0.85) on carbonate oxygen atoms. The minimum of the mentioned peak (2.8 Å) was used to define the first coordination shell of Li+. The Li−Li pair correlation shows a peak at 3 Å. The values of the g(r) peaks and their location for Li-Li, Li-O, and Li-C g(r)s agree with previous works [30,31,32]. The g(r)s obtained at various temperatures indicate that the pair correlations are unaffected by the temperature, showing that the local coordination of a Li+ is mostly independent of temperature. Figure 3b shows the corresponding coordination numbers.

3.2. Dynamical Properties

Next, we analyzed dynamic and transport properties in our systems, mainly focusing on the Li+ transport.

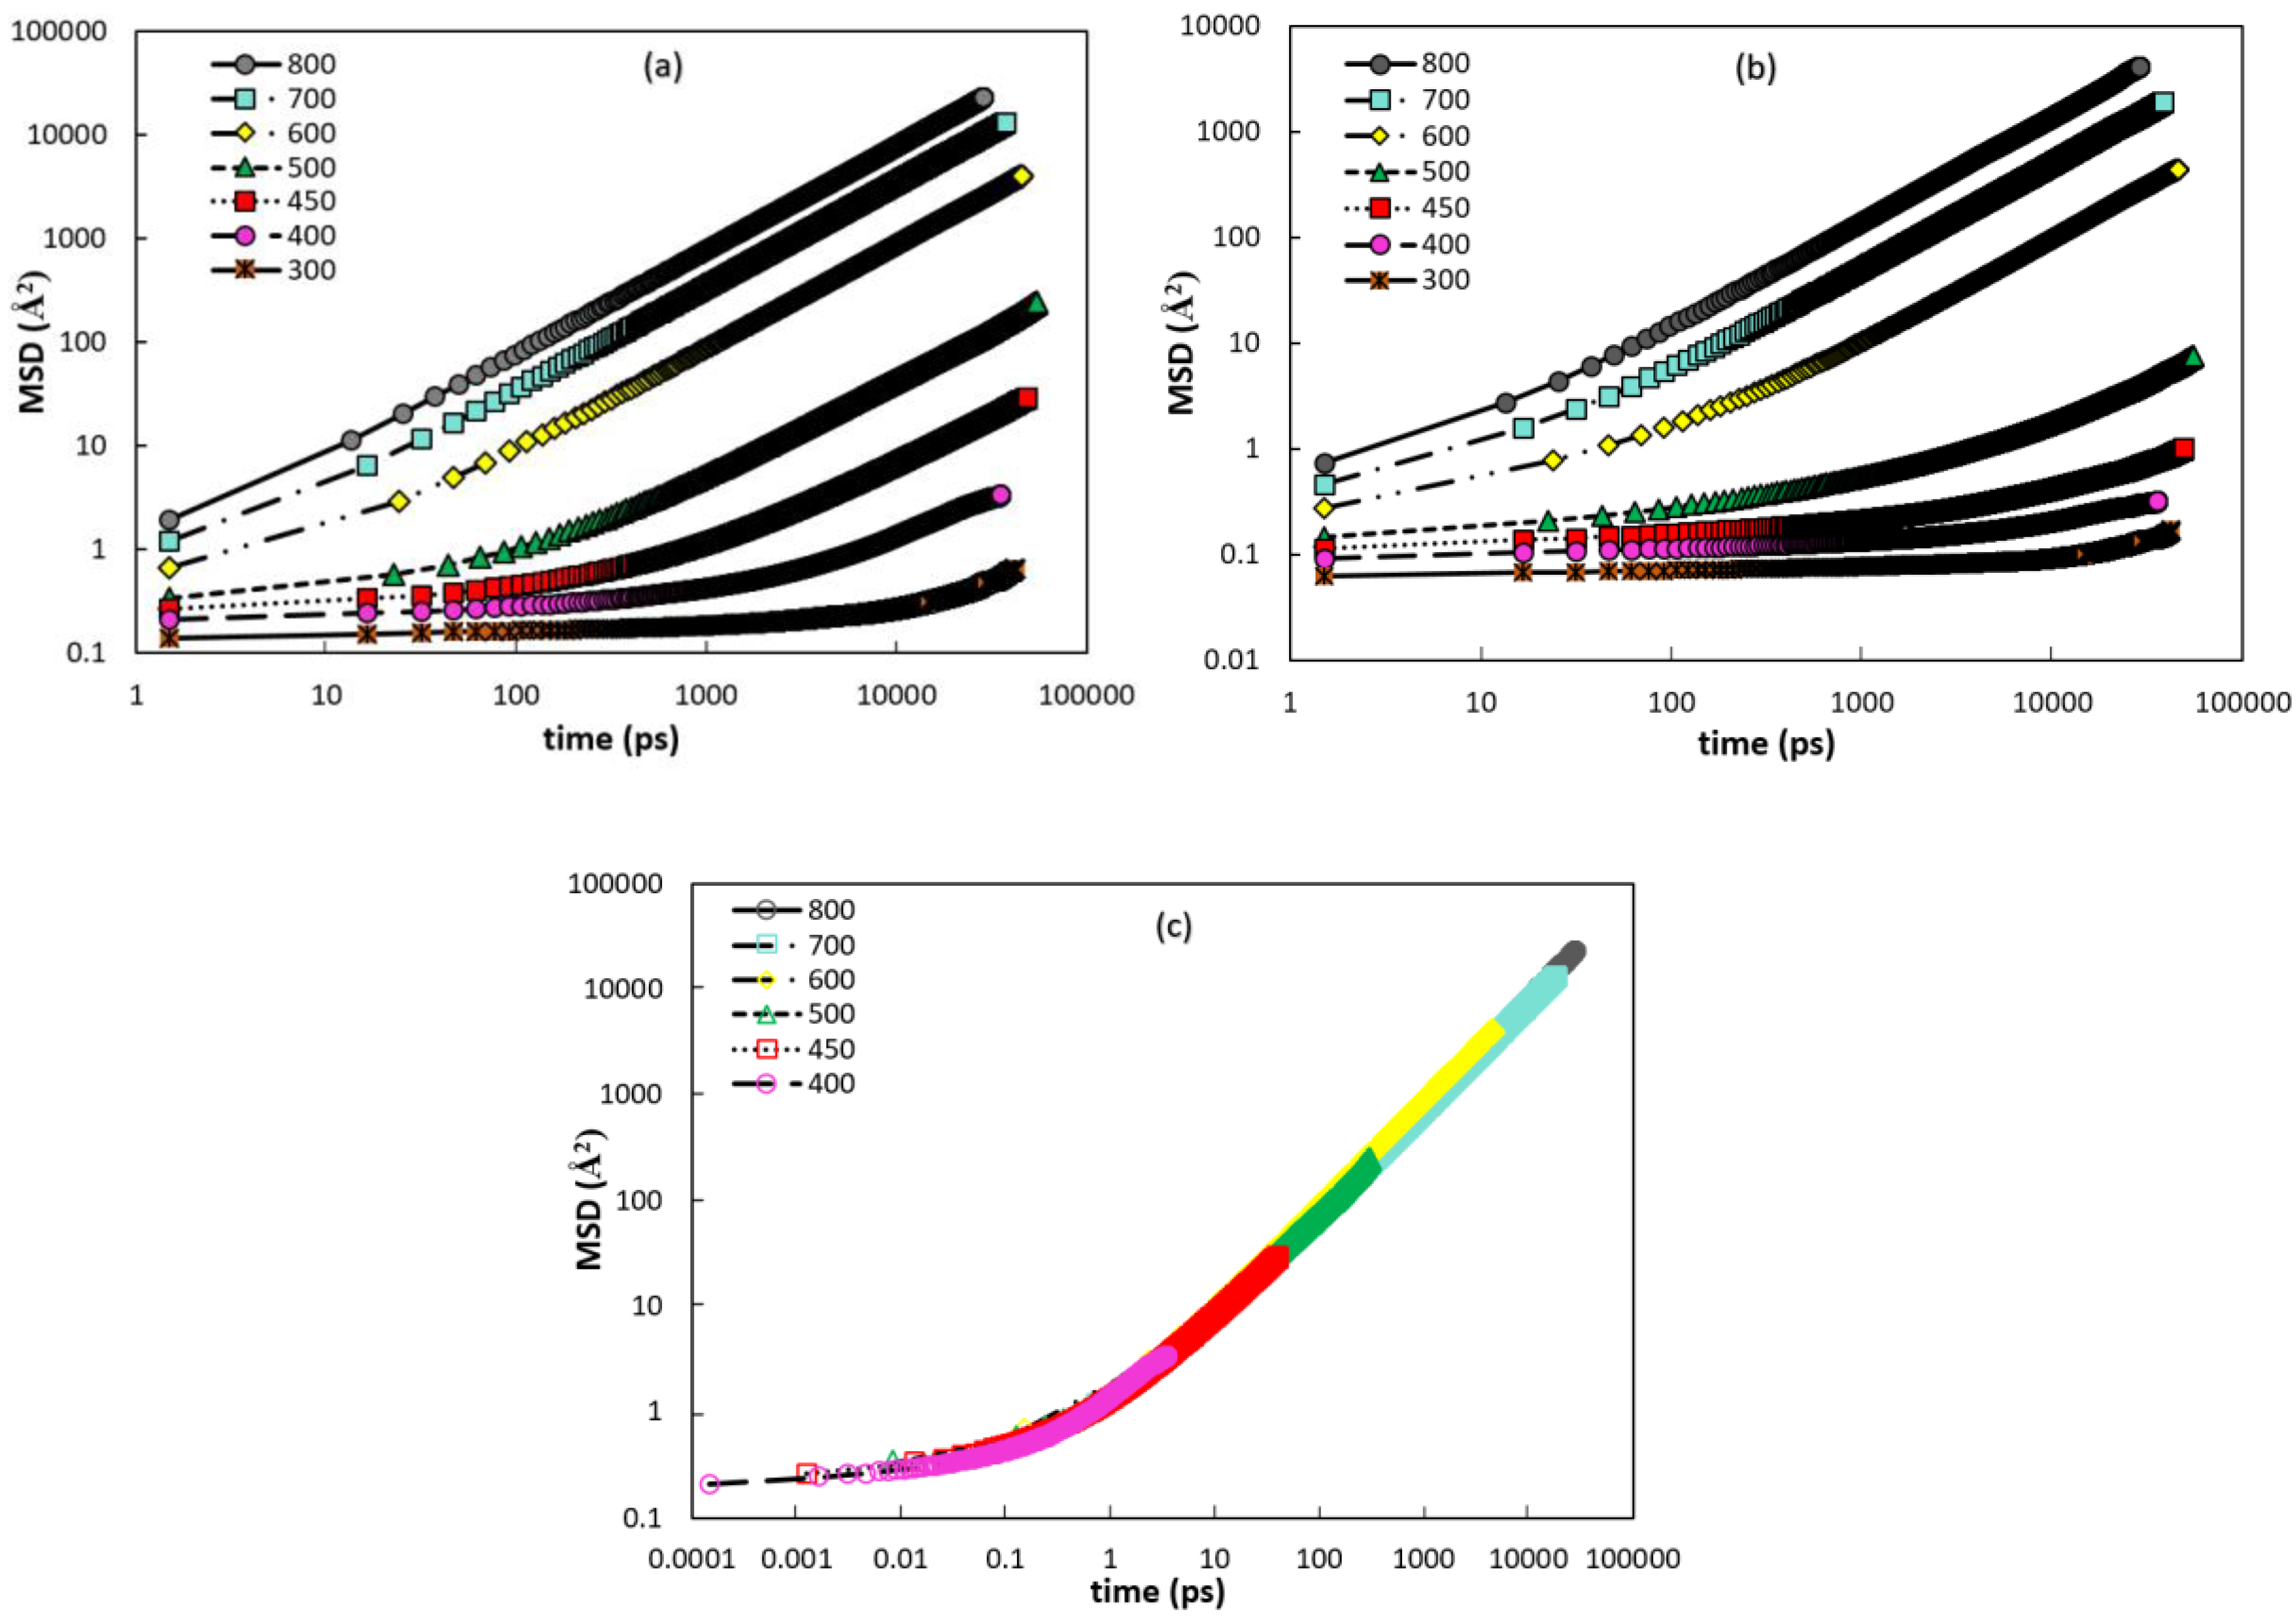
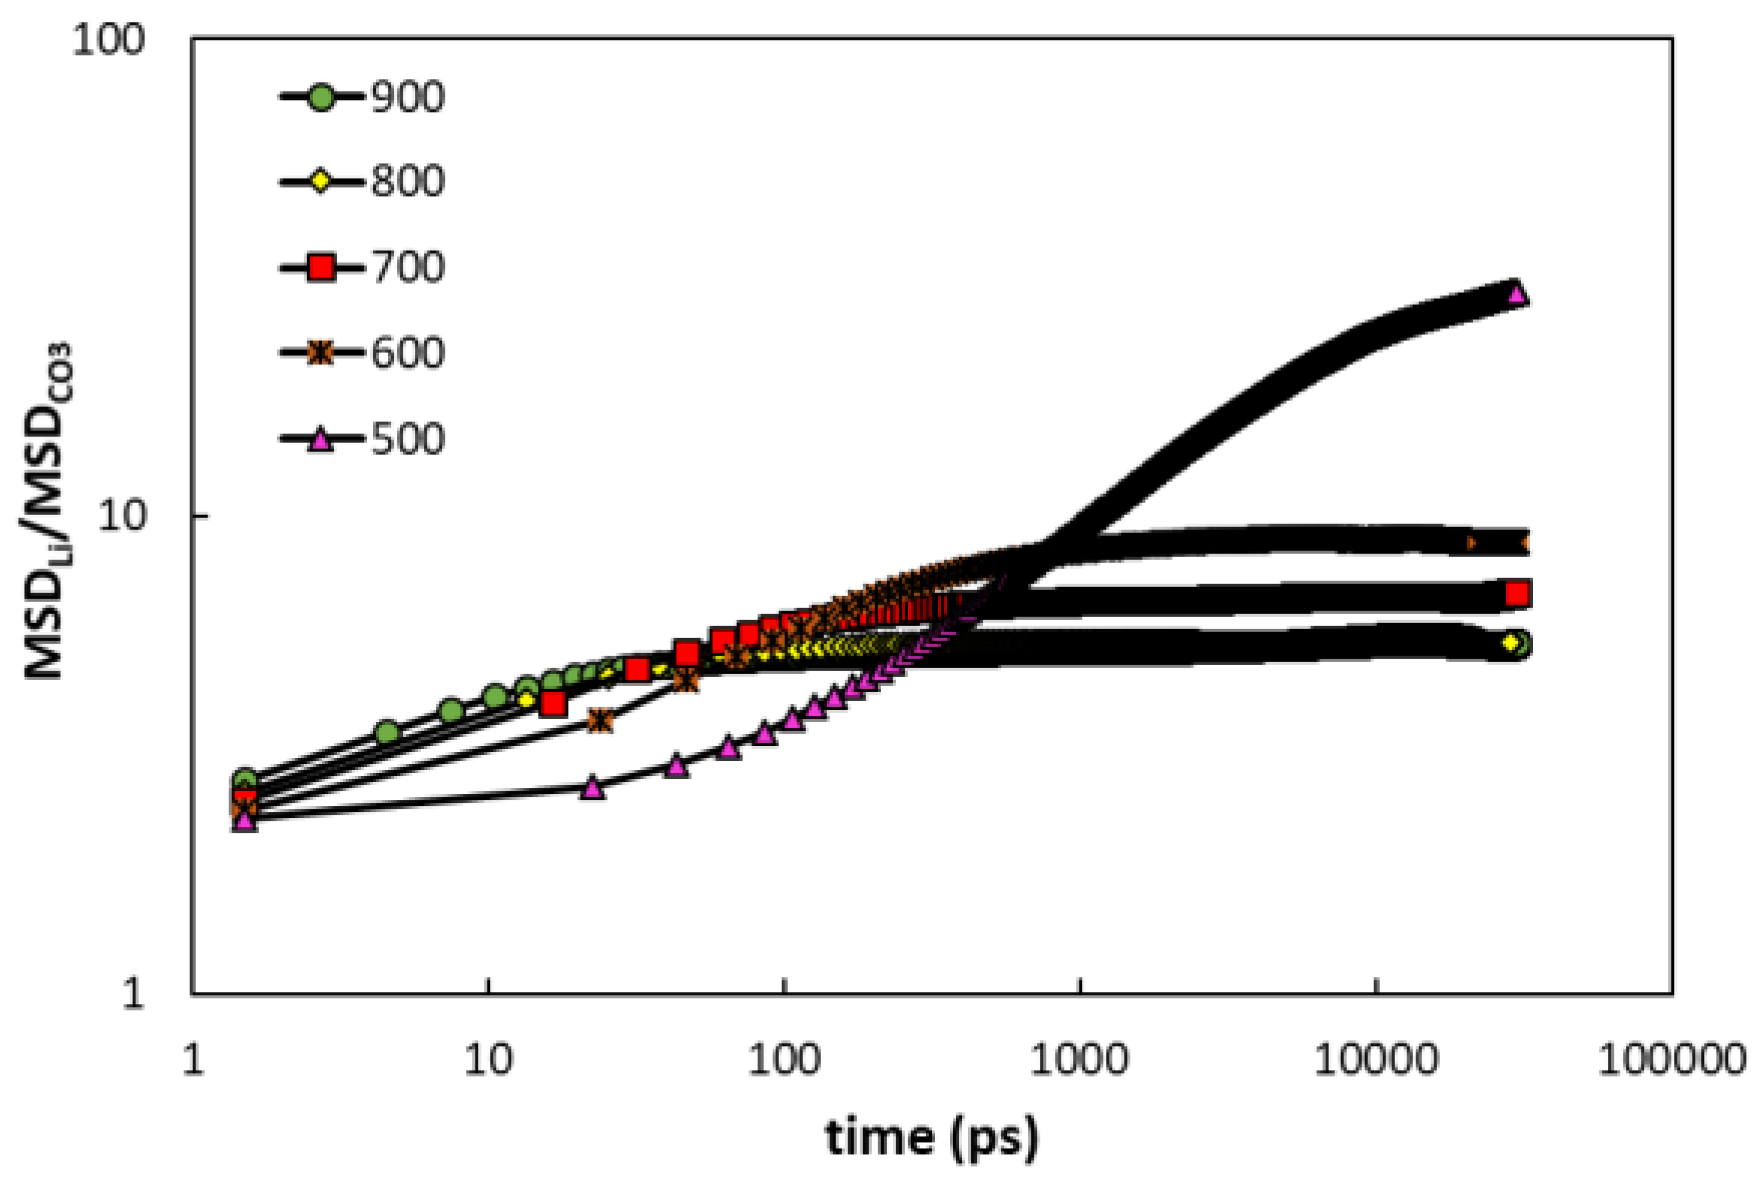
3.2.1. Mean Squared Displacements

First, we considered the mean squared displacements (MSDs) analysis of Li+ and CO32− ions as shown in Figure 4a,b, respectively. At higher temperatures, both ions showed large displacements on a time scale of a few nanoseconds, although the mobility of CO32− anions was about a factor of 8 smaller than that of Li+. The MSD(t) clearly reach the expected linear dependence and hence the standard Einstein relation can be used to reliably extract self-diffusion coefficients (Di) of the species. However, at lower temperatures (<500 K), statistics were not sufficient for MSD(t) to reach a diffusive regime, precluding direct application of the Einstein relation for reliable extractions of Di. To estimate Di at these lower temperatures, we used a scaling approach described previously [19]. In this approach, we assumed that MSD(t) for each species at different temperatures could be superimposed onto each other by scaling the time axis. Then the Di could be estimated using this scaling factor ai(T) and the converged values of self-diffusion coefficient at higher temperature (e.g., 800 K):
Di (T) = Di (at 800 K)/ai(T)
This approach is illustrated in Figure 4c where each MSD(t) curve from Figure 4a was shifted along the time axis to match the MSD = 1 Å2 value at T = 800 K. As can be seen, the assumed time−temperature superposition principle works very well in this system.
The examination of the MSD ratio of cation and anion in the amorphous systems (Figure 5) shows that at high temperatures (>600) the ratio saturates around factor of 8–9 at long-times, indicating a constant scaling factor of Li mobility versus anion mobility in the liquid phase. As the temperature decreases further, we can see that the long-time ratio increases indicating further separation between Li+ and CO32− mobilities.

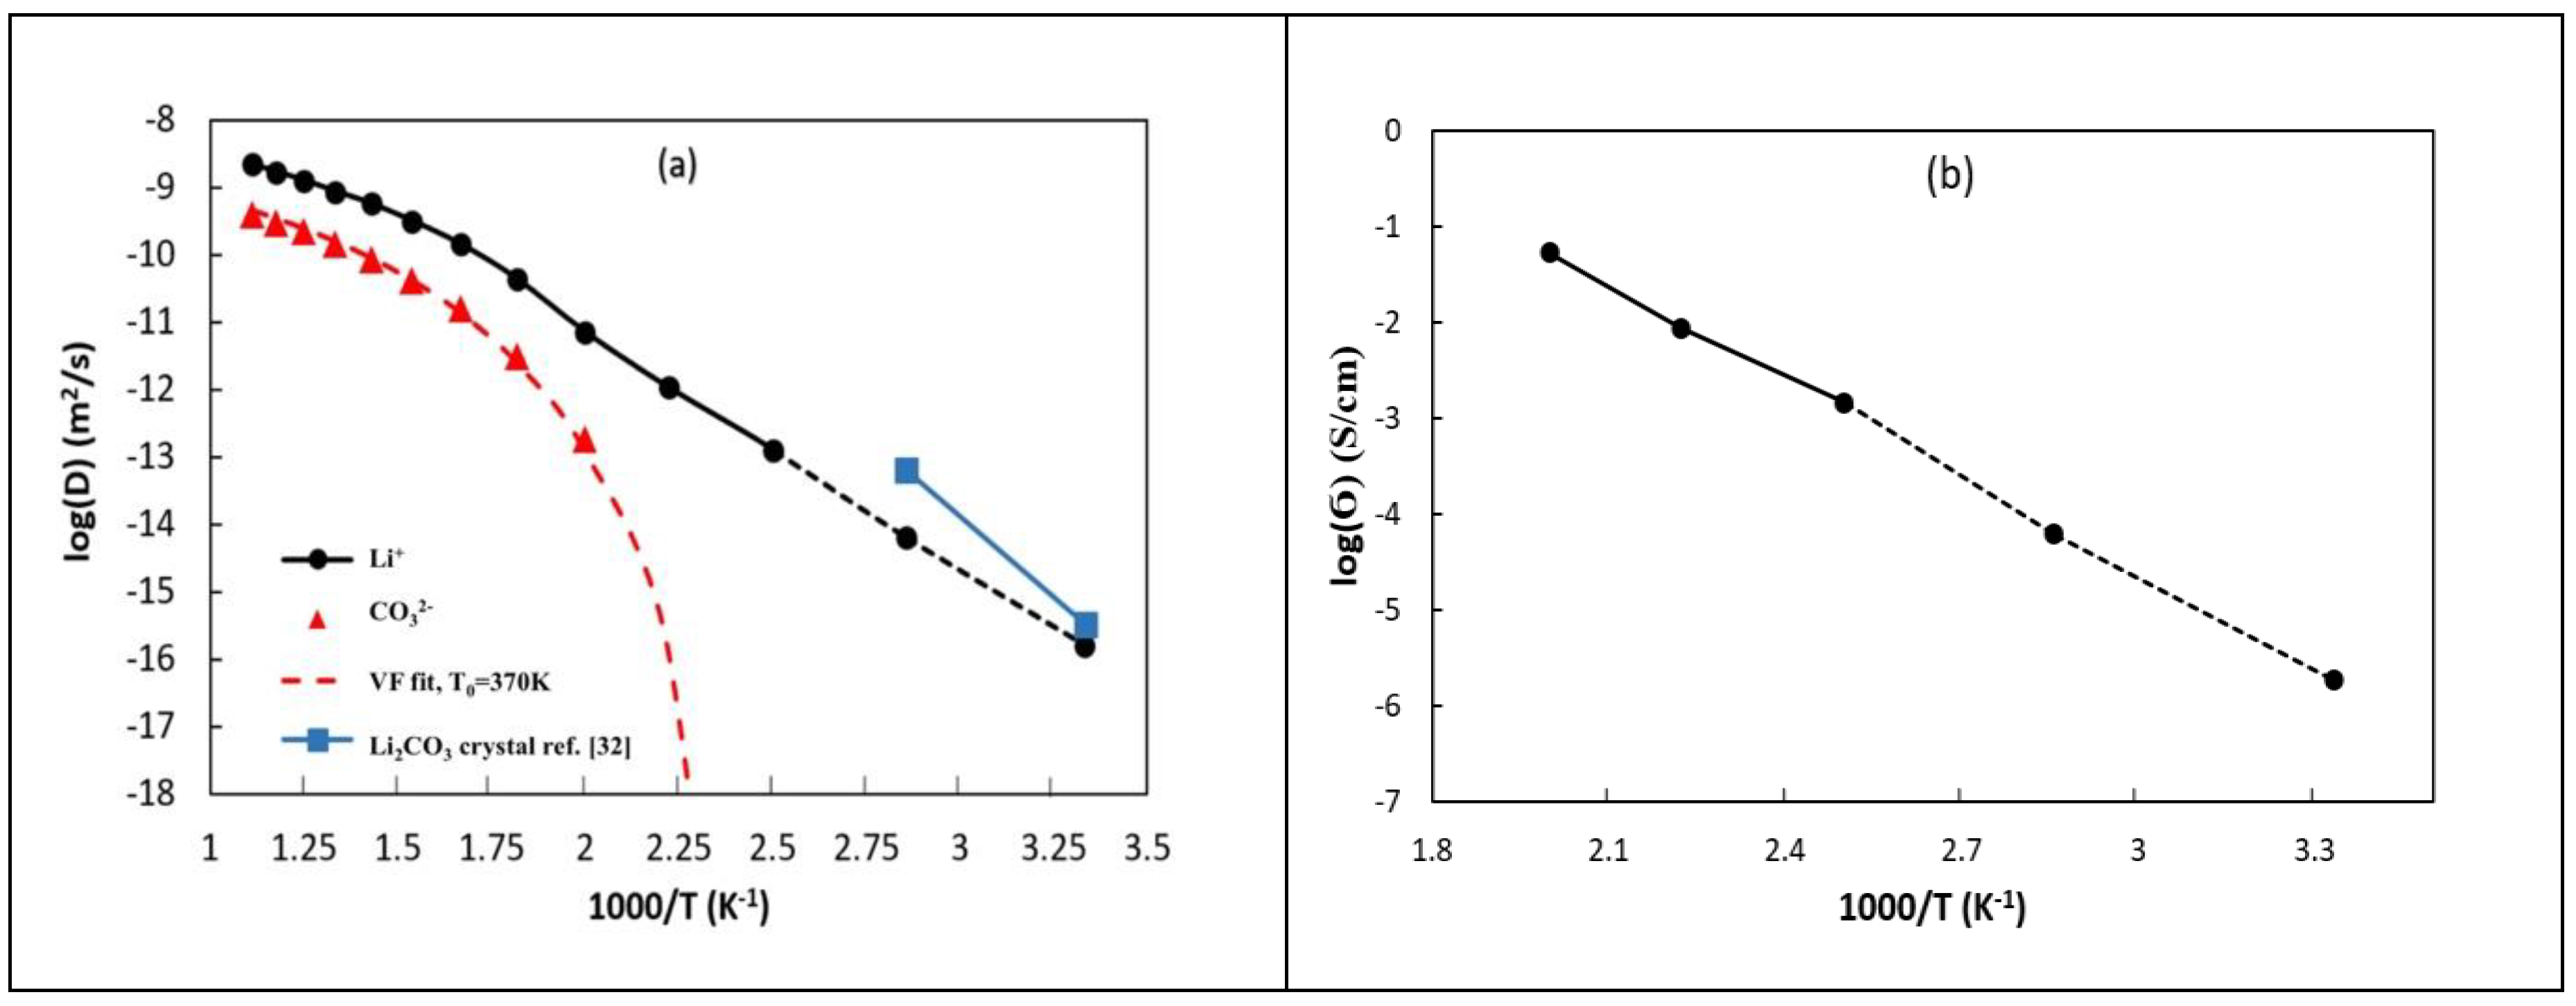
3.2.2. Self-Diffusion Coefficients

Figure 6 shows the self-diffusion coefficients for each component obtained from the analysis of MSD(t), as described above. The examination of the temperature dependence for Li+ diffusion in Figure 6 shows that at higher temperatures, the Li+ diffusion is about an order of magnitude higher than diffusion of the CO32−, which is consistent with the ratios of MSDs shown in Figure 5. We can also see that diffusion of Li+ at elevated temperatures qualitatively follows the same temperature dependence as for anion. However, as the temperature decreases to 500 K, a noticeable difference in the self-diffusion of anions and cations can be observed. The anion dependence shows a divergent behavior that can be well described by the Vogel−Fulcher (VF) equation:
log (1/D) = A + B/(TT0)
which is usually used to describe the divergence of relaxation times in glassy systems. The obtained VF fit describes the available data for anions very well. The T0 value extracted from the fit, which is typically somewhat lower than the true glass transition temperature, is 370 K. The temperature dependence for Li+ diffusion in Figure 6 shows that at elevated temperatures it is qualitatively similar to that of the anions (i.e., it shows slowing down with decreasing temperature). However, below 500 K it shifts to an Arrhenius dependence instead of following the VF-type dependence observed for the anions. As a result, at lower temperatures, the diffusion of Li+ is decoupling from the anion motion, which is consistent with observations in Figure 5. This mechanism is similar to our previous observations in modeling of Li2EDC and Li2BDC SEI phases [4] and indicates that at lower temperatures the anions are forming a glassy matrix through which Li+ ions can still diffuse, leading to the Arrhenius temperature dependence. The activation energy for Li+ diffusion in this glassy amorphous Li2CO3 phase is 26.38 kcal/mol. For comparison, we also show previously reported Li+ diffusion data in crystalline Li2CO3 as obtained from atomistic MD simulations [32]. Taking into account the possible uncertainty of low temperature diffusion data, the Li+ diffusion in crystalline phase and in amorphous phases appear to be comparable at low temperatures.

3.2.3. Ionic Conductivities

Figure 6b shows the ionic conductivities for Li+ extracted from MD simulations of amorphous Li2CO3 and obtained using the Nernst-Einstein equation:
σ = N A e 2 z 2 C D L i k B T
where DLi is the Li+ diffusion coefficient, z = 1.0 is the charge, C is the concentration of Li+, kB is the Boltzmann constant, e is elementary charge and NA is Avogadro’s number. The estimated conductivity at 300 K is on the order of 10−6 S/cm which is in very good agreement with experimental data obtained in composite solid electrolytes where majority of electrolyte was amorphous Li2CO3 [16].

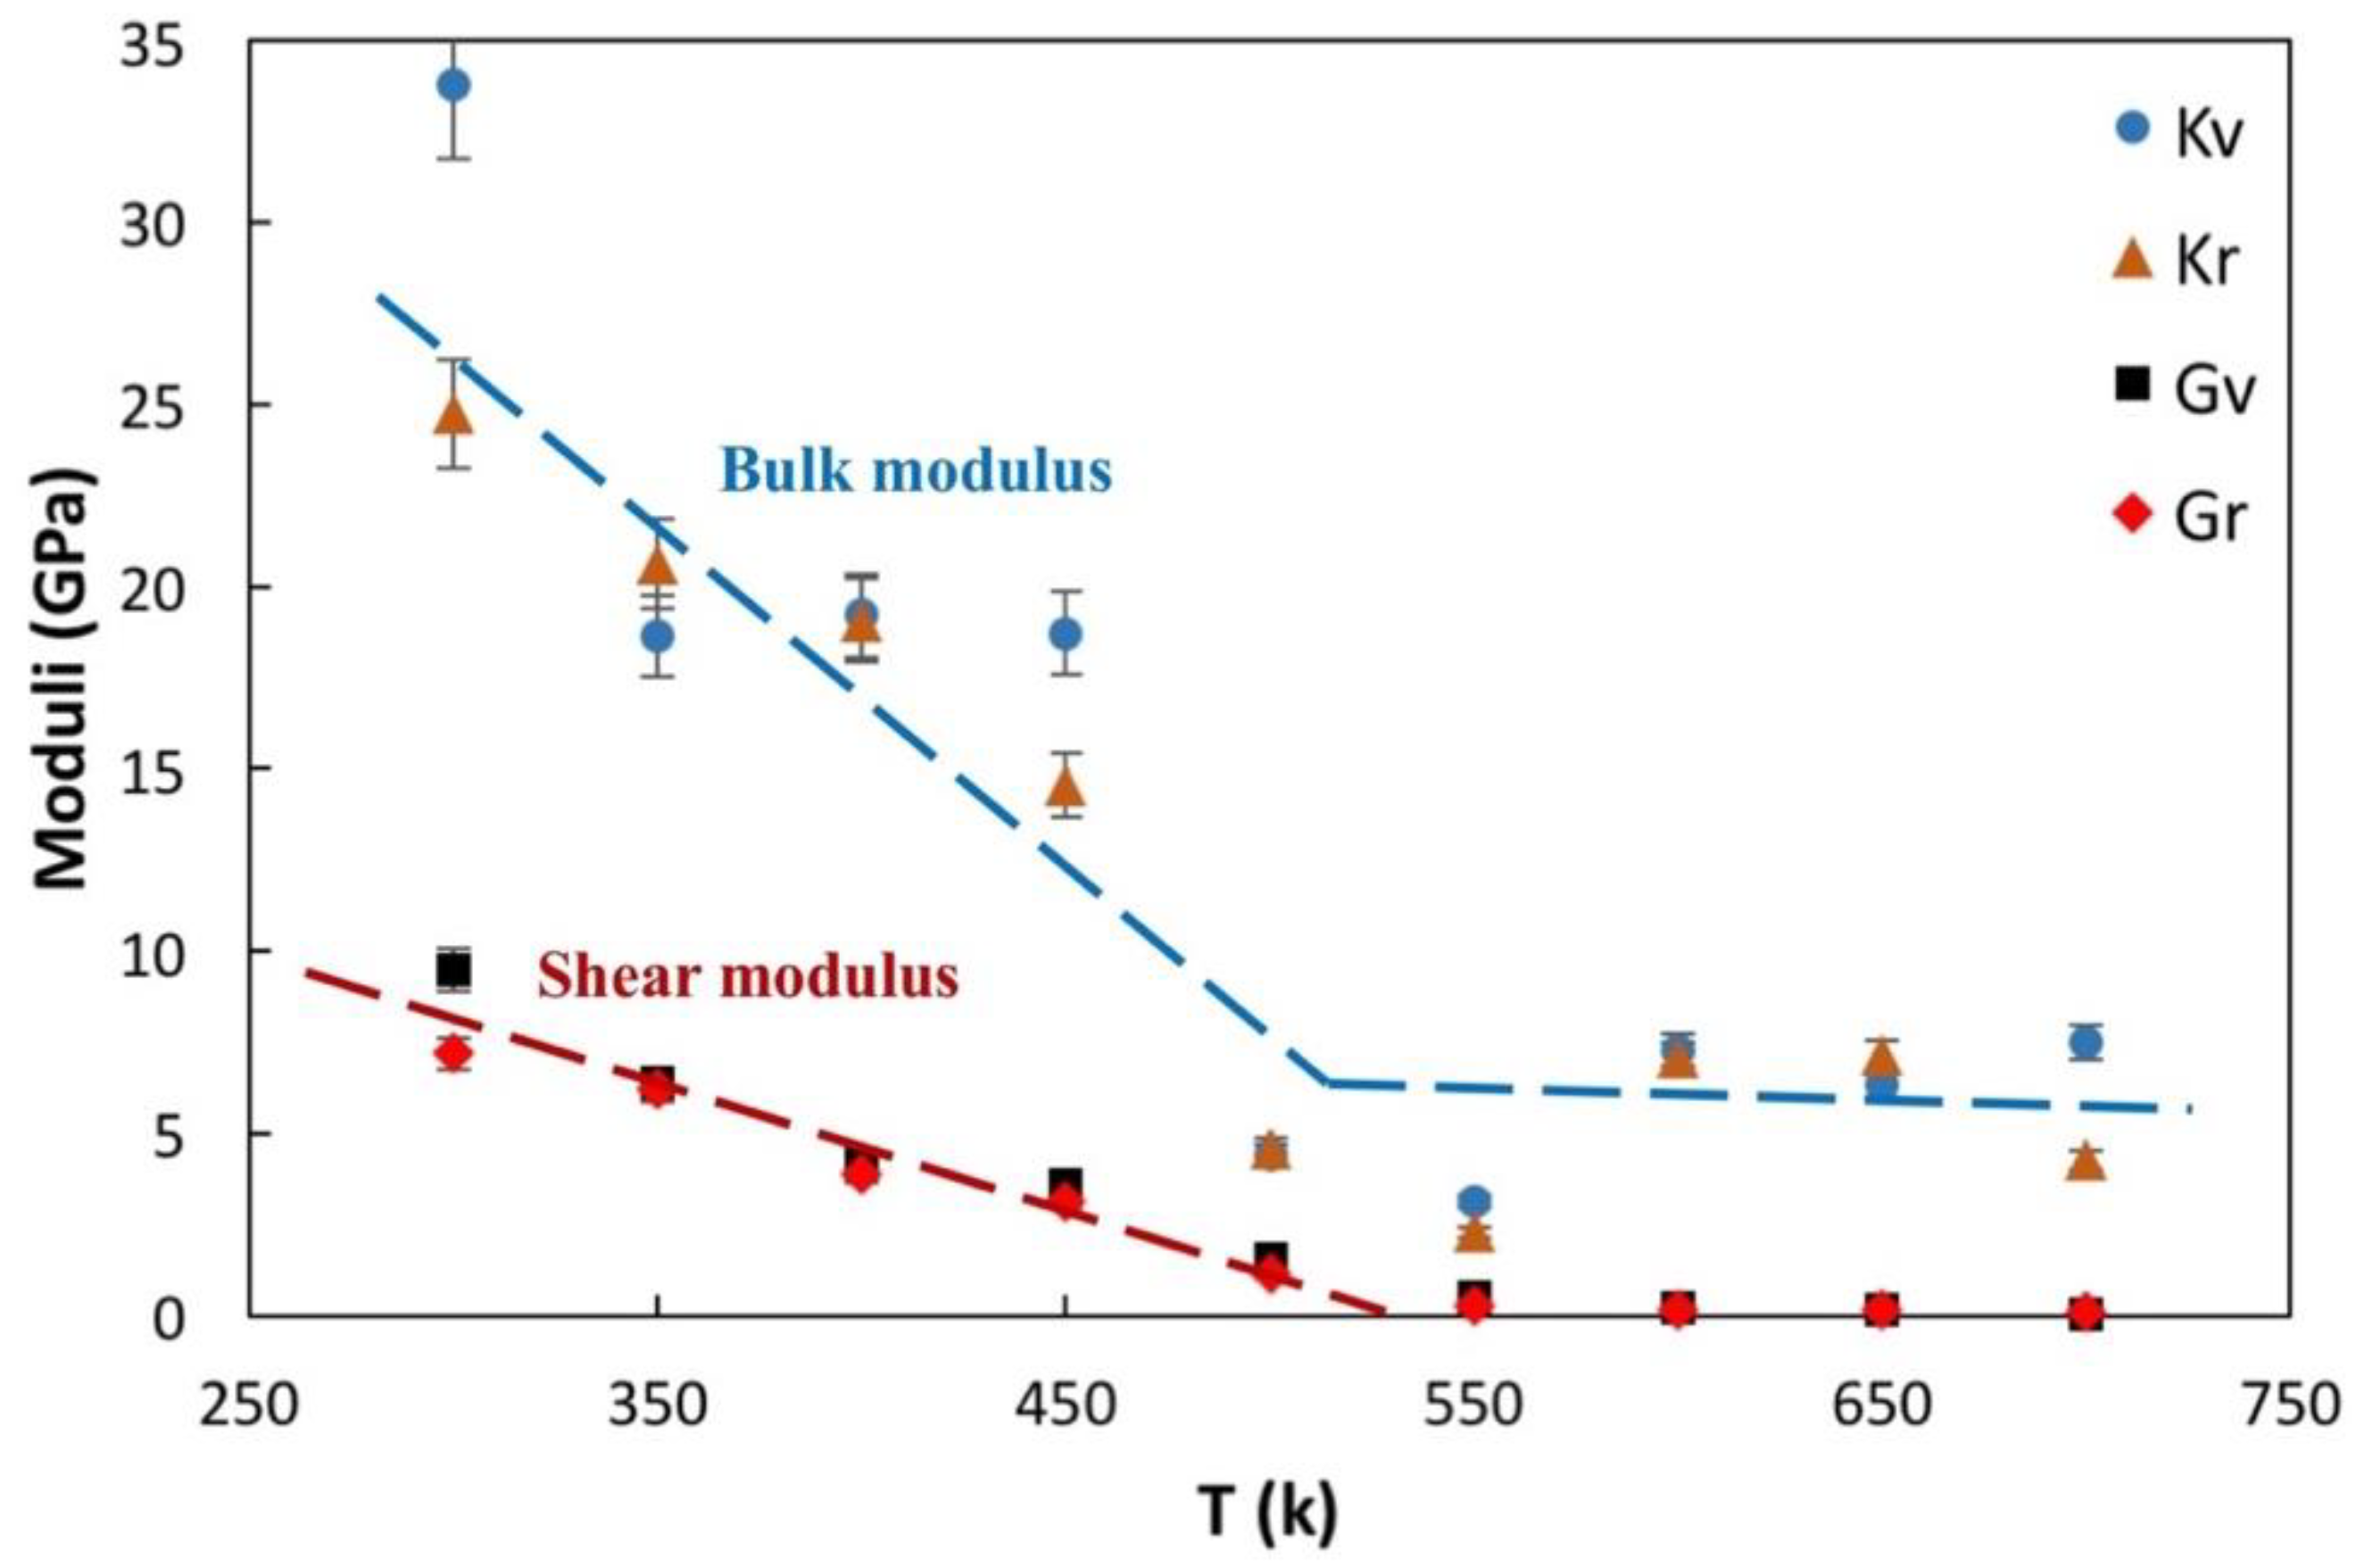
3.3. Mechanical Properties

Lastly, we investigate the mechanical properties of amorphous Li2CO3 as a function of temperature. The mechanical properties of a simulated system can be obtained by considering fluctuations of the simulation cell dimensions during simulation [33]. Those changes in dimensions offer a spontaneous expression of instantaneous strain for a simulation cell, and it can be associated with the compliance tensor of the material at equilibrium as
Ŝijkl = ⟨ε̅ijε̅kl ⟩ V/kBT
where ε̅ij and ε̅kl are the instantaneous components of the second rank strain tensor. If the contracted stress/strain vectors are chosen properly [34], the rank 4 compliance tensor Ŝijkl in eq. 4 may be precisely expressed in Voigt notation, which leads to a rank 2 tensor that is the matrix inverse of the elastic stiffness tensor. This provides calculation of standard elastic constants (Cij), in addition to the Voigt [35] and Reuss [36] approximations [37] of the total bulk (K) and shear (G) moduli of the material. Elastic stiffness calculations of the simulation cell necessitate effectively sampling the fluctuations of strain vectors for an equilibrated or stationary system. The strain vectors used to composite the compliance matrix in Equation (4) may be taken from the spontaneous thermodynamic fluctuations of the simulation box in MD-MC simulations [4]. However, investigating dynamically slow-moving or glassy systems with amorphous structure, such as those in this study, leads to the need for excessive simulation times to allow for full expression of the equilibrium variations in the sample cell’s lattice vectors. To overcome this concern, we employed the methodology utilized previously [4] and simulated and analyzed several (up to 10) independent system realizations, using the combination of limited fluctuations about a set of configurations distributed within the thermodynamic phase space as an approximation for a single set of fluctuations taken from a single configuration which traverses the entire phase space. Initial configurations for each system were obtained from a long trajectory at high temperature (900 K) using regular MD simulation and separated from each other by 5 ns time intervals.
Figure 7 shows temperature dependence of bulk (K) and shear (G) moduli calculated using Voigt (v) and Reuss (r) approximations. Consistent with the temperature dependence of structural and dynamic properties, we observed a strong temperature dependence of both moduli in the glassy state (T < 500 K). The bulk modulus dropped from about 27 GPa at room temperature to approximately 6 GPa at 500 K and then changed slightly as the temperature increased further. The shear modulus decreased from about 8 GPa to 0 over the same temperature range. Above 550 K, the system behaved as an overcooled liquid and thus its shear modulus was expected to be much lower than in the glassy state. According to the Newman and Monroe model [38], an SEI with shear modulus of larger than 7.0 GPa is necessary to prevent Li dendrite growth on electrodes surfaces. Our data show that SEIs formed out of glassy Li2CO3 already have high enough shear modulus to provide sufficient mechanical strength to prevent dendrite growth based only on consideration of mechanical properties. While crystalline Li2CO3 is expected to have even higher shear modulus, the relatively high Li+ conductivity observed in the amorphous phase makes the latter more desirable for obtaining SEI with optimal mechanical and transport properties.

4. Conclusions

Using classical atomistic MD simulations that employ polarizable force field, the structural, dynamic, and mechanical properties of amorphous Li2CO3 material were investigated. Our simulations demonstrated that the amorphous glassy state of Li2CO3 forms at temperatures below 450 K. In this phase, the anions formed a frozen matrix, yet Li+ cations still showed substantial diffusion through this matrix. The observed decoupling of cation and anion motion at low temperatures coupled with good mechanical properties (shear modulus around 8 GPa) makes glassy Li2CO3 a desired material in Li-ion battery applications. Specifically, its high conductivity allows for consideration of glassy Li2CO3 as a solid electrolyte, particularly when it is blended with other oxides to prevent crystallization. In addition, depending on charging conditions, glassy Li2CO3 might be present in the inner SEI layers forming on graphite, Li, and Si electrodes. While in real battery, bulk Li2CO3 phase is forming through self-assembly reduction products and the crystal phase of Li2CO3 is believed to be dominant in the inner SEI regions, the glassy phase investigated here might be present at the grain boundaries or in the regions contaminated with other SEI species (e.g., LiF or Li2O). Moreover, if the rate of double reduction of carbonate molecules at the electrode surface is high (i.e., Li2CO3 is generated at high rate) it is possible that large glassy domains of Li2CO3 could form without sufficient time to allow for crystallization. Based on properties reported here from our simulations, such glassy Li2CO3 would be desirable for efficient SEI.

Supplementary Materials

The following are available online at https://www.mdpi.com/2073-4352/8/12/473/s1.

Author Contributions

Conceptualization, M.I., D.B. and J.H.; Methodology, D.B. and J.H.; Validation, M.I., J.H. and D.B.; Formal Analysis, M.I. and J.H.; Investigation, M.I..; Resources, D.B..; Data Curation, M.I., J.H. and D.B..; Writing-Original Draft Preparation, M.I. and D.B.; Writing-Review & Editing, J.H. D.B..; Visualization, M.I..; Supervision, D.B.; Project Administration, D.B.; Funding Acquisition, D.B.

Funding

The funding support is provided by the Army Research Laboratory under Cooperative Agreement Number W911NF-12-2-0023. The conclusions conveyed in this document are those of the authors and should not be interpreted as representation of official policies, either expressed or implied, of ARL or the U.S. Government. The U.S. Government is authorized to reproduce and distribute reprints for Government purposes notwithstanding any copyright notation herein. The technical support and generous computational resources and grant of computing time from the Center of High Performance Computing at The University of Utah are also acknowledged.

Conflicts of Interest

The authors declare no conflict of interest. The founding sponsors had no role in the design of the study; in the collection, analyses, or interpretation of data; in the writing of the manuscript, and in the decision to publish the results.

References

  1. Shi, S.; Qi, Y.; Li, H.; Hector, L.G., Jr. Defect thermodynamics and diffusion mechanisms in Li2CO3 and implications for the solid electrolyte interphase in Li-ion batteries. J. Phys. Chem. C 2013, 117, 8579–8593. [Google Scholar] [CrossRef]
  2. Iddir, H.; Curtiss, L.A. Li ion diffusion mechanisms in bulk monoclinic Li2CO3 crystals from density functional studies. J. Phys. Chem. C 2010, 114, 20903–20906. [Google Scholar] [CrossRef]
  3. Suo, L.; Oh, D.; Lin, Y.; Zhuo, Z.; Borodin, O.; Gao, T.; Wang, F.; Kushima, A.; Wang, Z.; Kim, H.-C.; et al. How solid-electrolyte interphase forms in aqueous electrolytes. J. Am. Chem. Soc. 2017, 139, 18670–18680. [Google Scholar] [CrossRef] [PubMed]
  4. Bedrov, D.; Borodin, O.; Hooper, J.B. Li+ transport and mechanical properties of model solid electrolyte interphases (SEI): Insight from atomistic molecular dynamics simulations. J. Phys. Chem. C 2017, 121, 16098–16109. [Google Scholar] [CrossRef]
  5. Verma, P.; Maire, P.; Novák, P. A review of the features and analyses of the solid electrolyte interphase in Li-ion batteries. Electrochim. Acta 2010, 55, 6332–6341. [Google Scholar] [CrossRef]
  6. Wang, A.; Kadam, S.; Li, H.; Shi, S.; Qi, Y. Review on modeling of the anode solid electrolyte interphase (SEI) for lithium-ion batteries. npj Comput. Mater. 2018, 4, 15. [Google Scholar] [CrossRef]
  7. Aurbach, D.; Ein-Eli, Y.; Markovsky, B.; Zaban, A.; Luski, S.; Carmeli, Y.; Yamin, H. The study of electrolyte solutions based on ethylene and diethyl carbonates for rechargeable Li batteries II. Graphite electrodes. J. Electrochem. Soc. 1995, 142, 2882–2890. [Google Scholar] [CrossRef]
  8. Zorba, V.; Syzdek, J.; Mao, X.; Russo, R.E.; Kostecki, R. Ultrafast laser induced breakdown spectroscopy of electrode/electrolyte interfaces. Appl. Phys. Lett. 2012, 100, 234101. [Google Scholar] [CrossRef]
  9. Li, T.; Balbuena, P.B. Theoretical studies of the reduction of ethylene carbonate. Chem. Phys. Lett. 2000, 317, 421–429. [Google Scholar] [CrossRef]
  10. Peled, E.; Golodnitsky, D.; Ardel, G. Advanced model for solid electrolyte interphase electrodes in liquid and polymer electrolytes. J. Electrochem. Soc. 1997, 144, L208–L210. [Google Scholar] [CrossRef]
  11. Vollmer, J.M.; Curtiss, L.A.; Vissers, D.R.; Amine, K. Reduction Mechanisms of Ethylene, Propylene, and Vinylethylene Carbonates A Quantum Chemical Study. J. Electrochem. Soc. 2004, 151, A178–A183. [Google Scholar] [CrossRef]
  12. Leung, K.; Soto, F.; Hankins, K.; Balbuena, P.B.; Harrison, K.L. Stability of Solid Electrolyte Interphase Components on Li Metal and Reactive Anode Material Surface. J. Phys. Chem. C 2016, 120, 6302–6313. [Google Scholar] [CrossRef]
  13. Choi, Y.-K.; Chung, K.-I.; Kim, W.-S.; Sung, Y.-E.; Park, S.-M. Suppressive effect of Li2CO3 on initial irreversibility at carbon anode in Li-ion batteries. J. Power. Sources 2002, 104, 132–139. [Google Scholar] [CrossRef]
  14. Shin, J.-S.; Han, C.-H.; Jung, U.-H.; Lee, S.-I.; Kim, H.-J.; Kim, K. Effect of Li2CO3 additive on gas generation in lithium-ion batteries. J. Power Sources 2002, 109, 47–52. [Google Scholar] [CrossRef]
  15. Zhang, S.; Xu, K.; Jow, T. Effect of Li2CO3-coating on the performance of natural graphite in Li-ion battery. Electrochem. Commun. 2003, 5, 979–982. [Google Scholar] [CrossRef]
  16. Kazyak, E.; Chen, K.H.; Davis, A.L.; Yu, S.; Sanchez, A.J.; Lasso, J.; Bielinski, A.R.; Thompson, T.; Sakamoto, J.; Siegel, D.J.; et al. Atomic layer deposition and first principles modeling of glassy Li3BO3–Li2CO3 electrolytes for solid-state Li metal batteries. J. Mater. Chem. A 2018, 6, 19425–19437. [Google Scholar] [CrossRef]
  17. Sulaiman, M.; Rahman, A.A.; Mohamed, N.S. Sol–gel synthesis and characterization of Li2CO3–Al2O3 composite solid electrolytes. Ionics 2016, 22, 327–332. [Google Scholar] [CrossRef]
  18. Shang, S.-L.; Hector, L.G., Jr.; Shi, S.; Qi, Y.; Wang, Y.; Liu, Z.-K. Lattice dynamics, thermodynamics and elastic properties of monoclinic Li2CO3 from density functional theory. Acta Mater. 2012, 60, 5204–5216. [Google Scholar] [CrossRef]
  19. Kim, J.W.; Lee, H.G. Thermal and carbothermic decomposition of Na2CO3 and Li2CO3. Metall. Mater. Trans. B 2001, 32, 17–24. [Google Scholar] [CrossRef]
  20. Xu, K. Manipulating interphases in batteries. Natl. Sci. Rev. 2017, 4, 19–20. [Google Scholar] [CrossRef]
  21. Borodin, O.; Zhuang, G.V.; Ross, P.N.; Xu, K. Molecular dynamics simulations and experimental study of lithium ion transport in dilithium ethylene dicarbonate. J. Phys. Chem. C 2013, 117, 7433–7444. [Google Scholar] [CrossRef]
  22. Oldiges, K.; Diddens, D.; Ebrahiminia, M.; Hooper, J.B.; Cekic-Laskovic, I.; Heuer, A.; Bedrov, D.; Winter, M.; Brunklaus, G. Understanding transport mechanisms in ionic liquid/carbonate solvent electrolyte blends. Phys. Chem. Chem. Phys. 2018, 20, 16579–16591. [Google Scholar] [CrossRef] [PubMed]
  23. Martyna, G.J.; Tuckerman, M.E.; Tobias, D.J.; Klein, M.L. Explicit reversible integrators for extended systems dynamics. Mol. Phys. 1996, 87, 1117–1157. [Google Scholar] [CrossRef]
  24. Bedrov, D.; Borodin, O.; Smith, G.D.; Sewell, T.D.; Dattelbaum, D.M.; Stevens, L.L. A molecular dynamics simulation study of crystalline 1, 3, 5-triamino-2, 4, 6-trinitrobenzene as a function of pressure and temperature. J. Chem. Phys. 2009, 131, 224703. [Google Scholar] [CrossRef] [PubMed]
  25. Hooper, J.B.; Borodin, O.; Schneider, S. Insight into hydrazinium nitrates, azides, dicyanamide, and 5-azidotetrazolate ionic materials from simulations and experiments. J. Phys. Chem. B 2011, 115, 13578–13592. [Google Scholar] [CrossRef] [PubMed]
  26. Sewell, T.D.; Menikoff, R.; Bedrov, D.; Smith, G.D. A molecular dynamics simulation study of elastic properties of HMX. J. Chem. Phys. 2003, 119, 7417–7426. [Google Scholar] [CrossRef]
  27. Liu, Q.; Lange, R.A. New density measurements on carbonate liquids and the partial molar volume of the CaCO3 component. Mineral. Petrol. 2003, 146, 370–381. [Google Scholar] [CrossRef]
  28. Kojima, T.; Miyazaki, Y.; Nomura, K.; Tanimoto, K. Density, Molar Volume, and Surface Tension of Molten Li2CO3 Na2CO3 and Li2CO3 K2CO3 Containing Alkaline Earth (Ca, Sr, and Ba) Carbonates. J. Electrochem. Soc. 2003, 150, E535–E542. [Google Scholar] [CrossRef]
  29. Lide, D.R. Physical Constant of Inorganic Compound. In Handbook of Chemistry and Physics; CRC Press: Boca Raton, FL, USA, 2005. [Google Scholar]
  30. Islam, M.M.; Ostadhossein, A.; Borodin, O.; Yeates, A.T.; Tipton, W.W.; Hennig, R.G.; Kumar, N.; van Duin, A.C.T. ReaxFF molecular dynamics simulations on lithiated sulfur cathode materials. Phys. Chem. Chem. Phys. 2015, 17, 3383–3393. [Google Scholar] [CrossRef] [PubMed]
  31. Kohara, S.; Badyal, Y.S.; Koura, N.; Idemoto, Y.; Takahashi, S.; Curtiss, L.A.; Saboungi, M.L. The structure of molten alkali carbonates studied by neutron diffraction and ab initio calculations. J. Phys. Condens. Matter. 1998, 20, 3301. [Google Scholar] [CrossRef]
  32. Benitez, L.; Seminario, J.M. Ion diffusivity through the solid electrolyte interphase in lithium-ion batteries. J. Electrochem. Soc. 2017, 164, E3159–E3170. [Google Scholar] [CrossRef]
  33. Parrinello, M.; Rahman, A. Strain fluctuations and elastic constants. J. Chem. Phys. 1982, 76, 2662–2666. [Google Scholar] [CrossRef]
  34. Tsai, S.W. AFML Techncal Report No. AFML-TR-66-149; Air Force Materials Laboratory, Research and Technology Division: USA, 1966. [Google Scholar]
  35. Voigt, W. Theoretical studies of the elastic behaviour of crystals. Presented at the session of the Royal Society of Science. Available online: http://www.neo-classical-physics.info/uploads/3/4/3/6/34363841/voigt_-_elasticity_of_crystals_-_i.pdf (accessed on 18 December 2018).
  36. Reuss, A. Berechnung der fließgrenze von mischkristallen auf grund der plastizitätsbedingung für einkristalle. J. Appl. Math. Mech./ZAMM 1929, 9, 49–58. [Google Scholar] [CrossRef]
  37. Hill, R. The elastic behaviour of a crystalline aggregate. Proc. Phys. Soc. A 1952, 65, 349. [Google Scholar] [CrossRef]
  38. Monroe, C.; Newman, J. The impact of elastic deformation on deposition kinetics at lithium/polymer interfaces. J. Electrochem. Soc. 2005, 152, A396–A404. [Google Scholar] [CrossRef]
Figure 1. Snapshots of (a) the chemical structure of lithium carbonate, (b) the amorphous phase of Li2CO3 at 550 K, and (c) the ordered phase of Li2CO3 that formed in two realizations at 550 K (see text for discussion).
Crystals 08 00473 g001
Figure 2. Temperature dependence of density obtained from molecular dynamics (MD) simulation of amorphous Li2CO3. Also shown are available experimental data for liquid and crystal phases, density of the ordered phase obtained in some systems from MD simulations at 550 K, and anticipated extrapolation of experimental density (thin dotted line) for amorphous phase assuming temperature dependence as in MD simulations. Error bars are smaller than the symbol size.
Crystals 08 00473 g002
Figure 3. Radial distribution functions (RDFs) obtained from MD simulations of (a) amorphous Li2CO3 as a function of temperature. (b) Coordination numbers (CN) obtained from integration of g(r)s from panel (a).
Crystals 08 00473 g003
Figure 4. Mean squared displacements of (a) Li+ and (b) CO32− as obtained from MD simulations of amorphous Li2CO3 systems at various temperatures. Panel (c) shows the master curve for Li MSD(t) obtained using the time-temperature superposition principle.
Crystals 08 00473 g004
Figure 5. Ratio of cation and anion MSD(t) at different temperatures.
Crystals 08 00473 g005
Figure 6. (a) Diffusion coefficients of anion and cation and (b) ionic conductivity of Li. in Li2CO3 as a function of inverse temperature as obtained from MD simulations. Also shown are the data from atomistic MD simulations of crystalline Li2CO3 from ref. [32].
Crystals 08 00473 g006
Figure 7. Bulk and shear moduli of Li2CO3 obtained from the analysis of MD/MC simulations at different temperatures.
Crystals 08 00473 g007

