
Kidney Stones: Crystal Characterization

1
Hospital Universitario Fundación Jiménez Díaz, Av. Reyes Católicos 2, 28040 Madrid, Spain
2
Departamento de Geología y Geoquímica, Facultad de Ciencias, Universidad Autónoma, 28049 Madrid, Spain
*
Author to whom correspondence should be addressed.
Crystals 2024, 14(3), 238; https://doi.org/10.3390/cryst14030238
Submission received: 17 February 2024
/
Revised: 22 February 2024
/
Accepted: 26 February 2024
/
Published: 29 February 2024
(This article belongs to the Special Issue Pathological Biomineralization: Recent Advances and Perspectives)
Abstract
:The variety of types that appear in kidney stones makes it necessary to describe them to try to understand their formation. The crystalline phases recognized in stones are classified according to their chemical composition. For this reason, a study using X-ray microdiffraction, Raman spectroscopy, SEM/EDX analysis, and cathodoluminescence (CL) is recommended, to identify their composition. In the present study, this was carried out on kidney stones collected from surgeries in hospitals from Spain. The samples were collected in two representative urban centers: one from a large city, Madrid; the other with a mostly rural population, in order to contrast the possible compositions of the kidney stones. In large cities, struvite appears more frequently, although calcium oxalates are very common in both areas. An attempt was made to provide a guide to the most frequent phases, accompanied by four analysis methods that make their identification possible.
1. Introduction
Biomineralization is a common process in mammals. One of the oldest pathologies is nephrolithiasis. Urolithiasis is a disease that causes kidney stones to be generated by various organisms such as humans, cats, dogs and, in general, mammalsand usually recurs easily [1]. It generally arises from changes in the physicochemical balance in the urinary tract attributed to different factors [2,3,4,5], although they are not exclusive causes. Thus, one can think of region of residence, climate, ethnicity, diet [6] and genetics [7].
Although kidney stones are known to be composed primarily of calcium oxalate, many of them are usually accompanied by phases of the apatite group compounds [8,9]. In addition, kidney stones composed by calcium oxalate present chemical phases, such as whewellite and weddellite [10], and a small percentage of stones are also made up of magnesium ammonium phosphate, uric acid, or cystine, resulting in the formation of calcium oxalate mineral formation through supersaturation processes [11]. For example, the high concentrations of calcium ions and oxalate ions in the urine play a fundamental role by allowing the precipitation of calcium oxalate due to supersaturation. Also, the presence of calcium and phosphate ions induces the appearance of apatite-type phases, and in this case, pH is a determining factor in the appearance of kidney stones [12].
The composition of kidney stones is very variable; this causes great difficulties in the treatment of this type of biomaterial, as they are not of the same nature. This circumstance justifies the study of each type to solve the possible origin through techniques that lead to the precise characterization of the aforementioned types. Currently, Fourier transform infrared (FTIR) spectroscopy [13,14], X-ray diffraction (XRD) [10,15] and electron microscopy (SEM/EDS) are routinely used to obtain chemical information about the minerals present in kidney stones. Following diagnosis, disease treatment must be chosen from a range of currently used minimally invasive procedures [16] and a wide range of stone-specific drugs [1].
Also, advanced physical techniques have been used in the elemental analysis of kidney stones: total reflection X-ray fluorescence (TXRF or TRXRF) [17]), laser induced decay spectroscopy (LIBS) [18], and laser ablation inductively coupled plasma mass spectrometry (LA-ICP-MS), just to name a few [17,18,19,20,21]. Raman spectroscopy has also been applied for the identification of organic and inorganic compounds [22]. Some elements such as zinc, copper, nickel, aluminum, strontium, cadmium, and lead form sparingly soluble salts with phosphate and oxalate and, therefore, play an important role in kidney stone formation [23]. Thermogravimetric analyses (TGA) measure changes in the chemical and physical properties of the mineral components as a function of temperature [24]. Scanning electron microscopy (SEM) provides morphological features of samples at high resolution, revealing crystalline/non-crystalline structural aspects [25,26].
In the present work, we intend to advance in the analysis of the most appropriate techniques for the characterization of certain crystalline phases in kidney stones, using X-ray microdiffraction (XRD), Raman spectroscopy, SEM/EDX and cathodoluminescence (CL) analysis. An attempt has been made to provide a guide to the most frequent phases, accompanied by four analysis methods that make their identification possible. To this end, 50 kidney stones from surgeries performed at the Fundación Jiménez Díaz University Hospital (Madrid) and the Don Benito University Hospital (Badajoz), both in Spain, were analyzed. Madrid is a large urban city, while Don Benito (Badajoz) is located in a rural environment. Once extracted, they were preserved in a desiccator for subsequent analysis in the techniques cited. Table 1 summarizes the major components and the origin of the analyzed stones.
2. Materials and Methods
2.1. Materials
We analyzed 50 samples of kidney stones from the Fundación Jiménez Díaz University Hospital (Madrid, Spain) The specimens collected had a varied range of shades. In most cases, the configuration was concentric, zoned, with an appreciable initial crystallization nucleus that allowed the growth of overlapping but perfectly identifiable layers. The external area of the kidney stones was usually reddish in color (possibly linked to bleeding processes due to aggression by the stone) and less compact, which was related to their recent formation (they presented a druse growth).
In kidney stones that contained more than one mineral, the inorganic fraction was organized into concentric layers of abruptly different composition around a common core. An interesting feature of these stones is that their centers were usually made up of different forms of calcium phosphate. These included hydroxyapatite, also known as basic calcium hydrogen phosphate, and rarely brushite.
The morphology and chemical composition of kidney stones depend on the supersaturation of different ions and factors such as pH, which allow crystalline growth of one or several phases. The structural and compositional analysis of these stones is more complicated due to the formation of multiple phases that have the same chemical formulas (polymorphs) or the combination of different phases.
All kidney stones, both those extracted in Don Benito (Badajoz) and those in Madrid, were obtained from surgical interventions in which the stone was extracted and preserved from environmental dryness to analyze the phases with the least possible alteration. At the time of analysis in each technique, the sample was reduced to powder in an agate mortar or studied in fresh fracture.
2.2. Methods
Sample mineralogy was analyzed with powder X-ray microdiffraction (XRD) on a PAN Analytical X’Pert Pro X-ray diffractometer (Malvern, UK) fitted with a Cu anode. The operating conditions were 40 mA, 45 kV, divergence slit of 0.5°, and 0.5 mm reception slits. The powder samples were scanned with a step size of 0.0167 (2θ) at 150 ms per step and 2θ angles of 5° to 60°. The phases detected were identified using the Crystallography Open Database (COD) library of crystal structures.
The microscopy and chemical analyses and the CL measurements were performed by scanning electron microscopy and energy dispersive X-ray spectroscopy (SEM-EDS) using an Inspect-S ESEM of the FEI Company (Hillsboro, TX, USA).
Raman spectra of the samples were obtained by means of a Thermo-Fisher DXR Raman microscope (West Palm Beach, FL, USA) with a point-and-shoot Raman capability of 1 μm spatial resolution using a laser source at 532 nm.
Cathodoluminescence (CL) samples were prepared on polished slabs, at low vacuum mode without coating to keep open a way out for the CL emissions, using a Gatan MonoCL3 (Pleasanton, CA, USA) detector with a PA-3 photomultiplier attached to the ESEM. The PMT covered a spectral range of 185–850 nm and is most sensitive in the blue parts of the spectrum. A retractable parabolic diamond mirror and a photomultiplier tube were used to collect and amplify the luminescence signal. The sample was positioned ~10 mm beneath the bottom of the CL mirror assembly. The excitation for CL measurements was provided by a 20 kV electron beam.
3. Results and Discussion
The components involved in the composition of kidney stones mean that stones are classified in different ways, depending on their major component. However, it is possible that they are classified based on their crystallographic characteristics or their states of nucleation or aggregation.
In this sense, a simple classification of kidney stones can be indicated as follows: The specimens collected have a varied range of shades. In most cases, their configuration is concentric, zoned, with an appreciable initial crystallization nucleus that has allowed the growth of overlapping but perfectly identifiable layers. The external area of kidney stones is usually reddish in color (possibly linked to bleeding processes due to aggression by the stone) and less compact, which is related to their recent formation (they present a druse growth). A precise identification of the molecular and structural phases present in kidney stones is always interesting to infer the possible causes of stone formation. In this work, the kidney stones were not classified, but the components found in each of them are described in an attempt to justify their appearance.
3.1. Calcium Oxalates
Among these compounds, calcium-rich oxalates are the most common (whewellite CaC2O4·H2O, weddellite CaC2O4·2.5H2O and caoxyte CaC2O4·3H2O [27]). The dehydroxylation temperature depends on the binding of water [28]. All of them are structures with C-O-Ca- groups, which can easily admit cations of similar size that replace Ca2+ in the lattices or, depending on the valence, generate defects (vacant and/or interstitial), even stacking defects, dislocations, or twins, which will be identified by certain analysis techniques, such as luminescence. The three oxalates, given the simple difference of presenting a varied number of water molecules, can be converted to each other through a reversible drying/hydration process, with the monohydrate as the most stable phase.
Weddellite and whewellite are two calcium oxalate dihydrate minerals commonly found in kidney stones (organic compounds in the mineralogical Dana-Strunz classification). Their crystalline structures are similar; both crystallize in the monoclinic crystallographic system, with alternation of the two ions that form them: calcium and oxalate. The difference appears in the sequence of the succession of the aforementioned ions; thus, weddellite has a more ordered repetition than whewellite. These differences in periodicity are manifested in the different physical and chemical properties of both calcium oxalates, such as solubility and reactivity and their consequences in the formation of kidney stones (the thermodynamic constants change in both phases).
3.1.1. Whewellite or Oxacalcite
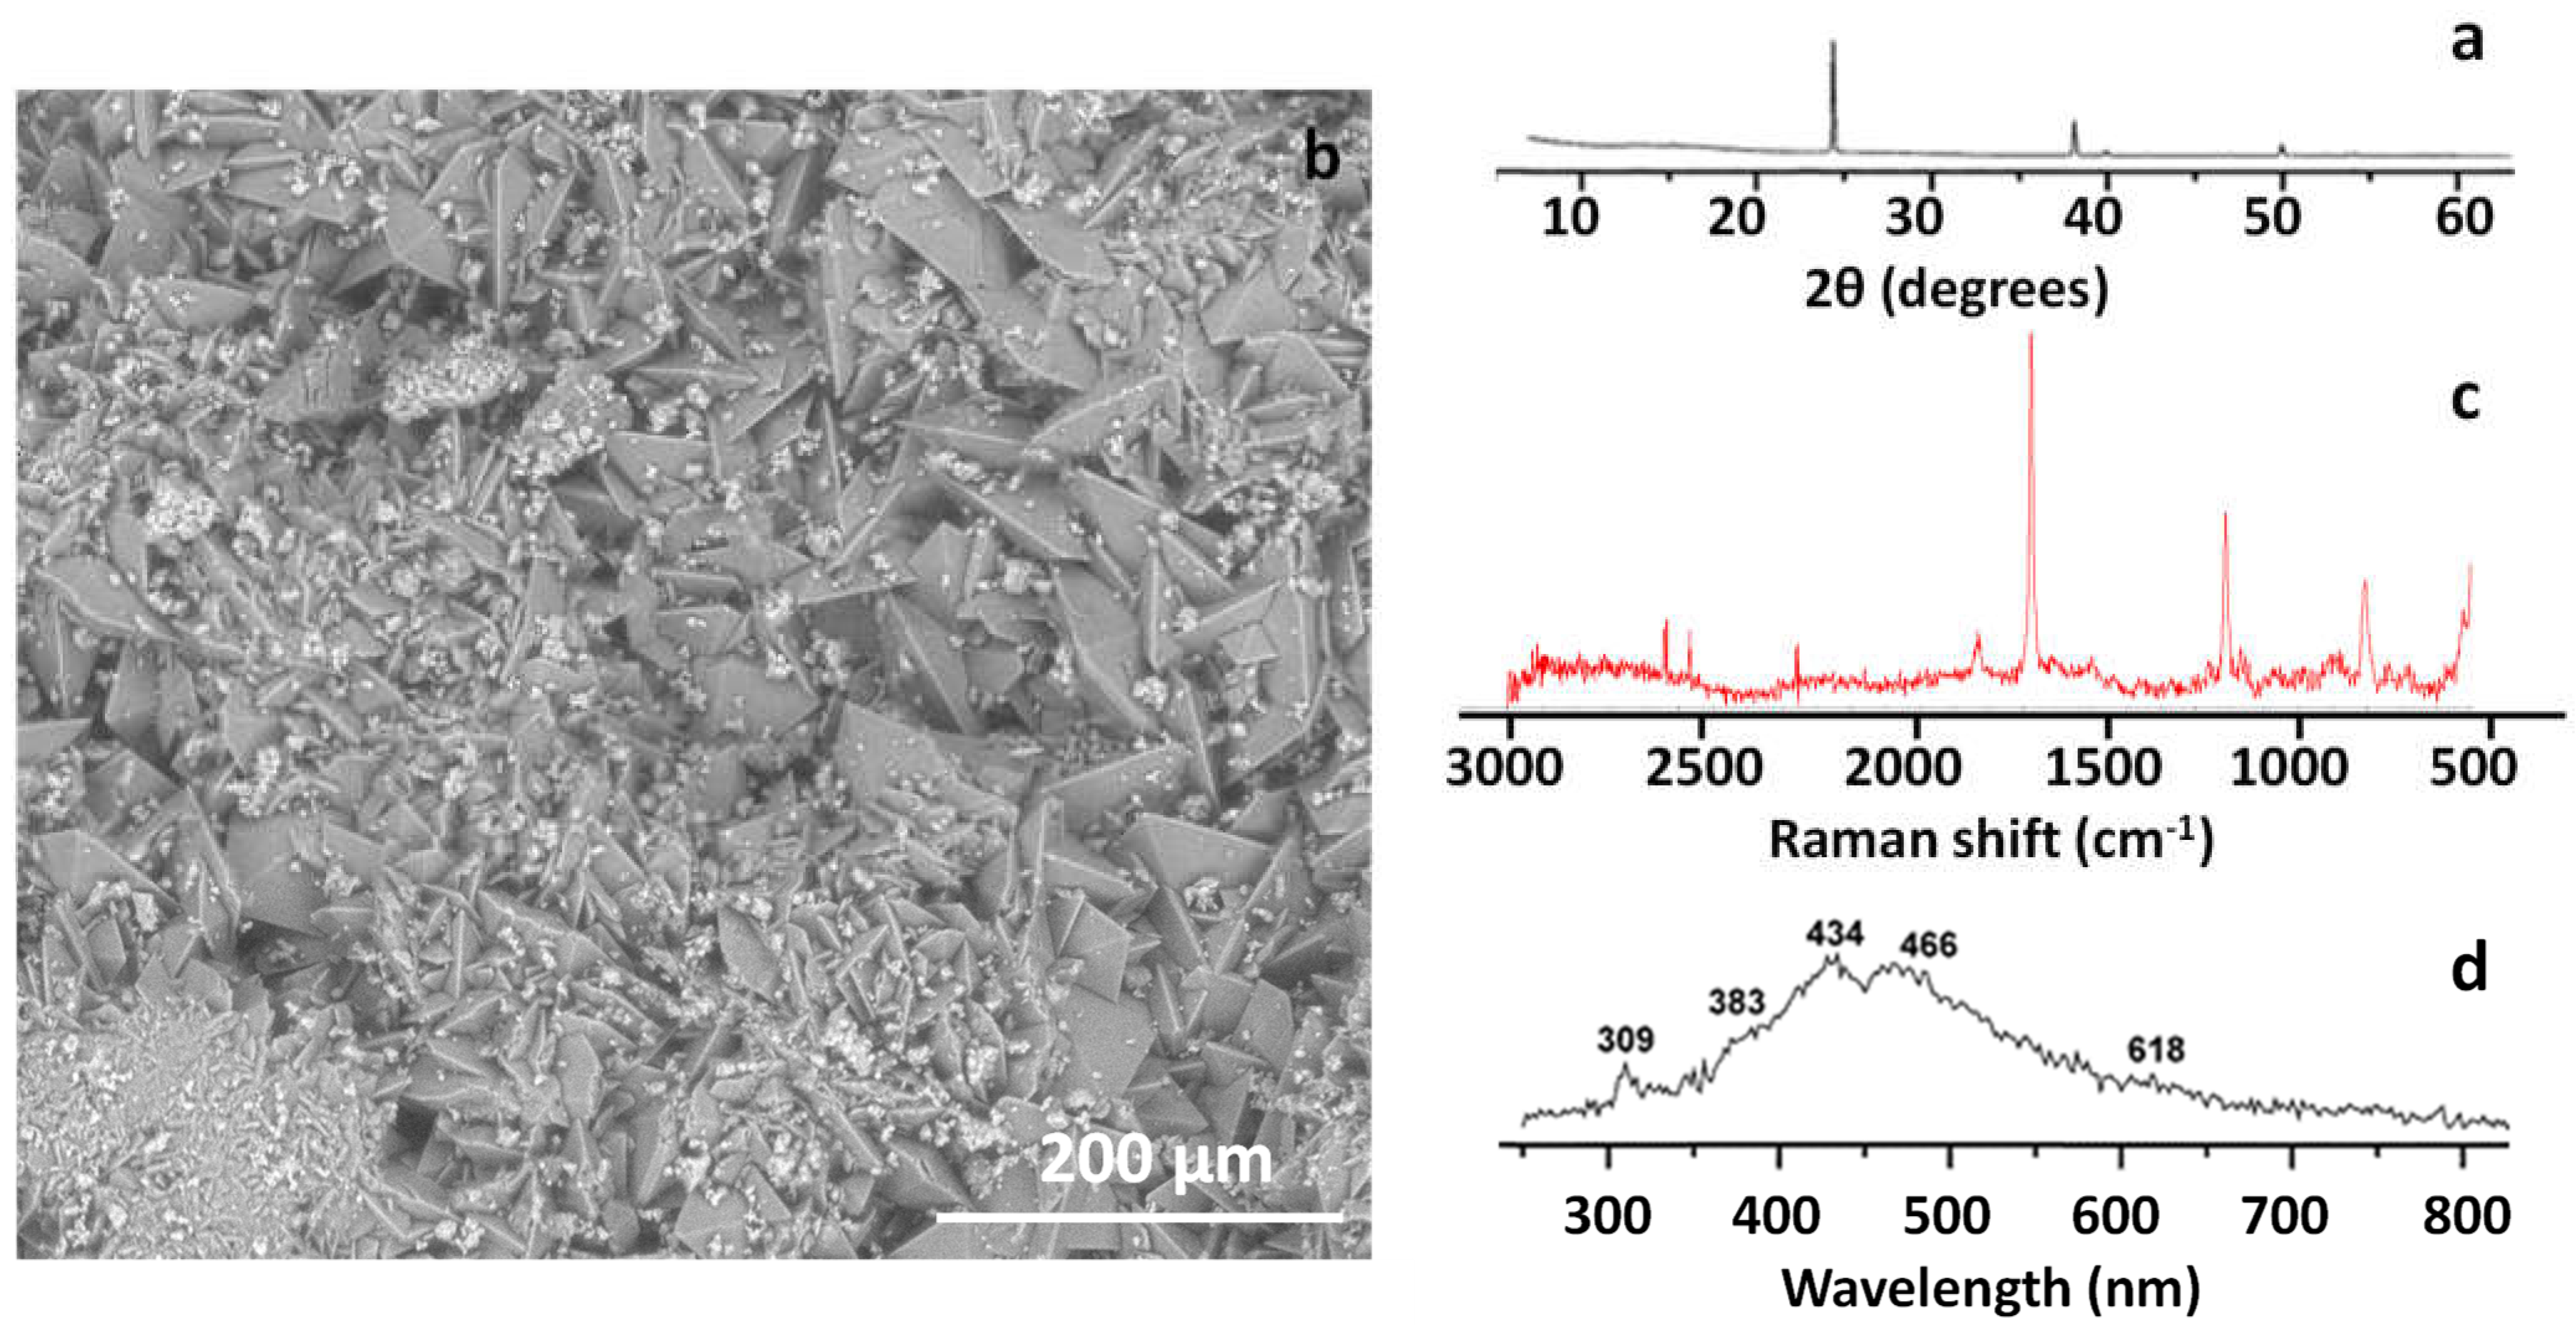
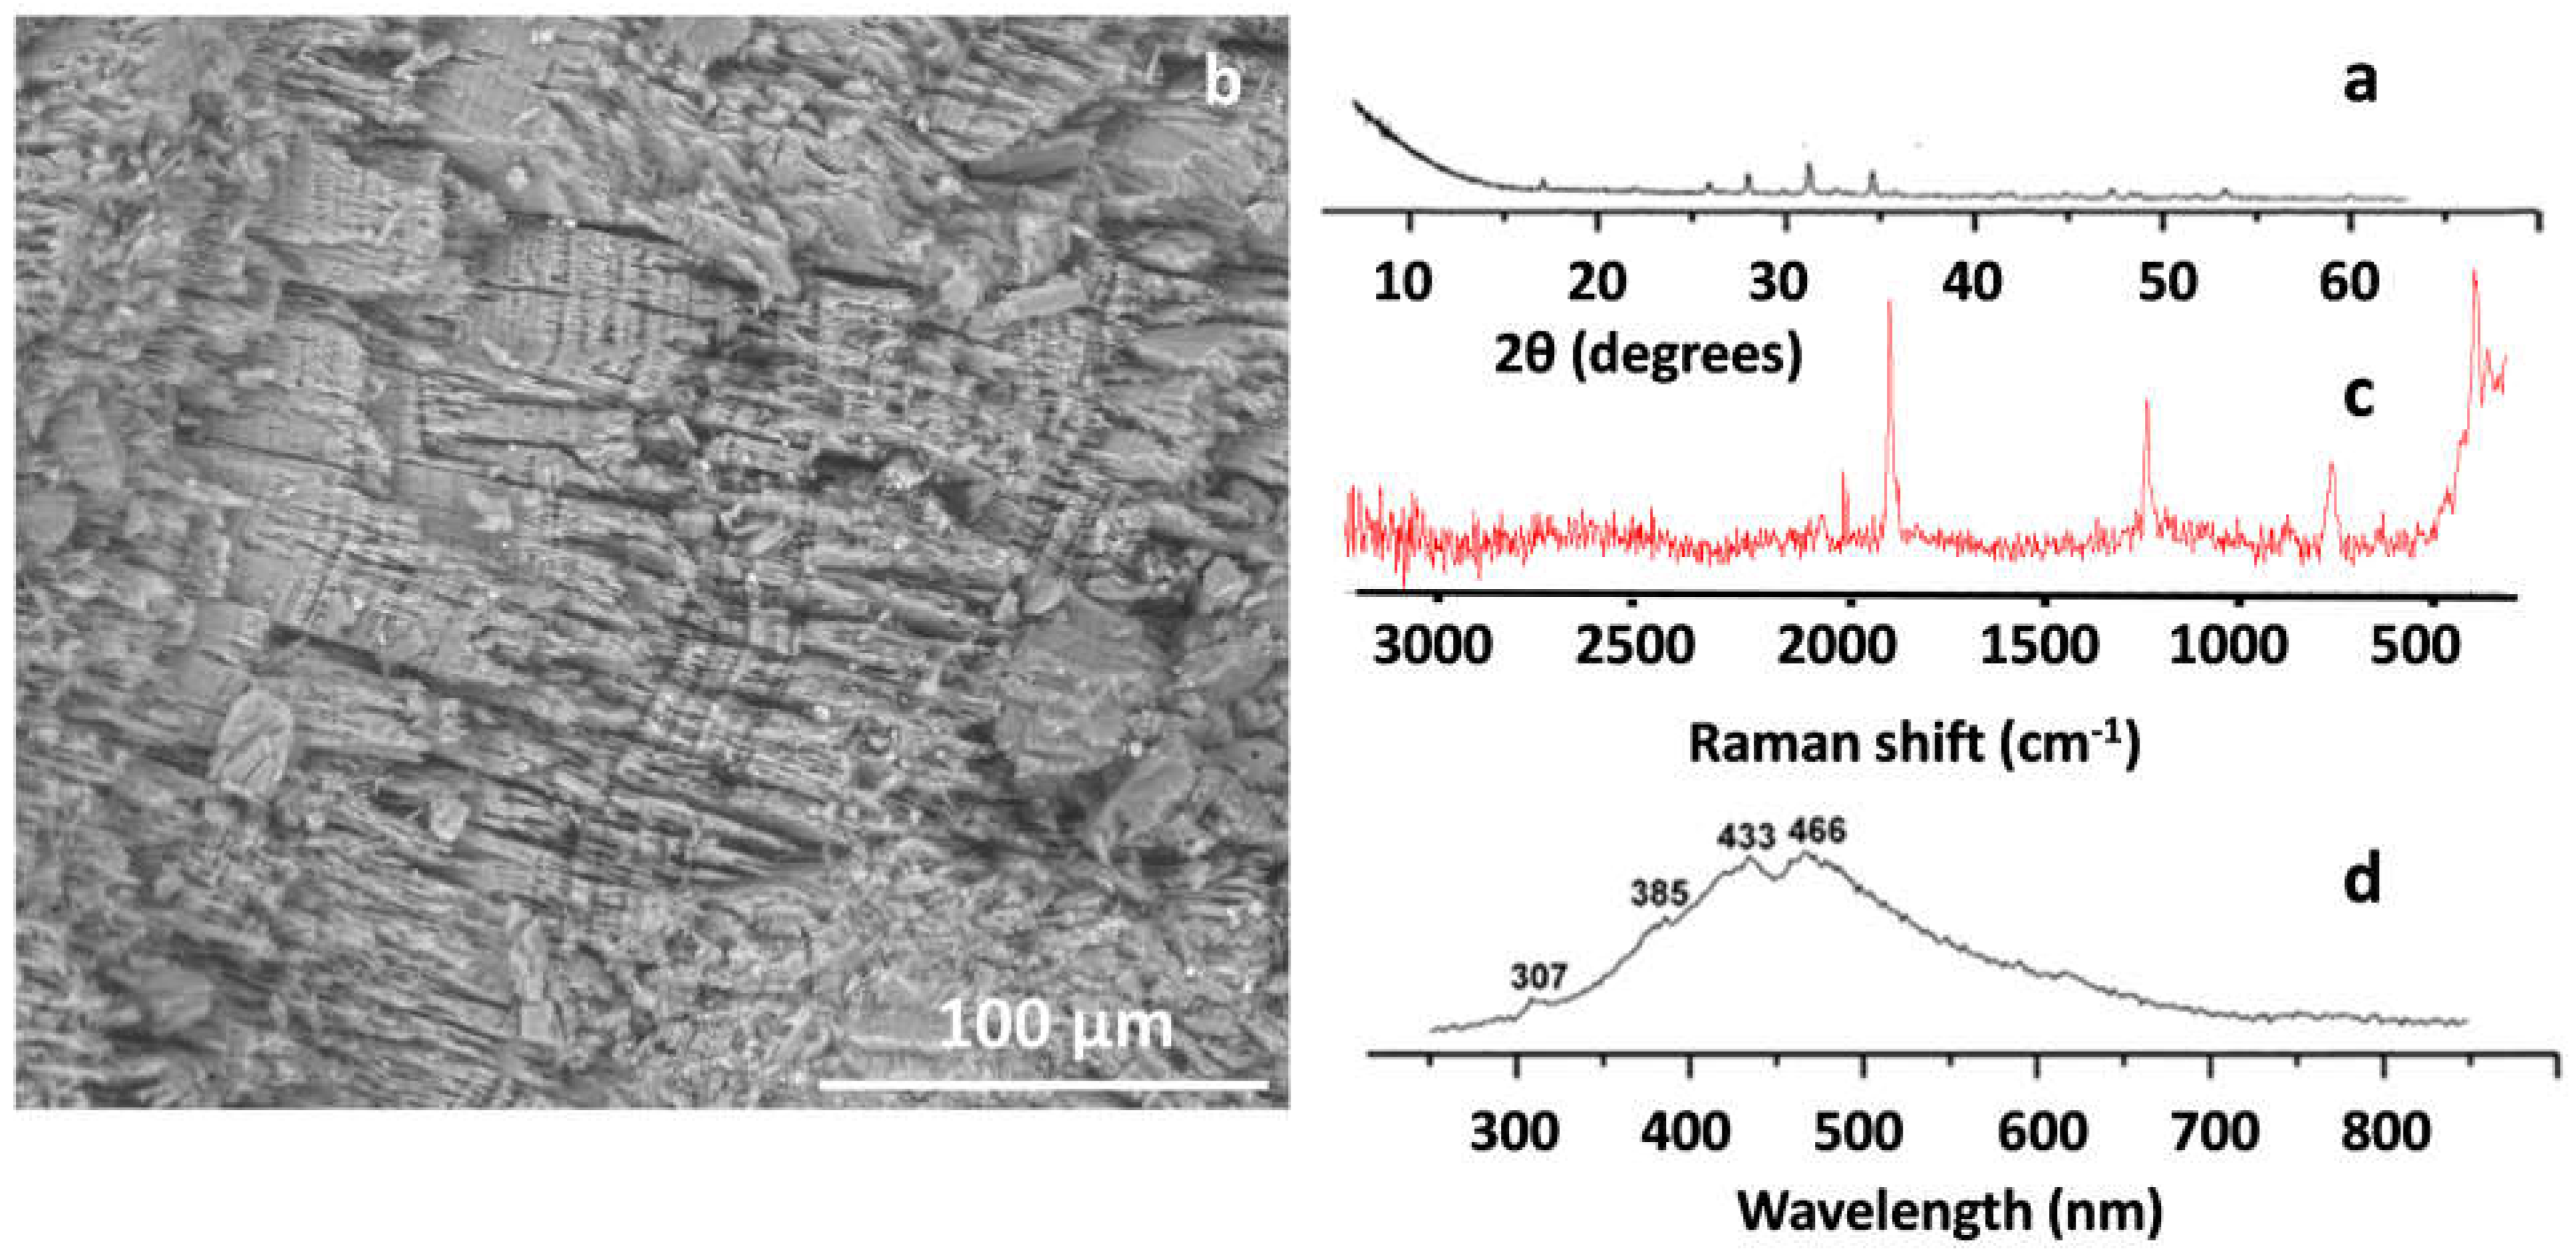
CaC2O4·H2O is a poorly soluble compound, in water a product of low solubility [29] that at 37 °C slightly increases [30], leading to the formation of fibrous crystals. The whewellite structure is related to the monoclinic syngony prismatic class. The elementary cell has the symmetry space group P21/b. The structure responds to X-ray microdiffraction (Figure 1a), with high diffraction peaks at 3.652 Å and 2.357 Å.
Its morphology (Figure 1b) corresponds to its typical monoclinic prisms and clear cleavage, indicating greater pseudorhombic symmetry, and it is calcium oxalate that is usually present in most stones. Crystal equant to short prismatic [001], it is typically distorted with commonly irregularly developed faces. Its twin is very common at {101} as twin and contact plane, with or without reentry angles, heart-shaped or prismatic, and pseudo-orthorhombic in appearance [31].
The crystals, as mentioned before, grow in successive stages with overlapping phases, which suggests a homogeneous nucleation, which triggers the crystallization of the kidney stone due to a supersaturation in the calcium oxalate medium, which will remain in suspension (without crystallization) when other substances appear in the system with a size smaller than the critical size or due to competition in growth because there is not enough space for their development. The Raman spectroscopy and cathodoluminescence (CL) analyses are presented in Figure 1c,d, both agreeing with those obtained by Kuzmanovski et al. [32] in similar materials and by Correcher et al. [33].
Petrova et al. [34] grew whewellite in different mediums. In urine, the crystals took several days to grow up to 30 or 50 µm in size without any impurities: the solution in kidney is always supersaturated with respect to whewellite crystals and conditioning growth rate in urine.
Crystal growth is a process, possibly by adsorption of impurities in the crystallization growth, which can be of the same (homogeneous) or different (heterogeneous) nature. In monomineral crystals, dislocation processes linked to growth can be seen.
3.1.2. Weddellite or Hydrated Calcium Oxalate
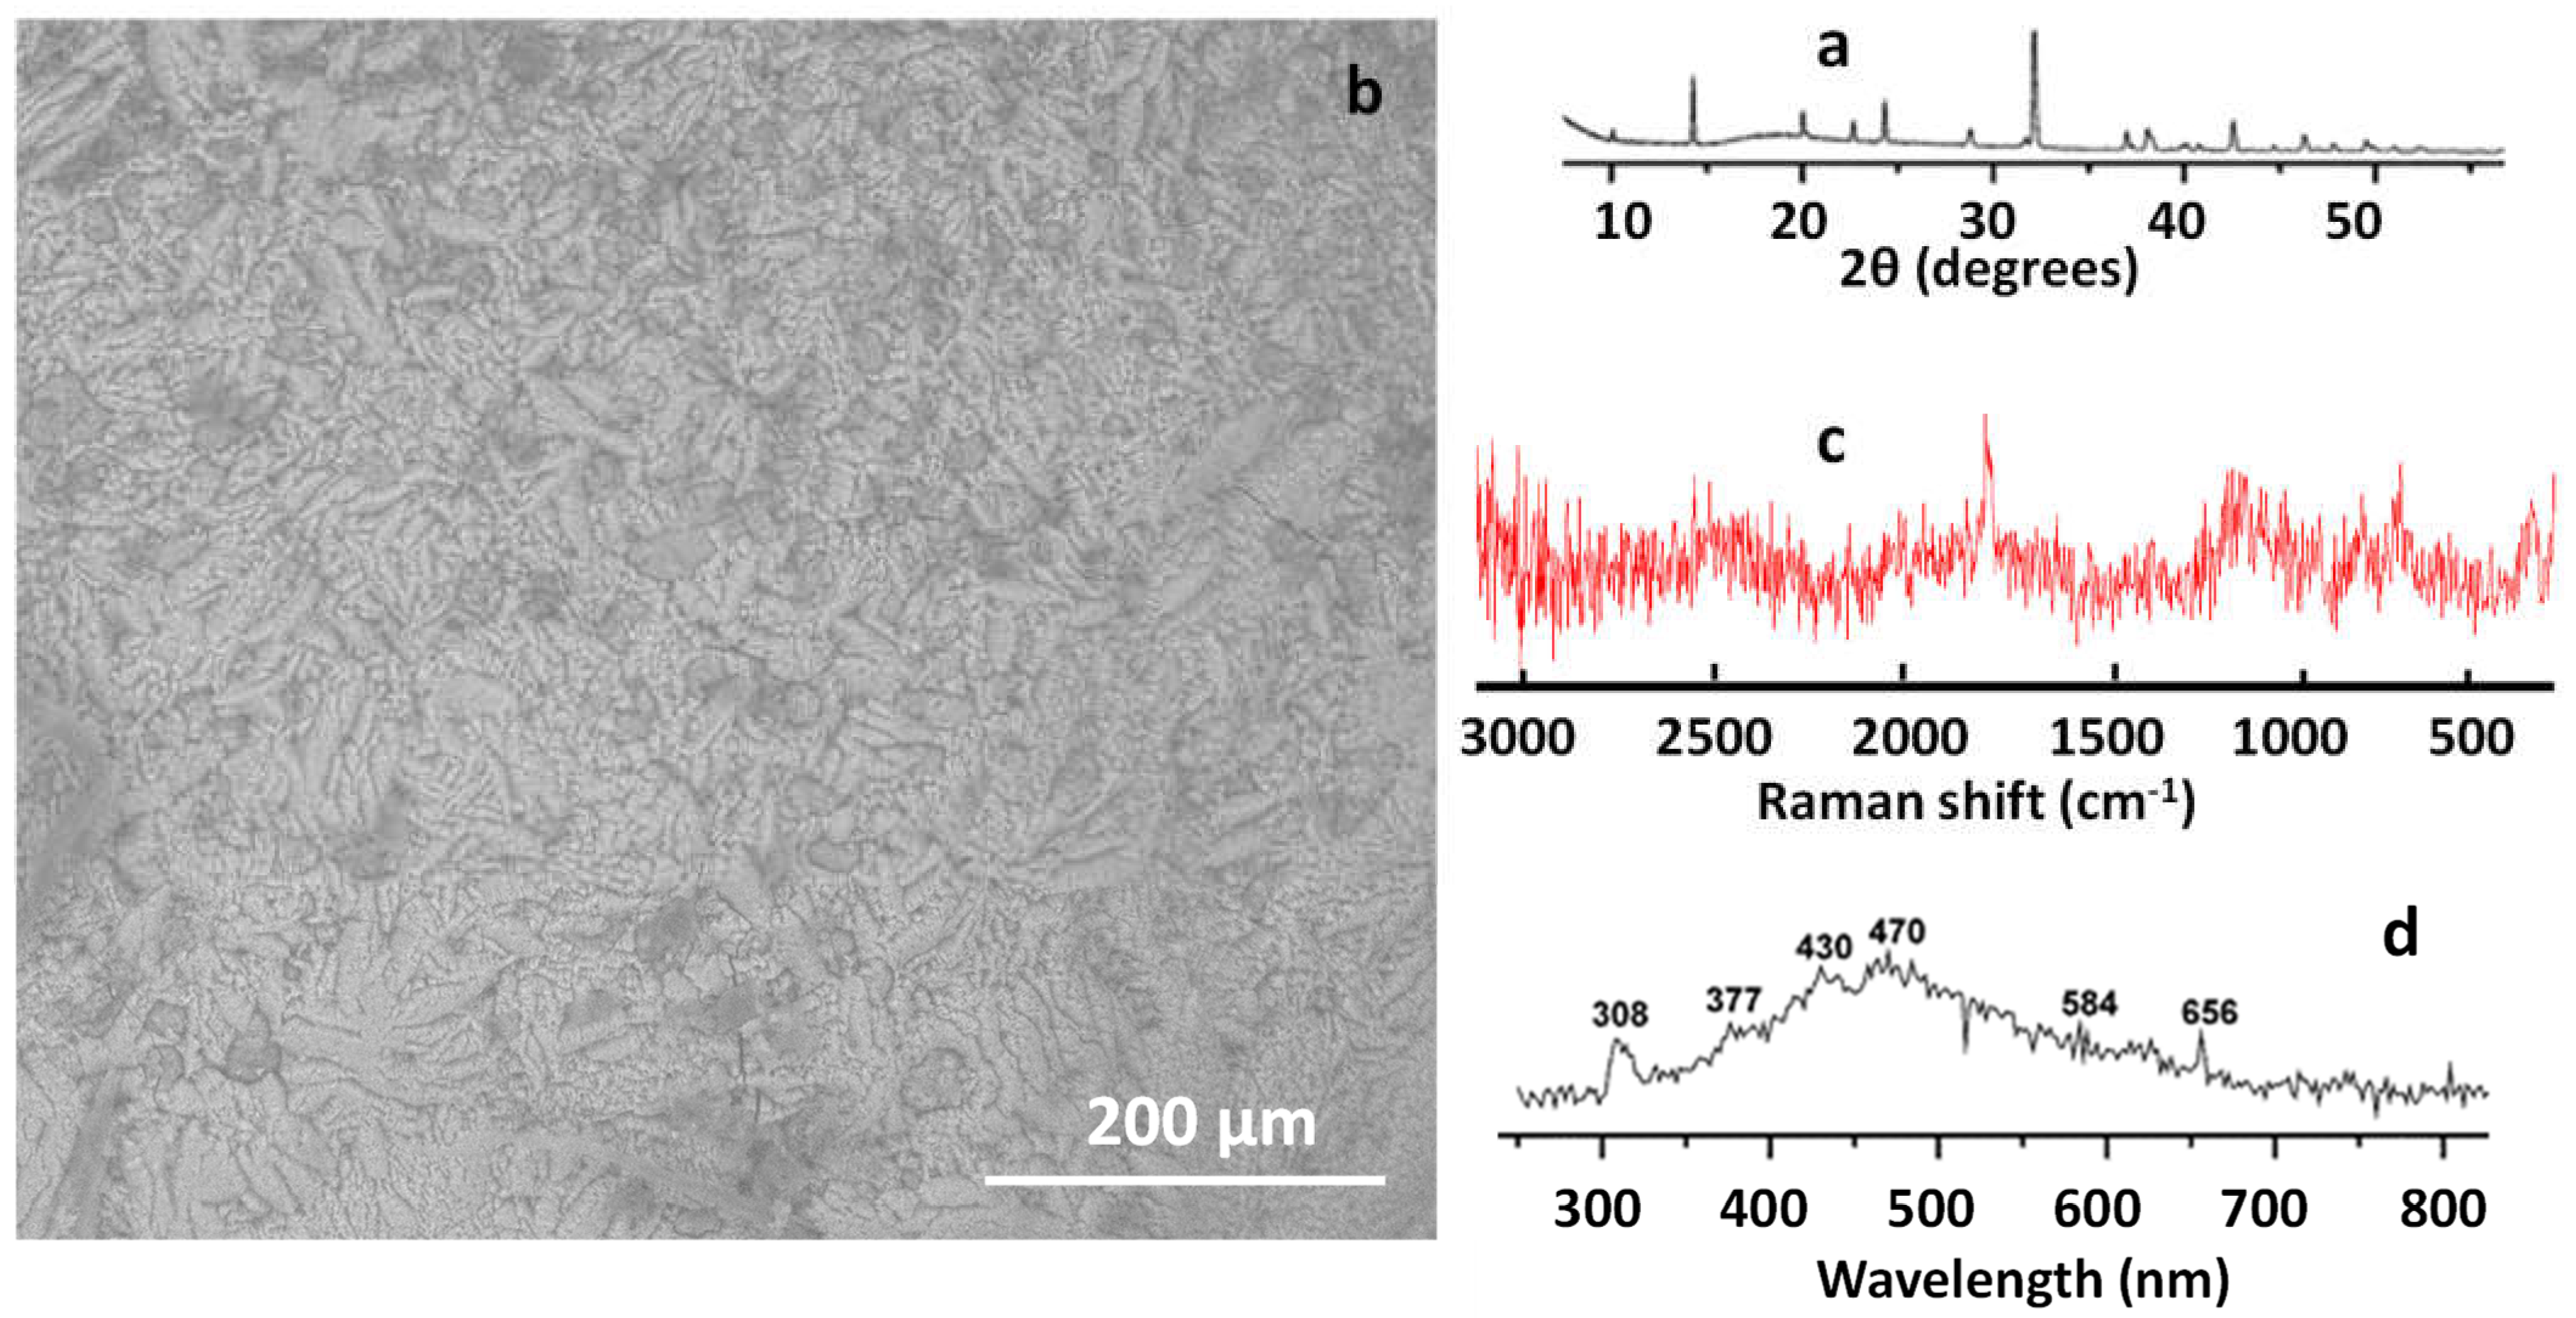
Weddellite has an elementary cell with the space group of symmetry I4/m dipyramidal. The crystals commonly appeared isolated, with {011}, elongated [010], ending in {001}; commonly corroded [35]. The diffraction pattern of the sample is presented in Figure 2a with the diffraction peaks at 2.744 Å, 6.19 Å and 3.35 Å (high intensity) [36]. The formation of a crystallization nucleus is the first stage of the growth of the stone, then, on this nucleus and in successive time periods, the growth of the phases and their aggregation will develop.
The results of Raman spectroscopy correspond with those obtained by Frost and Weier [37] (2004) and CL by cathodoluminescence spectra recorded on solid surfaces with hydrated molecules [38]. Both oxalates are very common biominerals that precipitate when urine is supersaturated in oxalate and calcium, depositing on already crystallized materials such as urate, and forming crystals with typical morphologies for each phase.
3.2. Uricite or Compound Derived from Uric Acid
These compounds are derived from uric acid (uricite, anhydrous uric acid C5HN4O3, dihydrate C5H4N4O3·2H2O or ammonium urate NH4C5H3N4O3); all phases correspond to the organic compounds in the Dana–Strunz classification [39,40]. All of the phases appear within the same kidney stone and form the internal concentric structure [41].
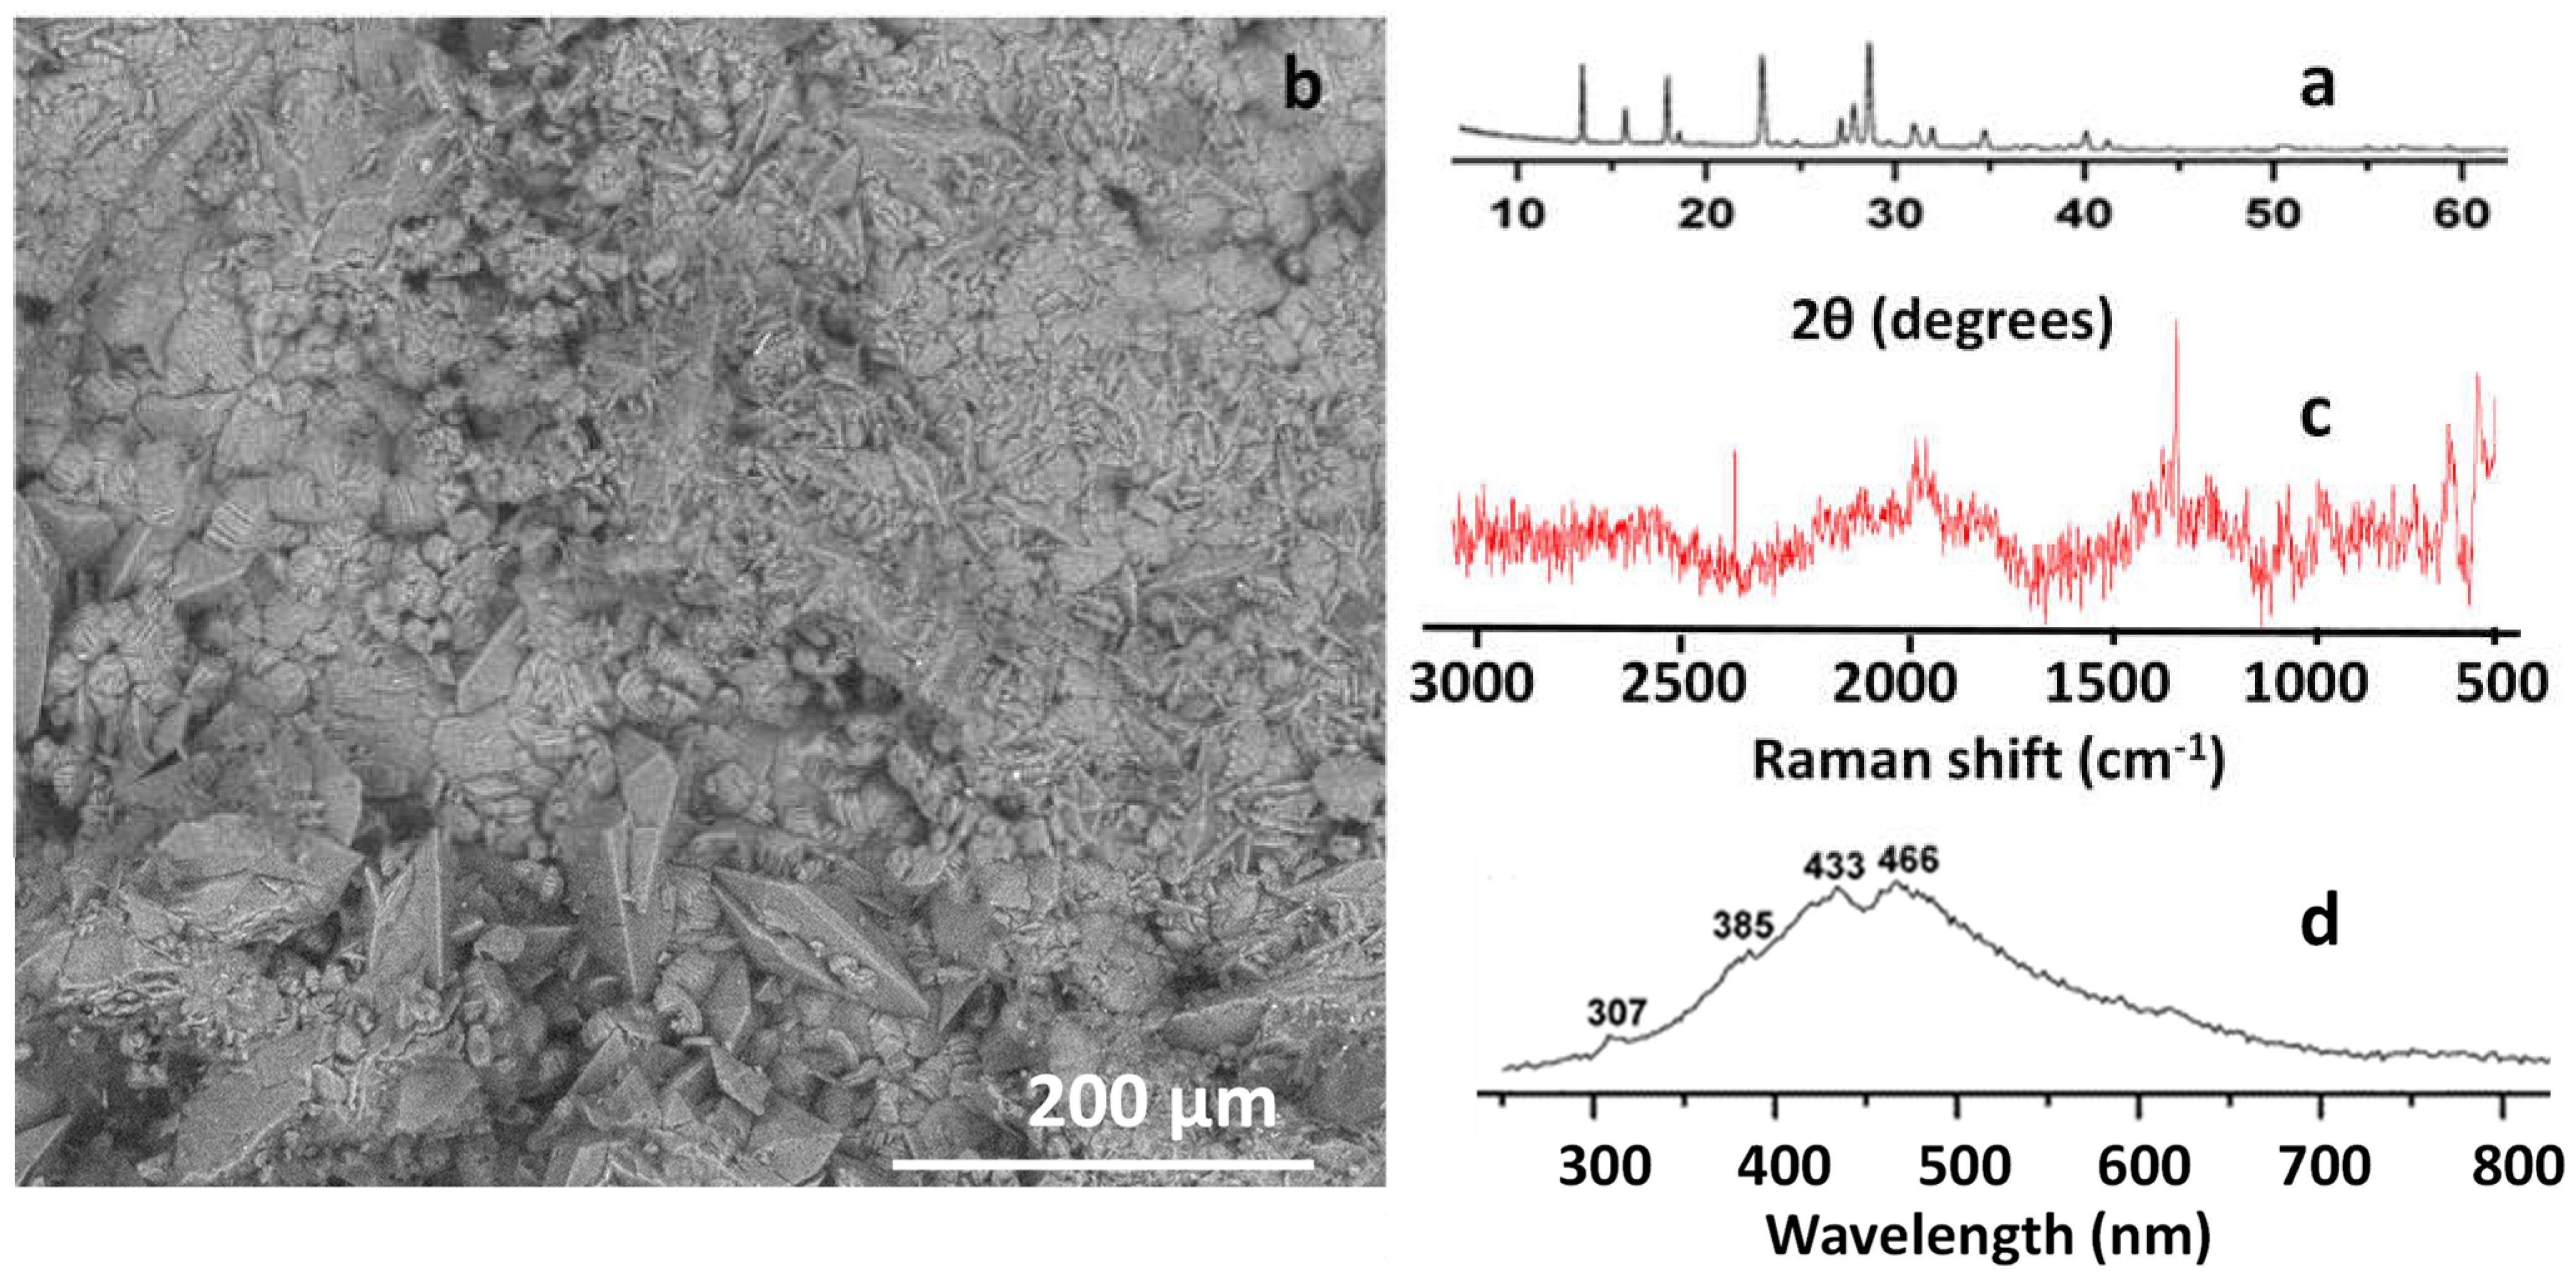
Uric acid is a purine derivative (with a double ring containing carboxylic, amine and ketone groups) that crystallizes in the monoclinic crystallographic system in long acicular crystals (prismatic class 2/m). The structure is formed by molecules of aromatic compounds with a flat morphology that join together through hydrogen bonds, generating a very fine, lamellar structure that, morphologically, is identified with characteristic and very sharp acicular crystals [42]. The very high diffraction peaks are 3.093 Å, 3.087 Å, 4.91 Å and 3.864 Å (Figure 3a). Its morphology has the appearance of interconnected prismatic crystals, like those in Figure 3b, with the Raman and CL spectroscopy results (Figure 3c,d) being like those described by Iordanidis et al. [43].
Uric acid and its corresponding salts constitute, in most kidney stones, the germ of the biomineral nucleation process [44]. Essential phases of these biominerals are considered, which develop from crystallization nuclei of the same or different nature, generating epitaxial growths [45]. Anhydrous uric acid or uricite is the thermodynamically most stable and most common form.
3.3. Cystine
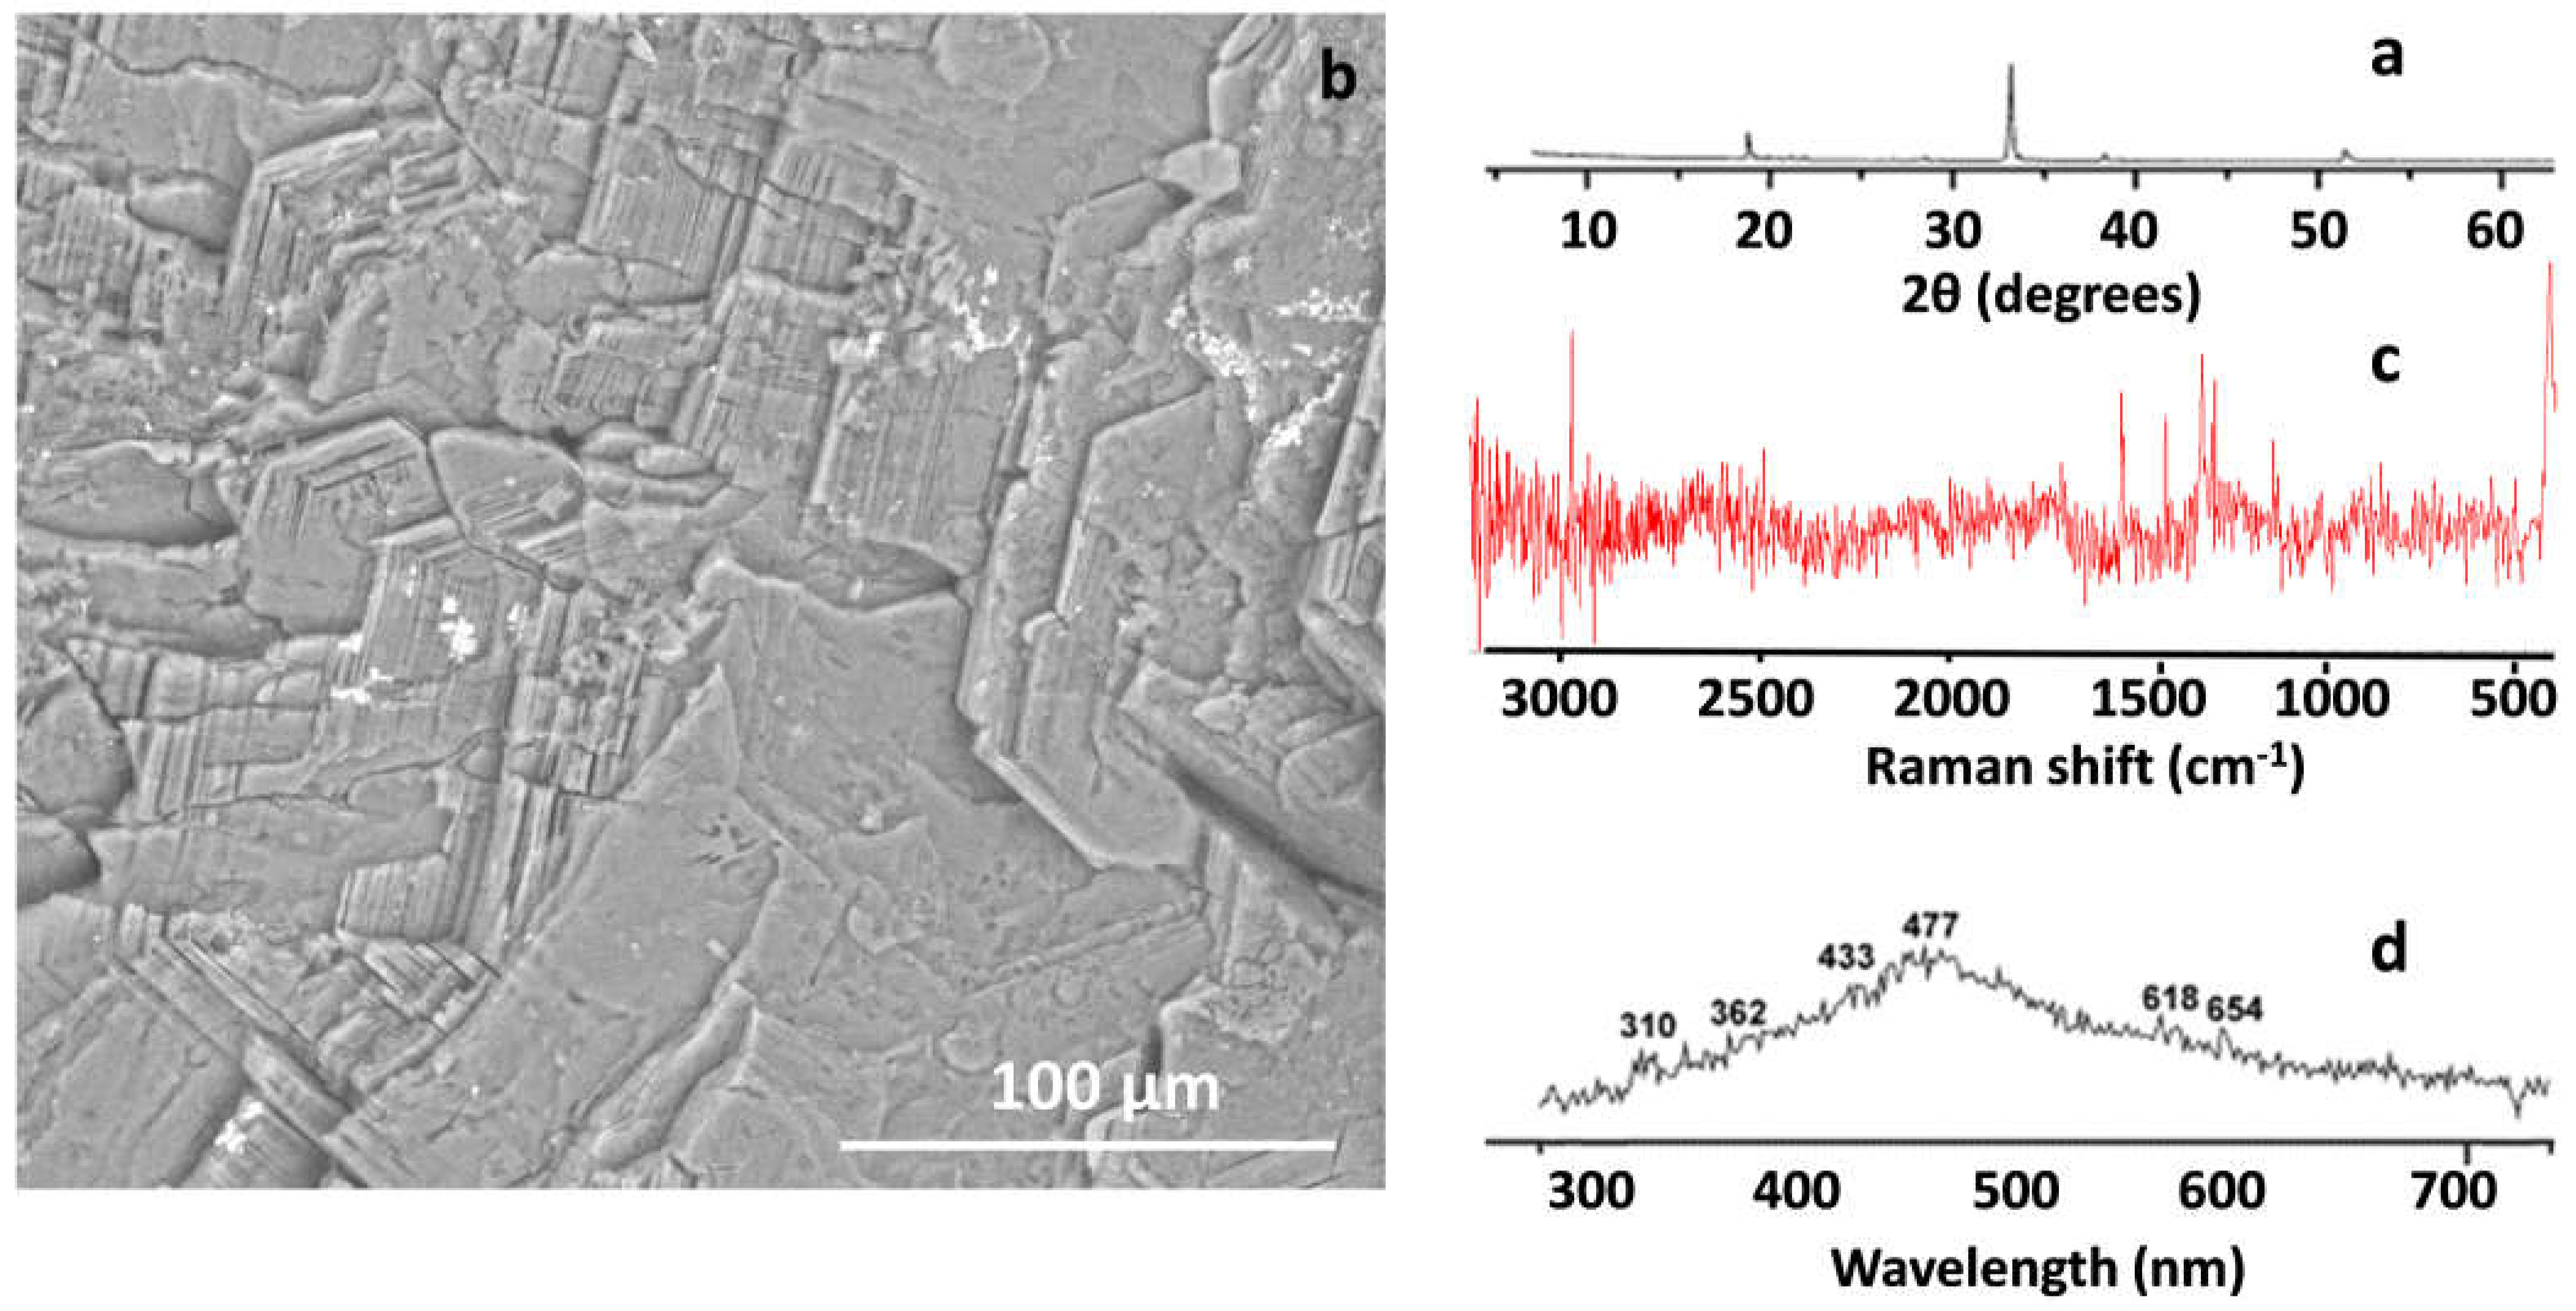
Cystine (SCH2CH(NH2)CO2H)2) is a dimeric amino acid formed by the oxidation of two cysteine residues, which are connected by a disulfide bond, with hexagonal morphology (Figure 4b) and layered superimposed growths and homogeneous nucleation. Their XRD analysis presents characteristic peaks at 3.03 Å and 4.45 Å (Figure 4a). The crystals aggregate in a specific pattern, forming the typical morphology of cystine stones, which is rare in kidney stones [46,47].
The molecules of this phase are placed in layers parallel to the (100) plane, and each sheet consists of a zigzag chain of cystine dimers linked by hydrogen bonds. The chains are joined together by van der Waals forces in the direction of the crystallographic b axis. The aforementioned crystal structure manifests itself morphologically in sheets that grow one on top of another like a book and that, due to the weak van der Waals bond, cleavage in (100) plane. Raman spectroscopy and LC analyses are in Figure 4c,d. Zhang et al. [48] used in his work the characterization by Raman spectroscopy of cystine.
3.4. Phosphates
Phosphates found in kidney stones include the apatite group such as hydroxyapatite (Ca5(PO4)3(OH)), carbonate hydroxyapatite or any of the members of the series; brushite (Ca (PO3OH) 2H2O), whitlockite (Ca9Mg(PO3OH)(PO4)6), and struvite (Mg(NH4)(PO4) 6H2O). The composition of these kidney stones is very difficult because of the many phases formed with the same chemical composition or the combination of different compounds.
3.4.1. Apatite Group
The mineral apatite (Ca5(PO4)3) is the most stable of the calcium phosphate phases over a large pH range. All of the compounds are classified by phosphates, arsenates and vanadates, and their crystallization system is hexagonal [49]. The presence of phosphates is conditioned by pH [50] and presents different phases. By X-ray microdiffraction analysis, phosphates show diffraction peaks at 2.814 Å, 2.778 Å and 3.44 Å. Grases and Llobera [51] for hydroxyapatite, presented a simulation study for kidney stones that aligns with the results obtained in this work (Figure 5a,b). They recognized, by SEM, spherulites of hydroxyapatite that acted as heterogeneous nuclei of calcium salts. Raman and CL analyses were compared with those of Fau et al. [52], and the results were similar.
3.4.2. Struvite
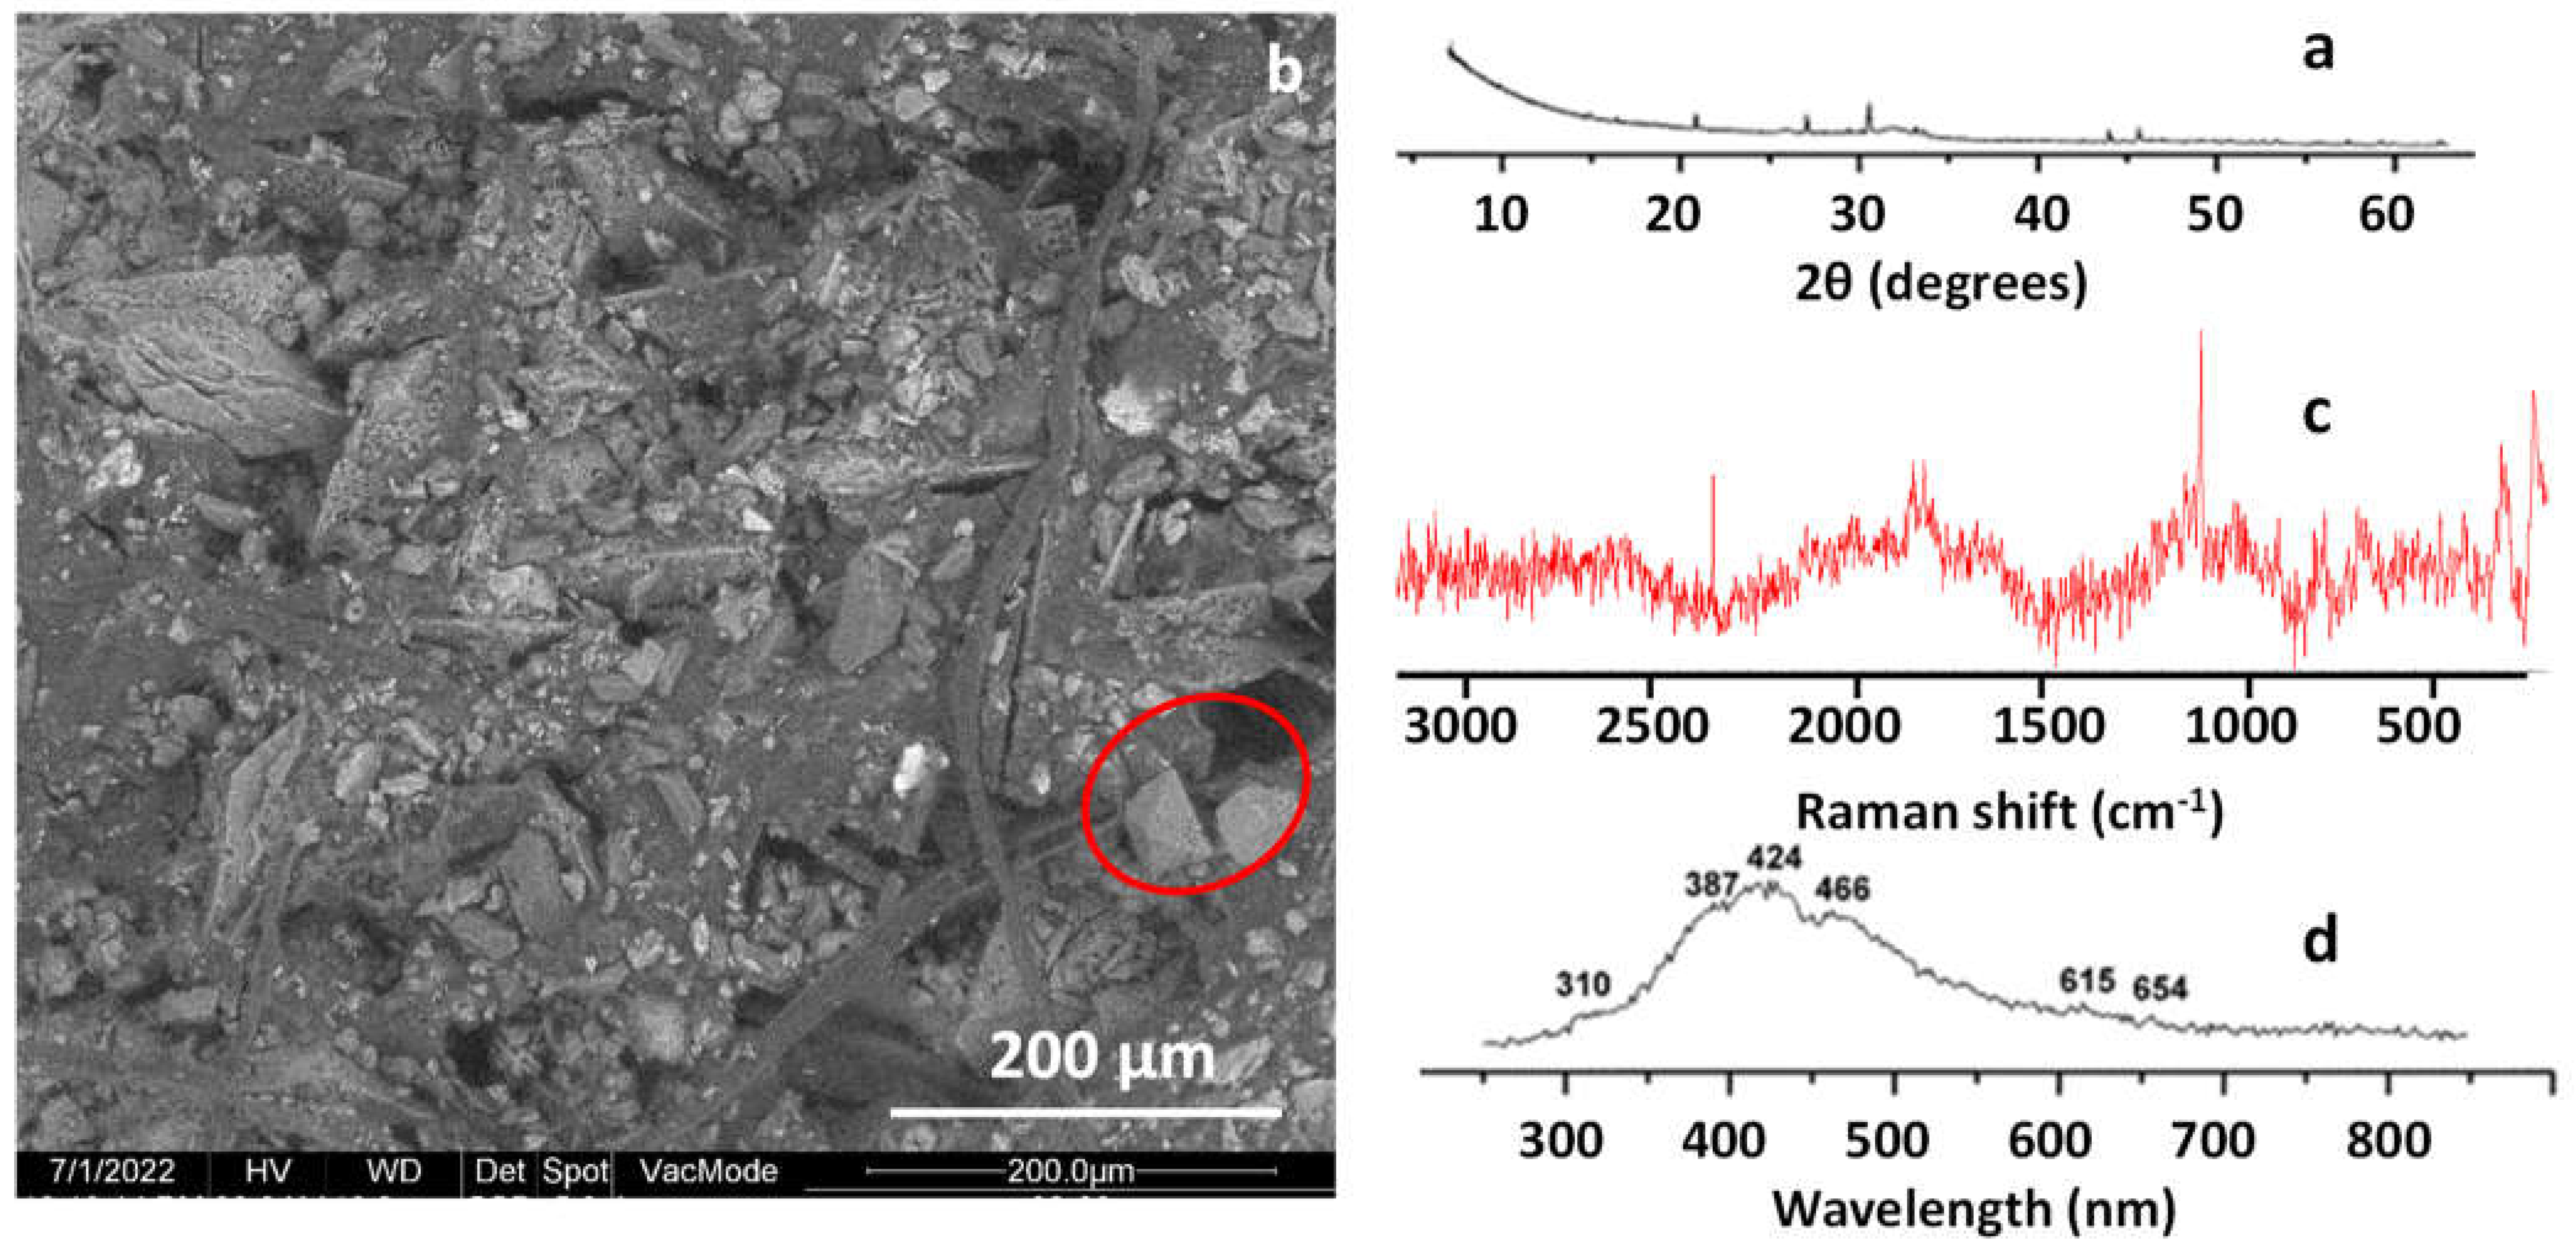
Struvite is a mineral that commonly forms in the urinary tract and is a major component of certain types of kidney stones. Its chemical formula is (NH4)MgPO4·6H2O, and its crystal structure is a combination of magnesium, ammonium, and phosphate ions [53]. The struvite crystallized in the Mm2 orthorhombic pyramidal class. The crystal equant: wedge-shaped (due to large and unequally developed {101} and {101}), coffin-shaped (when viewed along [100]); short prismatic [001], [010], or [100]; thick tabular {100}. The distribution of the pyramidal or dome faces is often irregular, sometimes appearing twined [54].
By XRD analysis, it presented peaks at 5.601 Å, 4.257 Å, 2.919 Å and 2.690 Å (Figure 6a), as described by Whitaker and Jeffery [55], and Ye et al. [56]. Its morphology, by SEM/EDX analysis, frequently offers an orthorhombic pyramid appearance (Figure 6b), indicating very favorable crystallization conditions. The Raman spectra are in Figure 6c) and the peaks are the same as those described by Stefov et al. [50]. CL bands are in Figure 6d). Struvite is a phosphate that generates great disposal problems in the fecal waters of large cities due to its expensive treatment and use as waste [53].
3.4.3. Other Compounds
Among other compounds found in kidney stones, but difficult to fully characterize, are whitlockite, brushite and monetite, all from the group of phosphates, arsenates and vanadates in the Strunz classification and identified together with other major phosphates. Whitlockite, with the formula Ca9Mg(PO4)6(PO3OH), crystallizes in the trigonal system, ditrigonal pyramidal class (3 m). Its structure was studied by Tait et al. [57], recognizing characteristic diffraction peaks at 3.21 Å, 2.88 Å and 2.60 Å.
Also from the group of phosphates, arsenates and vanadates, and with the formula Ca(PO3OH), monetite appears, similar to brushite but crystallizing in the triclinic system, pyramidal class. The crystals are fine and grow on existing ones or on rough surfaces, with radial crystallization. The highest intensity diffraction peaks are at 2.96 Å, 3.35 Å and 3.37 Å [58].
4. Conclusions
Kidney stones are, in general, heterogeneous crystalline formations. The composition includes calcium oxalates, apatite group minerals, struvite, uricite or compounds derived from uric acid, cystine and amorphous material. The existence of one phase only is difficult: coexistence is common.
The following analyses are recommended on the basis of the results obtained in this paper:
XRD is a technique that discriminates crystalline phases, without knowing the nature of the amorphous or low crystallinity phases, whose existence is only known but not identified. It has several advantages, including sample preparation and recording time. The identification of phases in the kidney stones is very easy.
Scanning electron microscopy (SEM) provides morphological features of a sample at very high resolution, revealing crystalline/non-crystalline structural aspects. It is a very visual technique that allows punctual analysis in sequences of different phases with an EDX detector. The analysis in line scan shows the changes in composition along the direction selected.
IR spectroscopy is a traditional technique, but it only identifies functional groups, not species. For this reason, its use in analysis is not advisable. It can be considered a complementary technique to the others described. In the present paper, FTIR analysis was not employed.
The Raman spectroscopy technique is strongly complementary to IR. In the present paper, the results superseded those of FTIR analysis.
Thermogravimetric analysis (TGA) measures changes in the chemical and physical properties of mineral constituents in a sample as a function of temperature, indicating the stages of their decomposition. But the weight loss matches some of the crystals present in the kidney stones. Therefore, it does not help to discriminate the components in the kidney stones extracted. In addition, a large amount of sample is required, which is sometimes not available in urolithiasis.
CL initially was a technique applied to the study of optical and electronic properties in different materials; in kidney stones, it offers important advantages by allowing the detection of the luminescence generated by the individual defects of the different phases involved in the random growth of the kidney stones.
Author Contributions
C.G.-E. carried out the interpretation of the data and the writing of the work. R.G.-G. analyzed the samples and interpreted the results. All authors have read and agreed to the published version of the manuscript.
Funding
This research received no external funding.
Data Availability Statement
The original contributions presented in the study are included in the article, further inquiries can be directed to the corresponding author.
Acknowledgments
Unidad de Litiasis, Litotricia y Endourología. Hospital Universitario Fundación Jiménez Díaz (Madrid, Spain): G. Bueno Serrano, J. Tabares Jiménez y M. Alcoba García. Andrés López de Alda González. Hospital Don Benito (Spain).
Conflicts of Interest
The authors declare no conflicts of interest.
References
- Tsolaki, E.; Bertazzo, S. Pathological Mineralization: The Potential of Mineralomics. Materials 2019, 12, 3126. [Google Scholar] [CrossRef] [PubMed]
- Dick, W.H.; Lingeman, J.E.; Preminger, G.M.; Smith, L.H.; Wilson, D.M.; Shirrell, W.L. Laxative abuse as a cause for ammonium urate renal calculi. J. Urol. 1990, 143, 244–247. [Google Scholar] [CrossRef] [PubMed]
- Pichette, V.; Bonnardeaux, A.; Cardinal, J.; Houde, M.; Nolin, L.; Boucher, A.; Ouimet, D. Ammonium acid urate crystal formation in adult North American stone-formers. Am. J. Kidney Dis. 1997, 30, 237–242. [Google Scholar] [CrossRef]
- Soble, J.J.; Hamilton, B.D.; Streem, S.B. Ammonium acid urate calculi: A reevaluation of risk factors. J. Urol. 1999, 161, 869–873. [Google Scholar] [CrossRef] [PubMed]
- Alelign, T.; Petros, B. Kidney stone disease: An update on current concepts. Adv. Urol. 2018, 2018, 3068365. [Google Scholar] [CrossRef] [PubMed]
- Ferraro, P.M.; Bargagli, M.; Trinchieri, A.; Gambaro, G. Risk of Kidney Stones: Influence of Dietary Factors, Dietary Patterns, and Vegetarian–Vegan Diets. Nutrients 2020, 12, 779. [Google Scholar] [CrossRef] [PubMed]
- Türk, C.; Petrík, A.; Sarica, K.; Seitz, C.; Skolarikos, A.; Straub, M.; Knoll, T. EAU guidelines on diagnosis and conservative management of urolithiasis. Eur. Urol. 2016, 69, 468–474. [Google Scholar] [CrossRef] [PubMed]
- Reynolds, T.M. Chemical pathology clinical investigation and management of nephrolithiasis. J. Clin. Pathol. 2005, 58, 134–140. [Google Scholar] [CrossRef]
- Aggarwal, K.P.; Narula, S.; Kakkar, M.; Tandon, C. Nephrolithiasis: Molecular mechanism of renal stone formation and the critical role played by modulators. BioMed Res. Int. 2013, 2013, 292953. [Google Scholar] [CrossRef]
- Cloutier, J.; Villa, L.; Traxer, O.; Daudon, M. Kidney stone analysis: “Give me your stone, I will tell you who you are!”. World J. Urol. 2014, 33, 157–169. [Google Scholar] [CrossRef]
- Bellahcène, A.; Castronovo, V. Increased expression of osteonectin and osteopontin, two bone matrix proteins, in human breast cancer. Am. J. Pathol. 1995, 146, 95–100. [Google Scholar]
- Coe, F.L.; Evan, A.; Worcester, E. Kidney stone disease. J. Clin. Investig. 2005, 115, 2598–2608. [Google Scholar] [CrossRef] [PubMed]
- Estepa, L.; Daudon, M. Contribution of Fourier transform infrared spectroscopy. Biospectroscopy 1997, 3, 347–369. [Google Scholar] [CrossRef]
- Khan, A.H.; Imran, S.; Talati, J.; Jafri, L. Fourier transform infrared spectroscopy for analysis of kidney stones. Investig. Clin. Urol. 2018, 59, 32–40. [Google Scholar] [CrossRef] [PubMed]
- Mukherjee, A.K. Human kidney stone analysis using X-ray powder diffraction. J. Indian Inst. Sci. 2014, 94, 35–44. [Google Scholar]
- Mercimek, M.N.; Ender, O. Effect of urinary stone disease and its treatment on renal function. World J. Nephrol. 2015, 4, 271–276. [Google Scholar] [PubMed]
- Kubala-Kukus, A.; Arabski, M.; Stabrawa, I.; Banas, D.; Rózanski, W.; Lipinski, M.; Majewska, U.; Wudarczyk-Mocko, J.; Braziewicz, J.; Pajek, M.; et al. Application of TXRF and XRPD techniques for analysis of elemental and chemical composition of human kidney stones. X-Ray Spectrom. 2017, 46, 412–420. [Google Scholar] [CrossRef]
- Singh, V.K.; Rai, A.K.; Rai, P.K.; Jindal, P.K. Cross-sectional study of kidney stones by laser-induced breakdown spectroscopy. Lasers Med. Sci. 2009, 24, 749–759. [Google Scholar] [CrossRef]
- Carpentier, X.; Bazin, D.; Combes, C.; Mazouyes, A.; Rouzière, S.; Albouy, P.A.; Foy, E.; Daudon, M. High Zn content of Randall’s plaque: A l-X-ray fluorescence investigation. J. Trace Elem. Med. Biol. 2011, 25, 160–165. [Google Scholar] [CrossRef]
- Oztoprak, B.G.; González, J.; Yoo, J.; Gulecen, T.; Mutlu, N.; Russo, R.E.; Gundogdu, O.; Demir, A. Analysis and Classification of Heterogeneous Kidney Stones Using Laser-Induced Breakdown Spectroscopy (LIBS). Appl. Spectrosc. 2012, 66, 1353–1361. [Google Scholar] [CrossRef]
- Vašinová Galiová, M.; Copjaková, R.; Škoda, R.; Štepánková, K.; Vanková, M.; Kuta, J.; Prokeš, L.; Kynicky, J.; Kanicky, V. 2D elemental mapping of sections of human kidney stones using laser ablation inductively-coupled plasma-mass spectrometry: Possibilities and limitations. Spectrochim. Acta Part B At. Spectrosc. 2014, 100, 105–115. [Google Scholar] [CrossRef]
- Tonannavar, J.; Deshpande, G.; Yenagi, J.; Patil, S.B.; Patil, N.A.; Mulimani, B.G. Identification of mineral compositions in some renal calculi by FT Raman and IR spectral analysis. Spectrochim. Acta Part A Mol. Biomol. Spectrosc. 2016, 154, 20–26. [Google Scholar] [CrossRef]
- Singh, V.K.; Rai, P.K. Kidney stone analysis techniques and the role of major and trace elements on their pathogenesis: A review. Biophys. Rev. 2014, 6, 291–310. [Google Scholar] [CrossRef]
- Lee, H.P.; Leong, D.; Heng, C.T. Characterization of kidney stones using thermogravimetric analysis with electron dispersive spectroscopy. Urol. Res. 2012, 40, 197–204. [Google Scholar] [CrossRef] [PubMed]
- Uvarov, V.; Popov, I.; Shapur, N.; Abdin, T.; Gofrit, O.N.; Pode, D.; Duvdevani, M. X ray diffraction and SEM study of kidney stones in Israel: Quantitative analysis, crystallite size determination, and statistical characterization. Environ. Geochem. Health. 2011, 33, 613–622. [Google Scholar] [CrossRef] [PubMed]
- Racek, M.; Racek, J.; Hupáková, I. Scanning electron microscopy in analysis of urinary stones. Scand. J. Clin. Lab. Investig. 2019, 79, 208–217. [Google Scholar] [CrossRef] [PubMed]
- Conti, C.; Casati, M.; Colombo, C.; Possenti, E.; Realini, M.; Gatta, G.D.; Merlini, M.; Brambilla, L.; Zerbi, G. Synthesis of calcium oxalate trihydrate: New data by vibrational spectroscopy and synchrotron X-ray diffraction. Spectrochim. Acta A Mol. Biomol. Spectrosc. 2015, 150, 721–730. [Google Scholar] [CrossRef]
- Frost, R.L.; Weier, M.L. Raman spectroscopy of natural oxalates at 298 and 77 K. J. Raman Spectrosc. 2003, 34, 776–785. [Google Scholar] [CrossRef]
- Tomson, M.B.; Nancollas, G.H. Mineralization Kinetics: A Constant Composition Approach. Science 1978, 200, 1059–1060. [Google Scholar] [CrossRef] [PubMed]
- Blomen, J.M.J.; Will, E.J.; Bijvoet, O.L.M.; van der Linden, H. Growth kinetics of calcium oxalate monohydrate: II. The variation of seed concentration. J. Cryst. Growth 1983, 64, 306–315. [Google Scholar] [CrossRef]
- Tazzoli, V.; Domeneghetti, M.C. The crystal structures of whewellite and weddellite: Re-examination and comparison. Am. Mineral. 1980, 65, 327–334. [Google Scholar]
- Kuzmanovski, I.; Trpkovska, M.; Soptrajanov, B.; Stefov, V. Determination of the composition of human urinary calculi composed of whewellite, weddellite and carbonate apatite using artificial neural networks. Anal. Chim. Acta 2003, 491, 211–218. [Google Scholar] [CrossRef]
- Correcher, V.; Briatte, C.; Boronat, C.; Garcia-Guinea, J. Radiation effect on cathodoluminescence and thermoluminescence emission of Ca-rich oxalates from the human body. Luminescence 2018, 33, 1438–1444. [Google Scholar] [CrossRef] [PubMed]
- Petrova, E.V.; Gvozdev, N.V.; Rashkovich, L.N. Growth and dissolution of calcium oxalate monohydrate (COM) crystals. J. Optoelectron. Adv. Mater. 2004, 6, 261–268. [Google Scholar]
- Izatulina, A.; Gurzhiy, V.; Frank-Kamenetskaya, O. Weddellite from renal stones: Structure refinement and dependence of crystal chemical features on H2O content. Am. Mineral. 2014, 99, 2–7. [Google Scholar] [CrossRef]
- Sterling, C. Crystal-structure analysis of weddellite, CaC2O4·(2 + x)H2O. Acta Crystallogr. 1965, 18, 917–921. [Google Scholar] [CrossRef]
- Frost, R.L.; Weier, M.L. Thermal treatment of whewellite-a thermal analysis and Raman spectroscopy study. Thermochim. Act. 2004, 409, 79–85. [Google Scholar] [CrossRef]
- García-Guinea, J.; Correcher, V.; Canc, N.; Garrido, F.; Townsend, P.D. Cathodoluminescence spectra recorded from surfaces of solids with hydrous molecules. J. Electron Spectrosc. Relat. Phenom. 2018, 227, 1–8. [Google Scholar] [CrossRef]
- Bridge, P.J. Guanine and uricite, two new organic minerals from Peru and Western Australia. Mineral. Mag. 1974, 39, 889–890. [Google Scholar] [CrossRef]
- Lonsdale, K.; Mason, P. Uric acid, uric acid dihydrate, and urates in urinary calculi, ancient and modern. Science 1966, 152, 1511–1512. [Google Scholar] [CrossRef] [PubMed]
- Izzo, F.; Langella, A.; Germinario, C.; Grifa, C.; Varricchio, E.; Di Meo, M.C.; Salzano, L.; Lotrecchiano, G.; Mercurio, M. Morpho-Constitutional Classification of Urinary Stones as Prospective Approach for the Management of Human Pathological Biomineralization: New Insights from Southern Italy. Minerals 2022, 12, 1421. [Google Scholar] [CrossRef]
- Ringertz, H. The molecular and crystal structure of uric acid. Acta Crystallogr. 1966, 20, 397–403. [Google Scholar] [CrossRef]
- Iordanidis, A.; García-Guinea, J.; Giousef, C.; Angelopoulos, A.; Doulgerakis, M.; Papadopoulou, L. Characterization of Gallbladder Stones from Cholelithiasis Patients of Northern Greece, Using Complementary Techniques. Spectrosc. Lett. 2013, 46, 301–306. [Google Scholar] [CrossRef]
- Iwata, H.; Abe, Y.; Nishio, S.; Wakatsuki, A.; Ochi, K.; Takeuchi, M. Crystal-Matrix Interrelations in Brushite and Uric Acid Calculi. J. Urol 1987, 135, 397–401. [Google Scholar] [CrossRef]
- Boistelle, R.; Rinaudo, C. Phase transition and epitaxies between hydrated orthorhombic and anhydrous monoclinic uric acid crystals. J. Cryst. Growth 1981, 53, 1–9. [Google Scholar] [CrossRef]
- Duqué, M.; Desmons, A.; Thioulouse, E.; Baudin, B. Des calculs rénaux de cysteine. Rev. Francoph. Lab. 2019, 516, 67–70. [Google Scholar]
- Guo, X.; Schmiege, P.; Assafa, T.E.; Wang, R.; Xu, Y.; Donnelly, L.; Fone, M.; Ni, X.; Jiang, J.; Millhauser, G.; et al. Structure and mechanism of human cystine exporter cystinosin. Cell 2022, 185, 3739–3752. [Google Scholar] [CrossRef] [PubMed]
- Zhang, X.; Zhu, Z.; Bian, Y.; Zeng, R.; Zhou, W.; Yang, B. Combinatorial method to investigate cystine enantiomers using vibrational spectroscopies. Infrared Phys. Technol. 2022, 127, 104406. [Google Scholar] [CrossRef]
- Fleet, M.E.; Liu, X.; King, P.L. Accommodation of the carbonate ion in apatite: An FTIR and X-ray structure study of crystals synthesized at 2–4 GPa. Am. Mineral. 2004, 89, 1422–1432. [Google Scholar] [CrossRef]
- Stefov, V.; Soptrajanov, B.; Kuzmanovski, I.; Lutzc, H.D.; Engelen, B. Infrared and Raman spectra of magnesium ammonium phosphate hexahydrate (struvite) and its isomorphous analogues. III. Spectra of protiated and partially deuterated magnesium ammonium phosphate hexahydrate. J. Mol. Struct. 2005, 752, 60–67. [Google Scholar] [CrossRef]
- Grases, F.; Llobera, A. Experimental model to study sedimentary kidney stones. Micron 1998, 29, 105–111. [Google Scholar] [CrossRef] [PubMed]
- Fau, A.; Beyssac, O.; Gauthier, M.; Panczer, G.; Gasnault, O.; Meslin, P.Y.; Bernard, S.; Maurice, S.; Forni, O.; Boulliard, J.C.; et al. Time-resolved Raman and luminescence spectroscopy of synthetic REE-doped hydroxylapatites and natural apatites. Am. Mineral. 2022, 107, 1341–1352. [Google Scholar] [CrossRef]
- Li, Y.; Xu, D.; Lin, H.; Wang, W.; Yang, H. Nutrient released characteristics of struvite-biochar fertilizer produced from concentrated sludge supernatant by fluidized bed reactor. J. Environ. Manag. 2023, 325, 116548. [Google Scholar] [CrossRef] [PubMed]
- Ferraris, G.; Fuess, H.; Joswig, W. Neutron diffraction study of MgNH4PO4*6H2O (struvite) and survey of water molecules donating short hydrogen bonds. Acta Crystallogr. B 1986, 42, 253–258. [Google Scholar] [CrossRef]
- Whitaker, A.; Jeffery, J.W. The crystal structure of struvite, MgNH4PO4.6H2O. Acta Crystallogr. B 1970, 26, 1429–1440. [Google Scholar] [CrossRef]
- Ye, Z.; Shen, Y.; Ye, X.; Zhang, Z.; Chen, S.; Shi, J. Phosphorus recovery from wastewater by struvite crystallization: Property of aggregates. J. Environ. Sci. 2014, 26, 991–1000. [Google Scholar] [CrossRef]
- Tait, K.T.; Barkley, M.C.; Thompson, R.M.; Origlieri, M.J.; Evans, S.H.; Prewitt, C.T.; Yang, H. Bobdownsite, a new mineral species from Big Fish River, Yukon, Canada, and its structural relationship with whitlockite-type compounds. Can. Mineral. 2011, 49, 1065–1078. [Google Scholar] [CrossRef]
- Catti, M.; Ferraris, G.; Filhol, A. Hydrogen bonding in the crystalline state. CaHPO4 (monetite), P-1; or P1? A novel neutron diffraction study. Acta Crystallogr. B 1977, 33, 1223–1229. [Google Scholar] [CrossRef]
Figure 1.
Whewellite. (a) X-ray microdiffraction analysis, (b) SEM/EDX analyses, (c) Raman analysis, (d) CL analysis.
Figure 1.
Whewellite. (a) X-ray microdiffraction analysis, (b) SEM/EDX analyses, (c) Raman analysis, (d) CL analysis.

Figure 2.
Weddellite. (a) X-ray microdiffraction analysis, (b) SEM/EDX analysis, (c) Raman analysis, (d) CL analysis.
Figure 2.
Weddellite. (a) X-ray microdiffraction analysis, (b) SEM/EDX analysis, (c) Raman analysis, (d) CL analysis.

Figure 3.
Uricite: (a) X-ray microdiffraction analysis, (b) SEM/EDX analysis, (c) Raman analysis, (d) CL analysis.
Figure 3.
Uricite: (a) X-ray microdiffraction analysis, (b) SEM/EDX analysis, (c) Raman analysis, (d) CL analysis.

Figure 4.
Cystine: (a) X-ray microdiffraction analysis, (b) SEM/EDX analysis, (c) Raman analysis, (d) CL analysis.
Figure 4.
Cystine: (a) X-ray microdiffraction analysis, (b) SEM/EDX analysis, (c) Raman analysis, (d) CL analysis.

Figure 5.
Calcium phosphate hexahydrate: (a) X-ray microdiffraction analysis, (b) SEM/EDX analysis, (c) Raman analysis, (d) CL analysis.
Figure 5.
Calcium phosphate hexahydrate: (a) X-ray microdiffraction analysis, (b) SEM/EDX analysis, (c) Raman analysis, (d) CL analysis.

Figure 6.
Struvite: (a) X-ray microdiffraction analysis, (b) SEM/EDX analysis (crystal orthorhombic pyramidal; the red circle corresponds to struvite crystals), (c) Raman analysis, (d) CL analysis.
Figure 6.
Struvite: (a) X-ray microdiffraction analysis, (b) SEM/EDX analysis (crystal orthorhombic pyramidal; the red circle corresponds to struvite crystals), (c) Raman analysis, (d) CL analysis.


Table 1.
Predominance of phases studied in the kidney stones.
| Phases | Madrid (%) | Badajoz (%) |
|---|---|---|
| Uricine | 35 | 15 |
| Whewellite | 40 | 50 |
| Weddellite | 5 | 20 |
| Cystine | 5 | 0 |
| Apatite group | 20 | 10 |
| Struvite | 30 | 5 |
Disclaimer/Publisher’s Note: The statements, opinions and data contained in all publications are solely those of the individual author(s) and contributor(s) and not of MDPI and/or the editor(s). MDPI and/or the editor(s) disclaim responsibility for any injury to people or property resulting from any ideas, methods, instructions or products referred to in the content. |
© 2024 by the authors. Licensee MDPI, Basel, Switzerland. This article is an open access article distributed under the terms and conditions of the Creative Commons Attribution (CC BY) license (https://creativecommons.org/licenses/by/4.0/).
Share and Cite
MDPI and ACS Style
González-Enguita, C.; García-Giménez, R. Kidney Stones: Crystal Characterization. Crystals 2024, 14, 238. https://doi.org/10.3390/cryst14030238
AMA Style
González-Enguita C, García-Giménez R. Kidney Stones: Crystal Characterization. Crystals. 2024; 14(3):238. https://doi.org/10.3390/cryst14030238
Chicago/Turabian StyleGonzález-Enguita, Carmen, and Rosario García-Giménez. 2024. "Kidney Stones: Crystal Characterization" Crystals 14, no. 3: 238. https://doi.org/10.3390/cryst14030238
Note that from the first issue of 2016, this journal uses article numbers instead of page numbers. See further details here.