3.1. Isochronal DSC
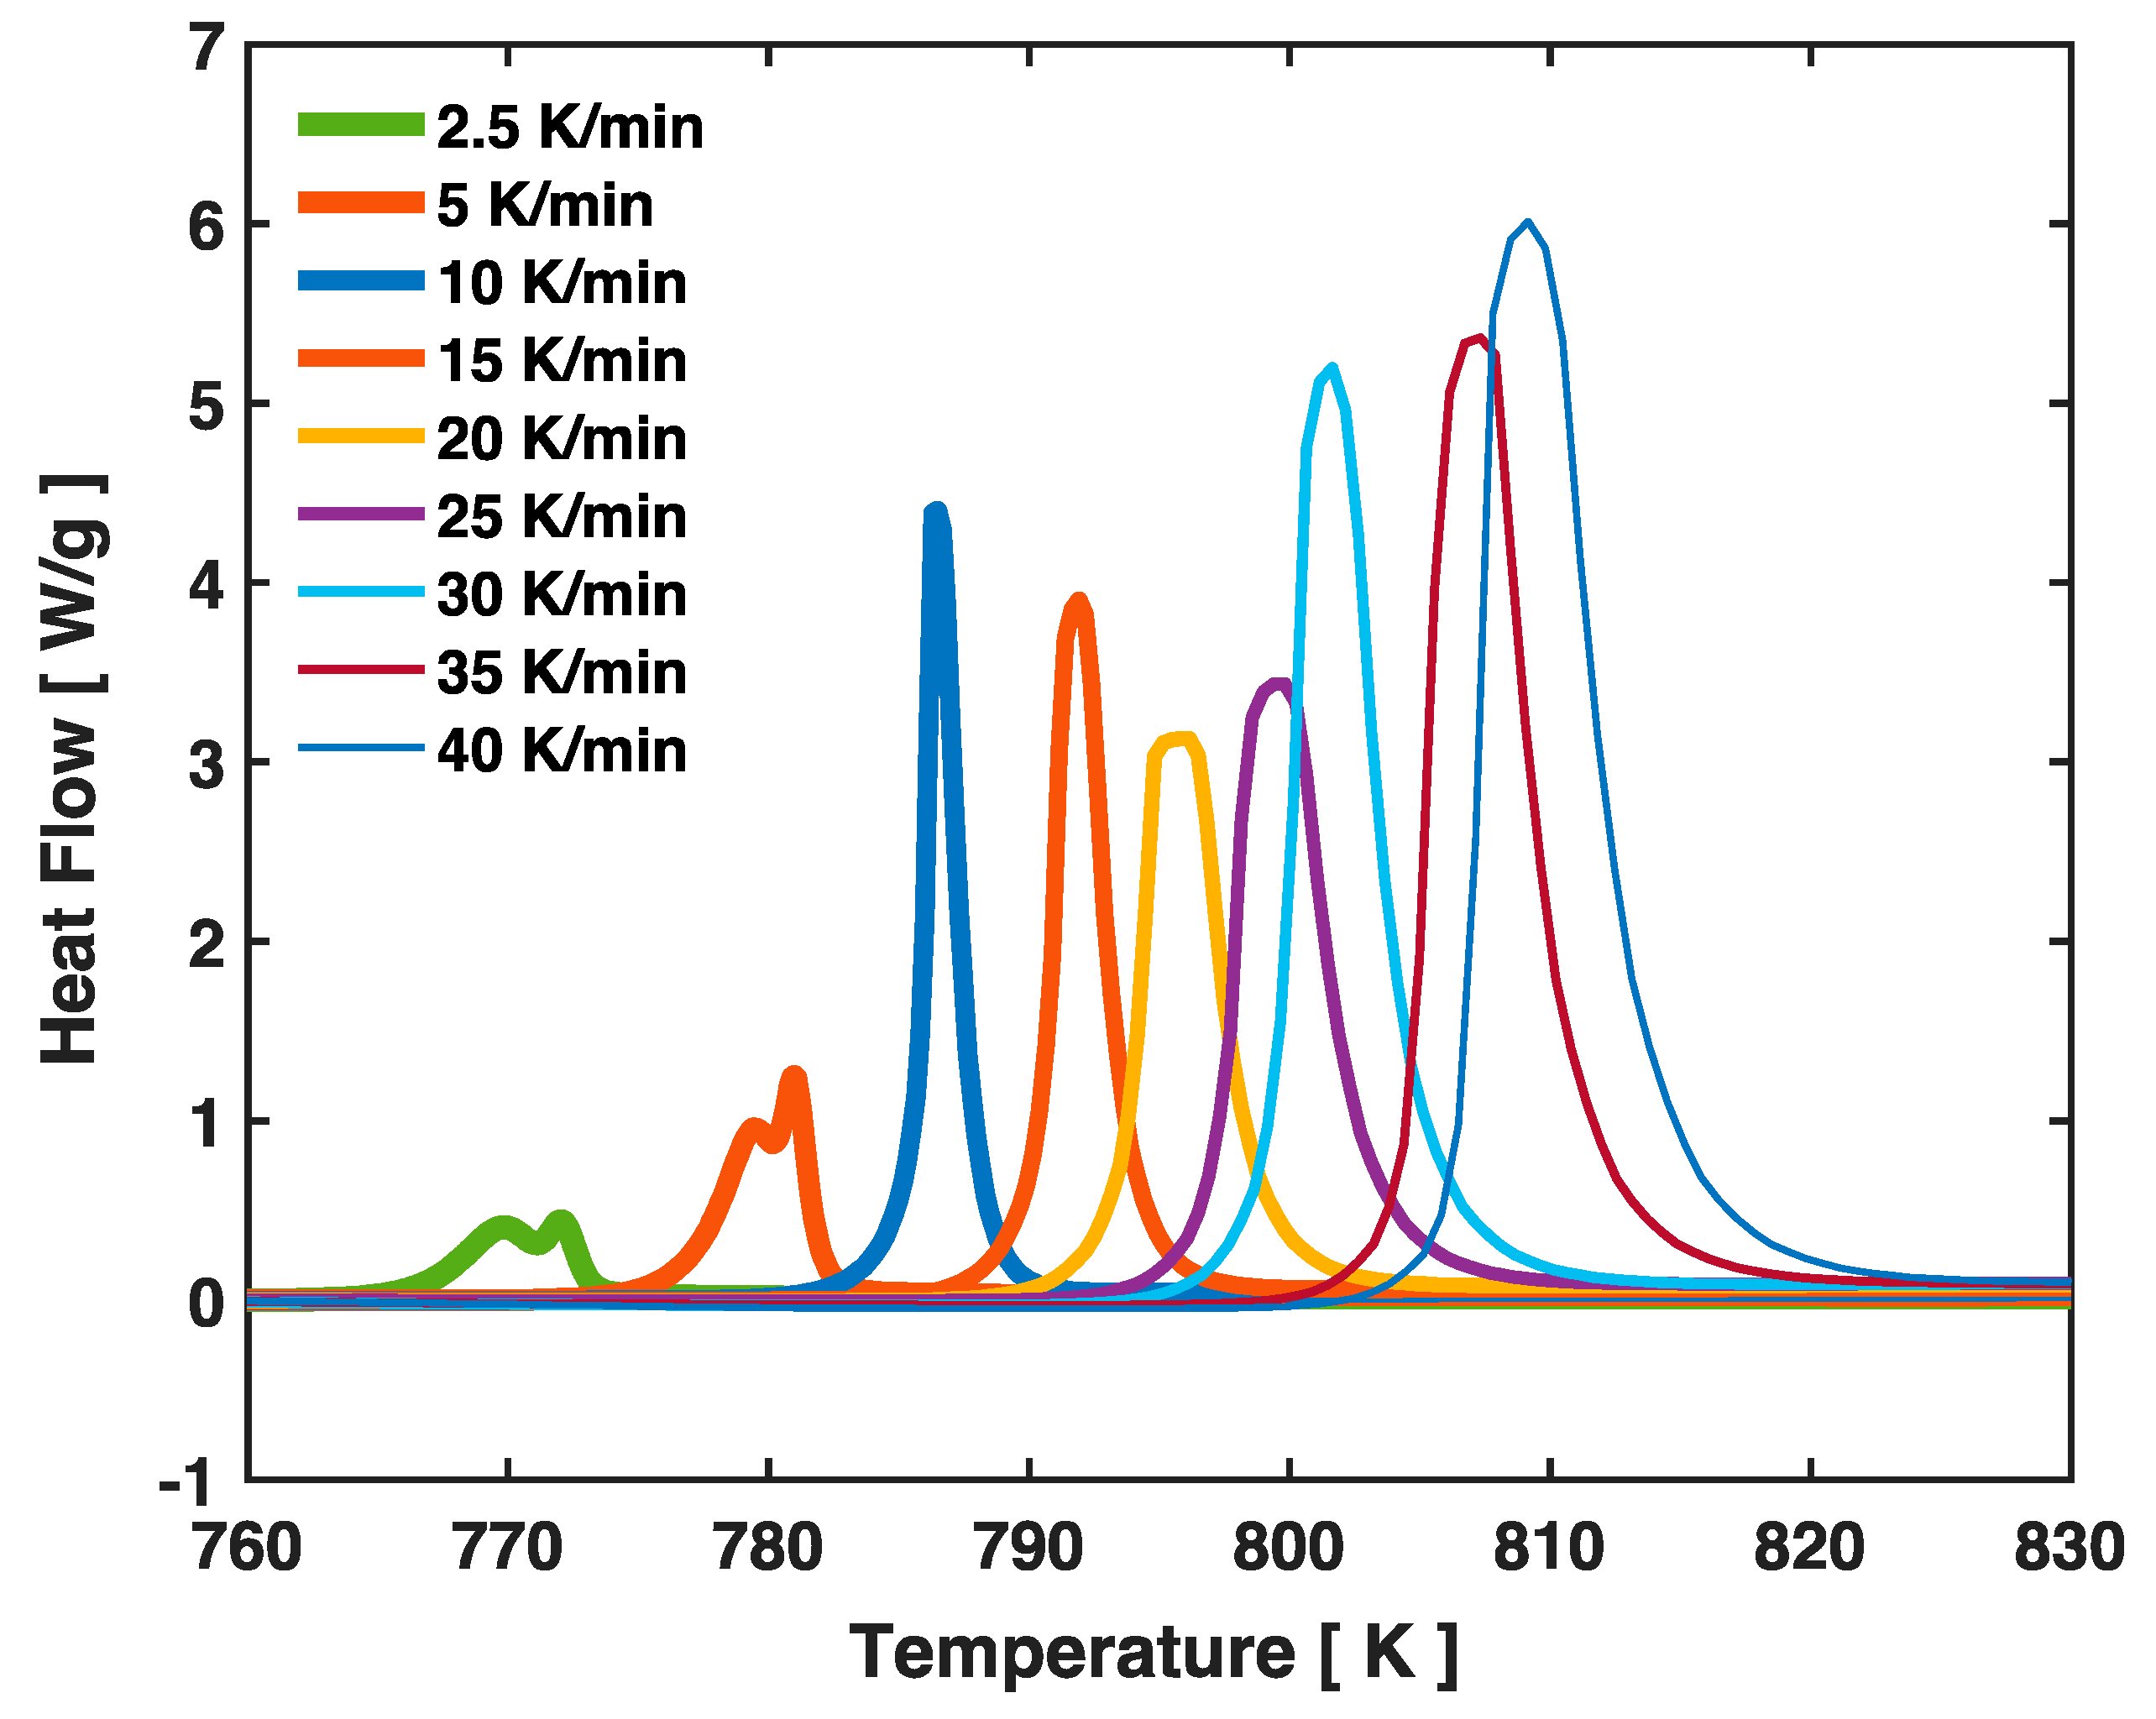
Figure 1 shows the exothermic DSC signals caused by crystallization during continuous isochronal heating at rates of 2.5, 5, 10, 15, 20, 25, 30, 35, and 40 K/min. As the heating rate increased, the DSC peak shifted to higher temperatures, which was as expected (due to less time spent at each temperature). At the two lowest heating rates, i.e., 2.5 and 5 K/min, the DSC peak displayed two minor splittings that were close to each other, indicating that the crystallization proceeded with two steps: primary and secondary crystallization events. At the other (higher) heating rates, no peak splittings were apparent, most likely due to the overlap between the two steps at the higher crystallization temperatures. Indeed, the increasing overlap between the two crystallization events at a higher heating rate is recognizable if one compares the DSC signals for the 2.5 and 5 K/min heating rates.
Kissinger’s method is often used to analyze the correspondence between the DSC peak shift and the heating rate to extract an overall activation energy of a thermally activated process (e.g., chemical reaction or phase transformation) [
19,
20,
21]. This method is based on the first-order chemical reaction model and, more specifically, the following equation:
in which
is the dimensionless reacted (or transformed) fraction. This equation assumes that the reaction rate,
, is proportional to the remaining unreacted fraction
and that the proportionality coefficient or reaction rate constant is solely determined by the temperature,
, according to the Arrhenius formulation, which contains activation energy,
, universal gas constant,
R, and pre-exponential factor,
A.
Based on Equation (1) and the fact that the heat flow measured by DSC is essentially
(scaled by the total enthalpy of crystallization, i.e., the total area enclosed by the DSC peak), a relationship between the peak position (temperature),
, on the DSC signal, where the
is at its maximum, and the heating rate
employed in an isochronal scan can be theoretically derived by taking the derivative of Equation (1) on both sides (note that
varies linearly with
as
) and setting that to zero. The result is the well-known Kissinger’s equation:
which suggests a linear correlation between
and
with a slope equal to
. Once the slope is known, the activation energy
can be conveniently determined.
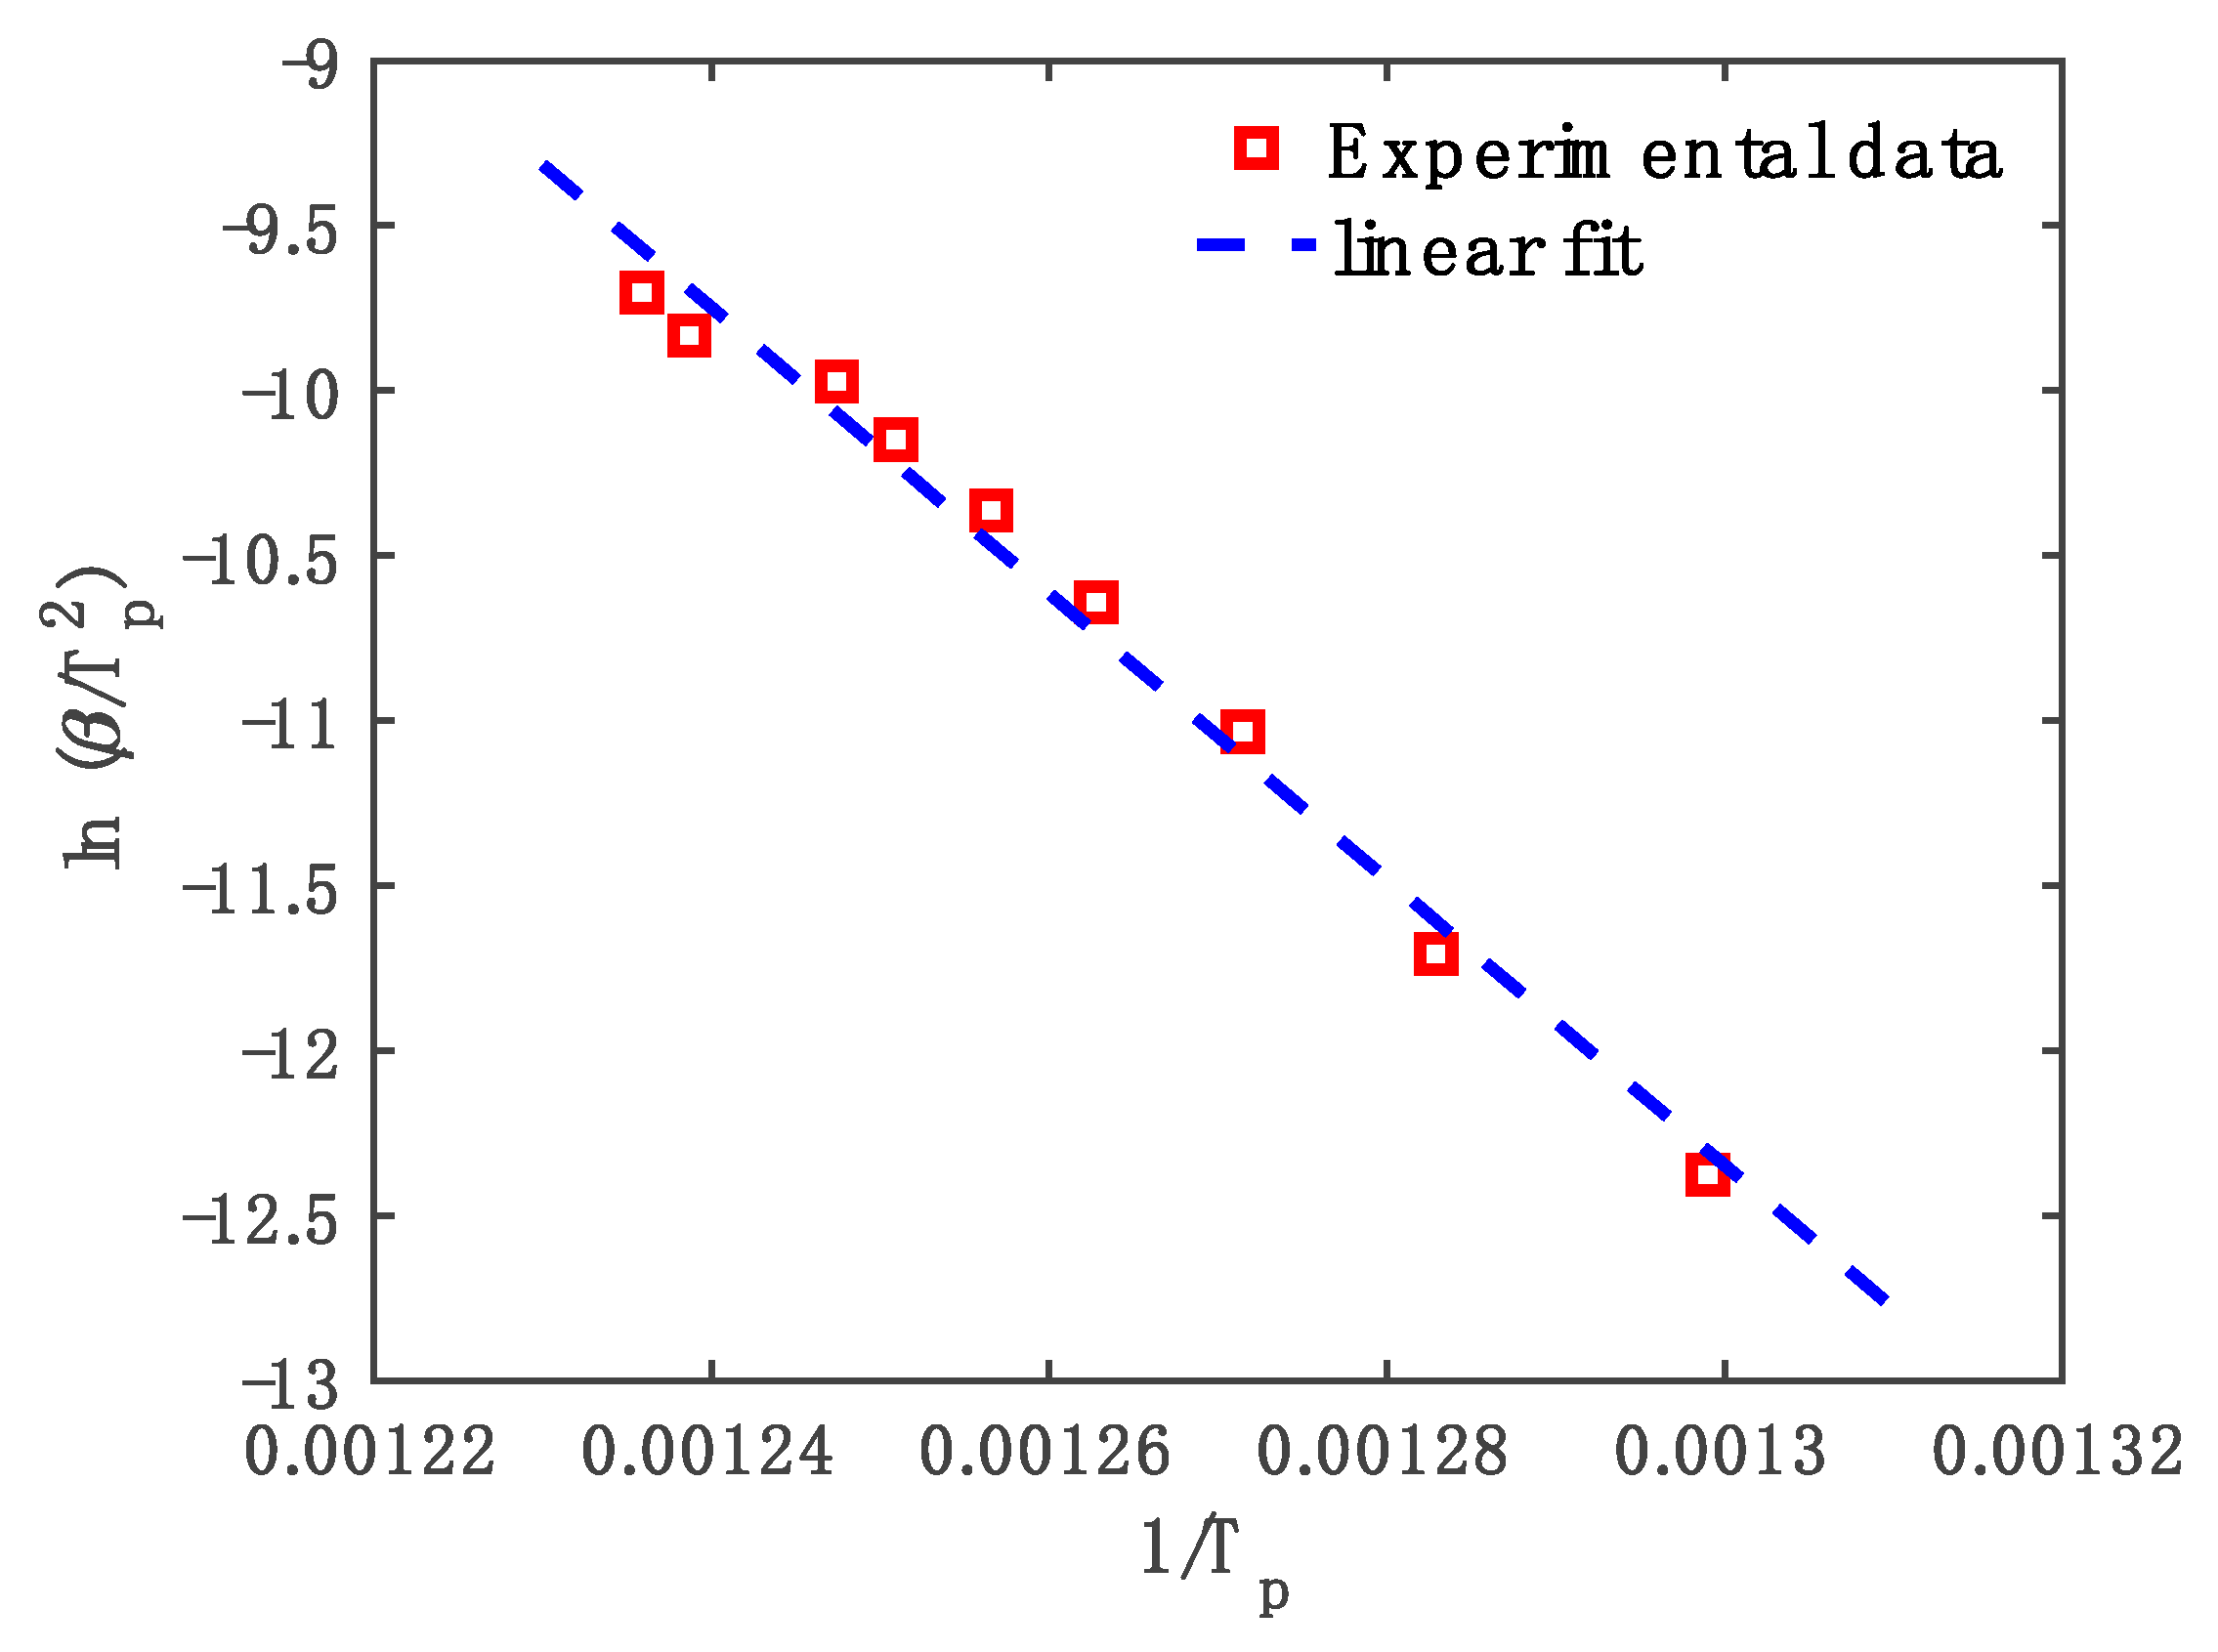
Figure 2 presents the so-called Kissinger plot of
vs.
, showing both experimental data and the fitted linear correlation. The Kissinger model captured the experimental data quite well, with a fitting goodness (
R2) of 0.986. Using the slope from the linear fitting, the activation energy
for the crystallization was determined to be 360 kJ/mole.
In
Figure 2, the data points representing the two lowest heating rates (2.5 and 5 K/min) are based on the first peak-splitting of the DSC signal, as shown in
Figure 1. If the second peak-splitting was used for these two heating rates (while data remained the same for the other heating rates), the Kissinger fitting was still reasonably good, albeit with a slightly lower
R2 of 0.977, and the activation energy
was determined to be 380 kJ/mole, even higher than the 360 kJ/mole reported above.
The values of
obtained here are larger than those reported for most other Cu-based metallic glasses in the literature, for example, 208 kJ/mole for Cu
73Sn
6Ni
6P
15 [
22], 331 kJ/mole for Cu
50Zr
40Ti
10 [
23], and 354 kJ/mole for Cu
43Zr
43Al
7Ag
7 [
24]. A high activation energy for crystallization is generally in line with a high GFA because glass formation requires the avoidance of crystallization (although glass is made most commonly through a cooling instead of a heating process). Hence, the results here contribute to our understanding of the origin of the superior GFA of the Cu
46Zr
33.5Hf
13.5Al
7 BMG. From another perspective, a high activation energy for crystallization widens the temperature window for controlling the crystallization process so as to produce preferred microstructural characteristics (e.g., crystallite number density, grain size, remaining glass fraction) in the devitrified glass.
Note that Equation (1), i.e., the first-order chemical reaction model with a reaction rate constant solely decided by the temperature, as assumed in Kissinger’s method, is not strictly valid for phase transformations such as crystallization. A simple piece of evidence is that at a fixed temperature (and varying time), Equation (1) predicts an exponential decay of the DSC signal, which is not the case, as is discussed in the next section of this paper and in the vast literature on isothermal DSC studies. Indeed, the Kolmogorov–Johnson–Mehl–Avrami (KJMA) model combined with appropriate descriptions for crystal nucleation and growth rates, which, in whole, is equivalent to Equation (1) but with a time-dependent (power law) rate constant, is more applicable to phase transformations. Nonetheless, the Kissinger analysis does provide an overall activation energy that largely represents how difficult it is for crystallization to occur and that can be conveniently compared across different materials.
3.2. Isothermal DSC
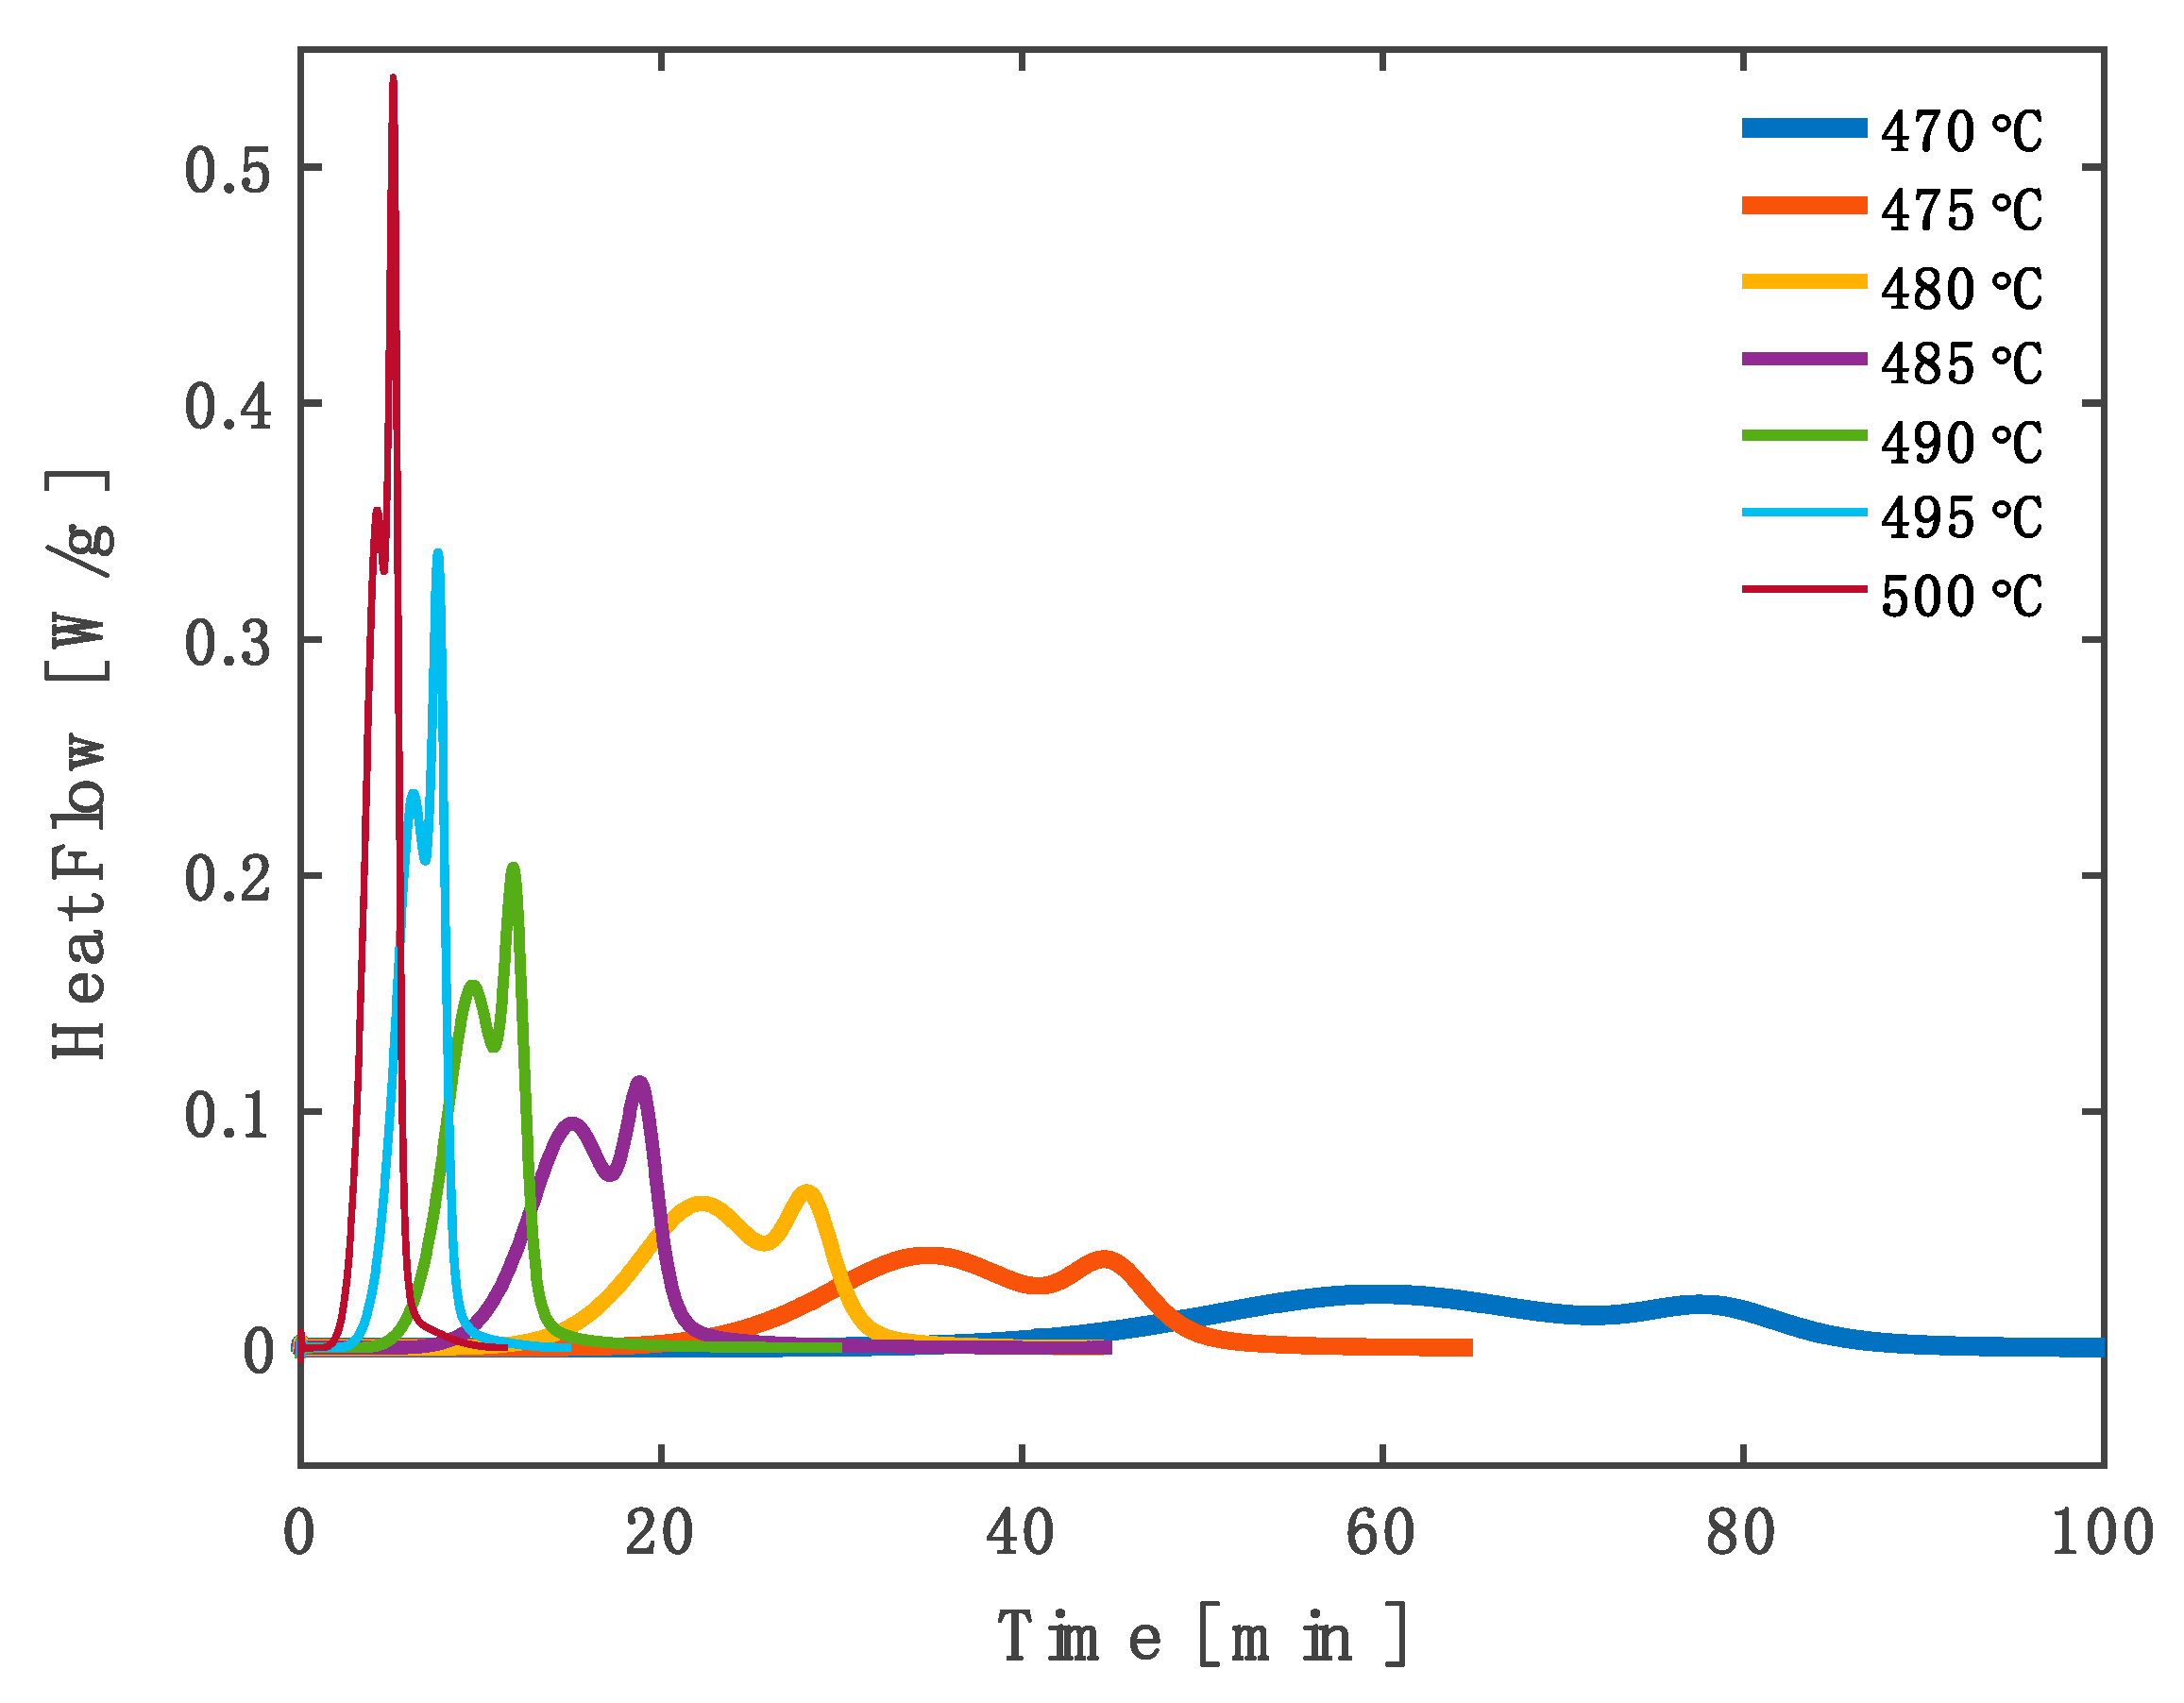
Figure 3 shows the isothermal DSC scans (heat flow vs. time) of the Cu
46Zr
33.5Hf
13.5Al
7 BMG obtained at seven different temperatures ranging from 470 to 500 °C. These temperatures were all above the apparent glass transition temperature, 454 °C, observed during the preheating (60 K/min) prior to the isothermal holding. All the isothermal scans displayed two crystallization events (peaks), and the two events became more and more overlapped with increasing temperature. This is consistent with observations from the isochronal DSC scans (especially those at 2.5 and 5 K/min heating rates).
The basic form of the KJMA model for phase transformations is as follows:
where
is the actual transformed fraction and
is the extended transformed fraction.
is a fictive quantity theoretically determined by integrating nucleation and growth rates over time without considering any spatial overlap of nuclei/grains or the continuous decrease of the remaining parental phase that limits later transformation. Generally, the extended fraction is expressed as
, where
t is the time,
m is the so-called Avrami exponent, and
is a rate constant that comprises contributions from both nucleation and growth rates. Combining Equation (3) and the power law of
, one can find
and its differential form:
which is a single-event KJMA model for an isothermal DSC signal (after baseline removal and normalization). Equation (4) assumes that nucleation and growth of the new phase start from time zero. When there is an incubation period
, as is often encountered, Equation (4) can be modified as follows:
Since there are two crystallization events here, the two-event version of the KJMA model:
was used to fit the isothermal DSC data in this study, where
is the total fraction of transformation contributed by the first event. Care needs to be taken to properly implement this fitting. For example, to avoid imaginary numbers and associated numerical problems, the
and
should be compared with zero and replaced by zero, if negative, by the fitting program.
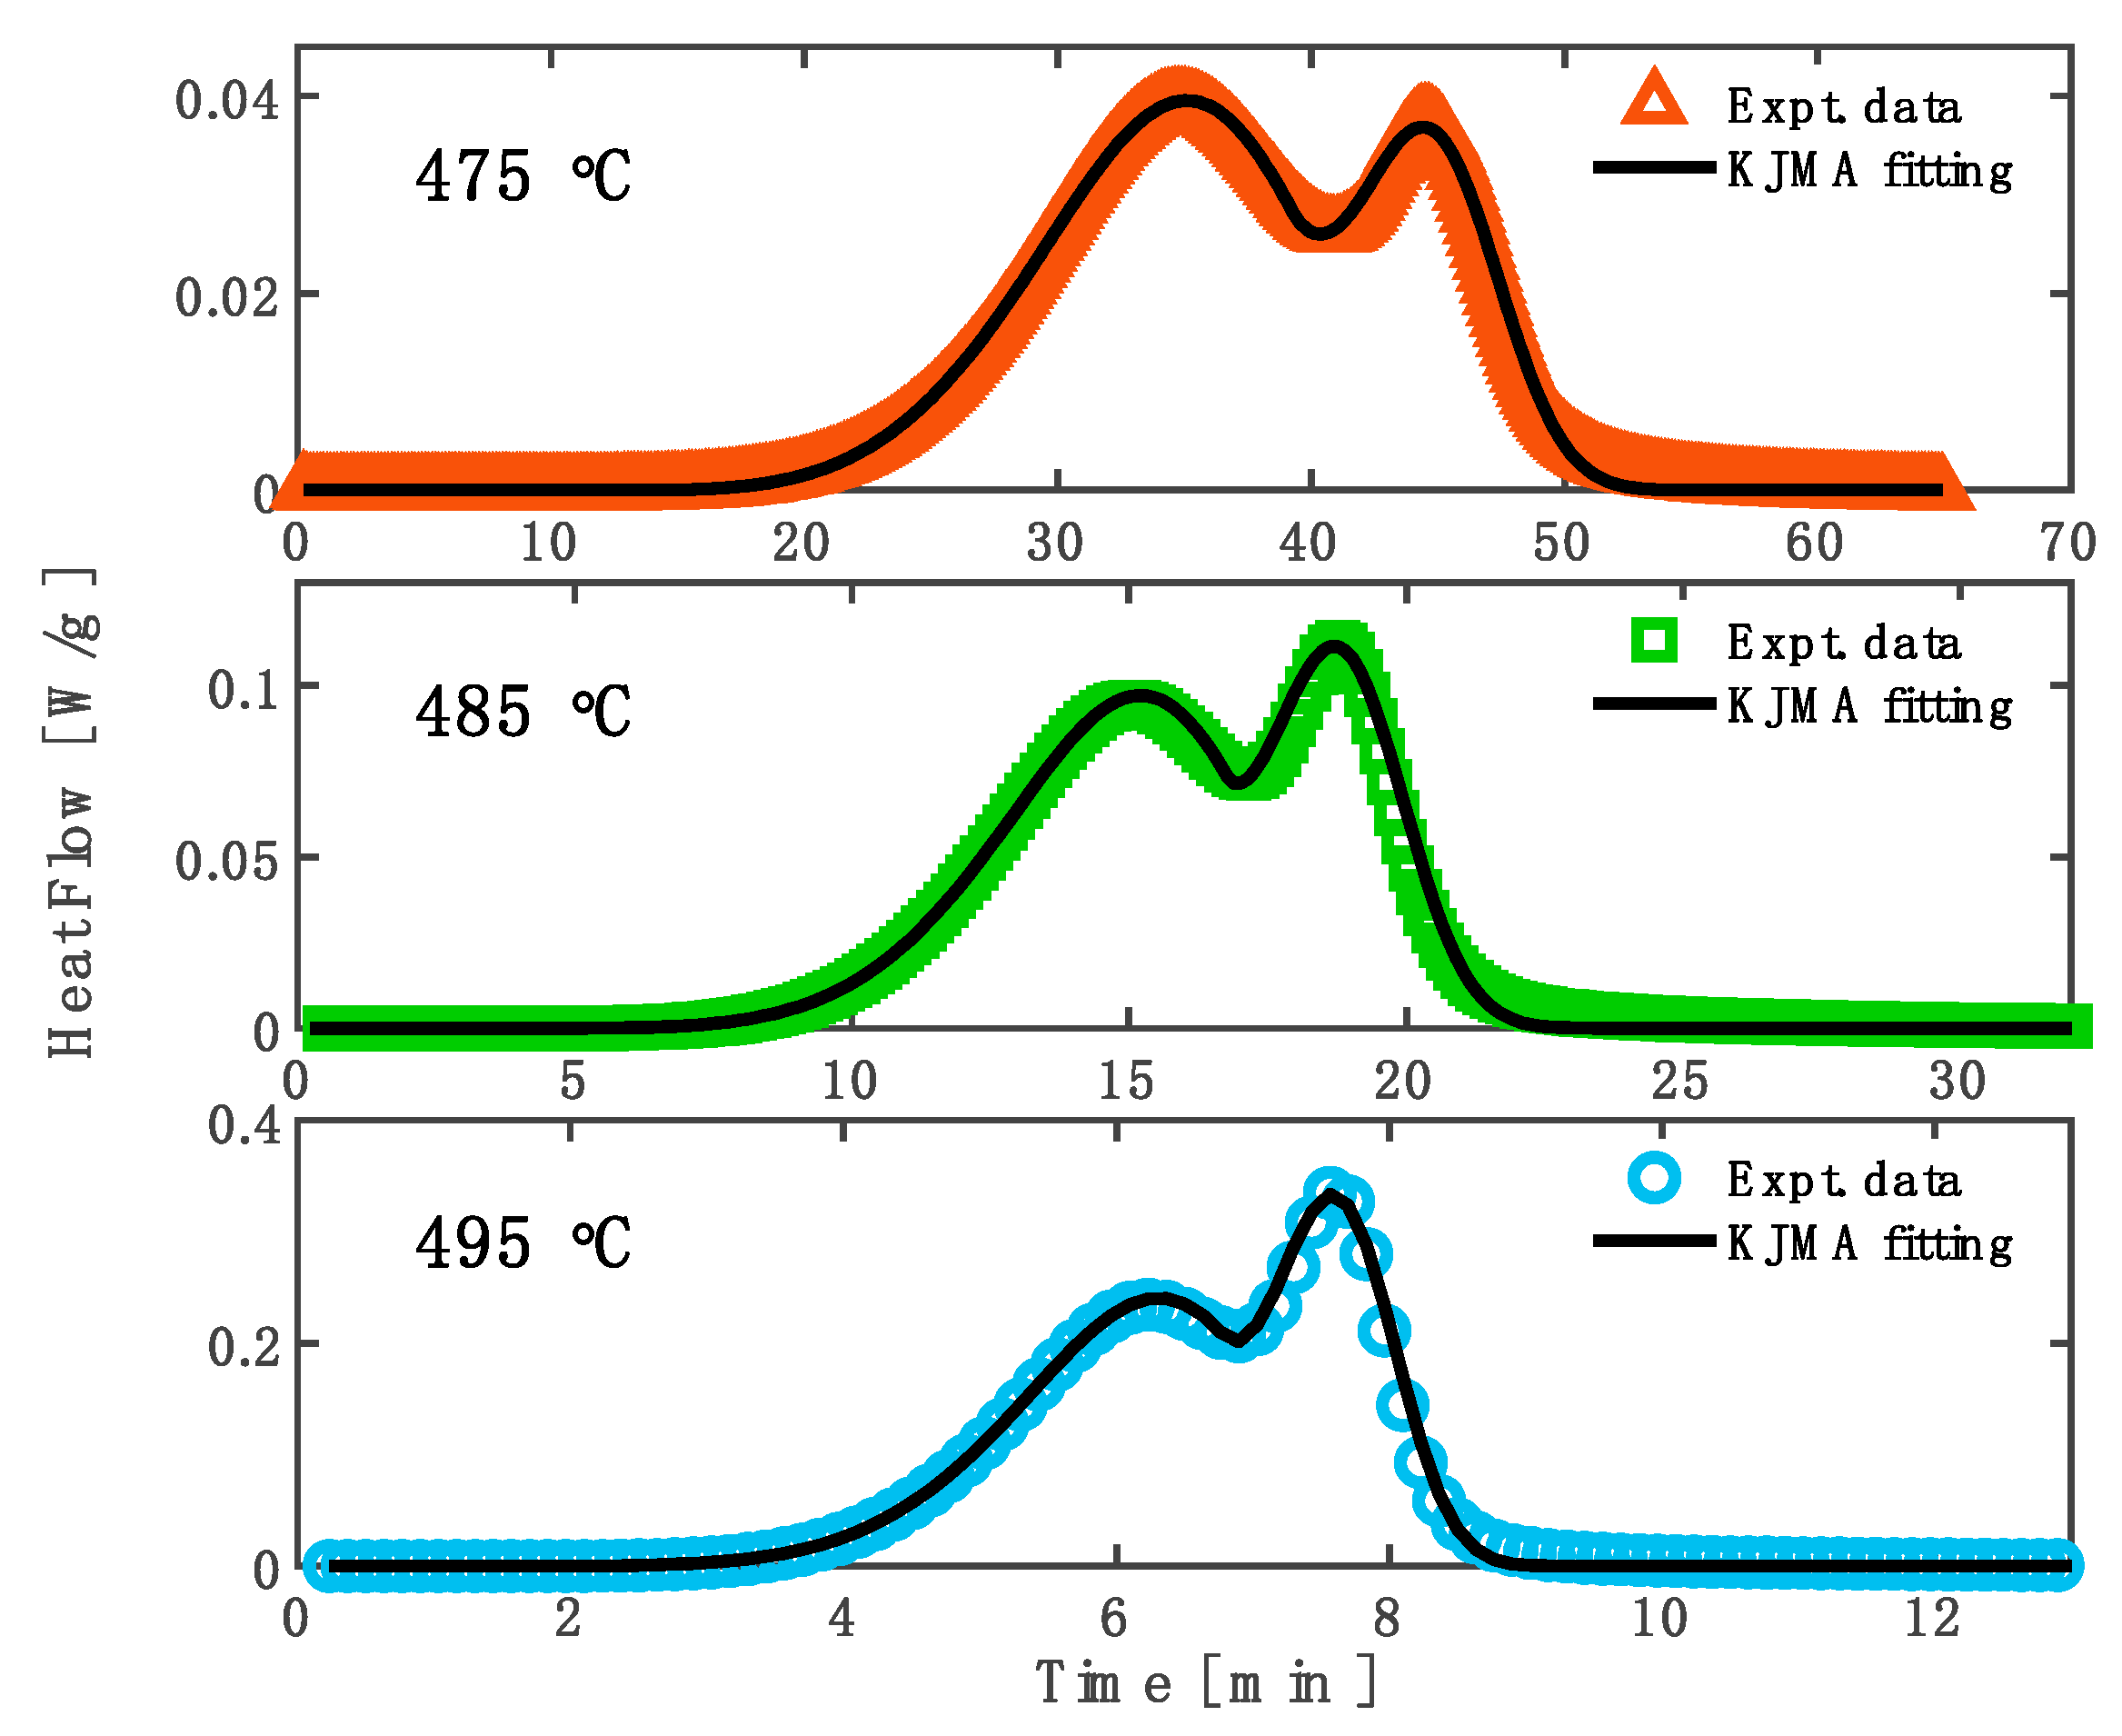
The two-event KJMA model fit the data very closely, with
R2 > 0.99 achieved for all seven temperatures. Examples of the fitted curves (the normalization factor, i.e., the total enthalpy of crystallization, reapplied for plotting) vs. experimental data are presented in
Figure 4 with T = 475, 485, and 495 °C. The fitting results for the seven different temperatures are tabulated in
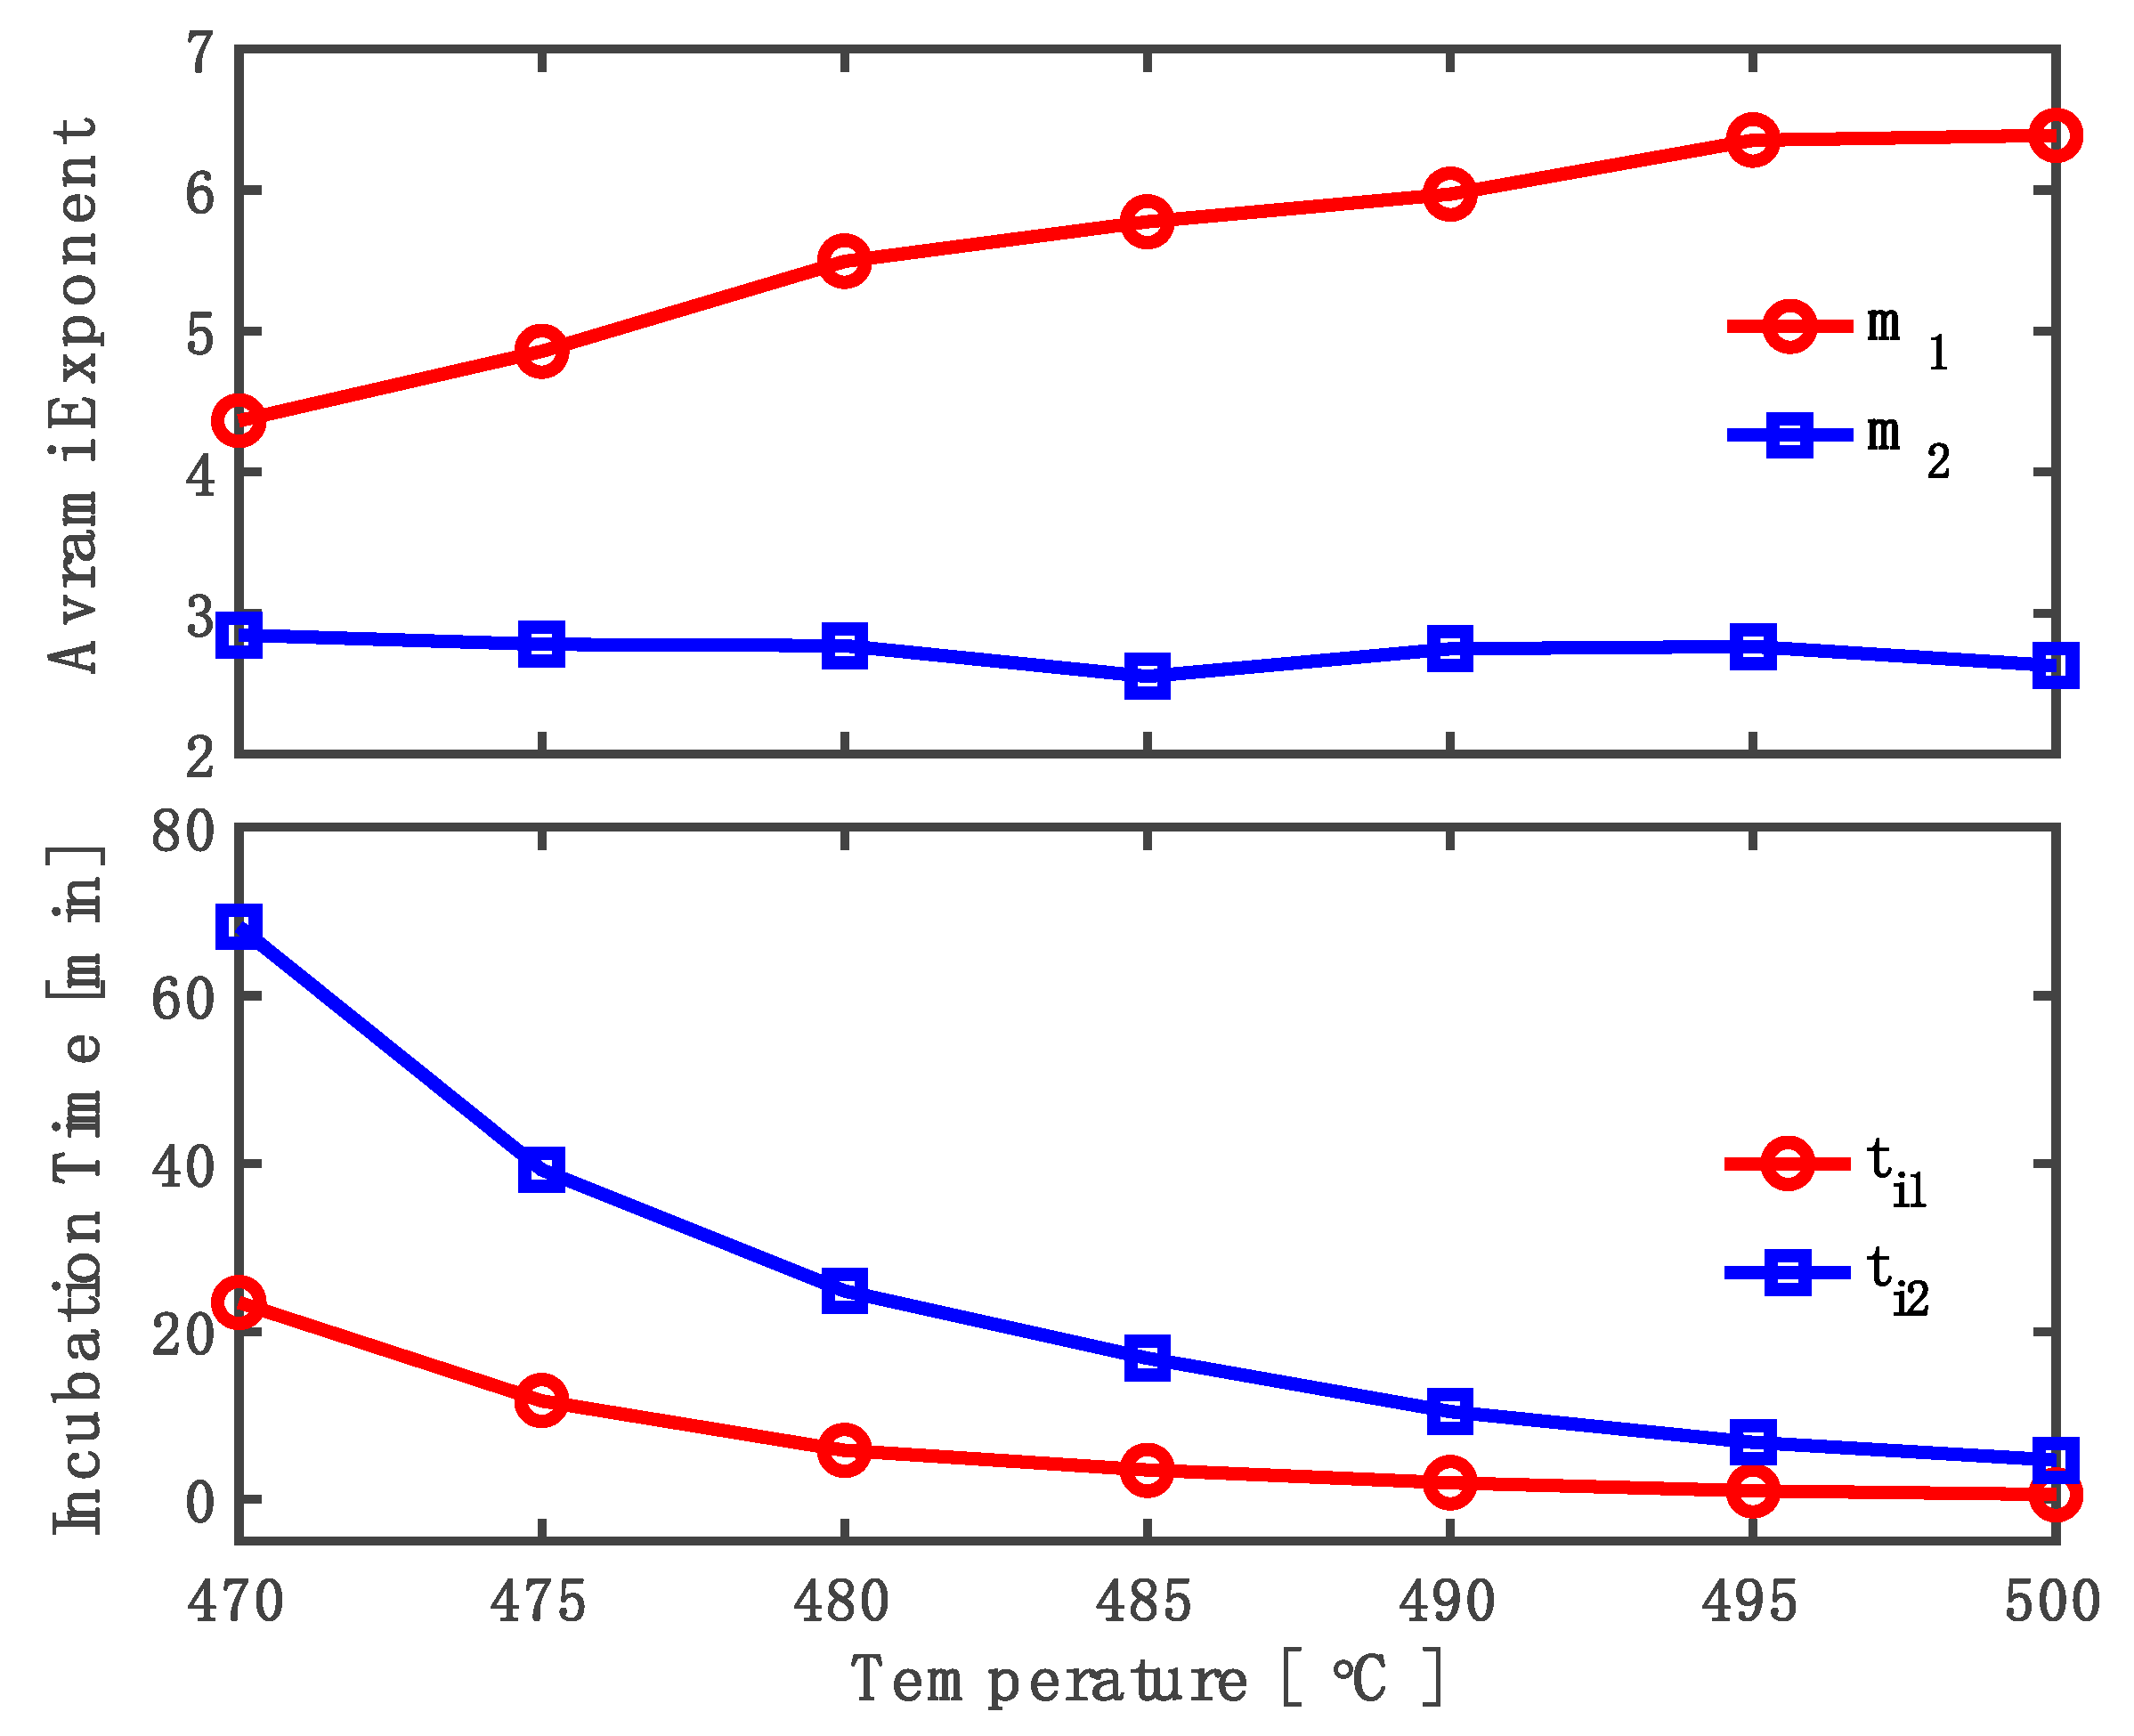
Table 1. The fitted Avrami exponents (
,
) and incubation times (
,
) of the primary and secondary crystallization events are plotted in
Figure 5. As seen in
Table 1 and
Figure 5, the incubation time decreased with increasing temperature for both events. At 470 °C (16 °C above the glass transition temperature), the incubation time was rather long: 23.4 min for the primary event and 68.2 min for the secondary event. At 500 °C, it became significantly shorter: 0.5 min and 4.6 min for the primary and secondary events, respectively.
The Avrami exponent increased from 4.4 at 470 °C to 6.4 at 500 °C for the primary crystallization, while it stayed fairly stable around 2.6 to 2.8 for the secondary crystallization. In the standard theory, the Avrami exponent is expected to range from 0.5 (instantaneous/heterogeneous nucleation and 1-D diffusion-controlled growth) to 4 (homogeneous nucleation and 3-D interface-controlled growth). More specifically, if the nucleation is homogeneous, the Avrami exponent is expected to take values of 2, 3, and 4 for 1-D, 2-D, and 3-D interface-controlled growth and 1.5, 2, and 2.5 for 1-D, 2-D, and 3-D diffusion-controlled growth, respectively. If the nucleation is instantaneous/heterogeneous, these expected values all decrease by 1. Apparently, the Avrami exponents obtained here did not fit into any of the standard cases.
The rising trend and the values of the Avrami exponent obtained here for the primary crystallization can be understood as the result of an increasing degree of non-steadiness of homogeneous nucleation that was implied by the diminishing incubation time. At 470 °C, the incubation time was very long and the supercooled liquid matrix adjusted its topological and chemical short-range ordering (which is well known to exist in metallic glasses and their supercooled liquids [
25,
26,
27,
28,
29,
30]) and prepared for homogeneous nucleation in an approximately steady manner. The nearly steady-state homogeneous nucleation combined with 3-D interface-controlled growth (the 3-D dimensionality of the primary crystals can be observed from the TEM images in
Section 3.4) resulted in an Avrami exponent of 4.4, only slightly above the standard value of 4. At higher holding temperatures, the incubation time became notably shorter and the local structural and chemical adjustment of the supercooled liquid matrix and the homogeneous nucleation of the primary crystal phase became increasingly non-steady, i.e., more dependent on time. This additional dependence on time was then manifested by the increase in the Avrami exponent.
The stability and the values of the Avrami exponent obtained here for the secondary crystallization can be understood as resulting from heterogeneous nucleation and a sub-3-D growth mode. It is conceivable that the primary crystals formed in the first crystallization event provide heterogeneous nucleation sites for the secondary crystallization and, in the meantime, reduce (to below 3-D) the effective dimensionality of crystal growth in the second event as these secondary crystals grew from the surfaces of the primary crystals towards the remaining supercooled liquid matrix. This resulted in the fairly stable Avrami exponent of around 2.6–2.8 for the secondary crystallization, which was slightly below the standard value of 3 for heterogeneous nucleation combined with a 3-D growth mode.
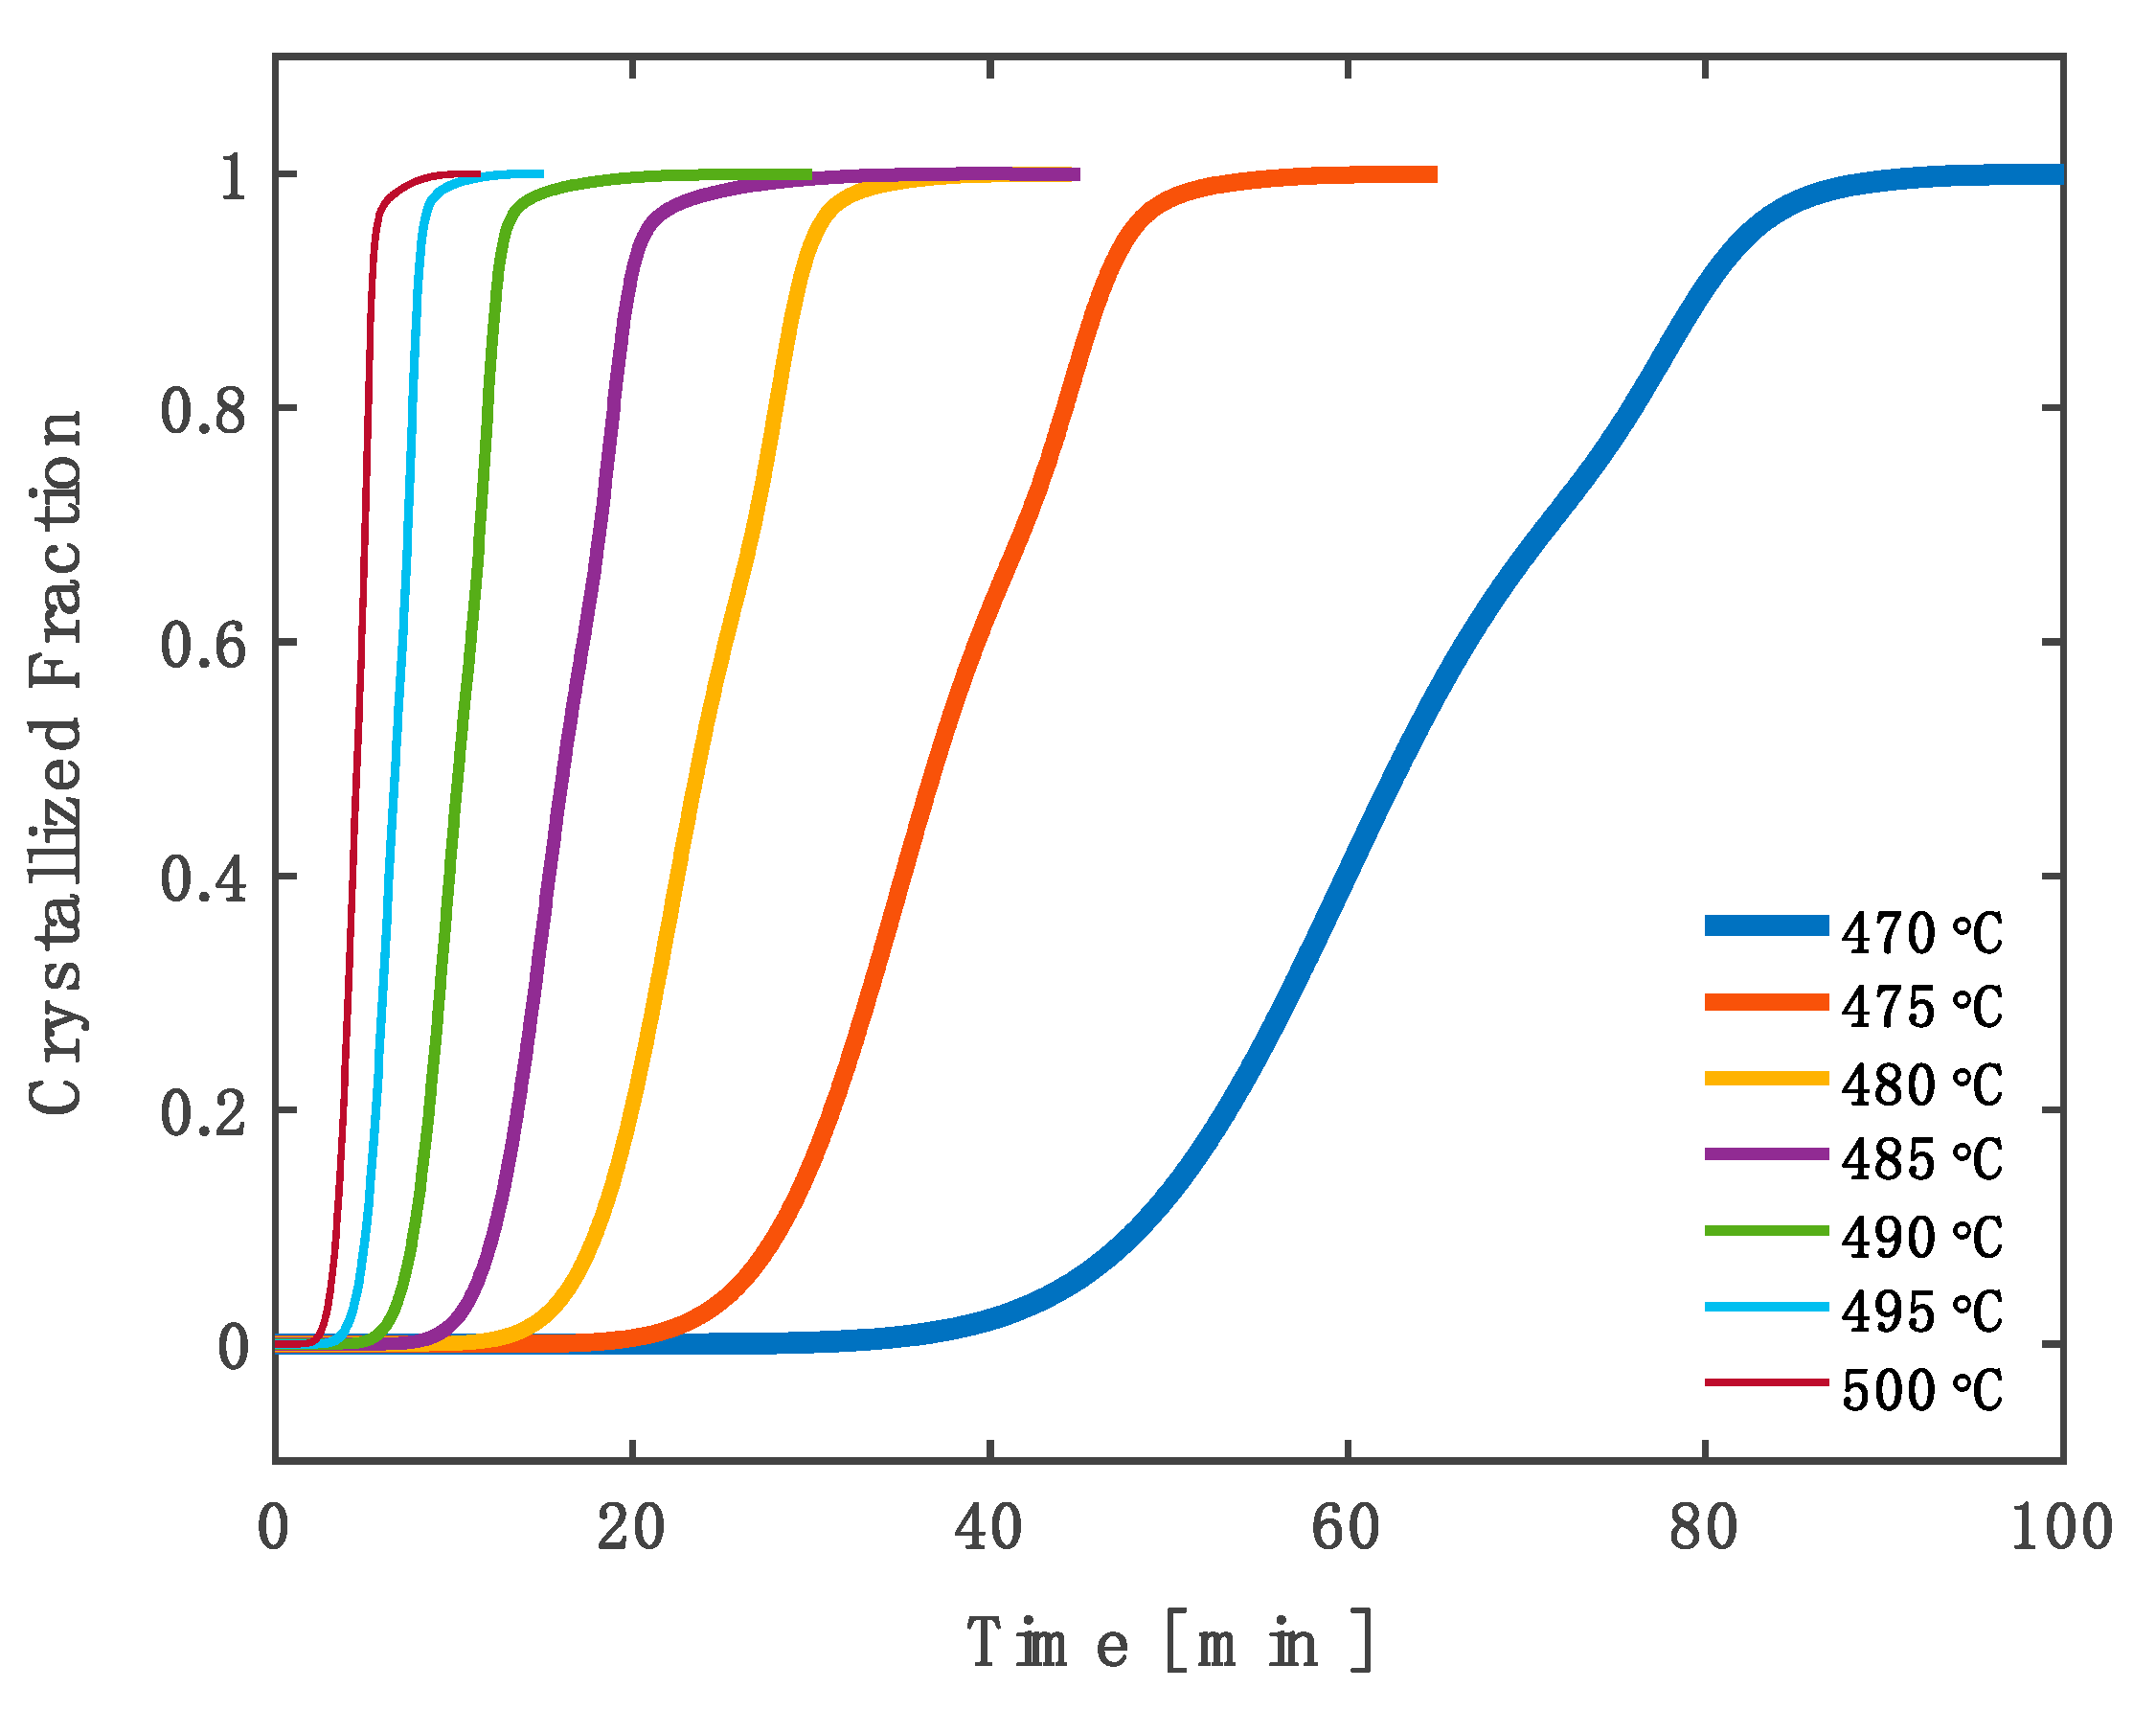
From the isothermal DSC data presented in
Figure 3, one can calculate the cumulative transformation curves (using numerical integration), which are displayed in
Figure 6. Due to the existence of two crystallization events, the cumulative transformation curves all showed a kink, although this was less noticeable at higher holding temperatures due to increased overlap between the primary and secondary crystallization events (see
Figure 3).
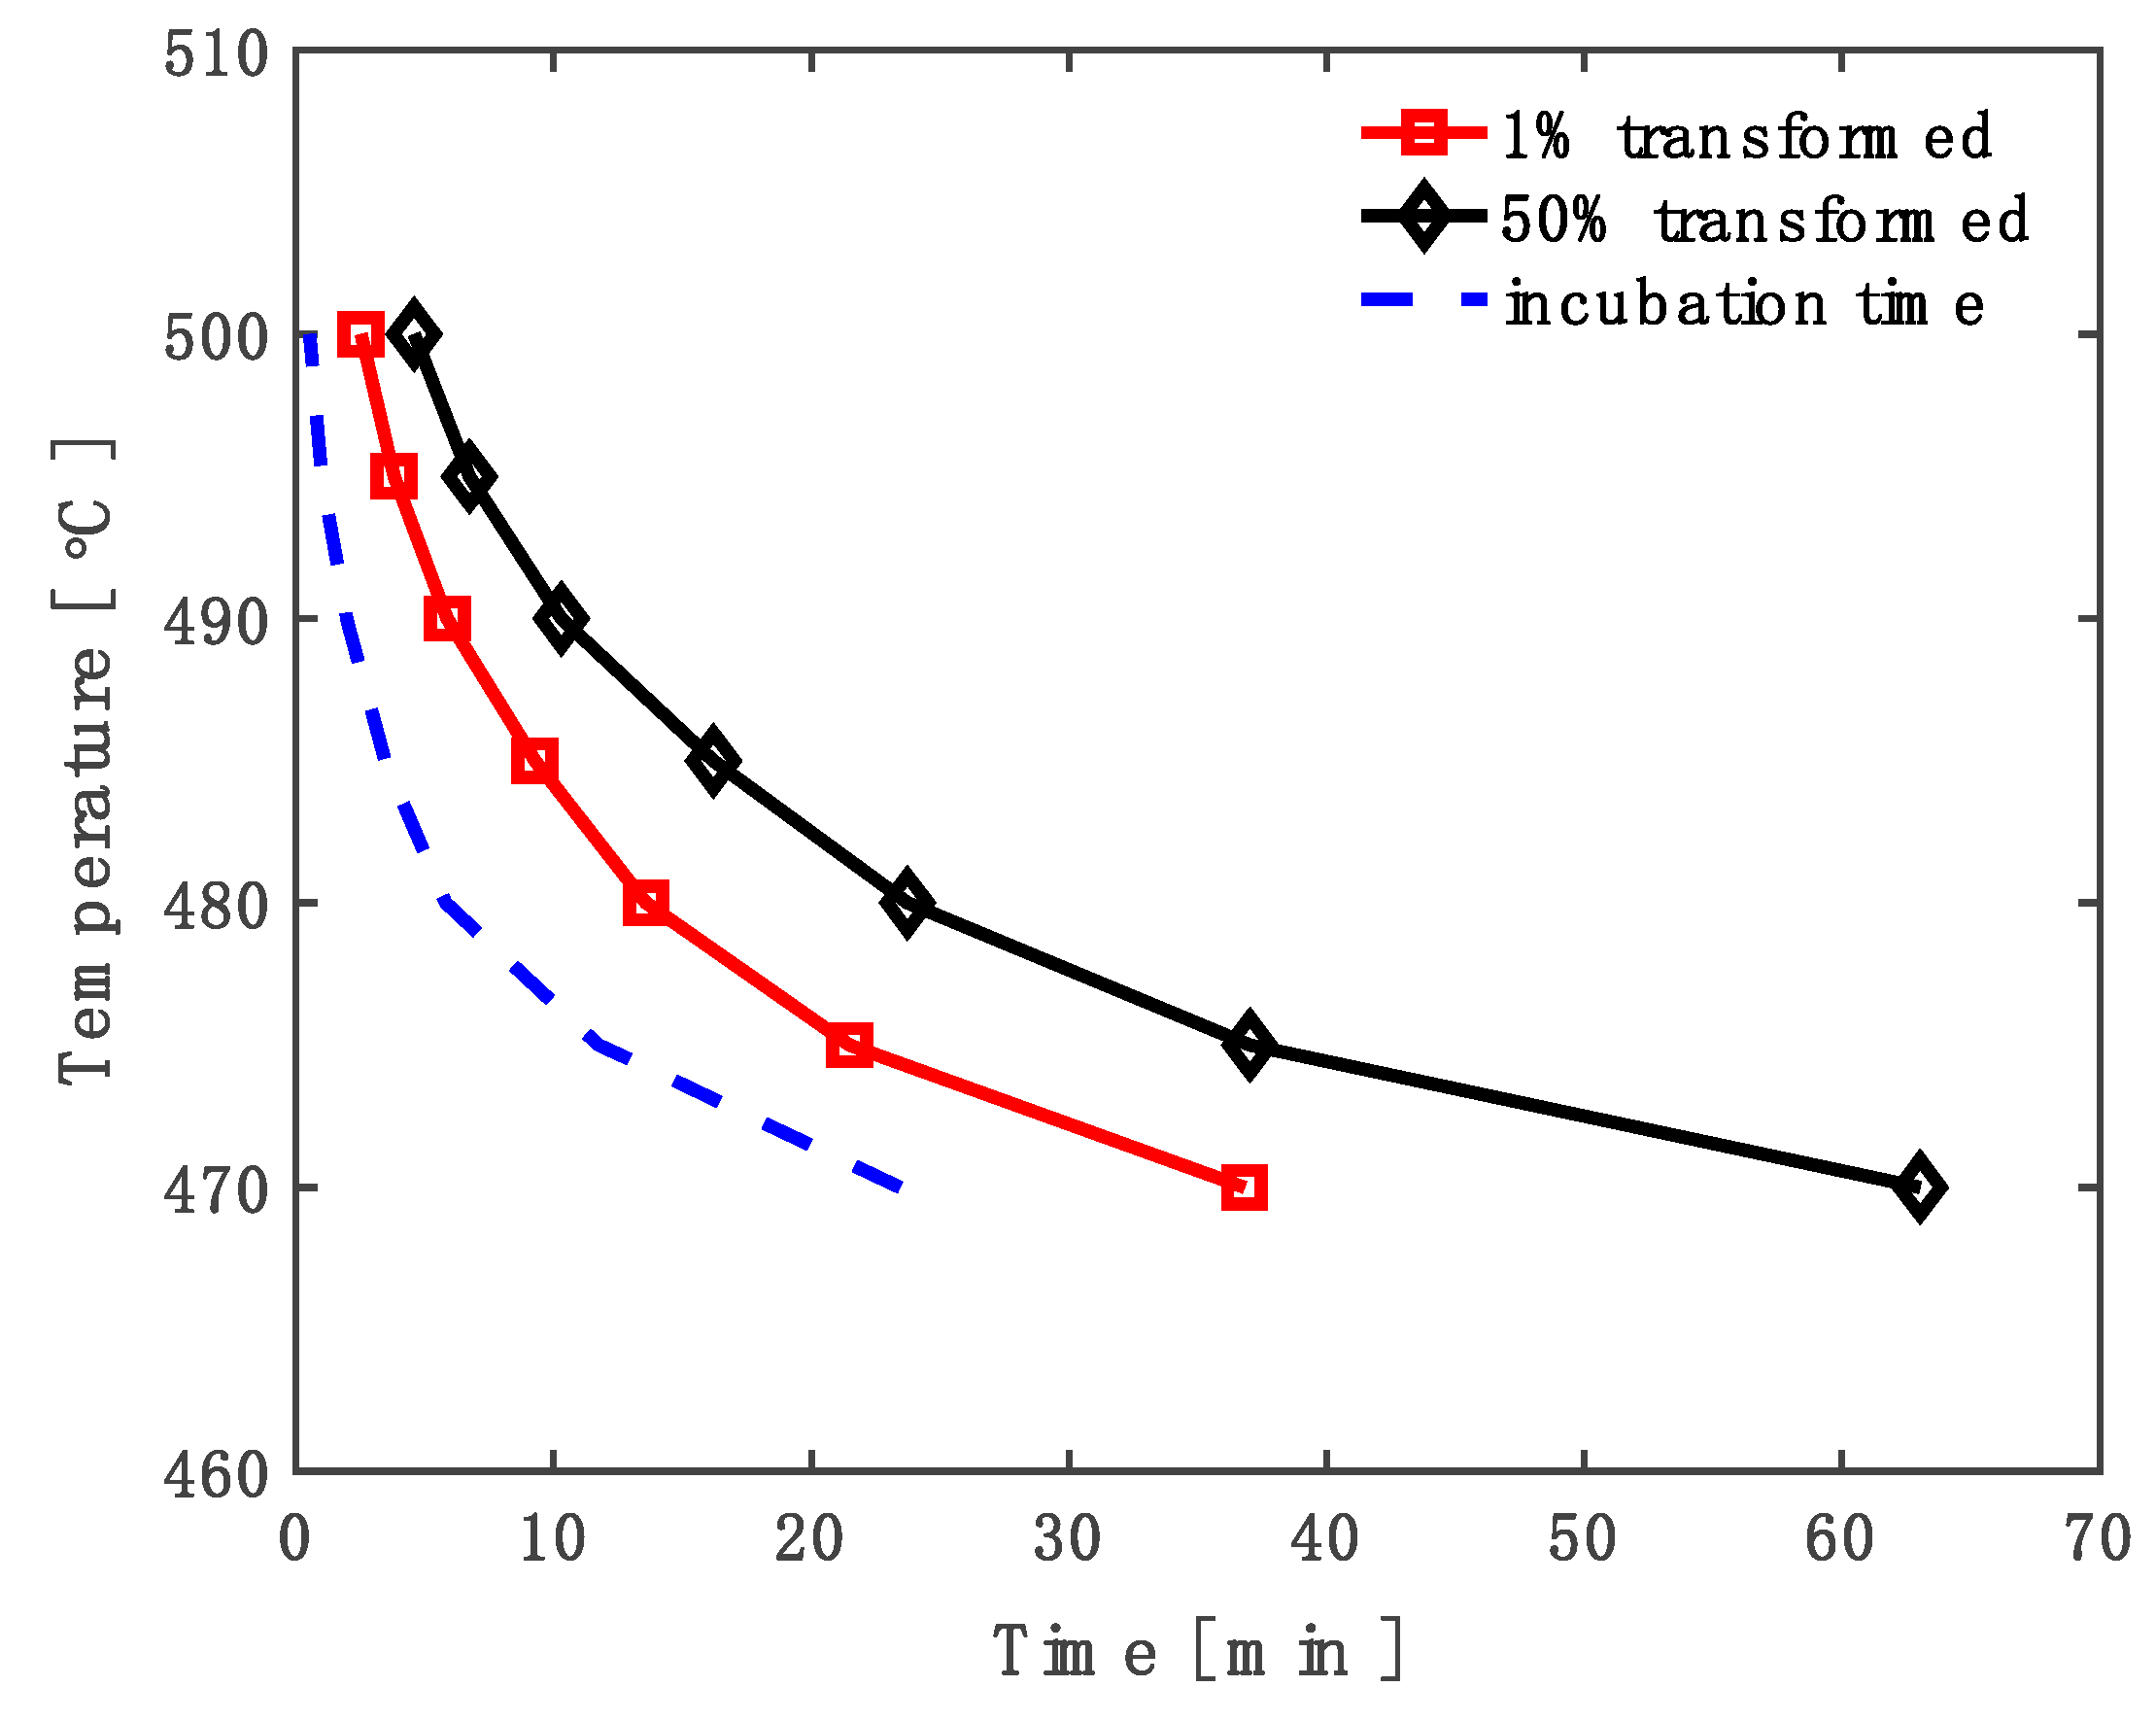
The cumulative transformation curves can be used to extract the time it took to reach certain transformed fractions at varied temperatures and construct isothermal TTT diagrams.
Figure 7 exhibits two TTT diagrams obtained here for the Cu
46Zr
33.5Hf
13.5Al
7 BMG: one representing a transformed fraction of 1% and the other representing a transformed fraction of 50%, together with the incubation time (for the first crystallization event) as a reference. A complete TTT diagram would exhibit a “C”-shape, with long transformation times in both high-temperature (upper branch) and low-temperature (lower branch, determined here) regimes. The upper branches of the TTT diagrams were not determined here since isothermal holding in that temperature regime would require a very high heating rate (typically available on a flash DSC) or the full melting of the sample followed by rapid cooling to reach those target temperatures, which was beyond the capability of our instrument. Nonetheless, the lower branches of the TTT diagrams obtained here carry particular significance for informing the thermoplastic processing and controlled devitrification of the BMG and predicting the thermal stability of the BMG in applications at moderately elevated temperatures.
3.3. X-ray Diffraction (XRD)
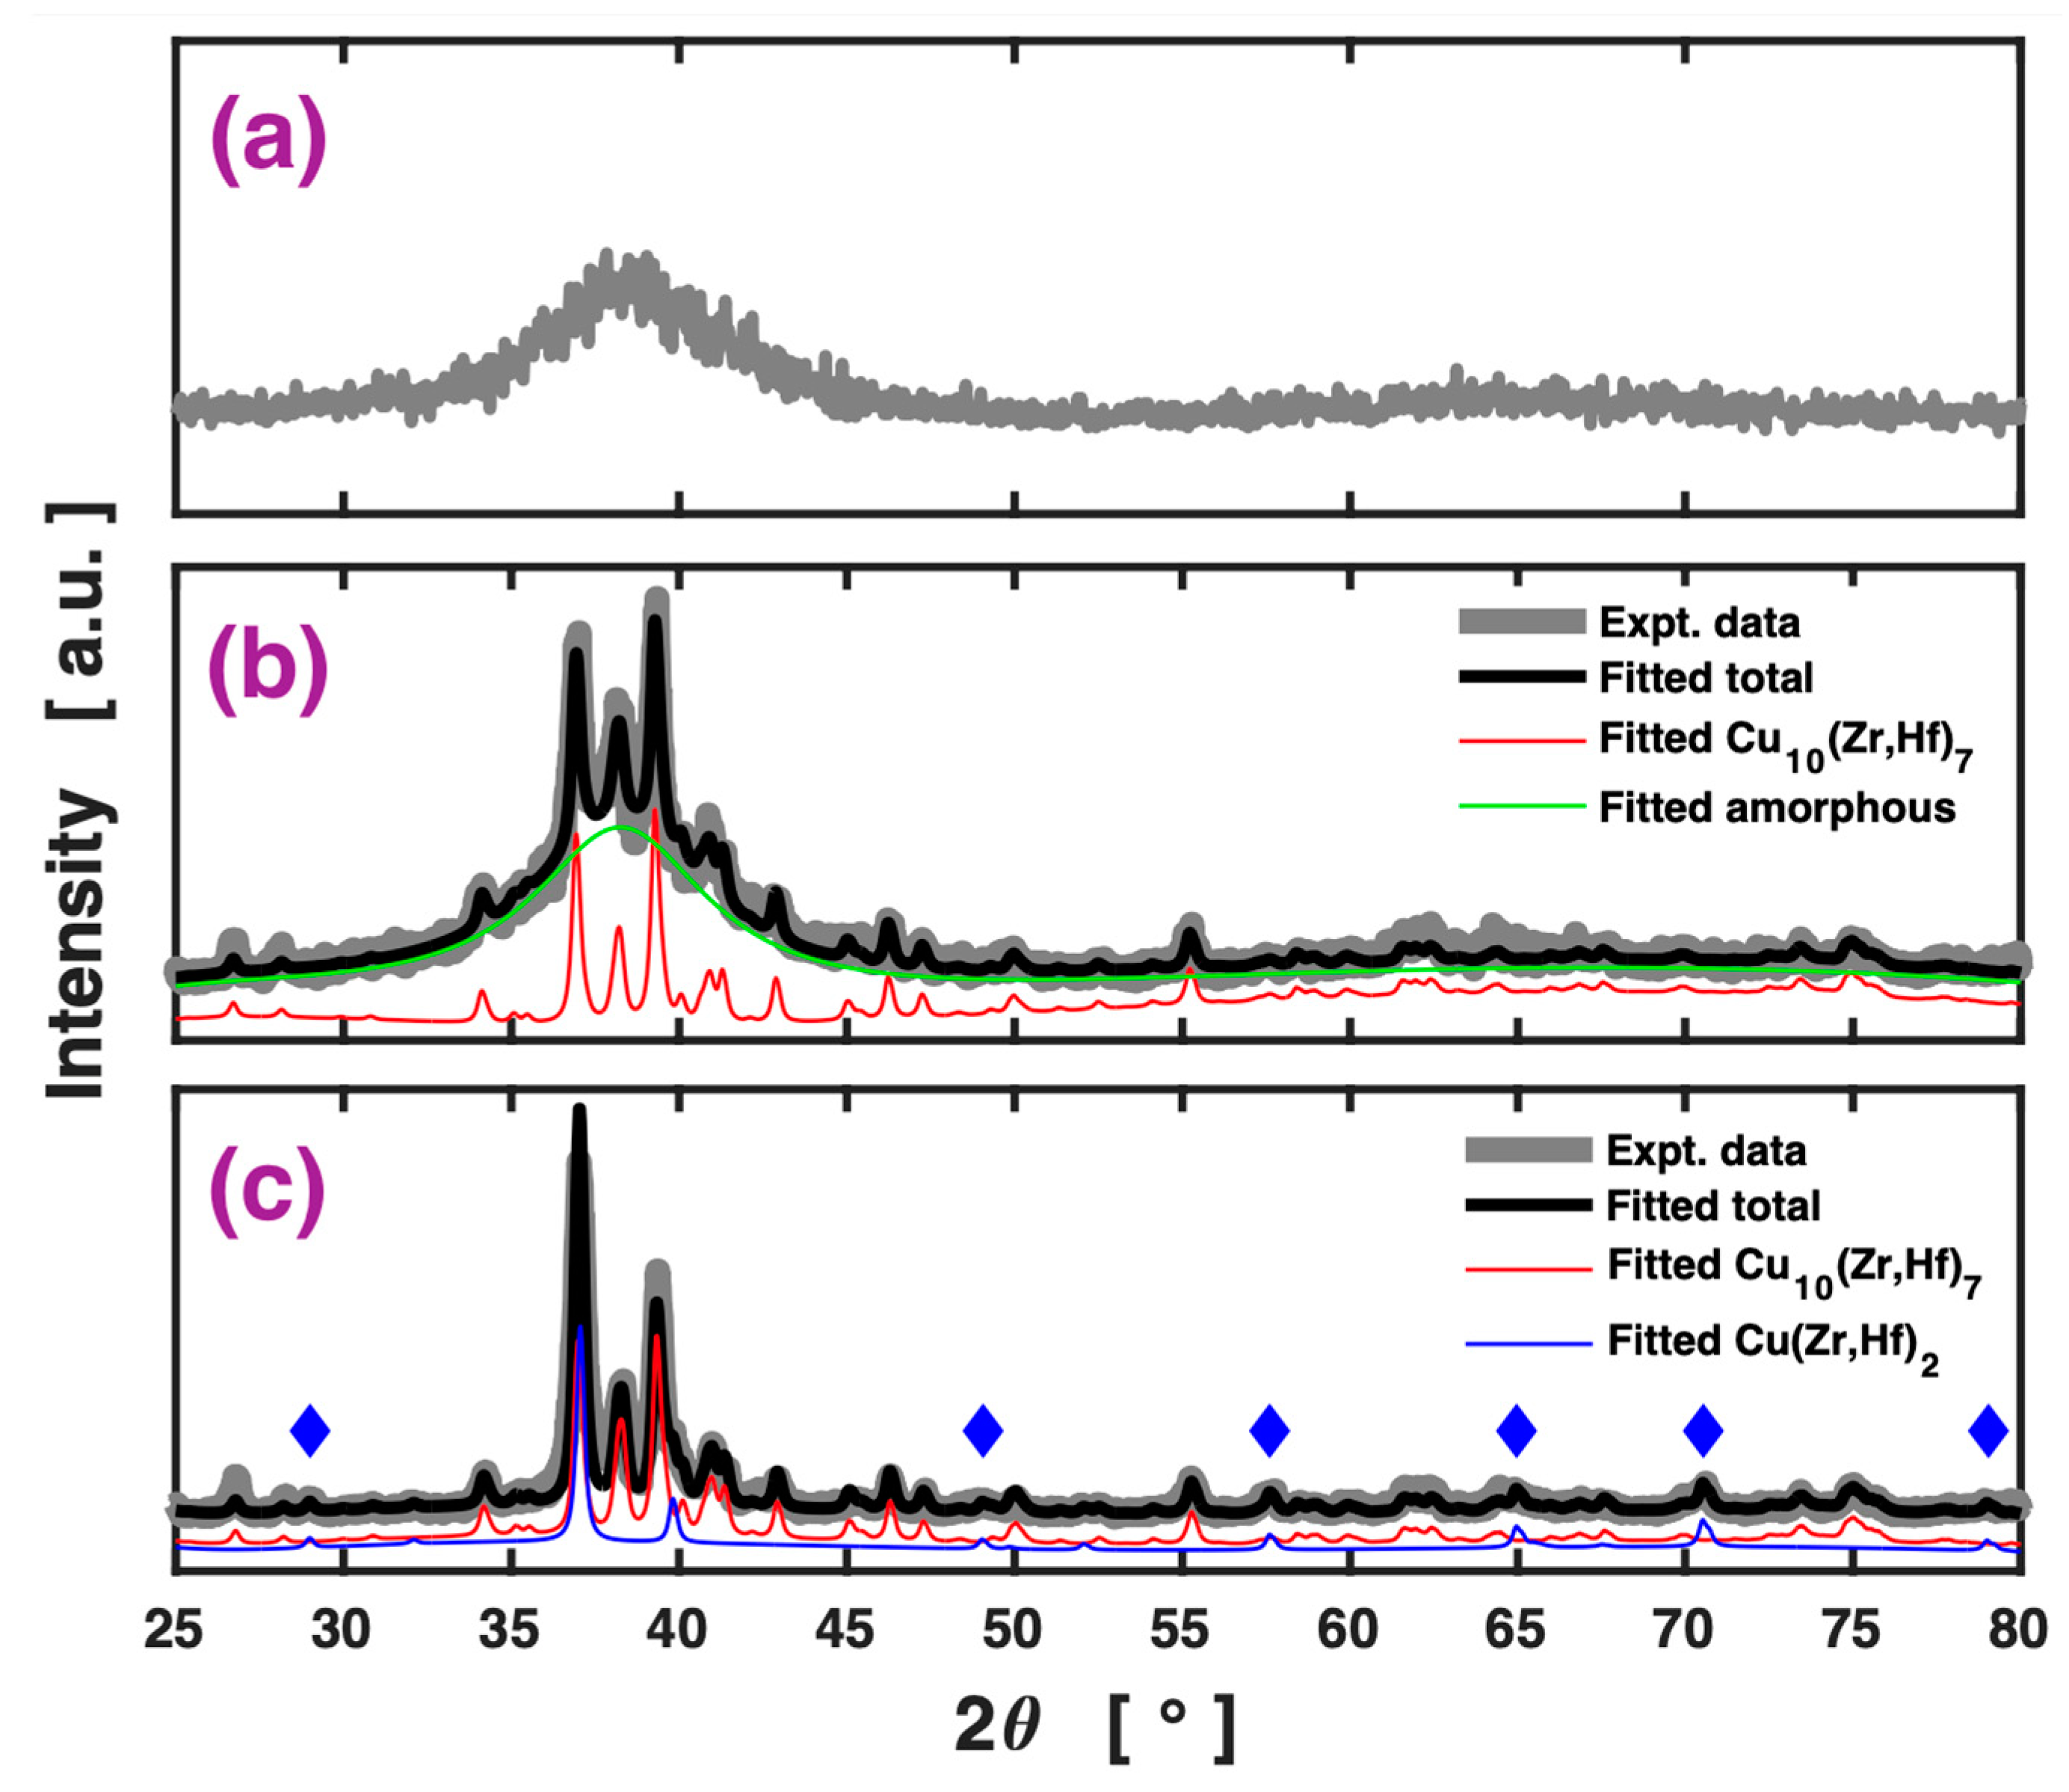
Figure 8a shows the XRD pattern of the as-cast specimen of the Cu
46Zr
33.5Hf
13.5Al
7 BMG. It consisted of only diffuse/broad maxima (two in the scanned 25 to 80° range of 2θ), without any sharp Bragg peaks. This demonstrates the fully amorphous (glassy) structure of the as-cast specimen.
In
Figure 8b, the thick gray line is the XRD pattern obtained from the specimen isothermally annealed inside the calorimeter at 475 °C for 34 min. This annealing time corresponded to the DSC peak of the primary crystallization event at this temperature (see
Figure 3) and was shorter than the incubation time for the secondary crystallization event (see
Table 1). Thus, only the primary crystal phase was expected to exist in this specimen. The open-source software Profex [
31] was used to fit the XRD pattern through Rietveld refinement. As shown in
Figure 8b, this XRD pattern was fitted very nicely with an amorphous phase and a single-crystal phase: Cu
10(Zr,Hf)
7. The binary compounds Cu
10Zr
7 and Cu
10Hf
7 share the same structure (space group 64, Cmce, orthorhombic lattice) and similar lattice parameters [
32,
33] and, hence, both Zr and Hf were considered to be present in the primary crystal phase. The strong amorphous signal which was directly visible in the experimental data and further confirmed by the fitting suggests that the primary crystals co-existed with a substantial amount of remaining glass matrix, i.e., the specimen had a glass–crystal composite structure.
The thick gray line in
Figure 8c is the XRD pattern obtained from the specimen isothermally annealed inside the calorimeter at 475 °C for 65 min. According to the isothermal DSC data, this annealing time was longer than it took for both primary and secondary crystallization events to complete at this temperature (see
Figure 3). Thus, this specimen was expected to be fully crystallized and comprise both primary and secondary crystal phases. Indeed, the XRD pattern exhibited no appreciable amorphous component, confirming that the specimen was fully crystallized. The Rietveld refinement found a few new peaks (positions marked with blue diamonds) that could not be reproduced using the primary phase Cu
10(Zr,Hf)
7. These new peaks were found to agree with the Cu(Zr,Hf)
2 phase (space group 139, I4/mmm, tetragonal lattice). By considering both the Cu
10(Zr,Hf)
7 and the Cu(Zr,Hf)
2 phases, the whole XRD pattern was found to be well-fitted. The fitting also suggested that the secondary phase Cu(Zr,Hf)
2 contributed to the main diffraction peaks near 37° and 39.3° in addition to the marked new peaks.
3.4. Transmission Electron Microscopy (TEM)
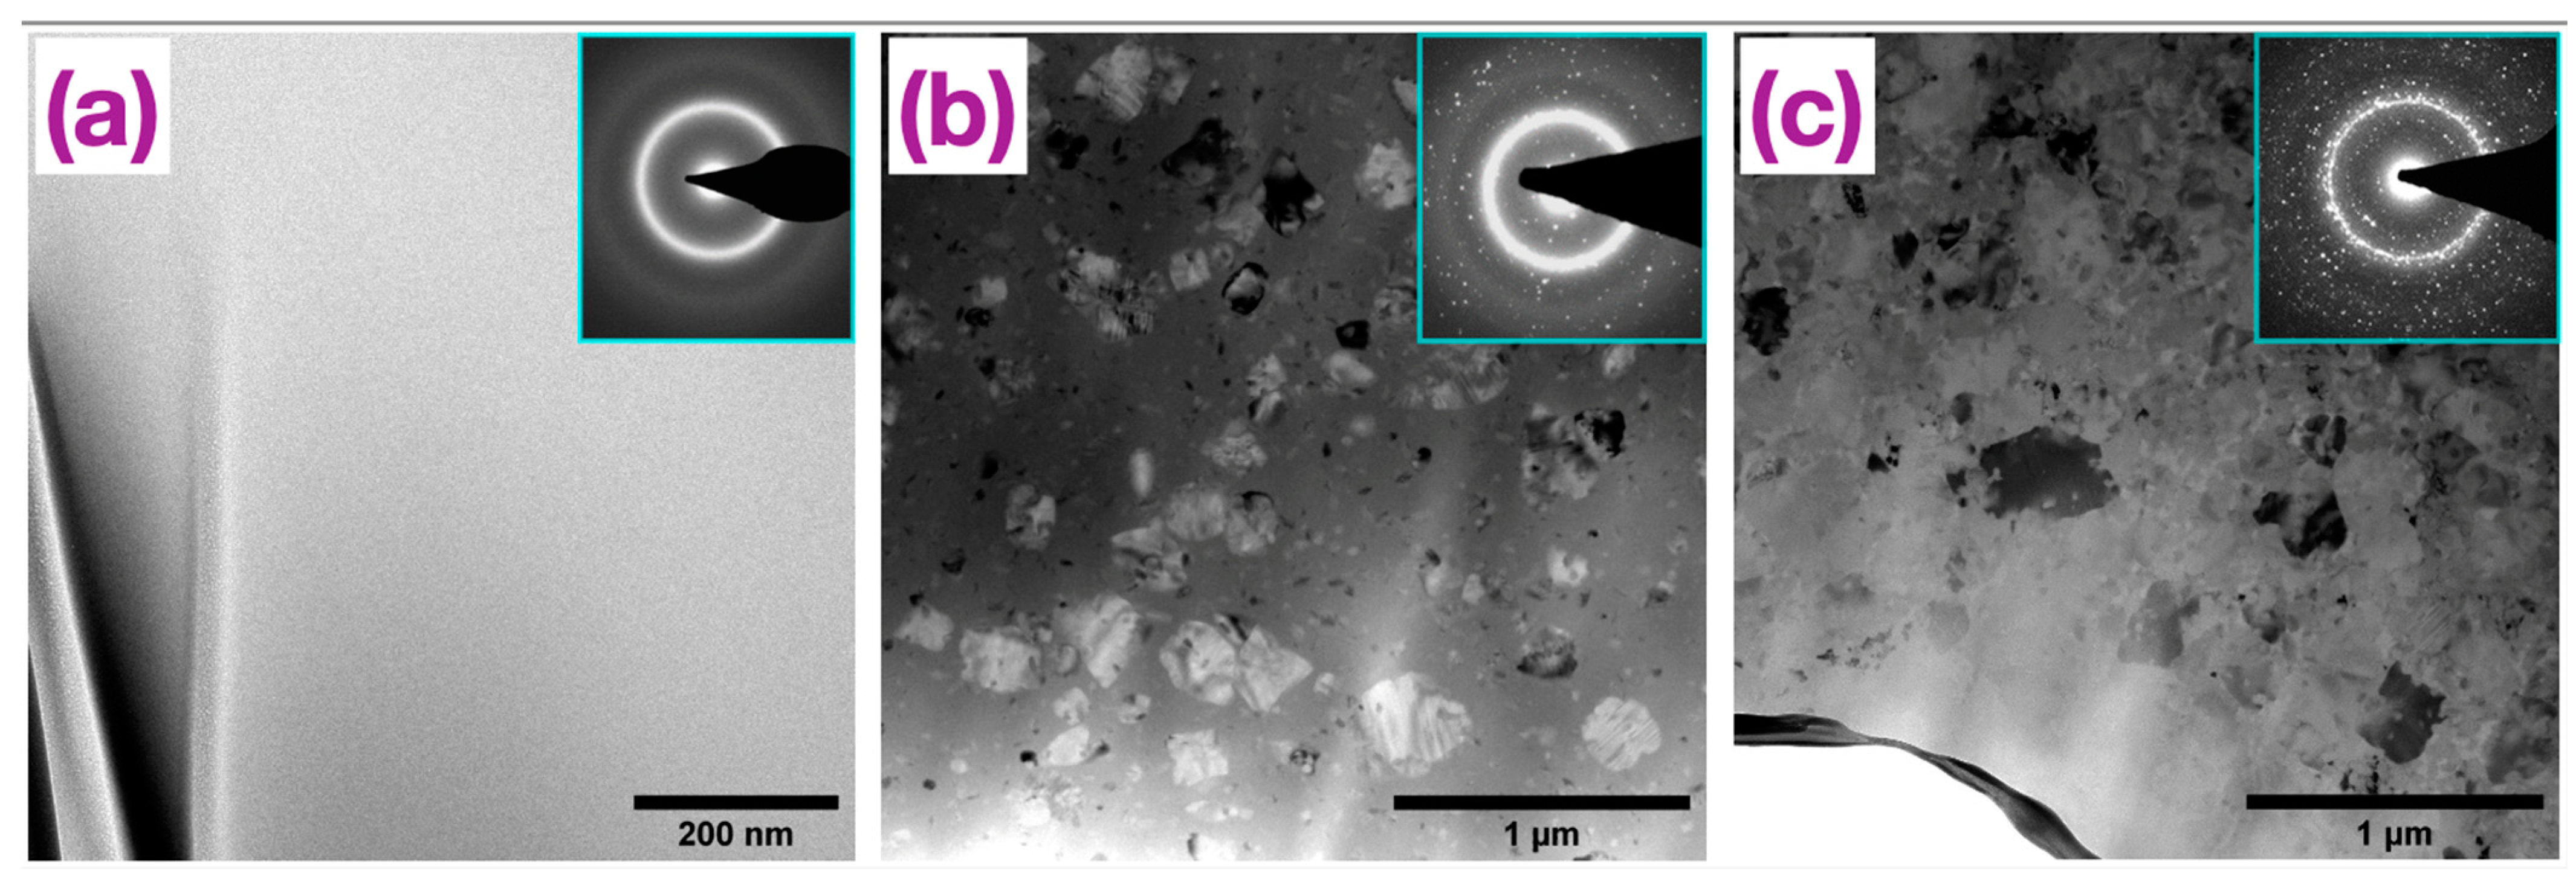
Figure 9 presents the bright-field images and overall SAED patterns of the same three specimens as in
Section 3.3: one as-cast (a), one annealed at 475 °C for 34 min (b), and one annealed at 475 °C for 65 min (c). The TEM image of the as-cast specimen is smooth and featureless (note that the contrast at the lower left corner is due to thickness variation), typical of amorphous materials. The diffraction pattern consisting of two diffuse rings further confirms the amorphous structure of the specimen. This is also consistent with the XRD result presented in
Figure 8a.
The TEM image of the specimen annealed at 475 °C for 34 min in
Figure 9b exhibited nearly equiaxed crystals of various sizes embedded in a featureless matrix. The corresponding overall SAED pattern was composed of both diffuse amorphous rings and discrete spots from crystal grains. Both the image and the diffraction pattern confirm the glass–crystal composite structure of this partially crystallized specimen, consistent with the XRD data in
Figure 8b.
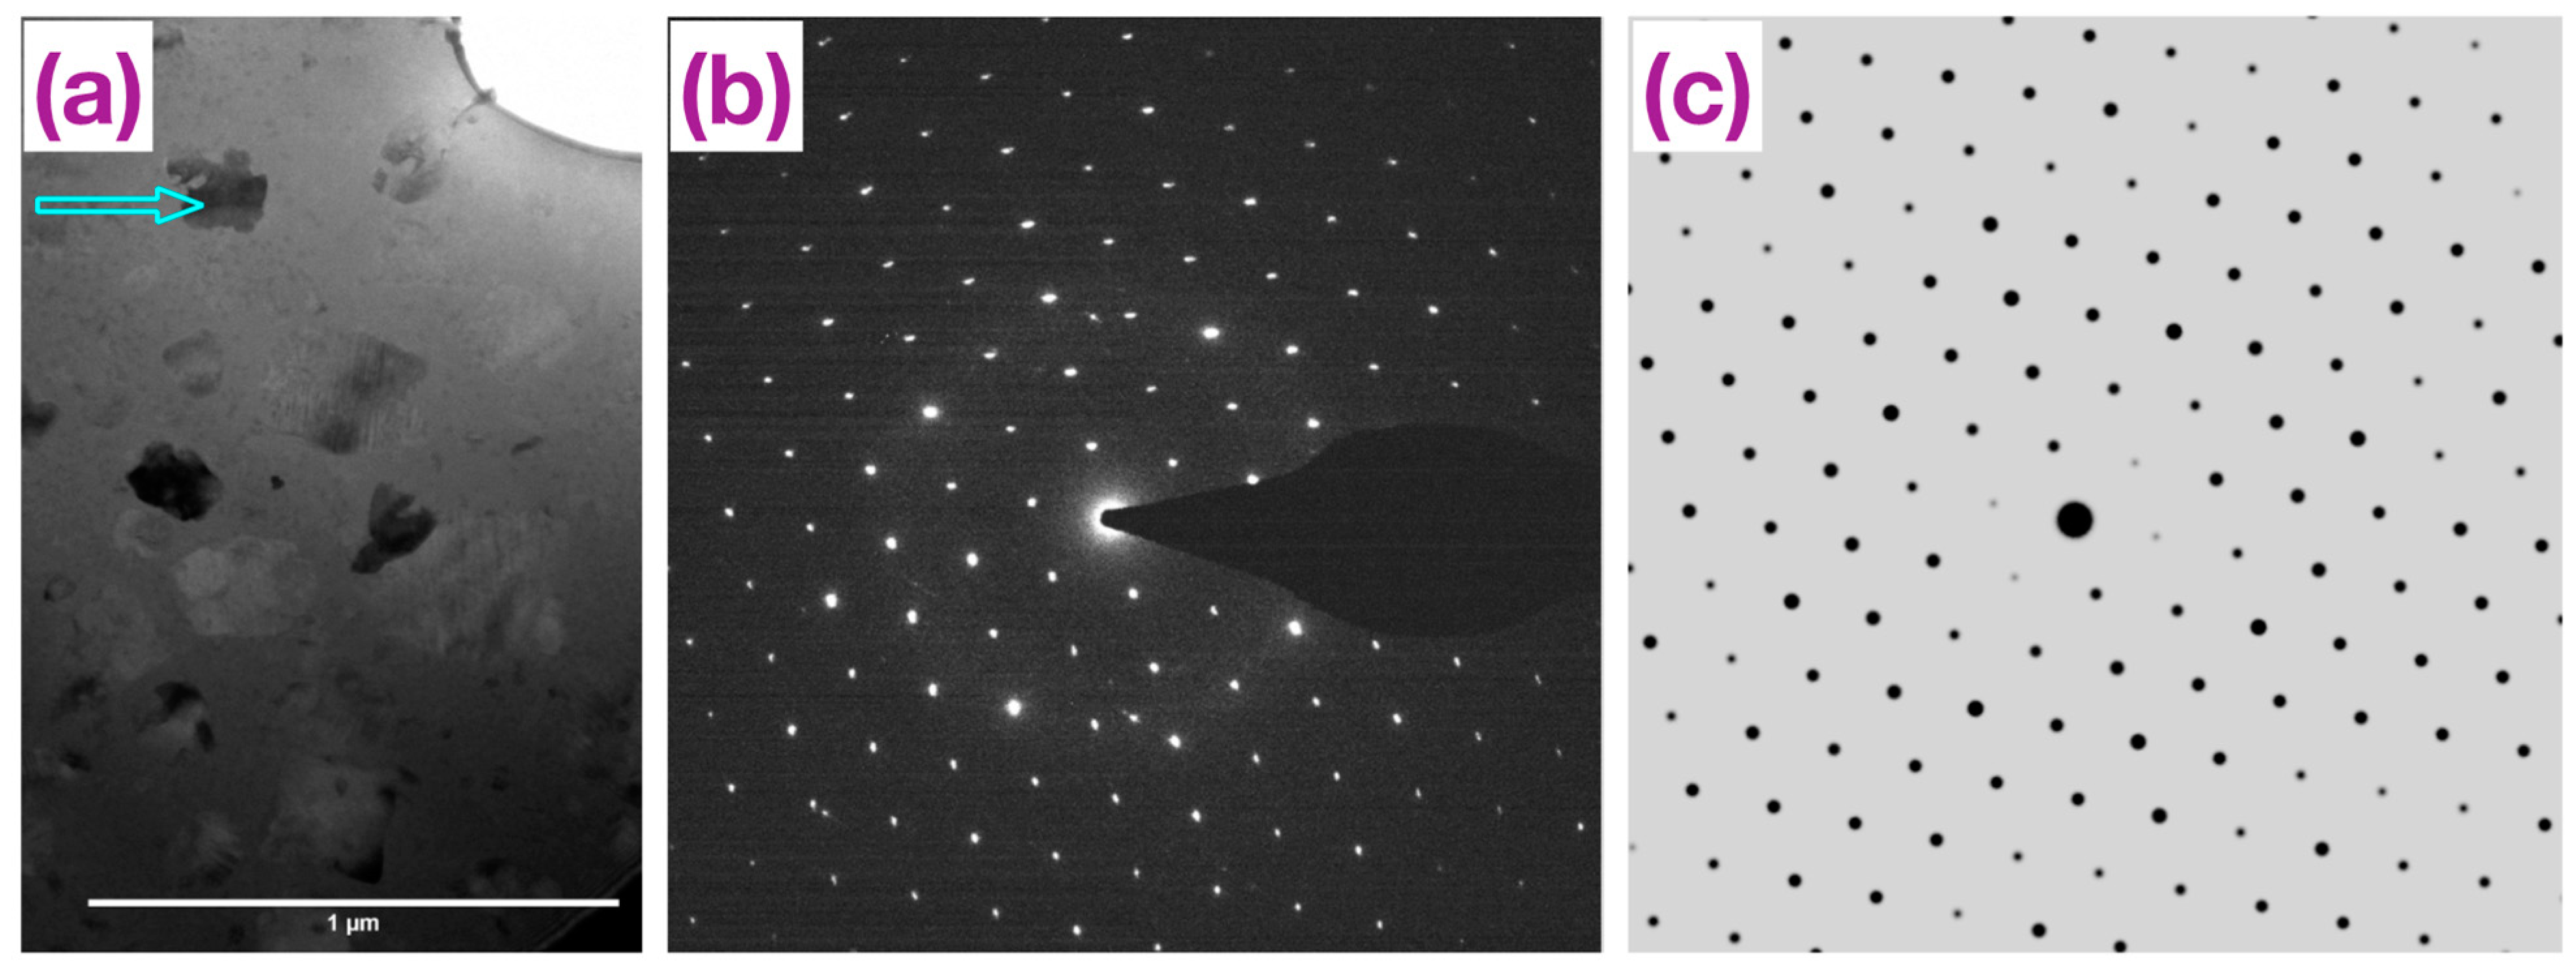
To verify the Cu
10(Zr,Hf)
7 primary crystal phase identified from the XRD data analysis, more targeted SAED patterns were collected of single grains in the partially crystallized specimen by isolating the grains with a selected area aperture.
Figure 10b shows an example of a single-crystal-like diffraction pattern taken from the grain marked in
Figure 10a. The pattern was found to closely match the [0 1 1] zone axis pattern of Cu
10Zr
7 in the ICDD (International Centre for Diffraction Data [
33]) database (PDF Card #01-082-3014) that is shown in
Figure 10c. As mentioned earlier in
Section 3.3, binary compounds Cu
10Zr
7 and Cu
10Hf
7 possess the same structure and similar lattice parameters and, hence, this reference pattern is representative of Cu
10(Zr,Hf)
7 with random substitution of Zr and Hf on their sublattice. The close match between the measured and reference electron diffraction patterns here provides additional support for the Cu
10(Zr,Hf)
7 as the primary crystal phase, affirming the earlier XRD analysis.
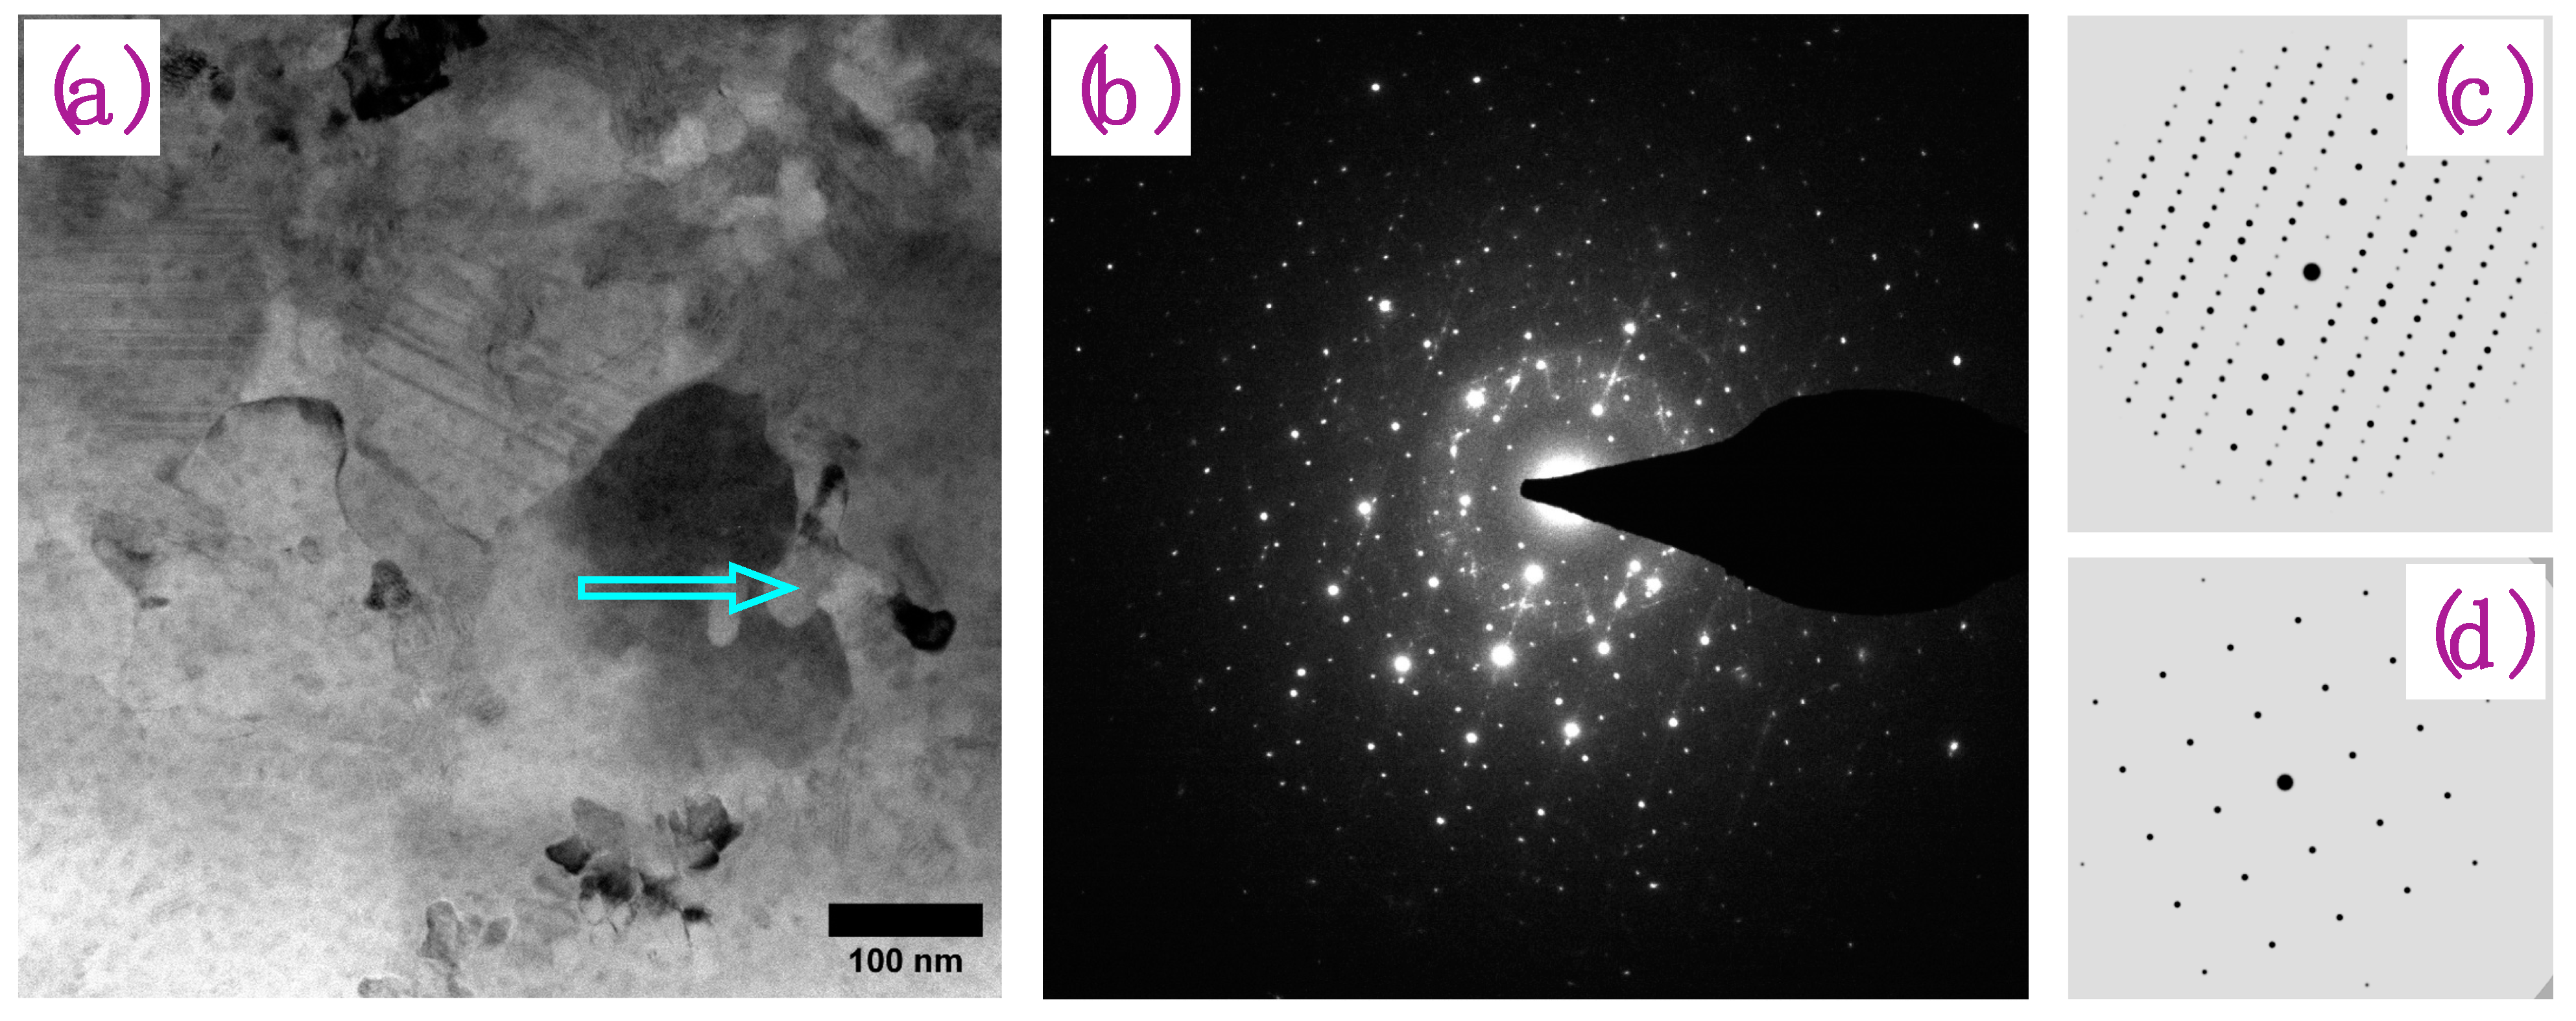
The TEM image (
Figure 9c) of the specimen annealed at 475 °C for 65 min showed the relatively bigger primary crystals together with the finer microstructure in between them throughout the specimen, the latter attributable to the second crystallization event. The overall diffraction pattern comprised a high density of spots, some of which appeared to have connected into a thin ring that is typical of a polycrystalline structure with random grain orientations. Selective diffraction targeting the finer microstructure between the primary crystals resulted in a complex moiré pattern due to double diffraction events involving two crystalline phases, as shown in
Figure 11b (taken from the grain marked in
Figure 11a). The pattern resembles a superimposition of the [1 0 0] pattern of Cu
10Zr
7 and the [0 0 1] pattern of the CuZr
2 (PDF Card 04-002-0044, same structure as CuHf
2) in the ICDD database, which are displayed in
Figure 11c,d, respectively, with additional spots from the moiré. This affirms the conclusion from the XRD analysis that Cu(Zr,Hf)
2 is a new phase produced in the second crystallization event. The double diffraction with superimposed Cu(Zr,Hf)
2 and Cu
10(Zr,Hf)
7 patterns is believed to be caused by the technical difficulty in finding a single Cu(Zr,Hf)
2 grain that is not interrupted by primary Cu
10(Zr,Hf)
7 crystals upon diffraction, because the Cu(Zr,Hf)
2 grains are very small.
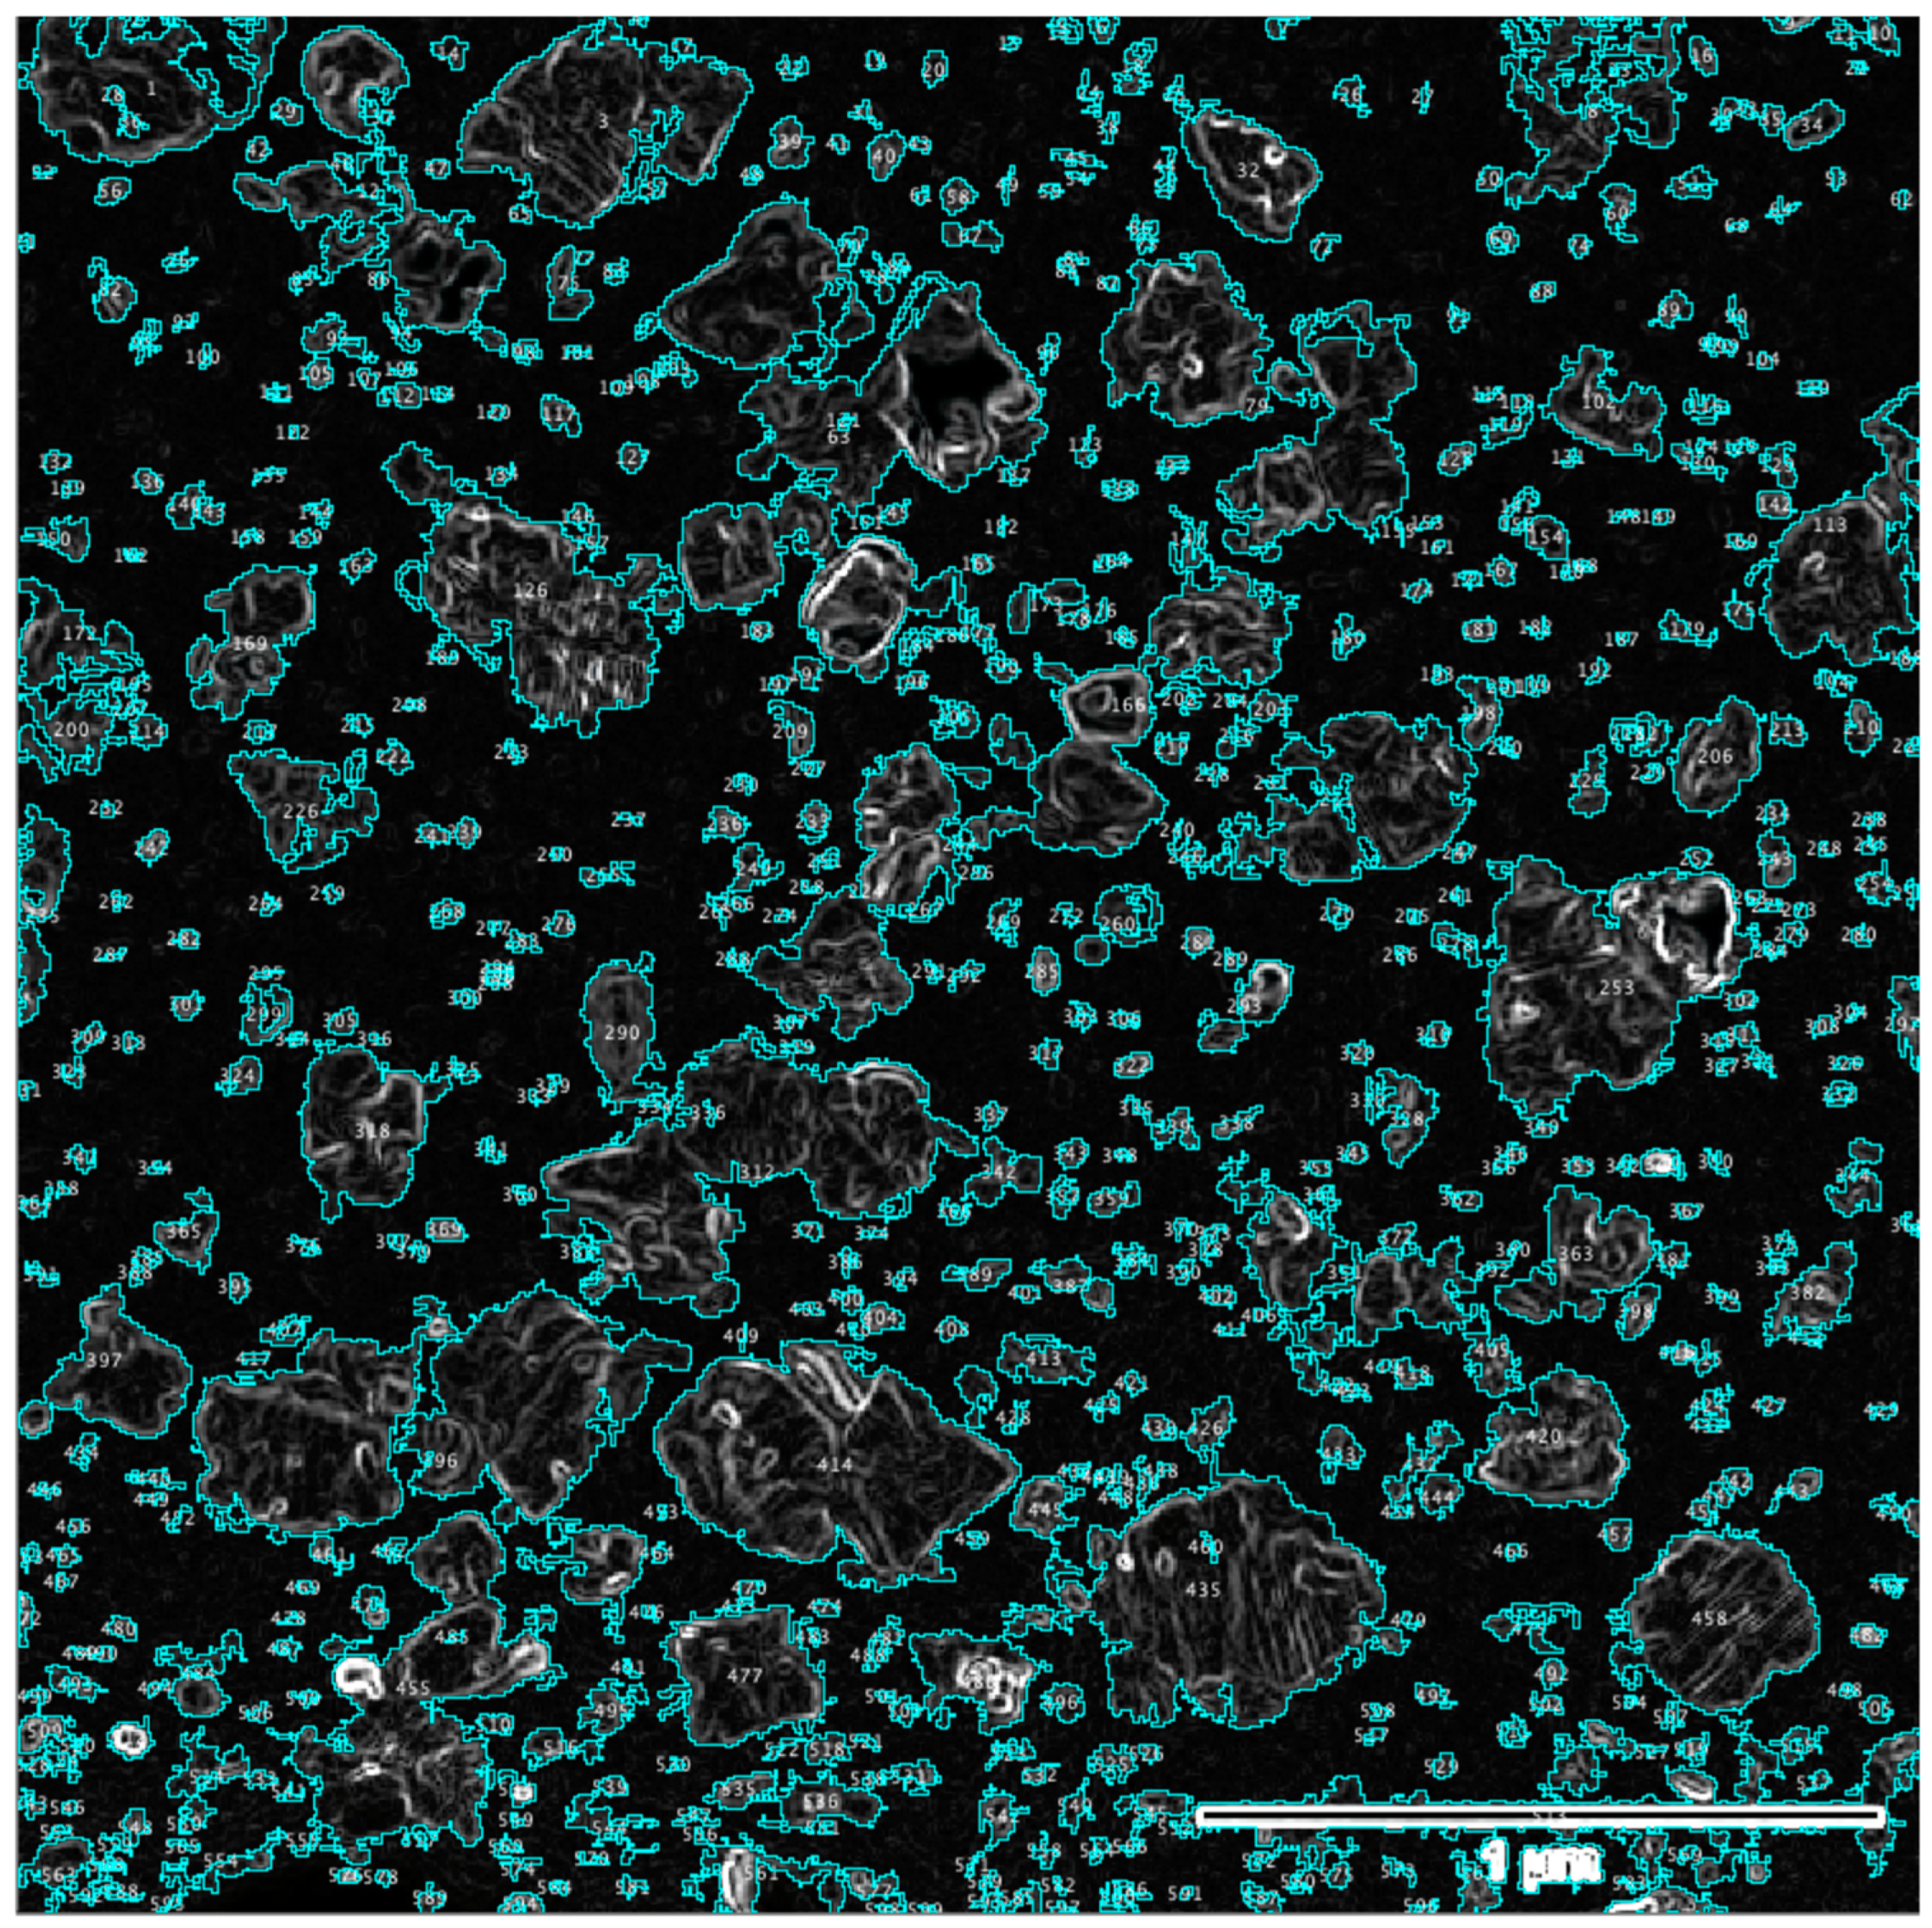
Finally, we made some broad estimates of number density and nucleation and growth rates of the primary crystals based on the TEM image (
Figure 9b) of the specimen annealed at 475 °C for 34 min. The open-source program ImageJ [
34] was used to perform particle (here, crystal grains) analysis of the TEM image. The identified grains are shown in
Figure 12, the total number of which was 599. The areal fraction of the identified grains with respect to the entire image is 27%. According to the cumulative transformation curves in
Figure 6, the transformed fraction corresponding to 34 min at 475 °C is 34%. These two fractions are in quite good agreement, especially if one considers the differences between the area-based statistics in the 2-D image analysis here and the heat-based (close to but not exactly the same as 3-D volume-based) statistics in the DSC data analysis.
The number density of the primary crystals was estimated to be 1.6 × 10²¹ m−3 using the total number of identified grains, the area of the image (2.75 × 2.75 μm), and the approximated thickness of the TEM foil in this region (50 nm). This number density is many orders of magnitude higher than the grain population (≈1012 to 1015 m−3) in conventional metals/alloys that typically have a tens-of-micron grain size. This comes as a result of the deeply supercooled state of the crystallizing liquid (here, glass heated above its glass transition temperature), which favors the nucleation of new nuclei over the growth of existing ones.
Using the number density and the annealing time (deducting the ≈12 min incubation time revealed by DSC data analysis), the nucleation rate of the primary crystals was estimated to be 1.2 × 10
18 m
−3 s
−1. This is on the same order of magnitude as the maximum nucleation rate previously reported [
35] for Pd
40Cu
30Ni
10P
20, another BMG with outstanding glass-forming ability that is based on the precious metal Pd. On the other hand, this nucleation rate is more than ten orders of magnitude higher than the maximum nucleation rate [
35] in Zr
41.2Ti
13.8Cu
12.5Ni
10Be
22.5, yet another well-known BMG with an outstanding glass-forming ability which contains a substantial amount of the toxic element Be.
To estimate the growth rate, the biggest primary crystals in the TEM image (
Figure 9b) that had a diameter of ≈500 nm were considered to have nucleated and started to grow at the end of the incubation time (12 min) and, hence, had grown over a time period of 22 min. This yielded an approximate growth rate of 0.38 nm/s, which is extremely low.
It is noted that these estimates of crystal number density and nucleation and growth rates are only for 475 °C and an annealing time of up to 34 min. Nevertheless, they do suggest that the high glass-forming ability of the Cu46Zr33.5Hf13.5Al7 BMG is mainly due to the slow crystal growth, similar to the case of Pd40Cu30Ni10P20. The estimated high nucleation rate together with the low crystal growth rate implies a good opportunity to control the crystallization of the BMG towards glass–nanocrystal composite or fully nanocrystalline structures.

 ,
, 


