Article

Nucleation Kinetics of Rare Earth Scandium Salt: An Experimental Investigation of the Metastable Zone Width

AVT-Fluid Process Engineering, RWTH Aachen University, Forckenbeckstraße 51, 52074 Aachen, Germany
*
Author to whom correspondence should be addressed.
Crystals 2023, 13(7), 1074; https://doi.org/10.3390/cryst13071074
Submission received: 20 June 2023 / Revised: 3 July 2023 / Accepted: 5 July 2023 / Published: 8 July 2023
(This article belongs to the Special Issue Aggregation, Nucleation and Crystallization)

Abstract

:
Scandium is a rare earth element that has been declared a critical raw material by the EU. Its availability is low but the demand for it is increasing. Bauxite residue presents a possible European source. A novel process to extract scandium from the residue incorporates anti-solvent crystallization, which delivers the scandium salt (NH4)3ScF6 that can be calcined to ScF3 for direct use in an aluminum alloy. However, this crystallization process produces small crystals in the single-digit micrometer scale, hindering solid–liquid separation. In order to facilitate the separation, the crystallization process needs to be better understood and controlled. Therefore, nucleation kinetics are investigated by measuring the metastable zone width (MSZW) with an optical endoscope probe inside a 300 mL stirred fed-batch crystallizer with varying operating parameters. To study the influence of mixing on the MSZW, the stirring rate, the antisolvent addition rate, and the dilution of the antisolvent before injection are varied. The latter is proven to widen the MSZW by a multiple. It could be confirmed that mixing times on different scales greatly influence the MSZW and the growth of the crystals in the process. With these results, the boundaries for operating parameters are studied in order to control the crystallization process and thus crystal growth.

1. Introduction

Scandium is a rare earth element, which has recently grown in popularity because of its useful applications in aluminum alloys or solid oxide fuel cells (SOFC) [1,2]. It can enhance the strength of the alloy by 20% to 25% resulting in 10% to 15% weight reduction, which makes it ideal for lightweight applications in aviation [1]. When scandium is added to an aluminum alloy it reduces the tendency for recrystallization by forming fine Al3Sc particles which lead to grain refinement, higher creep resistance, increased hardness, and improved tensile strength [1]. Further, scandium enhances conductivity better than yttrium in a stabilized zirconium ceramic used as a solid electrolyte in SOFCs [2]. The ionic radii of scandium ions (Sc3+: 0.87  Å) are more similar to zirconium ions (Zr4+: 0.84  Å) than yttrium ions (Y3+: 0.94  Å), which reduces steric blocking [3]. There are no feasible primary sources for scandium in the EU, which necessitates imports from China, Russia, or Ukraine, with the associated economic risks. Therefore, the European Commission and also the Office of the Secretary of the United States labeled it a critical raw material (CRM) in 2017 and 2018, respectively [4,5]. As the scarcity of the element in a pure form limits its use, research toward secondary scandium sources gains traction. Secondary production of scandium means that it is a by-product of the production of a different main product, for example, aluminum. Other sources, like titanium, with a significant amount of scandium in the ore, can be used for scandium recovery in a similar way. The state-of-the-art production route of scandium fluoride, used in a purified form in the aluminum alloy, starts with the hydrometallurgical residue stream of aluminum production called bauxite residue or red mud. The residue stream is leached using sulfuric acid [6]. Afterward, scandium can be selectively concentrated by a reactive solvent extraction using Cyanex or Di-(2-ethyl hexyl) phosphoric acid (D2EHPA) into an organic phase. A subsequent stripping step using sodium hydroxide extracts the scandium back into an aqueous phase. Depending on the pH value scandium hydroxide already precipitates at this step. To control the precipitation 5 mol L−1 NaOH is used to produce soluble Sc(OH)63− species which precipitate when diluted with water as Sc(OH)3. In a more acidic environment using oxalic acid, scandium oxalate (Sc2(C2O4)3) can be precipitated [7,8,9,10,11]. This precipitated oxalate then needs to be calcined at temperatures from 700 °C to 800 °C to obtain scandium oxide (ScO3) [10,12]. The last step is fluorination using hydrofluoric acid to produce scandium fluoride [13].
An alternative process route uses ammonium fluoride (NH4F) instead of NaOH to strip the scandium from the extractant at the back extraction step. This yields a scandium-enriched ammonium fluoride solution [14,15]. In the subsequent precipitation process, an organic antisolvent, which is miscible with water can be used to produce the scandium salt. Due to the low solubility of the salt in the organic antisolvent, more salt crystallizes when the antisolvent amount in the mixture is increased. Possible and tested antisolvents are ethanol, methanol, 2-propanol, and 1,3-propane-diol [16,17]. All of the mentioned antisolvents can recover more than 97.3% of the scandium salt at a concentration of 8 mol L−1. 2-propanol is an exception because it forms a second liquid phase when concentrated higher than 4 mol L−1 in a 3 mol L−1 NH4F solution. Taking the recovery of the antisolvent into account methanol and ethanol are preferred due to their low boiling point of 64 C and 78 C , respectively. Methanol poses a higher health risk to humans and, therefore, the authors recommended ethanol as the most suitable antisolvent for this process [17]. Different stoichiometric variations of scandium ammonium fluoride salts can form depending on the initial NH4F concentration and the temperature during crystallization. The most dominant form, (NH4)3ScF6, is obtained at NH4F concentrations between 1 mol L−1 to 12.2 mol L−1 and 25 C when alcohol is added [17].
Crystallization of the scandium salt by cooling has been studied in comparison to the antisolvent approach [15]. Cooling crystallization yields less than 50% of the crystals at temperatures down to 1 C . Scandium yields from antisolvent crystallization reach values above 90% when calculated from solution concentrations [15]. When comparing the yields of the different methods and the rather easy recovery of the alcohols used as antisolvent, the latter method appears to be more economical. The trade-off is that antisolvent crystallization produces very small crystals because of high local supersaturations and, therefore, strong primary nucleation. Those small crystals make it difficult to filtrate and wash the crystals [15]. In subsequent work, Peters et al. [18] studied different strategies to control the crystal growth of scandium salt crystals. Controlling the antisolvent addition rate and the dilution of the antisolvent before addition to the scandium solution were two of the largest influences on the crystal size distribution [18]. It was found that the crystals grow the most when the mixing conditions are enhanced which can be achieved by lowering the addition rate of the antisolvent and placing the addition position close to the stirrer. In addition, the reduction in the antisolvent concentration by dilution with water before injection into the scandium solution leads to larger crystals. However, the experiments are executed in lab scale with 20 g of solution at the start. It is therefore recommended to study the process in a scaled-up apparatus with more proximity to an industrial application.
Mixing is well known to have a great influence on crystallization processes, especially when high local supersaturations occur, which is the case with antisolvent crystallization [19,20,21]. The metastable zone width (MSZW) is used to correlate the primary nucleation rate to the supersaturation in an initially particle-free environment. It describes how far a solution can be supersaturated before a spontaneous nucleation event happens [19]. Nucleation in antisolvent crystallization can happen prematurely if the local concentration gradients become large enough. In this case, the supersaturation cannot be distributed quickly enough within the whole volume of the crystallizer. The result is that the supersaturation is converted mostly into small nuclei which then fail to grow, rendering the process difficult to control. O’Grady et al. [21] studied the influence of mixing on the MSZW by varying the position of the antisolvent addition, the antisolvent addition rate, and the stirring speed in a stirred tank crystallizer. They found that the antisolvent dosing position close to the wall and far away from the stirrer leads to more inconsistent results and a narrower MSZW. When the antisolvent is added very close to the stirrer the results become more reproducible and the MSZW wider. In this configuration, they studied the effect of the stirring speed and found, that the MSZW becomes narrower at higher stirring speeds. This can be explained by a higher probability of contact between solute molecules leading to earlier nucleation. Similar results can also be shown by Chaitanya et al. [22].
This study aims to understand the primary nucleation kinetics of the antisolvent crystallization of scandium in order to control and increase crystal growth during the antisolvent crystallization process and, thus, enhance the solid–liquid handling in potential industrial production.

2. Theory

To calculate the primary nucleation rate, there are different approaches [21,23,24]. One method is measuring the induction time in a particle-free solution. This is achieved by quickly creating a supersaturation before waiting for a crystal to form. This method is only viable when the time to create the supersaturation is much lower than the induction time itself [23]. Alternatively, the nucleation rate can be determined from measured MSZWs. Here the supersaturation is constantly increased until nucleation happens. The rate of supersaturation generation is then taken into account instead of the time it took to form a crystal. Both methods are viable to calculate the primary nucleation rate [19,23]. Due to the fast nucleation of the studied scandium salt in this work, the latter method of measuring the MSZW is applied.
The nucleation rate in a crystallization process from solution is usually described by the classical nucleation theory as
J = A · exp B ln S 2 .
In the literature, Equation (1) is used to describe homogeneous and heterogeneous primary nucleation by measurements of induction times [24,25]. The concept of homogeneous primary nucleation, however, is regarded as a theoretical concept rarely seen in experimentation. The more justified method is the semi-empirical form derived from the classical nucleation theory by Nývlt [26]. With the nucleation rate constant k 0 , the order of nucleation n and the absolute supersaturation Δ c = c c * ( g S a l t / g S L ) instead of the relative supersaturation S = c / c * the nucleation rate can be calculated as [27]:
J = k 0 · Δ c n .
In order to use the MSZW to calculate the nucleation rate the following assumption is made by Nývlt [27]. At the moment of nucleation, the particle formation rate equals the rate of supersaturation generation. For antisolvent crystallization, O’Grady et al. [21] adjusts the approach from Nývlt and states the relation between the specific antisolvent addition rate R ( g AS g SL 1 s 1 ) and the generation of supersaturation d Δ c / d t as:
d Δ c d t = R d c * d A .
The antisolvent addition rate is calculated as the mass of antisolvent ( g A S ) added per mass of the initial solution ( g S L ) per time. Using a linear approximation of the antisolvent dependant solid–liquid equilibrium d c * / d A the MSZW A m a x ( g A S / g S L ) can be related to the maximal supersaturation Δ c m a x at the point of nucleation with
Δ c m a x = Δ A m a x d c * d A .
The MSZW is expressed as the difference in antisolvent concentration between the concentration at the solid–liquid equilibrium and the point of nucleation as:
Δ A m a x = A n u c A * .
The particle formation rate can be described as
d M d t = k 0 k v ρ c r y s t r n u c 3 Δ c n = k n Δ c n
where M ( g   m 3 ) is the Mass of nuclei, k v is the volumetric shape factor, ρ c r y s t ( g   m 3 ) is the crystal density and r ( m ) is the radius of nuclei. With k n the aforementioned constants are summarized. With the assumption of Nývlt, Equation (3) is equated with Equation (6) and at the point of nucleation Δ c equals Δ c m a x and Equation (4) can be inserted into Equation (6) to
R d c * d A = k n Δ A m a x d c * d A n .
By taking the logarithm on both sides the linear equation
l o g ( R ) = ( n 1 ) log d c * d A + log ( k n ) + n log ( Δ A m a x )
can be used to fit the parameter n and k n . When plotting log ( R ) over log ( Δ A m a x ) the nucleation order, n, equals the slope. k n can be calculated using the intercept on the log ( R ) -axis, the nucleation order, n, and the linear approximation of the solid–liquid equilibrium d c * / d A .
The adjustment made by O’Grady et al. [21] to use the nucleation kinetic by Nývlt [27] for antisolvent crystallization has been successfully used and extended for other antisolvent and also pH-shift crystallization processes [22,23,28].

3. Materials and Methods

3.1. Preparation of Scandium Solution

The solution is produced from distilled water and 3 mol L−1 of ammonium fluoride (EMSURE, purity ≥ 98%, Merck KGaA, Darmstadt, Germany). Scandium ammonium fluoride salt is produced from the strip liquor provided by MEAB Chemie Technik GmbH, Aachen, Germany. By solvent extraction of a scandium sulfate solution into an organic phase and stripping with ammonium fluoride solution back into an aqueous phase, a sulfate-free scandium ammonium solution is produced [17]. The strip liquor initially has a pH value of 5.5, which is problematic due to hydrofluoric acid formation. Hydrofluoric acid has a p K a value of 3.14. At a pH value of 5.5, there is still a significant amount of undissociated hydrofluoric acid. The synthesized 3 mol L−1 ammonium fluoride solution has a pH value of 7, where more hydrofluoric acid is dissociated, which makes it possible to experiment in a glass crystallizer. In order to gain (NH4)3ScF6 crystals the strip liquor is mixed with ethanol (EMSURE, purity ≥ 99.9%, Merck KGaA, Darmstadt, Germany). The dried crystals are then redissolved and stirred overnight for at least 14 h at 25 C in the prepared ammonium fluoride solution. The remaining particles are centrifuged for 10 min at 2900 rpm leaving a saturated solution without solids. When adding ethanol as an antisolvent, dissolved gasses can be drawn out, which would interfere with the optical determination of the nucleation. Therefore, the scandium-saturated solution is degassed by vacuum filtration with filter paper of 2.7   μ m , where a small but negligible amount of water is vaporized. Each measurement of the MSZW requires a volume of 300 mL of scandium-saturated solution. After the experiment, the precipitate is again centrifuged and dried to be reused in further experiments, which is necessary due to the number of experiments and supply of available (NH4)3ScF6 crystals. At the beginning of the experiment a 2.5 mL sample is taken and diluted with equal volumetric parts of distilled water. The sample is analyzed for scandium ions by the ICP-OES method at Analyselabor Fölsing, Aachen, Germany. The mass fraction of scandium in the (NH4)3ScF6 salt is 21 wt%. With the well-justified assumption that each scandium ion is crystallized in the aforementioned salt from a 3 mol L−1 NH4F solution at 25 C , the salt concentration can be calculated [17].

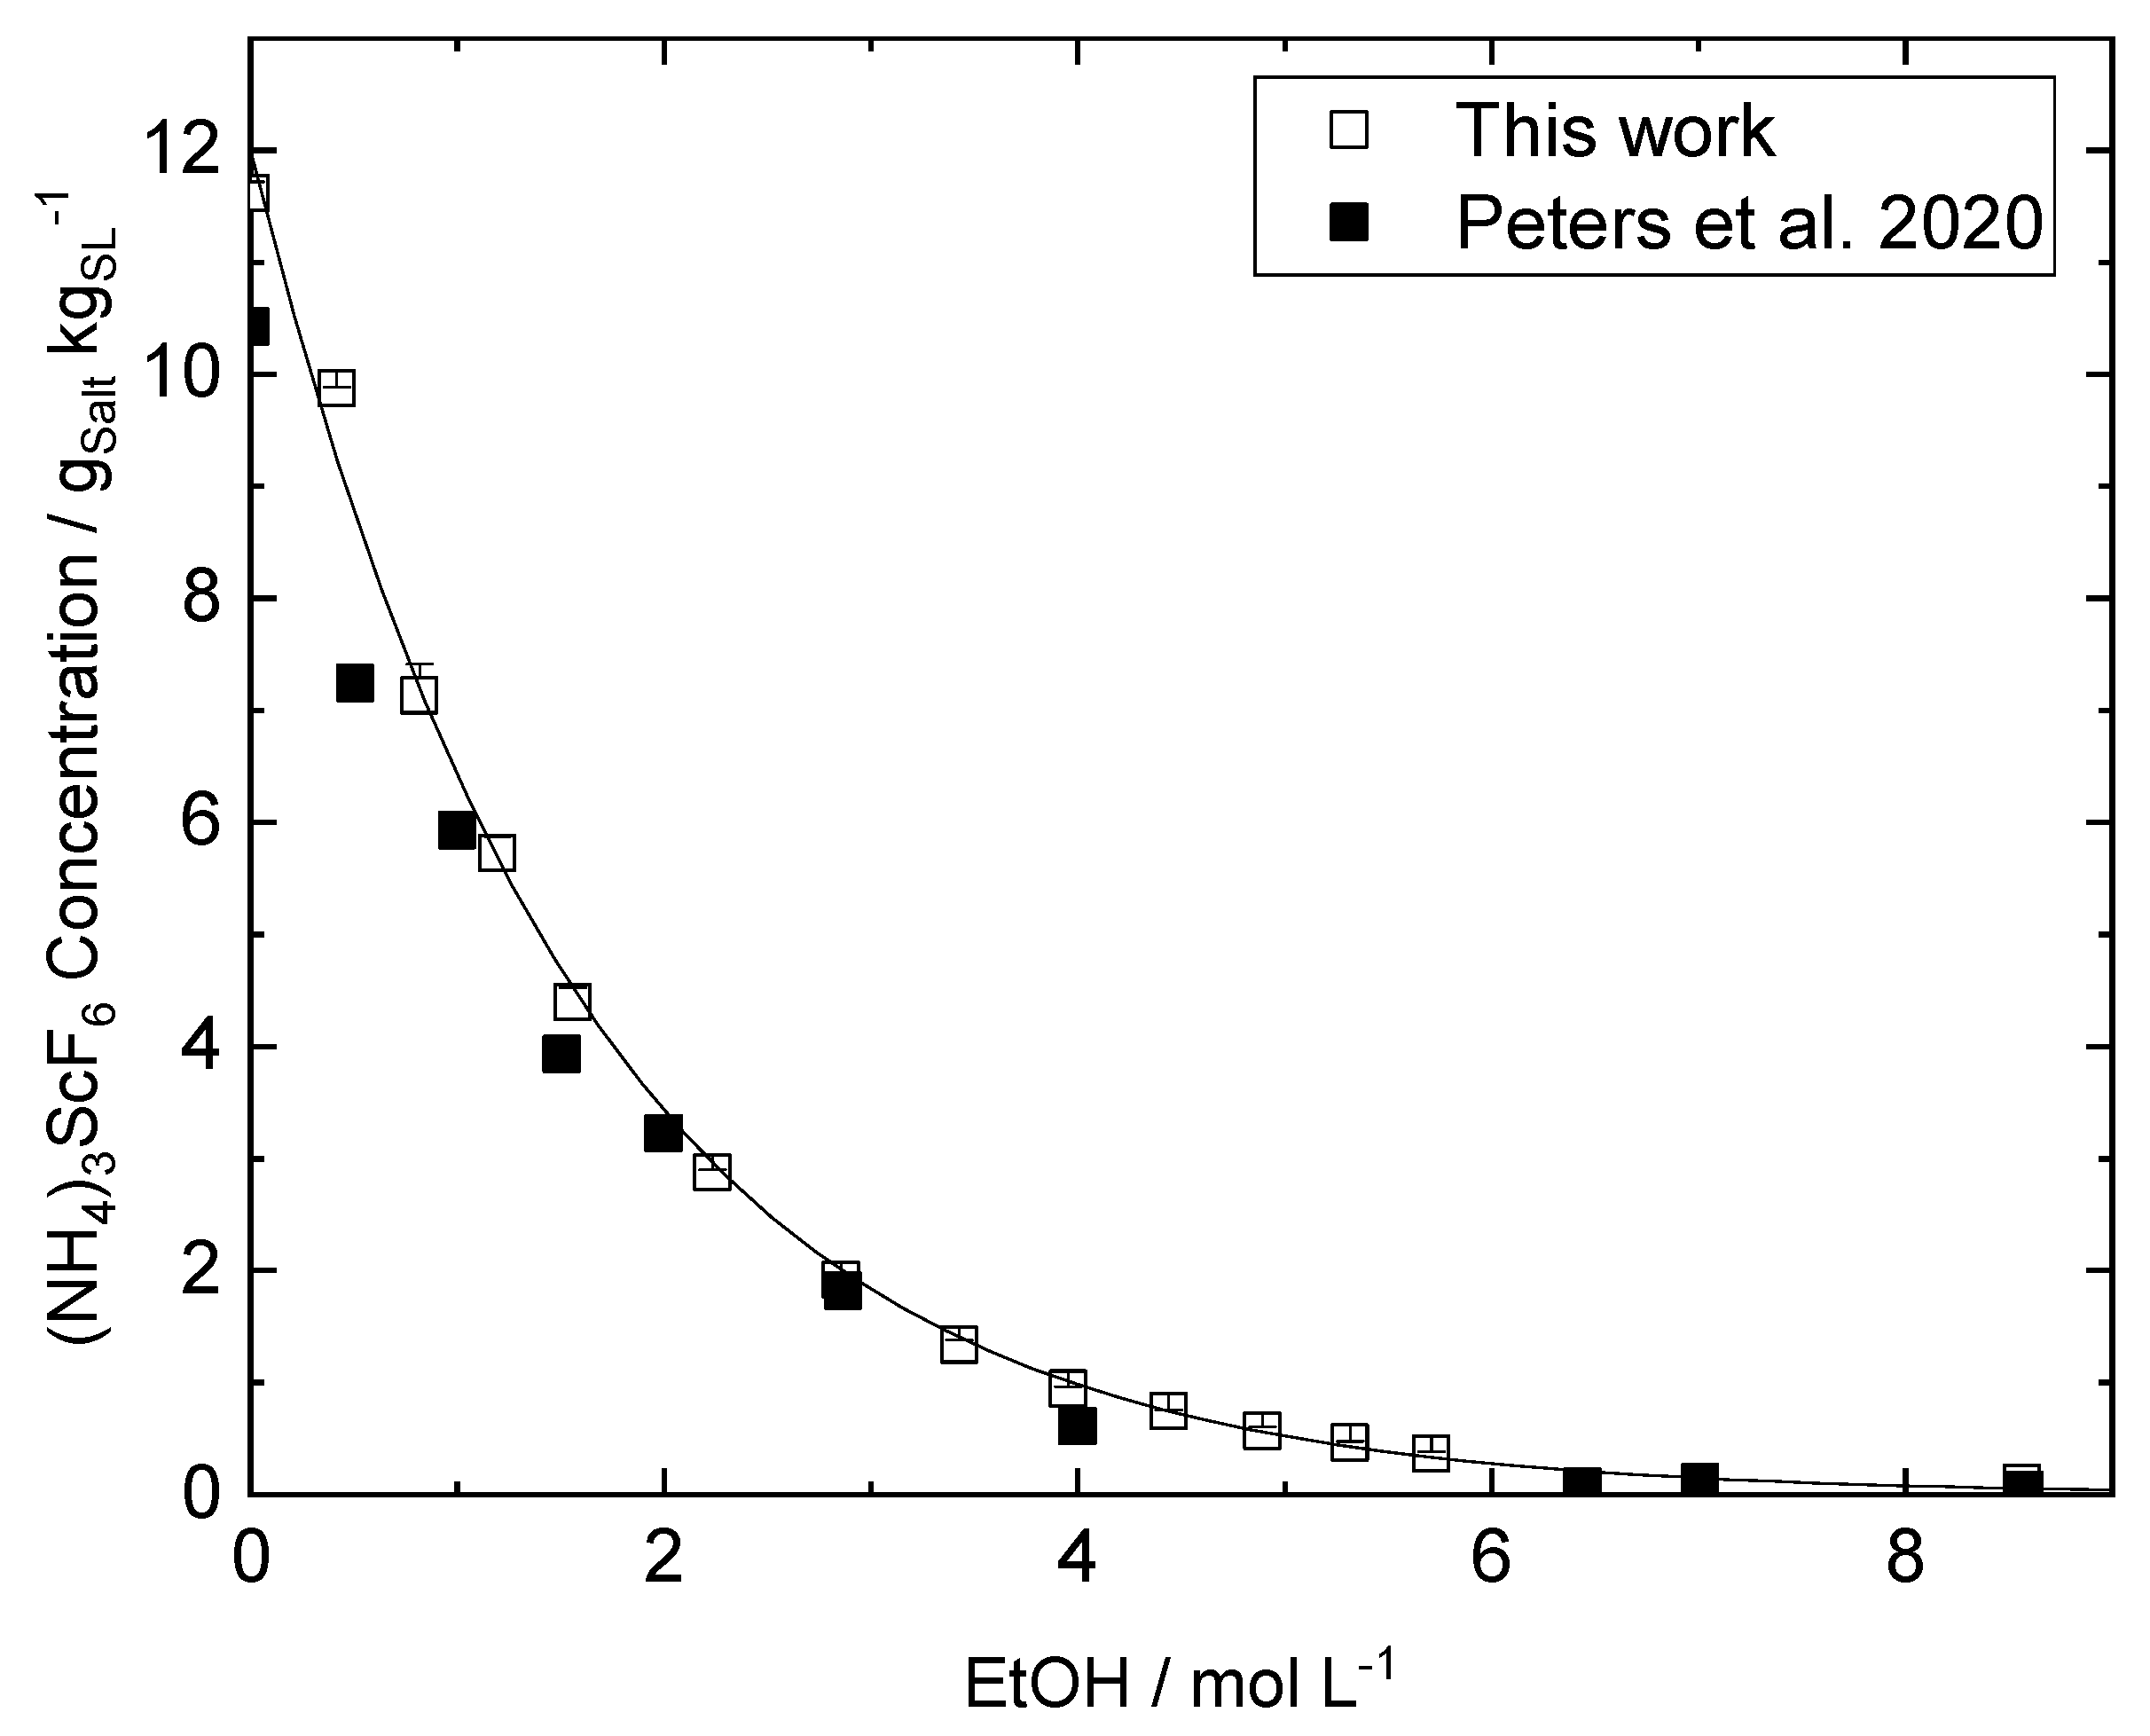
3.2. Solid–Liquid Equilibrium Measurements
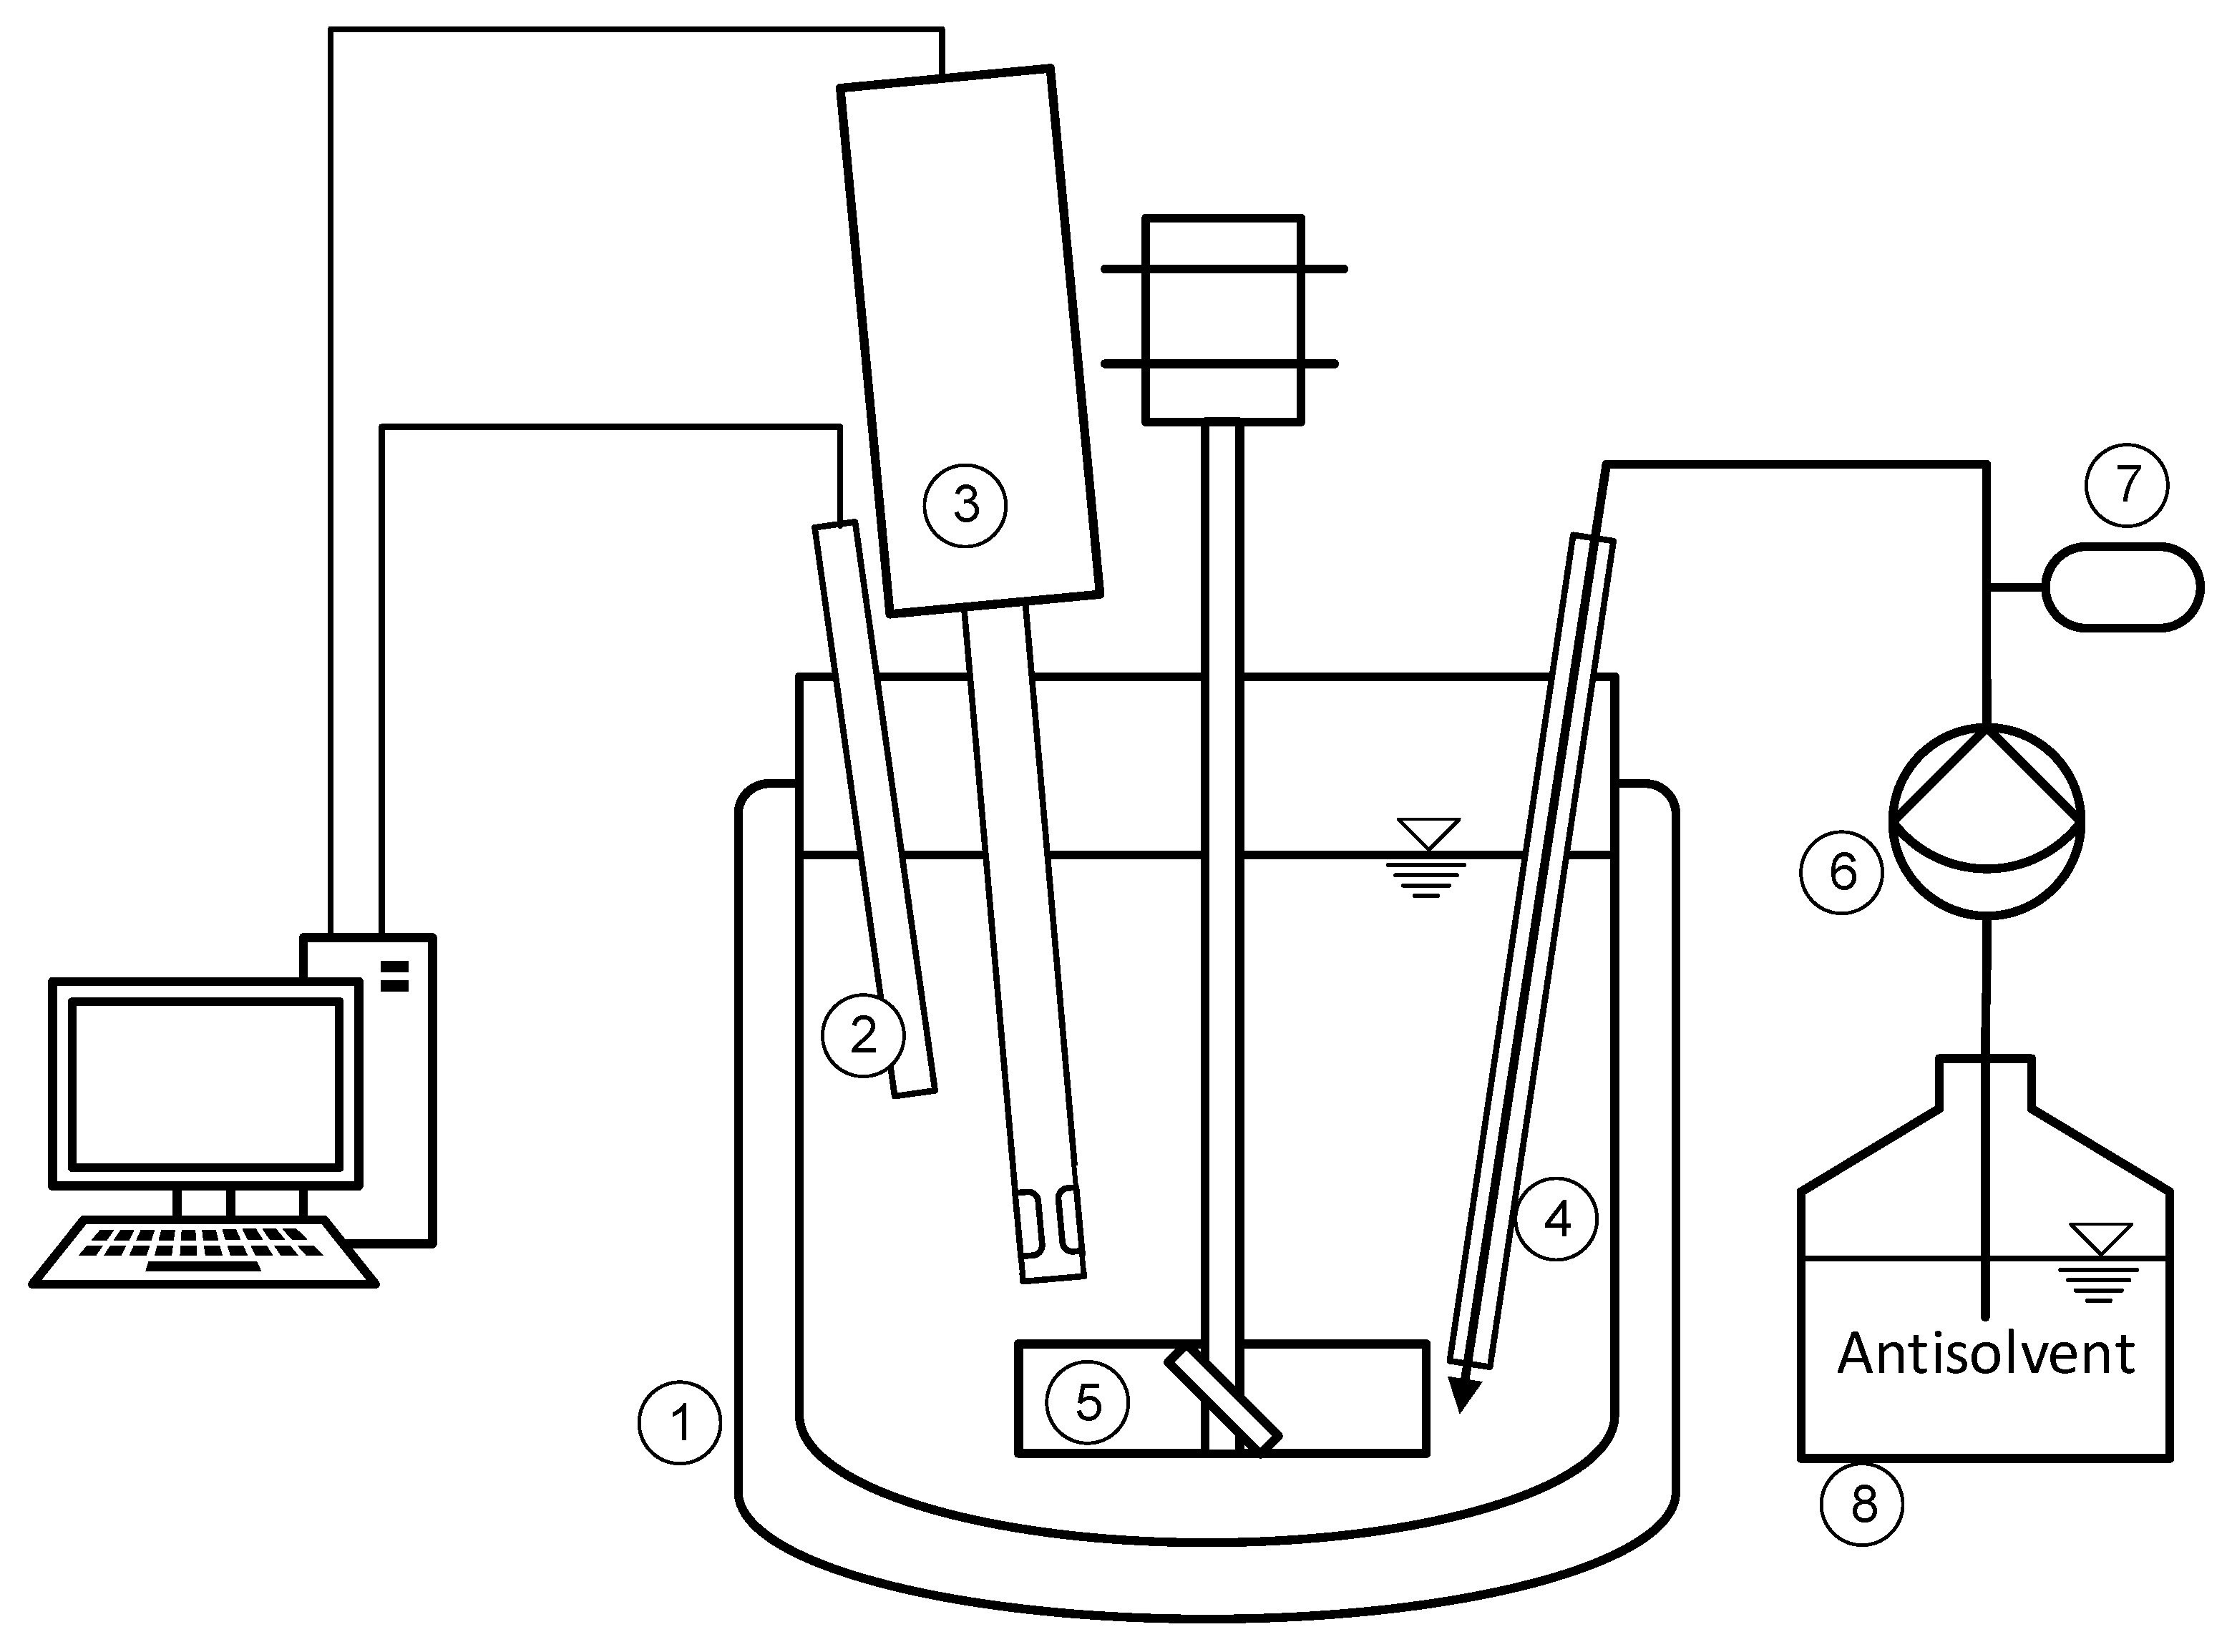
To determine the solid–liquid equilibrium at different concentrations of ethanol a scandium-saturated solution with 3 mol L−1 of ammonium fluoride is prepared as described in Section 3.1. Small samples of 10 mL of the solution are taken and the antisolvent is added. The sample vials are then stirred by a magnetic stirrer and tempered in a water bath at 25 C . The solution is saturated overnight for at least 14 h . Similar experiments show no significant change of scandium concentration at saturation times after 7 h [17]. After saturation, the suspension is checked for the visible presence of a solid phase before taking a sample through a syringe filter (CHROMAFIL Xtra, PES, 0.2   μ m , Macherey-Nagel GmbH & Co. KG, Düren, Germany) and diluting the sample with distilled water. All equilibrium measurements are performed in duplicates.

3.3. Setup

The experiment is set up as shown in Figure 1. The crystallizer (Type ATAV DN100, HWS GmbH & Co. KG, Mainz, Germany) is a three-wall vessel with a temperature jacket and outer insulating vacuum chamber. The stirrer is a down-pumping four-bladed pitched blade stirrer with a diameter of 40 m m and with 45 tilted blades. It is positioned 10 m m above the bottom of the crystallizer to ensure no sedimentation of crystals. The temperature probe, optical endoscope probe (SOPAT-VI Pa, SOPAT GmbH, Berlin, Germany), and antisolvent addition nozzle are fixed at the top. The antisolvent addition nozzle has a diameter of 1.8   m m and is positioned close to the stirrer as proposed in the literature to accelerate the mixing of the antisolvent for a wider MSZW and better control of the crystallization process and reproducibility [18,20,21,23]. The optical endoscope probe is positioned slightly above the stirrer and the measuring gap is oriented so the solution can flow through radially. The endoscope probe is a high-resolution camera, surrounded by a ring-shaped light source. The camera is facing a mirror with the solution flowing through the 2 m m gap between them. The position of the endoscope probe is chosen to be the furthest possible from the antisolvent addition nozzle to avoid visible Schlieren from the antisolvent. The antisolvent is added by a membrane pump (SIMDOS 02 FEM 1.02, KNF Neuberger GmbH, Freiburg, Germany) to assure a low pulsation. A pulsation damper is also positioned between the pump and the nozzle to further reduce pulsations at higher addition rates. For antisolvent addition rates above 20 mL min−1, a second pump of the same type is used and routed in parallel with an additional pulsation damper. The pump and the temperature were controlled by a labManager (HiTech Zang GmbH, Herzogenrath, Germany). The starting volume of scandium enriched solution is 300 mL. The use of baffles in the setup was tested, however, discarded because radial flow through the optical endoscope probe was not steady and, therefore, not as reliable. To study the influence of mixing on the MSZW the stirring speed and the antisolvent addition rate are varied between 50 and 500 rpm and 1 mL min−1 to 40 mL min−1, respectively. In addition, the antisolvent is added in two different compositions named operating modes one and two. In the first mode, the antisolvent is added at 100 vol % into the solution, and at 70 vol % in the second mode. Each operating parameter set is measured in triplets. Every experiment is terminated shortly after the turbidity of the solution becomes clearly visible to the eye.

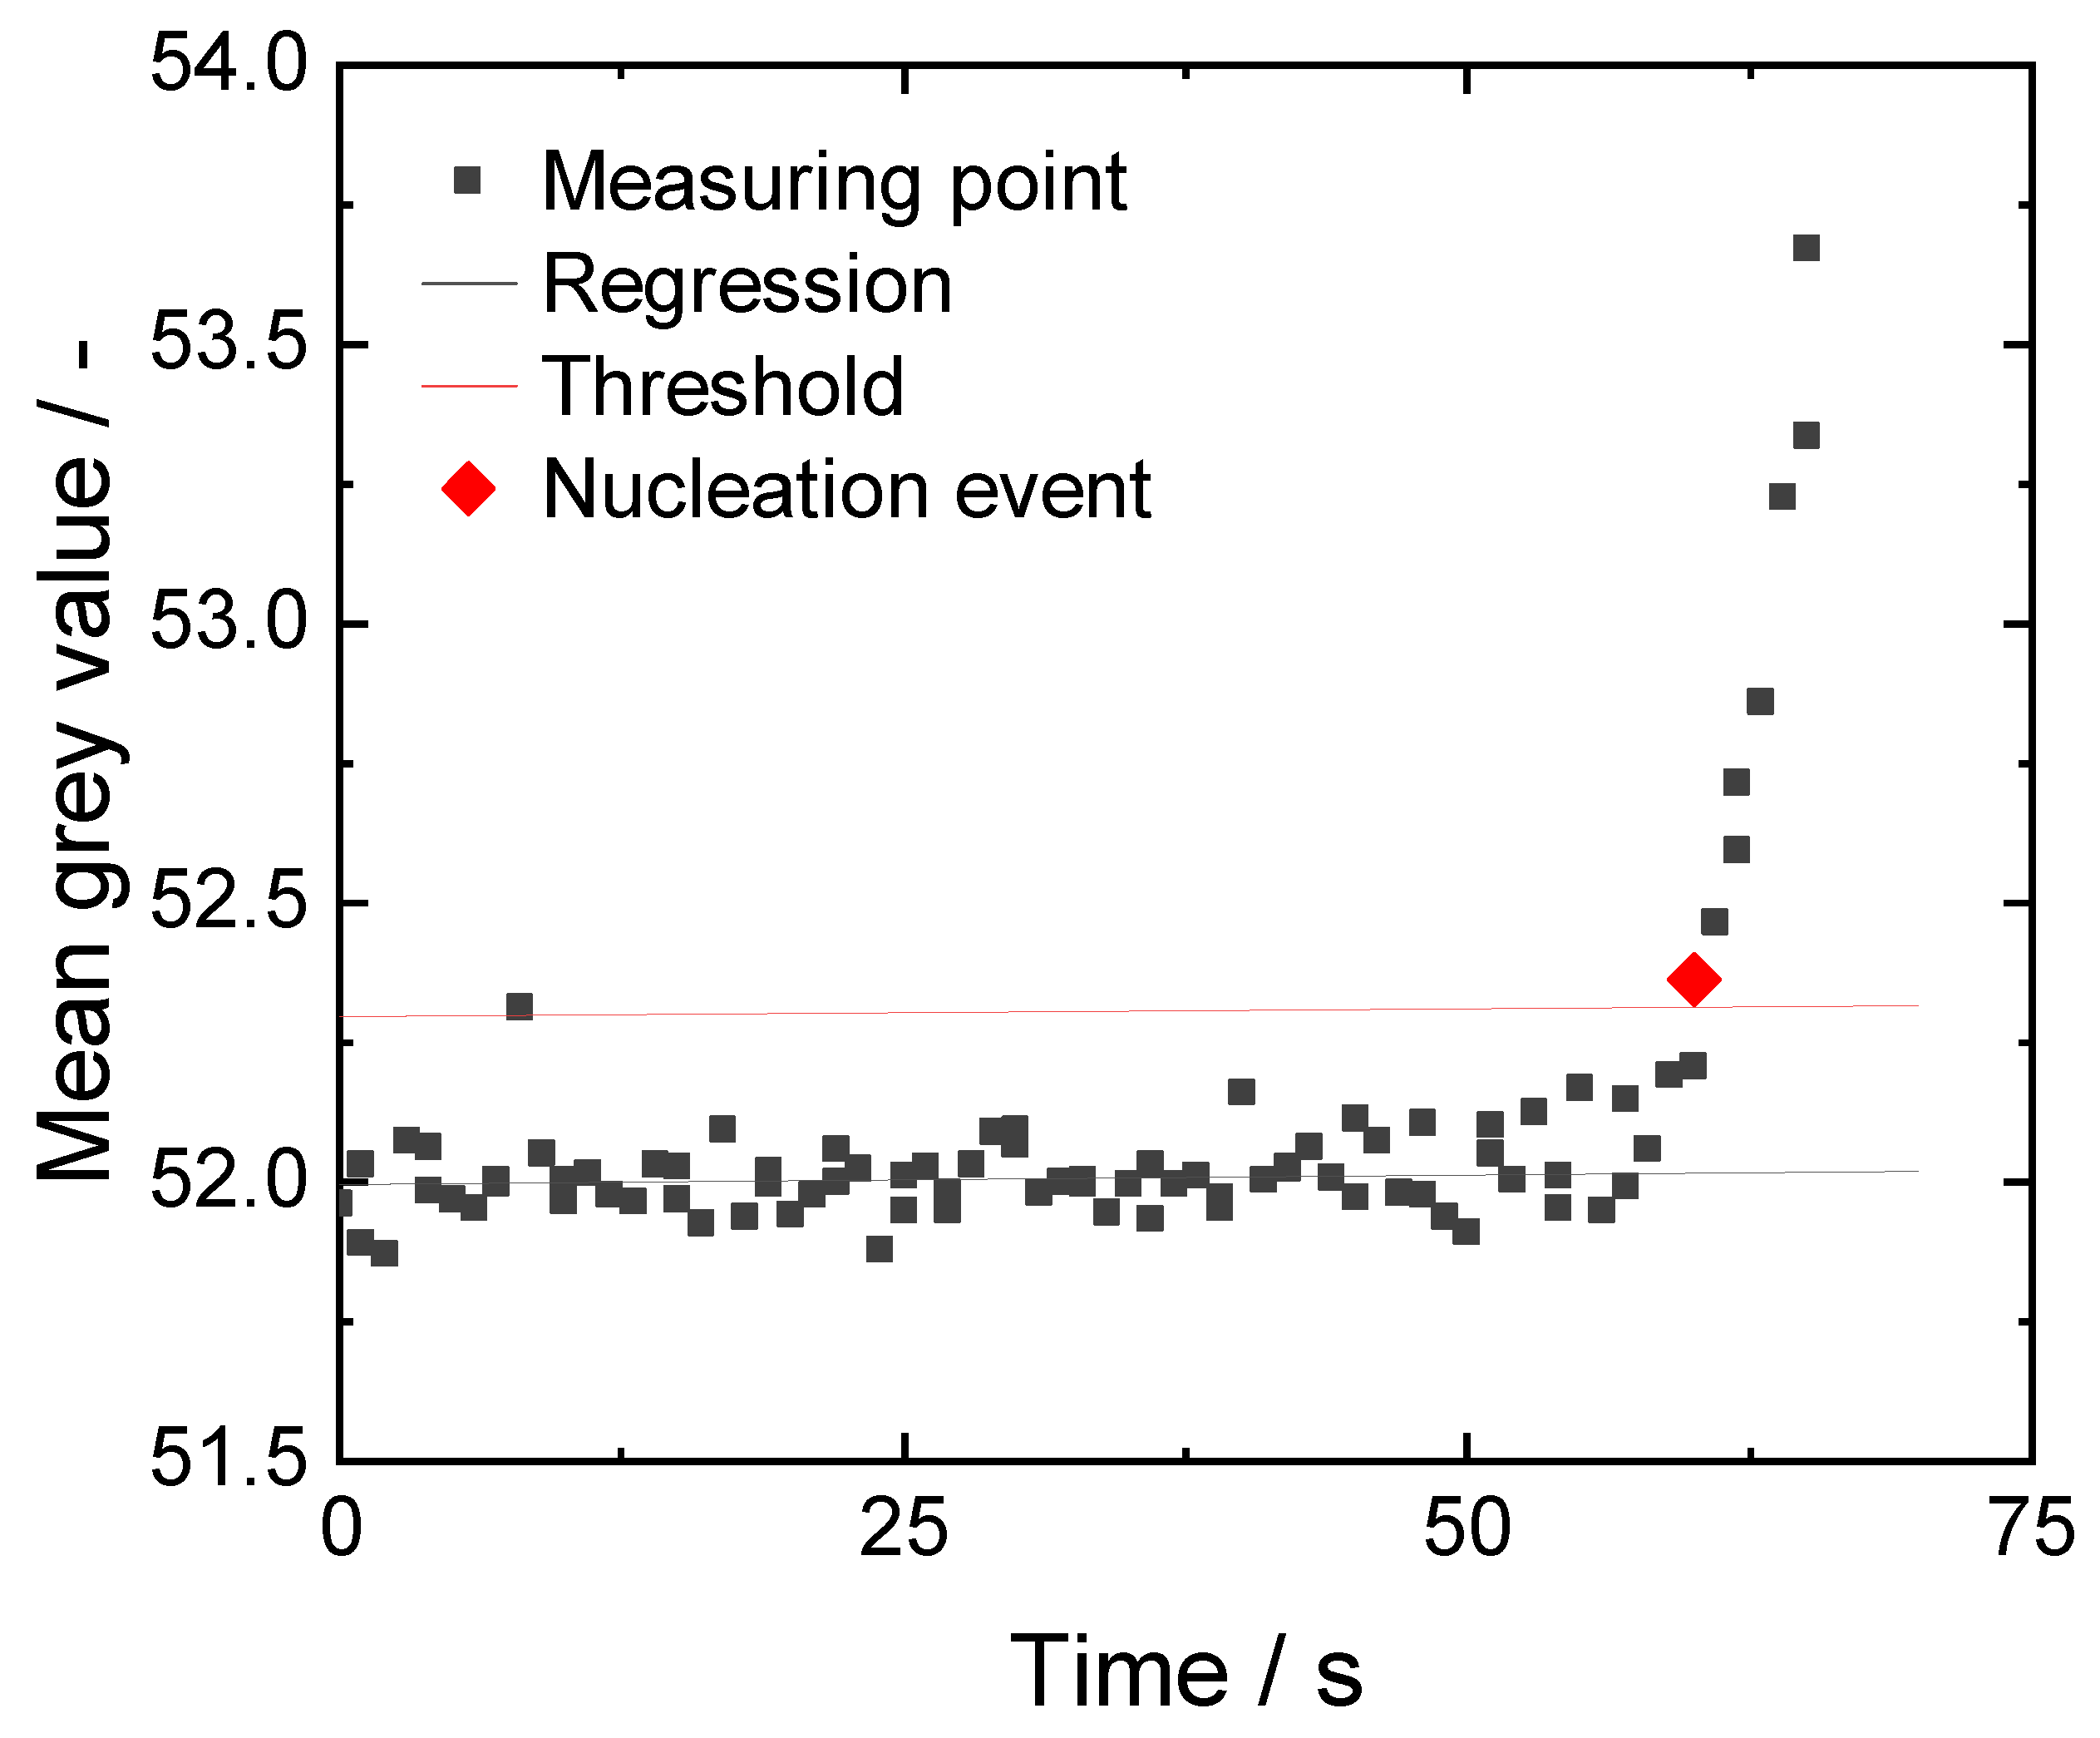
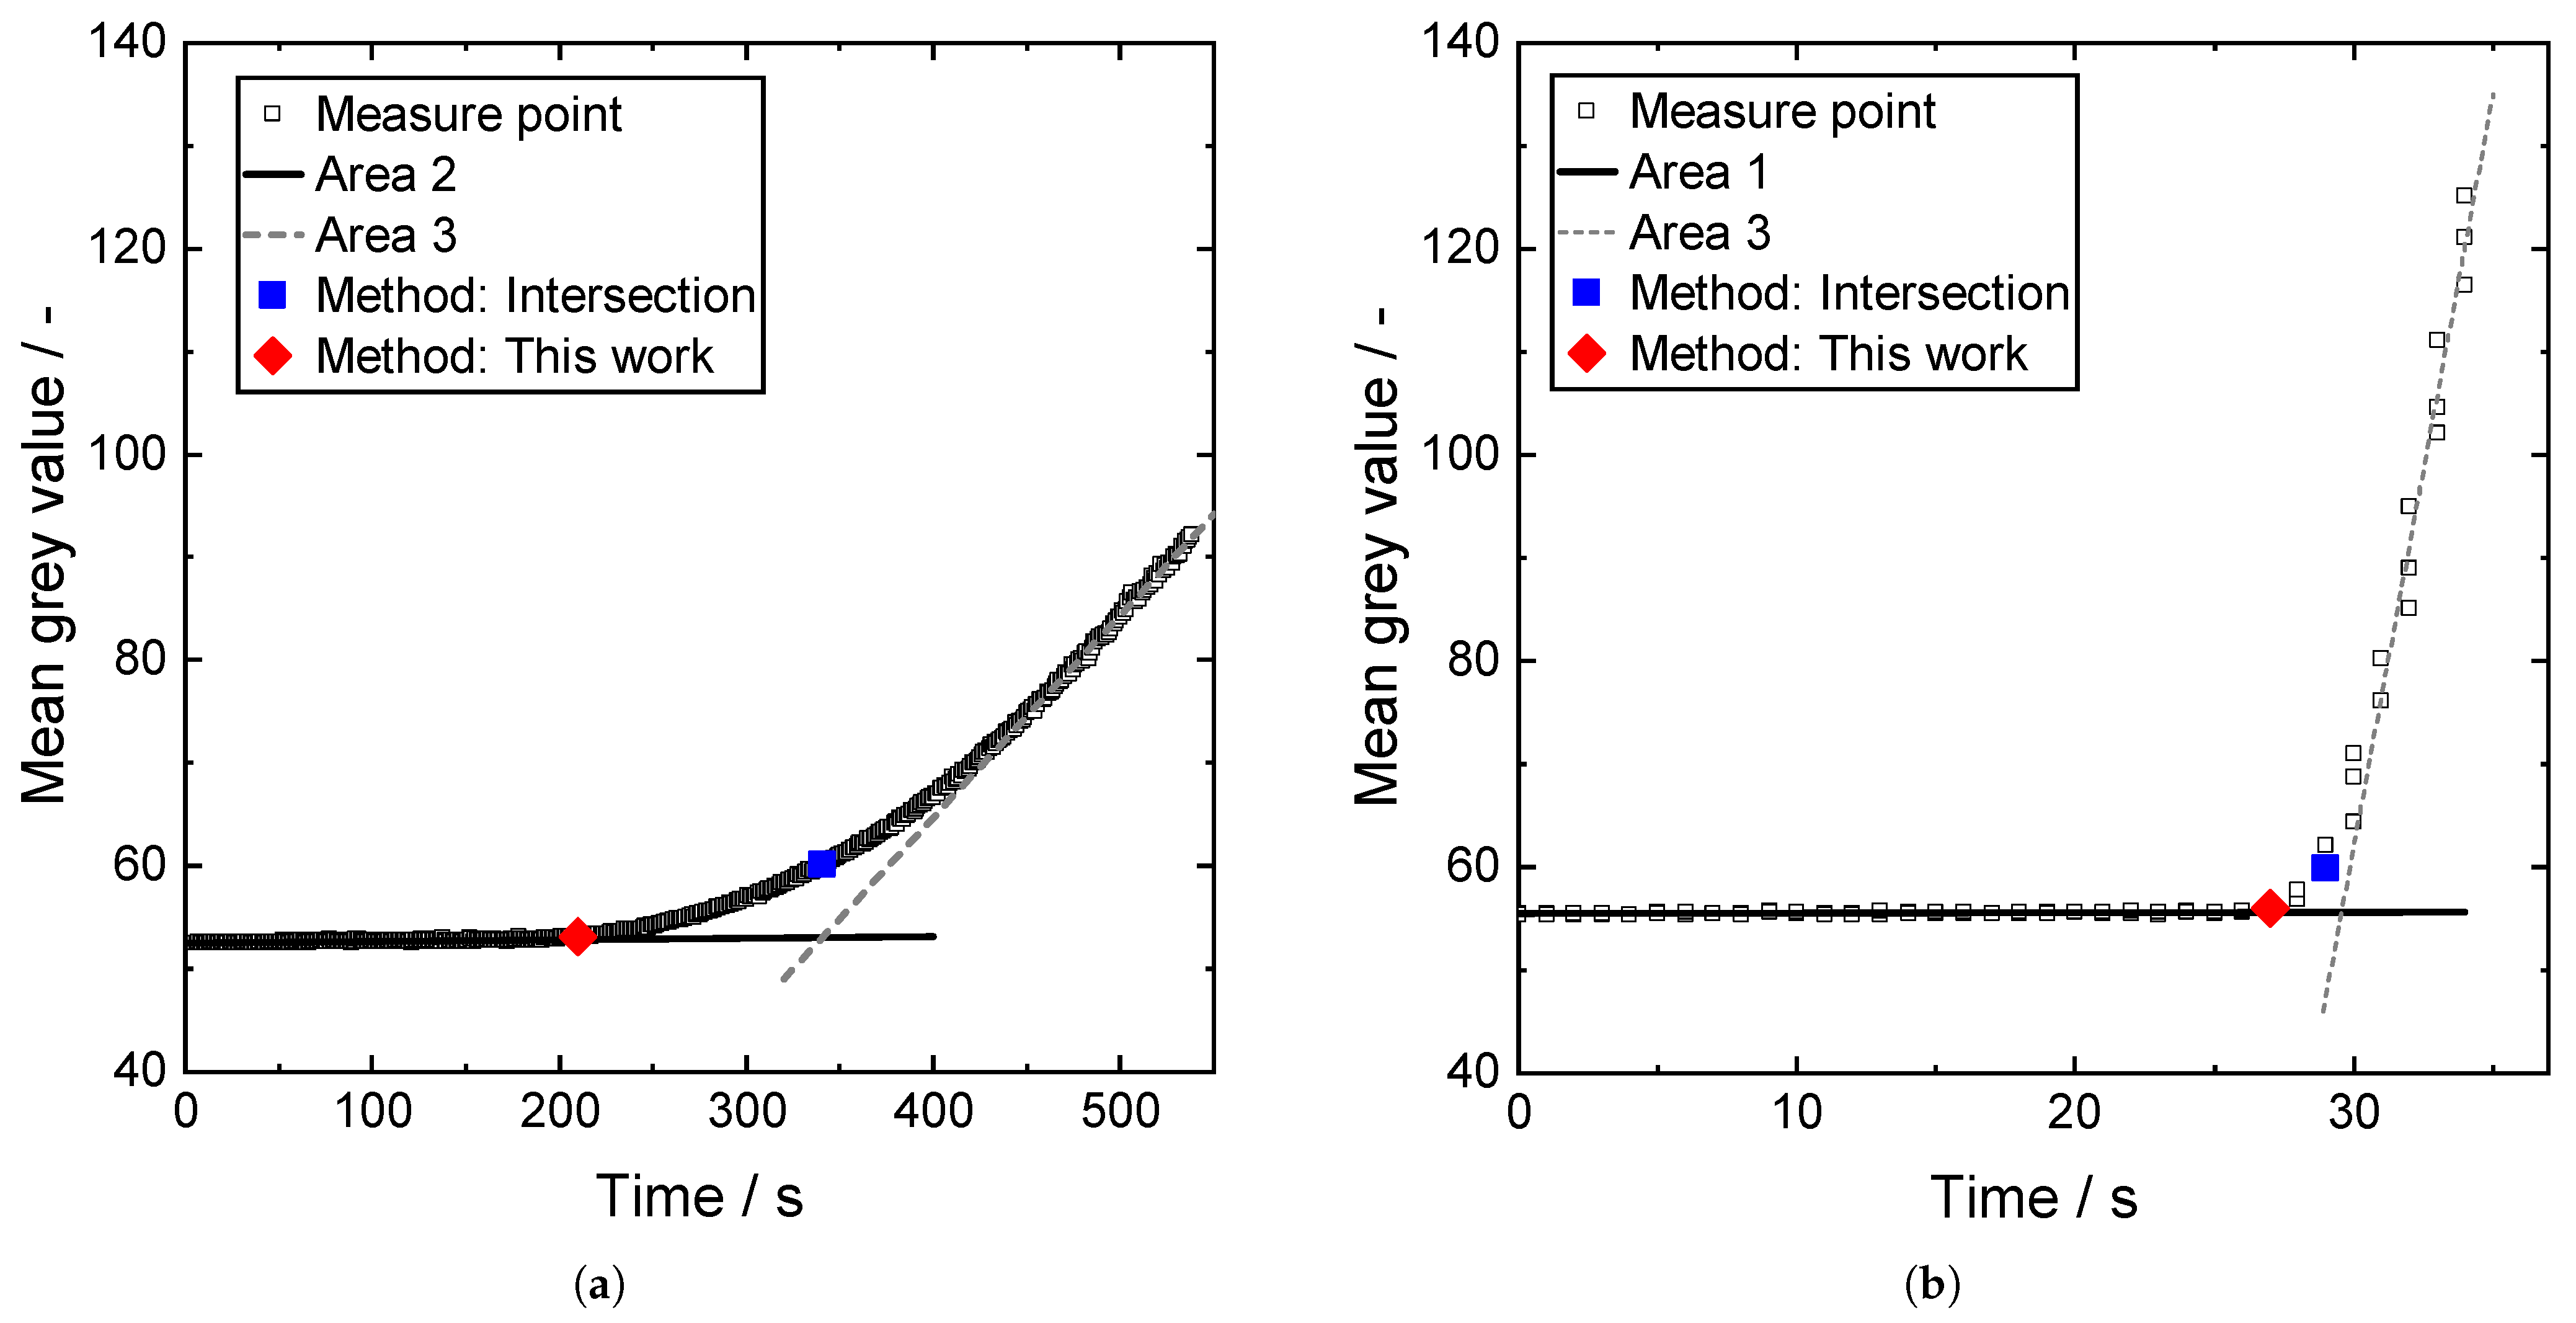
3.4. Endoscope Probe Analysis

The pictures are taken once every second in the software Vimba Viewer (Version 1.7.0, Allied Vision, Stadtroda, Germany) using the parameters shown in Table 1. Those pictures are then analyzed by a MATLAB code to calculate the mean gray value, which is an uncalibrated way of measuring turbidity. The increase in the mean gray value determines the start of nucleation which is used to calculate the MSZW. Further detail can be found in the Appendix A.1.

4. Results

First, to calculate the MSZW and the resulting nucleation rates the solid–liquid equilibrium is required, as explained in Section 2. In Figure 2, the equilibrium measured for this work is compared to the results from Peters et al. [17]. Both are in good agreement. The solubility decreases strongly with the ethanol concentration especially when small amounts of ethanol are added. The slope begins to flatten out when the ethanol concentration is increased further. The measured data are fitted by an empirical exponential equation of the form
f ( c E t O H ) = a · exp ( b · c E t O H ) .
The resulting parameters are found in Table 2.

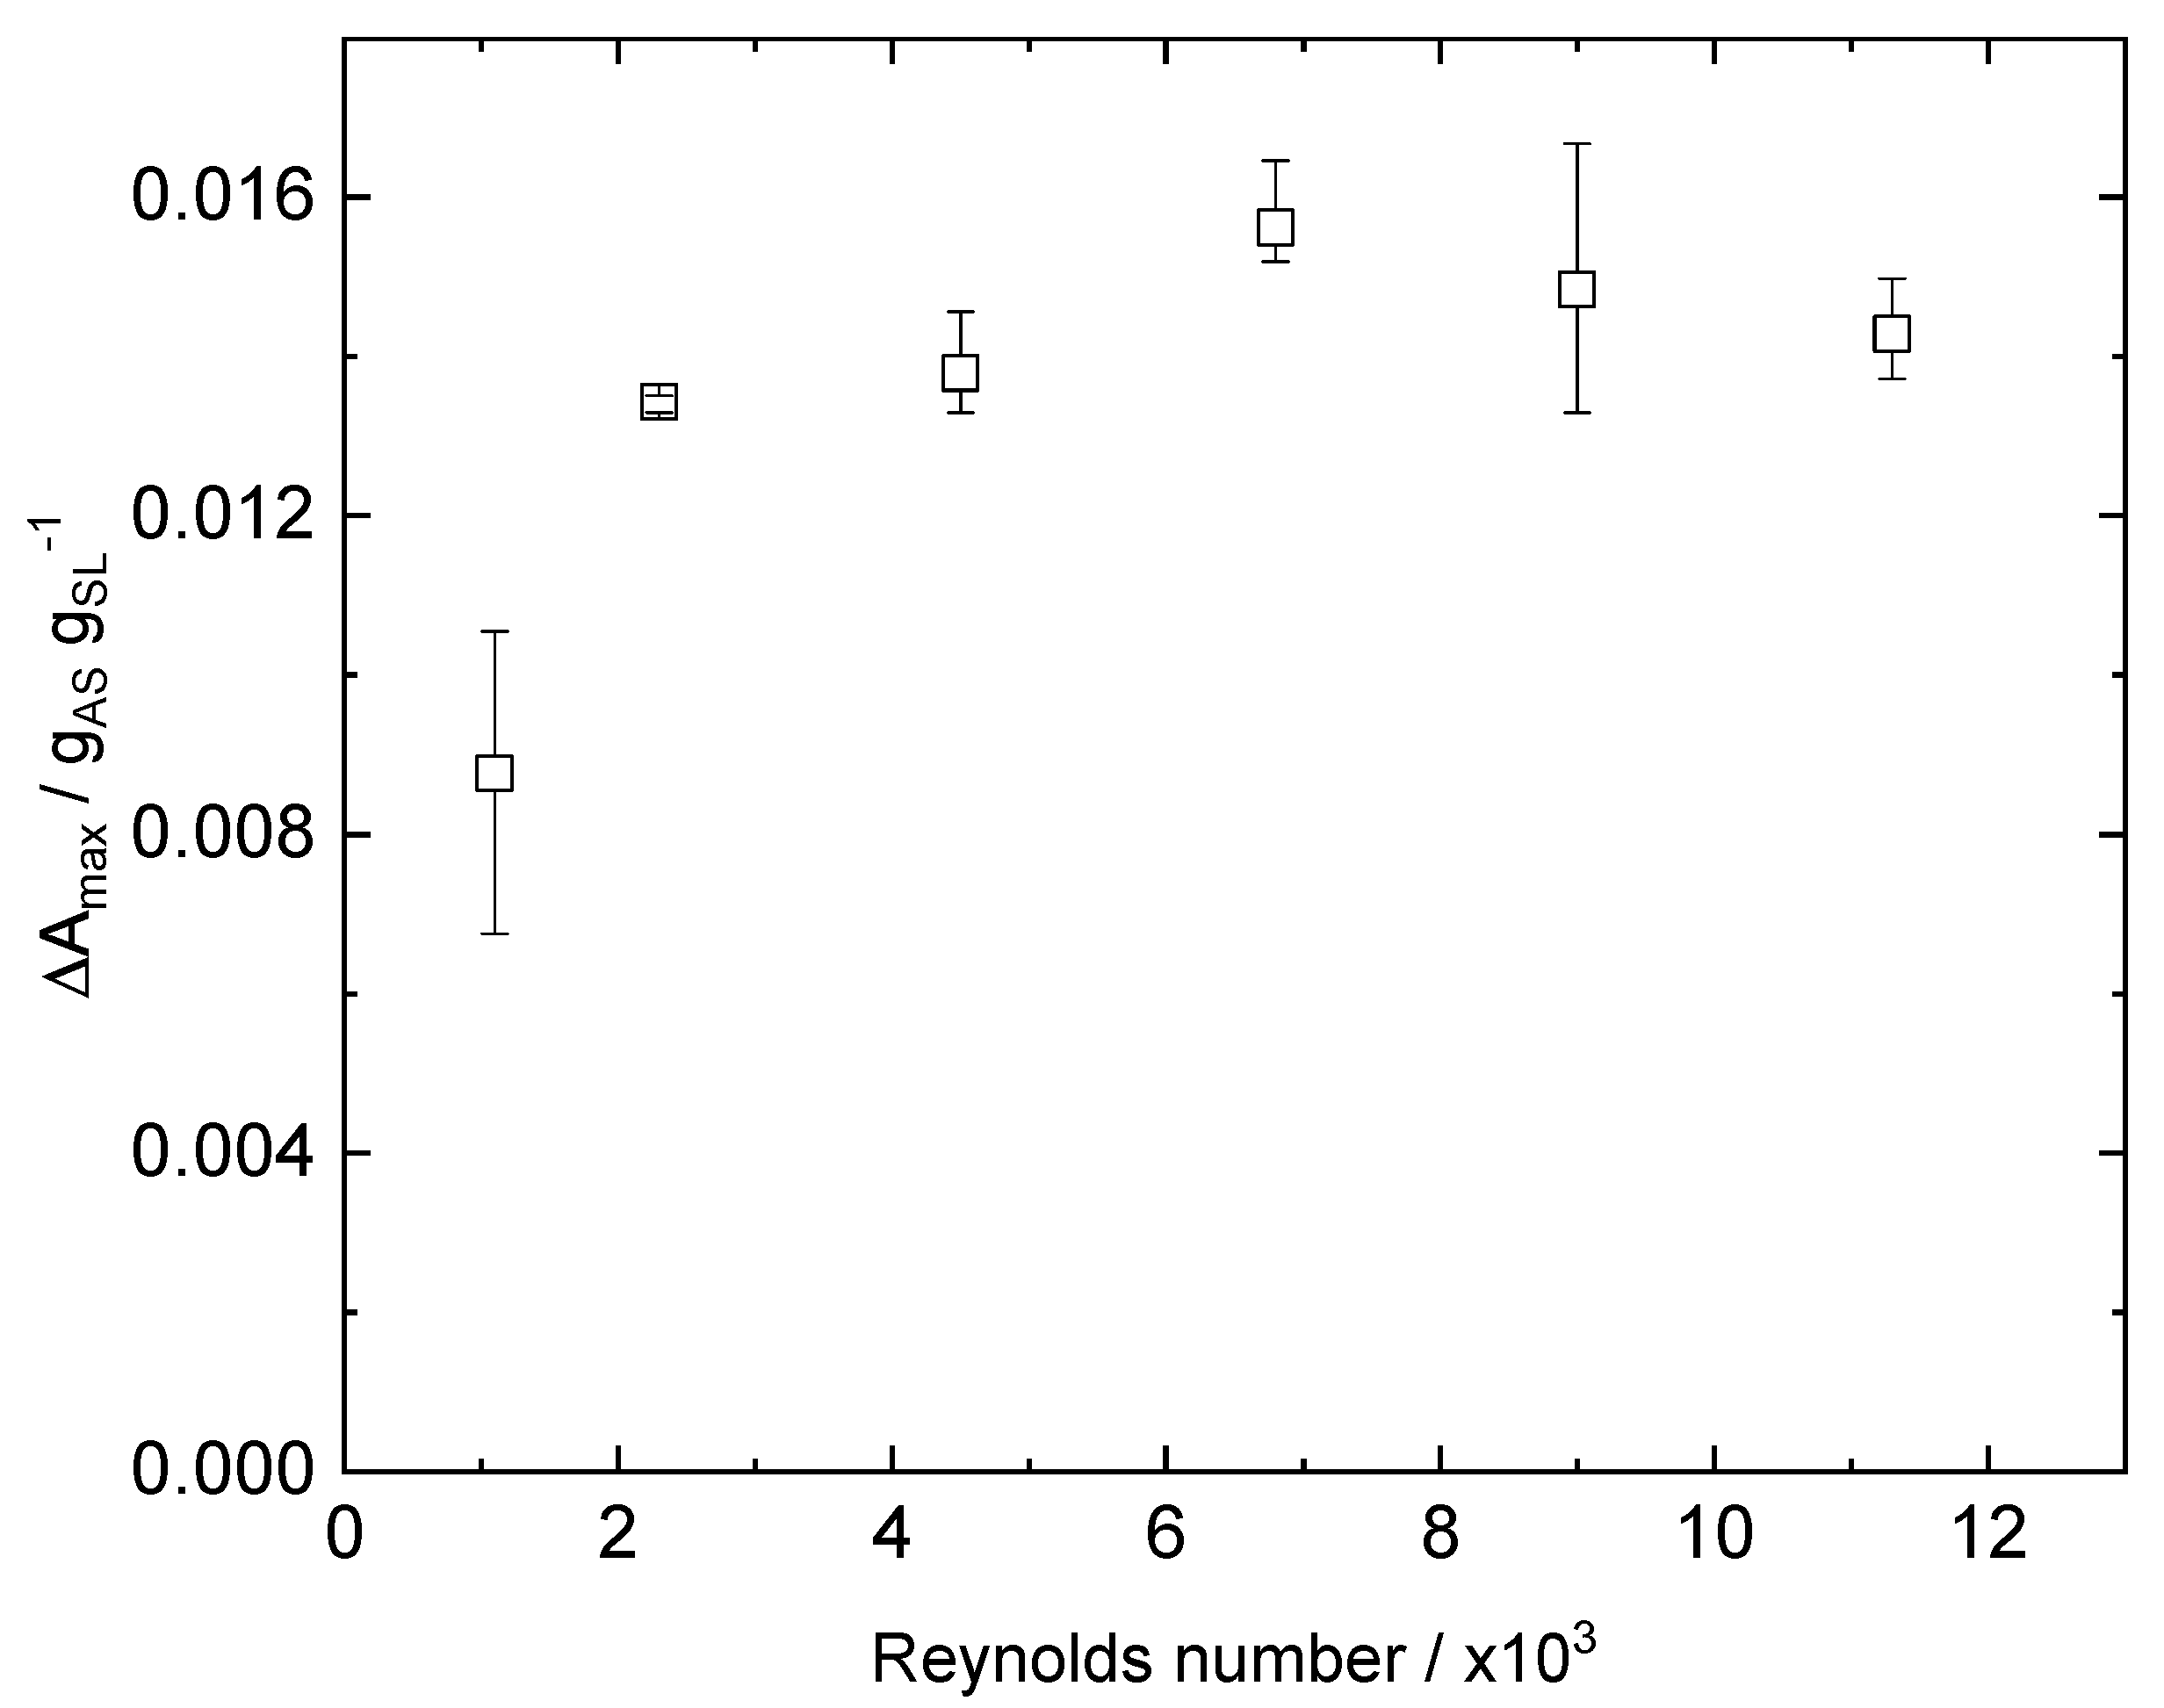
4.1. Influence of the Mixing on the MSZW

Antisolvent crystallization is a method known to be prone to strong local effects due to insufficient mixing [20,21]. To study the influence of mixing at the macroscopic scale the Reynolds number is varied between 1100 and 11,300 using stirring rates of 50 to 500 rpm, respectively, at a fixed antisolvent addition rate of 5 mL min−1 or 0.24   ×   10 3   g AS g SL 1 s 1 . Further information on the calculation of the Reynolds number can be found in the Appendix A.2. The results are presented in Figure 3. At the lowest Reynolds number of 1100, the MSZW is notably lower than at higher Reynolds numbers. This is an effect that can be explained by premature nucleation. As the antisolvent is injected, the mixing is too slow to distribute the antisolvent within the whole volume of the crystallizer. Therefore, the primary nucleation event takes place quicker than when the mixing is faster at higher Reynolds numbers [21,22]. At higher Reynolds numbers, a slight increase until 7000 and then a slight decrease in the MSZW can be noted. The changes, however, are very subtle and can be due to the stochastic nature of the phenomenon. In the literature, a more narrow MSZW could be observed at higher Reynolds numbers ranging from 12,500 to 18,500, when the antisolvent addition position is in a well-mixed area [21,22]. This is explained by higher stirring rates causing a higher probability of molecules colliding to form new nuclei. In this work, this effect cannot be observed with sufficient certainty, because the decrease in MSZW between Reynolds numbers of 7000 and 11,000 in Figure 3 is very small. In addition, the Reynolds numbers used are smaller compared to the cited literature and the decrease in MSZW may be more pronounced at higher Reynolds numbers. The same explanation for the higher probability of molecules colliding at higher stirring rates, however, is also used to explain the reverse effect, that molecules are torn apart from each other at higher energy input [26].
In this process, premature nucleation is not beneficial to crystal growth because it produces many small crystals. An overall wider MSZW indicates a longer time to nucleation, which makes the process more controllable and increases crystal growth. Therefore, the process should not be operated at Reynolds numbers lower than 2300 in this setup.

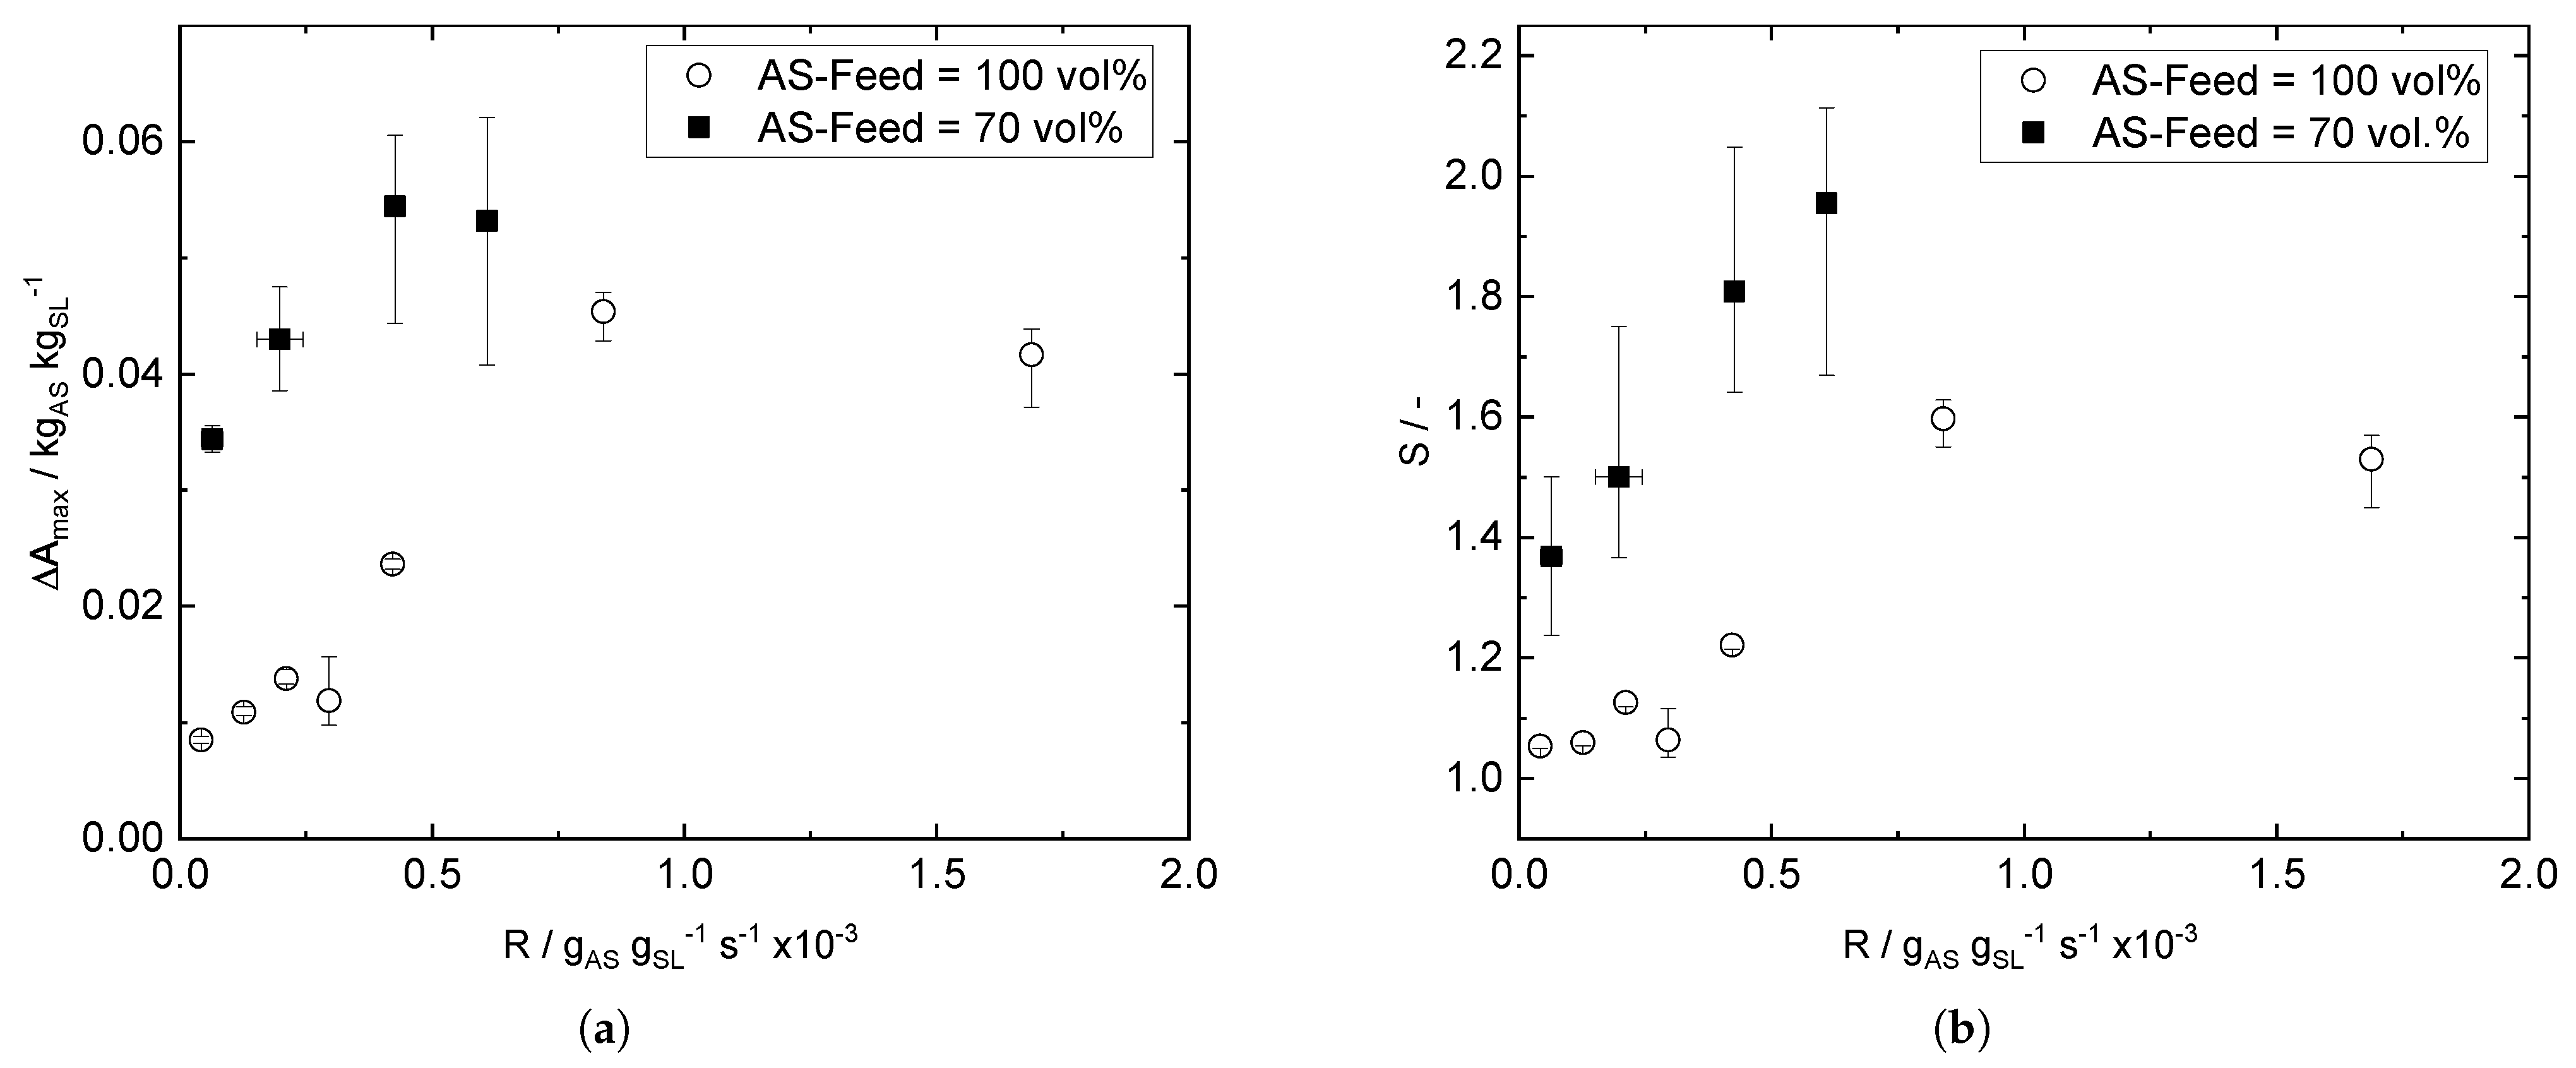
4.2. Influence of the Antisolvent Addition Rate on the MSZW

A nucleation rate can only be calculated when nucleation is detected at different supersaturations. Therefore, the rate of supersaturation generation must be varied, which, in antisolvent crystallization, is achieved by varying the antisolvent addition rate. In Figure 4, the MSZW and the equivalent supersaturation are displayed over different antisolvent addition rates. The antisolvent addition rate is calculated as the mass of antisolvent per mass of starting solution per time ( g AS g SL 1 s 1 ) and the MSZW Δ A m a x in mass antisolvent per mass starting solution, for two different operation modes. In the first mode, the antisolvent is added as 100 vol % ethanol. With increasing antisolvent addition rates the MSZW Δ A m a x becomes wider. This is expected behavior because the system has less time to form a nucleus [19]. The widest MSZW is reached at a rate of 0.84   ×   10 3   g AS g SL 1 s 1 . At higher rates, the MSZW decreases again. According to Equation (7), Δ A m a x is proportional to the nth root of R, so a widening of the MSZW with increasing addition rates would be expected. However, at the rather high addition rate of 1.7   ×   10 3   g AS g SL 1 s 1 , higher local supersaturations can be the cause of a narrower than expected MSZW. The MSZW at slow addition rates is very low. At 0.42   ×   10 3   g AS g SL 1 s 1 the MSZW in Figure 4a reaches 0.022   g   g 1 where a supersaturation of approximately S = 1.2 in Figure 4b can be calculated. This sudden increase in supersaturation at low amounts of ethanol is due to the solid–liquid equilibrium in Figure 2 which is very steep at low concentrations of ethanol. For perspective, at a comparable antisolvent addition rate and setup, the MSZW for benzoic acid is measured as 0.12   g   g 1 and 0.11   g   g 1 for glycin versus 0.022   g   g 1 in this work [21,22]. A narrow MSZW is common for aqueous solutions of salts [19].
In the second operating mode, the antisolvent is added in a mixture of 70 vol % ethanol and 30 vol % of distilled water. The addition rate is calculated to account for the pure ethanol added. It is apparent that the MSZW is considerably wider at all measured addition rates compared to the 100 vol % series of measurements. Until antisolvent addition rates of 0.42   ×   10 3   g AS g SL 1 s 1 , the MSZW is two to four times wider when antisolvent is added at 70 vol % . The wider MSZWs can be explained by faster mixing at the micro-scale. The antisolvent is already diluted when added to the scandium solution. Therefore, the local supersaturations are lower and the antisolvent can be distributed faster within the whole volume of the crystallizer. When mixing at the micro-scale is too slow, the nuclei form quickly and the supersaturation is converted into many small crystals. However, when the micromixing time is reduced by the pre-dilution of the antisolvent, the supersaturation can be distributed in the crystallizer before the local supersaturations become too large and produce many nuclei. Reducing the concentration of the antisolvent can, therefore, be a tool to control nucleation in order to enhance crystal growth. Larger error bars on the experiments with 70 vol % of ethanol can be due to more variation at the starting concentration of the scandium-saturated solution. As described before, the crystals are resolved after an experiment has been finished. Although the pH value of the 3 mol L−1 NH4F solution is at 7 and hydrofluoric acid is mostly dissociated, still small amounts of undissociated hydrofluoric acid are present and dissolve silicon from the glass crystallizer. This silicon can form other salts that are less soluble than the scandium salt and cause an error in the production of the starting solution. When weighing in the crystals a slight error may be the consequence. At the visual check for the appearance of a solid phase after saturation, silicon crystals cannot be differentiated from scandium crystals. Therefore, a slightly undersaturated scandium solution may appear as saturated due to the appearance of visible silicon crystals. In addition, it is not uncommon for the supersaturation to have larger error bars than the MSZW due to the added error of the analytical measurement of the concentration. Despite the larger error bars for the 70 vol % ethanol addition, the trend towards wider MSZW is very clear.
The two different antisolvent addition methods greatly impact the crystals’ appearance and size distribution. In Figure 5, two examples for each method are represented, respectively. In Figure 5a, crystals are shown that formed during an experiment with an antisolvent addition of 100 vol % ethanol at a rate of 0.042   ×   10 3   g AS g SL 1 s 1 to a saturated scandium solution. Their size ranges from 1 μ m to 4 μ m and most of them have very round edges. In Figure 5b, ethanol has been added as a 70 vol % mixture at a faster addition rate of 0.085   ×   10 3   g AS g SL 1 s 1 . Despite the faster addition rate these crystals have grown larger than the ones in Figure 5a by over a magnitude. Their edges are very sharp and defined and their monoclinic form is more pronounced. Those differences in the appearance of the crystals by the addition of diluted antisolvent match the findings in the literature [18]. The crystals in Figure 5b have grown together, indicating agglomeration. This effect may have positive effects during filtration, however, it can also lead to inclusions of solvent and, therefore, impurities, which needs to be studied further.

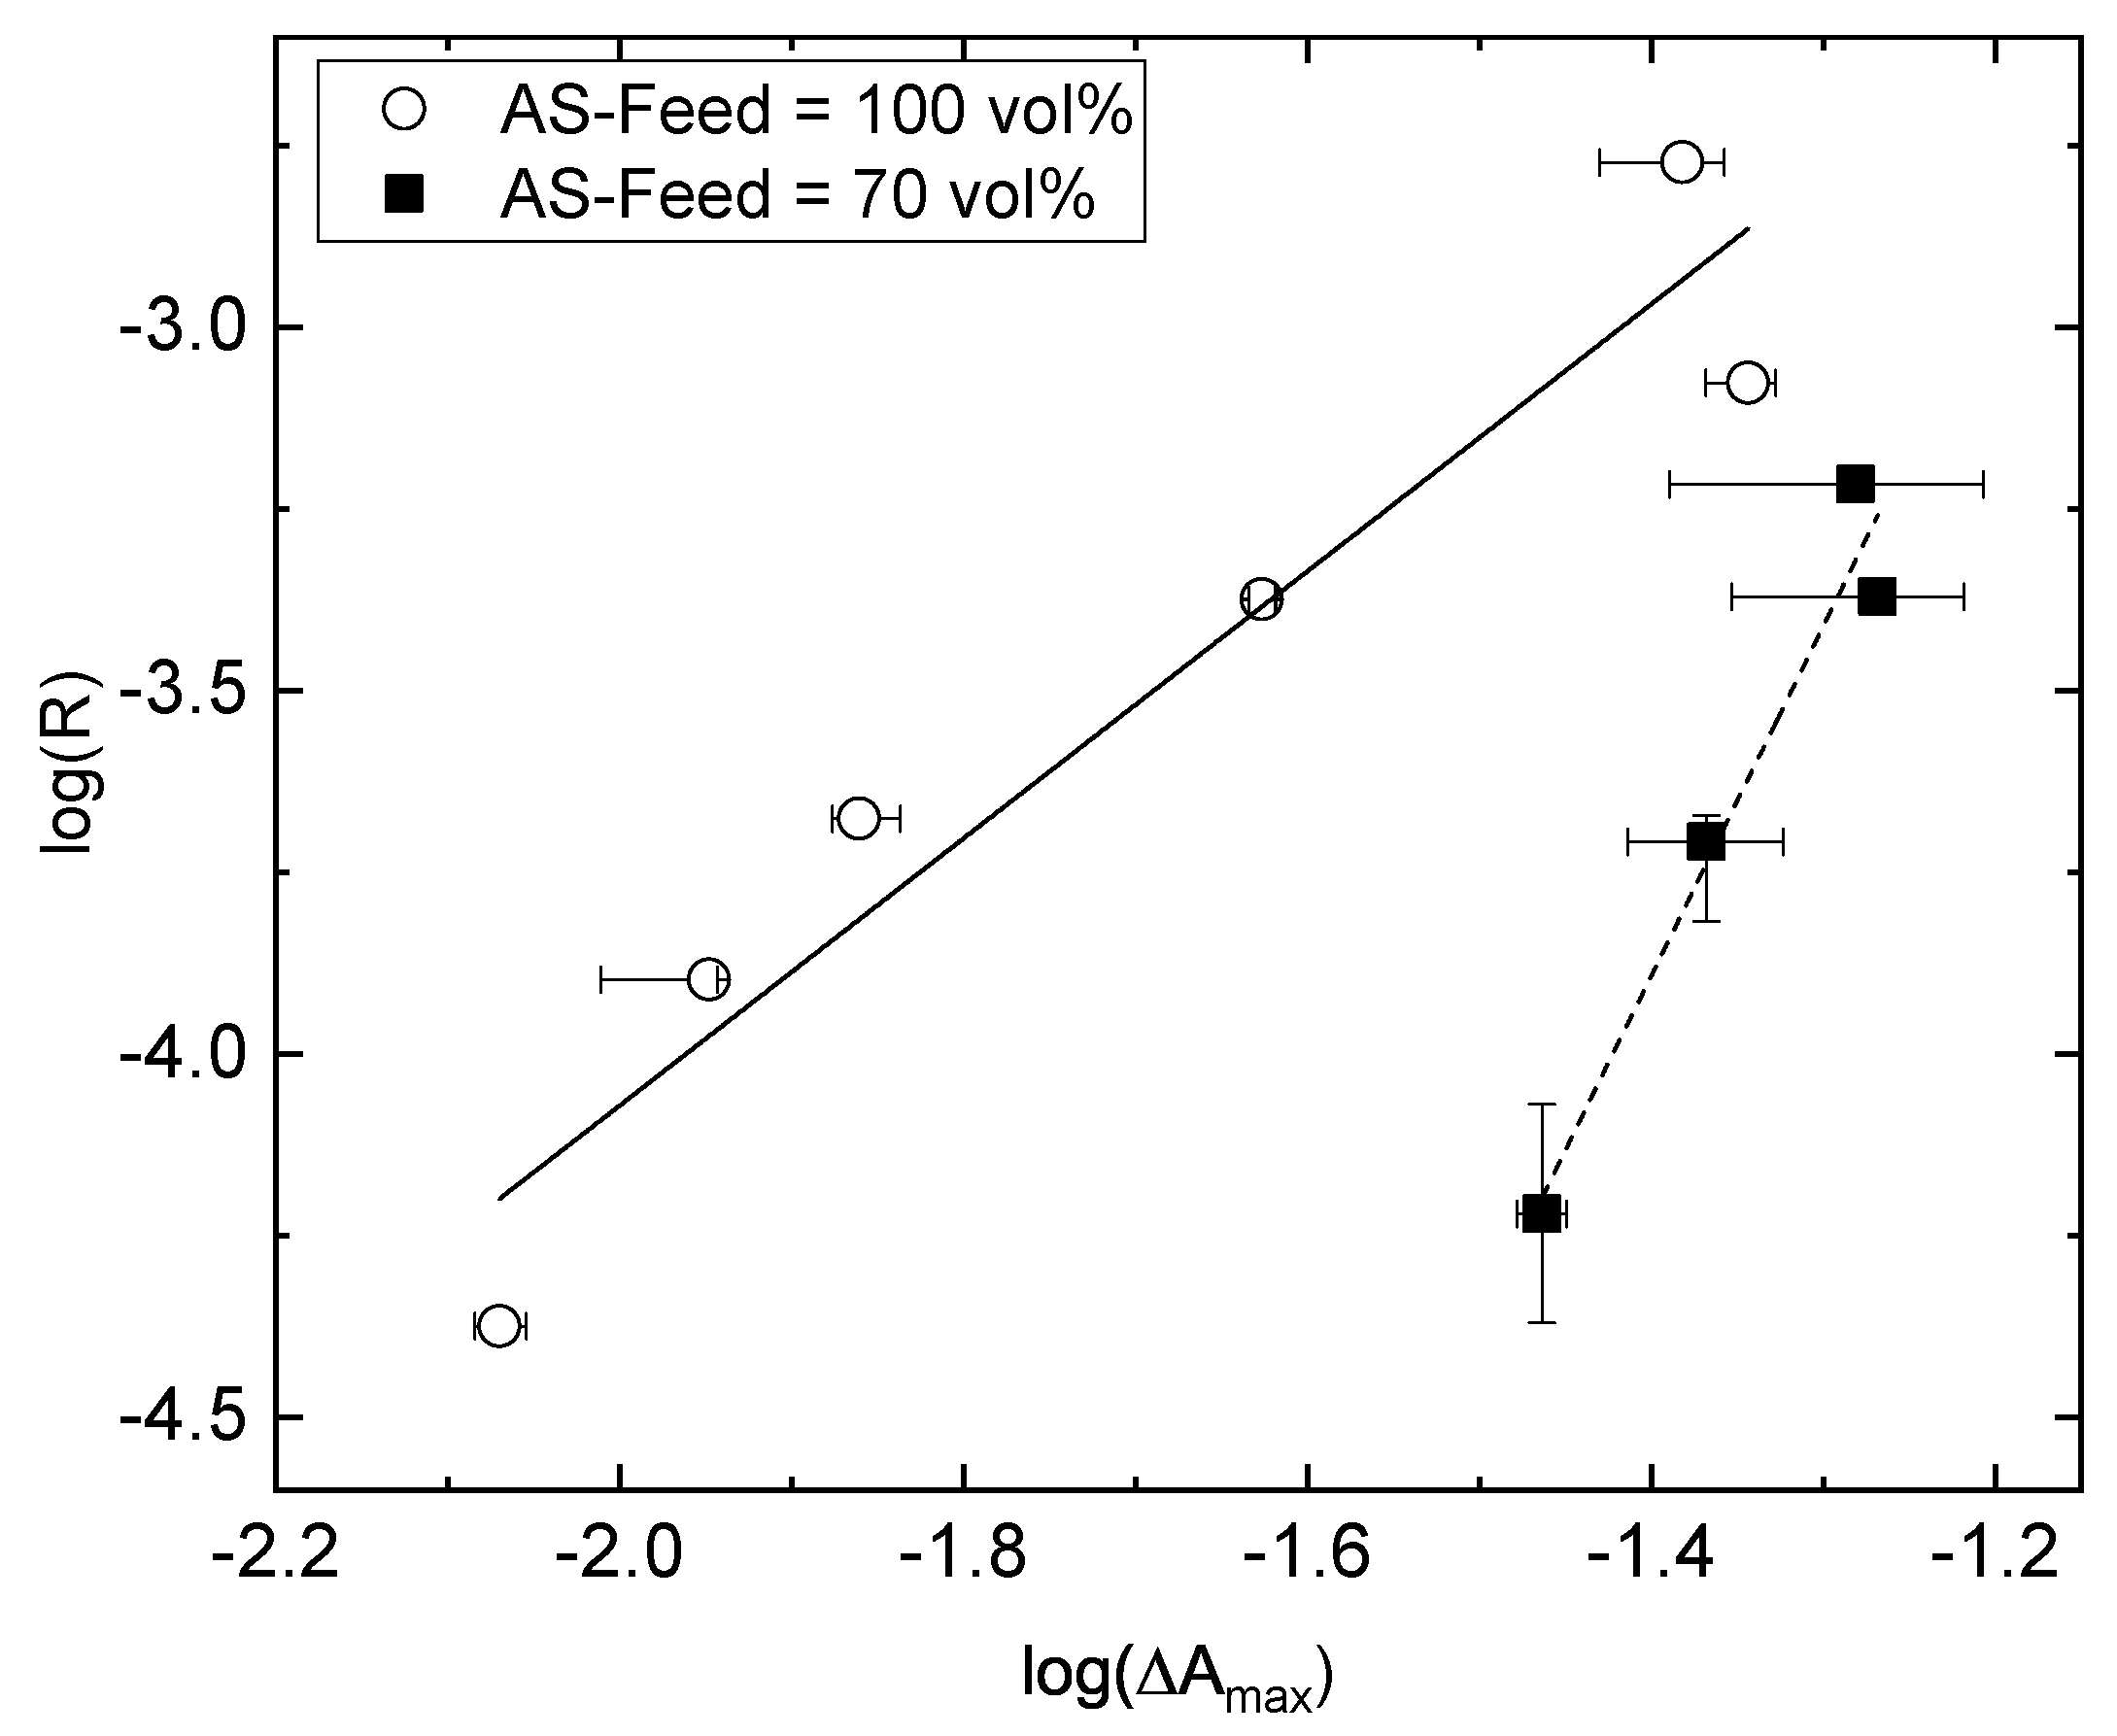
4.3. Evaluation of Nucleation Rates

To calculate the parameters k n and n the respective logarithms of the specific antisolvent addition rate R and the MSZW Δ A m a x are plotted in Figure 6. The fitted lines are represented by Equation (8), where n is the slope and k n can be calculated from the intercept, n itself, and the linear approximation of the solid–liquid equilibrium d c * / d A . The clear distinction between the two operating modes in the MSZW becomes visible in the slope and intercept of the solid and dashed lines. The respective parameters are represented in Table 3. Because of the large difference in the MSZW, the value for d c * / d A has been calculated for each case with a different linear approximation of the solid–liquid equilibrium which only influences the k n value.
The empirical parameters k n and n are not associated with physical meaning and are of pure numerical nature [27]. In this study, they show the strong difference in nucleation kinetics created by changing the concentration of antisolvent added to the scandium solution. The nucleation order n remains in a similar order of magnitude. The significant difference of k n values between the two operating modes indicates a difference in the nucleation mechanism [28,29]. Both parameters for the 70 vol % case are of the same magnitude as other precipitation studies of different systems, where the MSZW is measured [23].

5. Conclusions

The MSZW of the scandium salt (NH4)3ScF6 produced by antisolvent crystallization from aqueous solution has been measured for different operating parameters. The solid–liquid equilibrium of the salt depending on the concentration of the antisolvent ethanol has been measured, showing a steep decrease in solubility at small ethanol concentrations. The MSZW has been measured by evaluating the mean grey value of pictures from an endoscope probe during the addition of the antisolvent. The variation of the stirring speed and, thus, the Reynolds number shows a slight influence on the MSZW. At low Reynolds numbers under 2300, the MSZW becomes narrower, indicating premature nucleation due to slow mixing. Higher Reynolds numbers indicate no drastic change in the MSZW. For constant Reynolds numbers and increasing antisolvent addition rates, the MSZW widens as expected. A drastic increase in the MSZW becomes visible when the antisolvent is diluted with the solvent before injection. In this study, two injection compositions of 100 vol % and 70 vol % have been compared over varying addition rates. Especially at low addition rates under 0.6   ×   10 3   g AS g SL 1 s 1 the MSZW is widened significantly when the antisolvent is added at 70 vol % compared to 100 vol % . This effect benefits the growth of the crystals and makes the process easier to control. The MSZW was measured in a stirred fed-batch crystallizer with 300 mL starting volume. The dimensions and size of the crystallizer are a first step in up-scaling the process from lab-scale to potential industrial size. However, to understand the process further, the growth of the crystals during the process needs to be studied to control the crystal size distribution and enhance the subsequent solid–liquid separation.

Author Contributions

Conceptualization, J.T. and C.K; methodology, J.T. and A.G.; software, J.T. and A.G.; validation, J.T. and A.G.; formal analysis, J.T. and A.G.; investigation, A.G.; resources, J.T.; data curation, J.T.; writing—original draft preparation, J.T.; writing—review and editing, A.J., C.K. and A.J.; visualization, J.T.; supervision, A.J.; project administration, J.T.; funding acquisition, A.J. and C.K. All authors have read and agreed to the published version of the manuscript.

Funding

This research was funded by BMWI Bundesministerium für Wirtschaft und Energie (ZIM project ZF4277102VS9).

Data Availability Statement

Not applicable.

Conflicts of Interest

The authors declare no conflict of interest.

Abbreviations

The following abbreviations are used in this manuscript:
MSZWmetastable zone width
ASantisolvent
SLsolution at start of experiment
SLEsolid–liquid equilibrium

Appendix A

Appendix A.1. Detection of Nucleation Event

As described in Section 3.4 an endoscope probe is used to take pictures of the fluid flowing through the measuring gap during the addition of the antisolvent. The pictures are then cropped and the mean grey value is calculated. An example of those values is displayed in Figure A1. In some publications, the time of nucleation, evident by the sudden increase in value, which can also be conductivity measurement or an FBRM signal, is evaluated with the naked eye [22]. A second, more objective method used, is to fit a linear regression around both sides of the beginning of the steep increase and take the intersection as nucleation time [25,29]. In this work, the time to nucleation was rather short, and, therefore, an error of a few seconds in the evaluation can have a large impact on the measured MSZW. A detection method needs to be objective and, specifically in this use case, detect nucleation as early as possible. This ensures that in later supersaturation-controlled processes no unwanted nucleation occurs. As seen in Figure A1, there can be outliers or even noise in the first area where no nucleation should occur. In order to avoid too early detection, a linear regression is fitted to the first area as a baseline. Next, an offset is determined as a threshold which is 0.3 in mean grey value for all measured MSZW. To further avoid false detection, a second condition is installed. There needed to be at least 10 subsequent measure points above the threshold for experiments where the antisolvent was added with 100 vol % and 5 subsequent measurements with 70 vol % antisolvent to compensate for stronger noise in the signal. If the conditions are met, the first of those values is named the initial time to nucleation.
Figure A1. The mean grey value from the pictures of the endoscope probe during the experiment.
Crystals 13 01074 g0a1
Notice in Figure A2 the difference in detection points compared between the intersection method described above and the method of this work. In particular, when the antisolvent is added slower and the increase in the mean grey value is not as steep as with faster antisolvent addition, the intersection method detects nucleation at later times.
Figure A2. Comparison of nucleation detection between the method of the intersection of regression lines and the method described in this work. (a): Example for mean grey values for a slow antisolvent addition rate of 0.042   ×   10 3 g AS g SL 1 s 1 . (b): Example for mean grey values for a fast addition rate of 1.65   ×   10 3 g AS g SL 1 s 1 .
Crystals 13 01074 g0a2

Appendix A.2. Calculation of the Reynolds Number

The Reynolds number for stirred tanks is calculated as
R e = N ρ S L D 2 η
with N as the stirring rate, ρ S L as the density of the liquid phase, D as the diameter of the crystallizer and η as the dynamic viscosity. The values for ρ S L and η are measured for the fluid phase without ethanol in a 3 mol L−1 NH4F solution to 1038 k g   m 3 and 1.227   m Pa s .

References

  1. Riva, S.; Yusenko, K.V.; Lavery, N.P.; Jarvis, D.J.; Brown, S.G.R. The scandium effect in multicomponent alloys. Int. Mater. Rev. 2016, 61, 203–228. [Google Scholar] [CrossRef] [Green Version]
  2. Binnemans, K.; Jones, P.T.; Müller, T.; Yurramendi, L. Rare Earths and the Balance Problem: How to Deal with Changing Markets? J. Sustain. Metall. 2018, 4, 126–146. [Google Scholar] [CrossRef] [Green Version]
  3. Cho, G.Y.; Lee, Y.H.; Hong, S.W.; Bae, J.; An, J.; Kim, Y.B.; Cha, S.W. High-performance thin film solid oxide fuel cells with scandia-stabilized zirconia (ScSZ) thin film electrolyte. Int. J. Hydrog. Energy 2015, 40, 15704–15708. [Google Scholar] [CrossRef]
  4. European Commission Communication from the Commission to the European Parliament, the Council, the European Economic and Social Committee and the Committee of the Regions on the 2017 List of Critical Raw Materials for the EU. Brussels 2017. Available online: https://single-market-economy.ec.europa.eu/sectors/raw-materials/areas-specific-interest/critical-raw-materials_en (accessed on 19 June 2023).
  5. Petty, T.R.; Department of the Interior. Draft List of Critical Minerals. Fed. Regist. 2018, 83, 23295–23296. Available online: https://www.federalregister.gov/documents/2018/05/18/2018-10667/final-list-of-critical-minerals-2018 (accessed on 19 June 2023).
  6. Alkan, G.; Yagmurlu, B.; Cakmakoglu, S.; Hertel, T.; Kaya, Ş.; Gronen, L.; Stopic, S.; Friedrich, B. Novel Approach for Enhanced Scandium and Titanium Leaching Efficiency from Bauxite Residue with Suppressed Silica Gel Formation. Sci. Rep. 2018, 8, 5676. [Google Scholar] [CrossRef] [PubMed] [Green Version]
  7. Li, D.; Wang, C. Solvent extraction of Scandium(III) by Cyanex 923 and Cyanex 925. Hydrometallurgy 1998, 48, 301–312. [Google Scholar] [CrossRef]
  8. Wang, W.; Cheng, C.Y. Separation and purification of scandium by solvent extraction and related technologies: A review. J. Chem. Technol. Biotechnol. 2011, 86, 1237–1246. [Google Scholar] [CrossRef]
  9. Wang, W.; Pranolo, Y.; Cheng, C.Y. Recovery of scandium from synthetic red mud leach solutions by solvent extraction with D2EHPA. Sep. Purif. Technol. 2013, 108, 96–102. [Google Scholar] [CrossRef]
  10. Zhang, N.; Li, H.X.; Liu, X.M. Recovery of scandium from bauxite residue—Red mud: A review. Rare Met. 2016, 35, 887–900. [Google Scholar] [CrossRef]
  11. Ochsenkühn-Petropulu, M.; Lyberopulu, T.; Parissakis, G. Selective separation and determination of scandium from yttrium and lanthanides in red mud by a combined ion exchange/solvent extraction method. Anal. Chim. Acta 1995, 315, 231–237. [Google Scholar] [CrossRef]
  12. Shaoquan, X.; Suqing, L. Review of the extractive metallurgy of scandium in China (1978–1991). Hydrometallurgy 1996, 42, 337–343. [Google Scholar] [CrossRef]
  13. Harata, M.; Nakamura, T.; Yakushiji, H.; Okabe, T.H. Production of scandium and Al–Sc alloy by metallothermic reduction. Miner. Process. Extr. Metall. 2008, 117, 95–99. [Google Scholar] [CrossRef]
  14. Peters, E.; Dittrich, C.; Kaya, S.; Forsberg, K. Crystallization of a Pure Scandium Phase from Solvent Extraction Strip Liquors. In Extraction 2018; The Minerals, Metals & Materials, Series; Davis, B.R., Moats, M.S., Wang, S., Gregurek, D., Kapusta, J., Battle, T.P., Schlesinger, M.E., Alvear Flores, G.R., Jak, E., Goodall, G., et al., Eds.; Springer International Publishing: Cham, Switzerland, 2018; Volume 7, pp. 2707–2713. [Google Scholar] [CrossRef]
  15. Peters, E.M.; Kaya, Ş.; Dittrich, C.; Forsberg, K. Recovery of Scandium by Crystallization Techniques. J. Sustain. Metall. 2019, 5, 48–56. [Google Scholar] [CrossRef] [Green Version]
  16. Kaya, Ş.; Peters, E.; Forsberg, K.; Dittrich, C.; Stopic, S.; Friedrich, B. Scandium Recovery from an Ammonium Fluoride Strip Liquor by Anti-Solvent Crystallization. Metals 2018, 8, 767. [Google Scholar] [CrossRef] [Green Version]
  17. Peters, E.M.; Svärd, M.; Forsberg, K. Phase equilibria of ammonium scandium fluoride phases in aqueous alcohol mixtures for metal recovery by anti-solvent crystallization. Sep. Purif. Technol. 2020, 252, 117449. [Google Scholar] [CrossRef]
  18. Peters, E.M.; Svärd, M.; Forsberg, K. Impact of process parameters on product size and morphology in hydrometallurgical antisolvent crystallization. CrystEngComm 2022, 24, 2851–2866. [Google Scholar] [CrossRef]
  19. Beckmann, W. Crystallization: Basic Concepts and Industrial Applications; Wiley-VCH: Weinheim, Germany, 2013. [Google Scholar]
  20. Barrett, M.; O’Grady, D.; Casey, E.; Glennon, B. The role of meso-mixing in anti-solvent crystallization processes. Chem. Eng. Sci. 2011, 66, 2523–2534. [Google Scholar] [CrossRef]
  21. O’Grady, D.; Barrett, M.; Casey, E.; Glennon, B. The Effect of Mixing on the Metastable Zone Width and Nucleation Kinetics in the Anti-Solvent Crystallization of Benzoic Acid. Chem. Eng. Res. Des. 2007, 85, 945–952. [Google Scholar] [CrossRef] [Green Version]
  22. Chaitanya, K.K.; Sarkar, D. Determination of the Metastable Zone Width by a Simple Optical Probe. Chem. Eng. Technol. 2014, 37, 1037–1042. [Google Scholar] [CrossRef]
  23. Ó’Ciardhá, C.T.; Frawley, P.J.; Mitchell, N.A. Estimation of the nucleation kinetics for the anti-solvent crystallisation of paracetamol in methanol/water solutions. J. Cryst. Growth 2011, 328, 50–57. [Google Scholar] [CrossRef]
  24. Schöll, J.; Lindenberg, C.; Vicum, L.; Mazzotti, M.; Brozio, J. Antisolvent Precipitation of PDI 747: Kinetics of Particle Formation and Growth. Cryst. Growth Des. 2007, 7, 1653–1661. [Google Scholar] [CrossRef]
  25. Kuldipkumar, A.; Kwon, G.S.; Zhang, G.G.Z. Determining the Growth Mechanism of Tolazamide by Induction Time Measurement. Cryst. Growth Des. 2007, 7, 234–242. [Google Scholar] [CrossRef]
  26. Mullin, J.W. Crystallization, 4th ed.; Elsevier, Butterworth-Heinemann: Oxford, UK, 2001. [Google Scholar]
  27. Nývlt, J. Kinetics of nucleation in solutions. J. Cryst. Growth 1968, 3–4, 377–383. [Google Scholar] [CrossRef]
  28. Kocks, C.; Krekel, C.M.; Gausmann, M.; Jupke, A. Determination of the Metastable Zone Width and Nucleation Parameters of Succinic Acid for Electrochemically Induced Crystallization. Crystals 2021, 11, 1090. [Google Scholar] [CrossRef]
  29. Kleetz, T.; Pätzold, G.; Schembecker, G.; Wohlgemuth, K. Gassing Crystallization at Different Scales: Potential to Control Nucleation and Product Properties. Cryst. Growth Des. 2017, 17, 1028–1035. [Google Scholar] [CrossRef]
Figure 1. Setup of the fed-batch crystallizer with antisolvent addition: (1) Crystallizer with temperature jacket, (2) temperature probe, (3) endoscope probe, (4) antisolvent injection nozzle, (5) pitched blade stirrer with four blades, (6) membrane pump, (7) pulsation damper, and (8) antisolvent storage tank.
Crystals 13 01074 g001
Figure 2. The solid–liquid equilibrium of the scandium salt (NH4)3ScF6 with rising ethanol concentration at 25 C . The solid line represents the fitted solid–liquid equilibrium, as described in Equation (9). Solid squares represent the data from Peters et al. [17].
Crystals 13 01074 g002
Figure 3. MSZW in mass of AS added per mass of initial solution before nucleation appears vs. variation of the Reynolds number, at a fixed antisolvent addition rate of 0.21   ×   10 3 g AS g SL 1 s 1 .
Crystals 13 01074 g003
Figure 4. (a): MSZW in mass of added antisolvent per mass of starting solution. (b): Relative supersaturation when nucleation appears vs. variation of AS dosing rates. Both graphs describe the addition of antisolvent at concentrations of 100 vol % (black squares) and at 70 vol % (transparent circles).
Crystals 13 01074 g004
Figure 5. (a): The crystals from addition of 100 vol.% ethanol at 0.042   ×   10 3   g AS g SL 1 s 1 and (b): the crystals from addition of 70 vol % ethanol at 0.085   ×   10 3   g AS g SL 1 s 1 .
Crystals 13 01074 g005
Figure 6. Logarithmic representation of the MSZW ( Δ A m a x ) and the AS-dosing rate R for different cases of AS delution.
Crystals 13 01074 g006
Table 1. Setup for endoscope probe in Vimba Viewer.
PreferenceValue
Exposure1 s
Gain0 db
ExposureAutoTarget50
BlackLevel4
Gamma1
Table 2. Coefficients for SLE-Fit.
ab R 2
f ( c E t O H [ m o l L ] ) = w S c [ g k g ] 11.99−0.6260.9962
Table 3. Nucleation kinetic parameters for different antisolvent dilution rates.
dc * dA n k n R 2
AS-Feed = 100 vol.%−0.0981.8382.800.924
AS-Feed = 70 vol.%−0.0414.81135.79 × 1060.958
Disclaimer/Publisher’s Note: The statements, opinions and data contained in all publications are solely those of the individual author(s) and contributor(s) and not of MDPI and/or the editor(s). MDPI and/or the editor(s) disclaim responsibility for any injury to people or property resulting from any ideas, methods, instructions or products referred to in the content.

