
Electrodeposited Fabrication of CeO2 Branched-like Nanostructure Used for Nonenzymatic Glucose Biosensor

 and
and 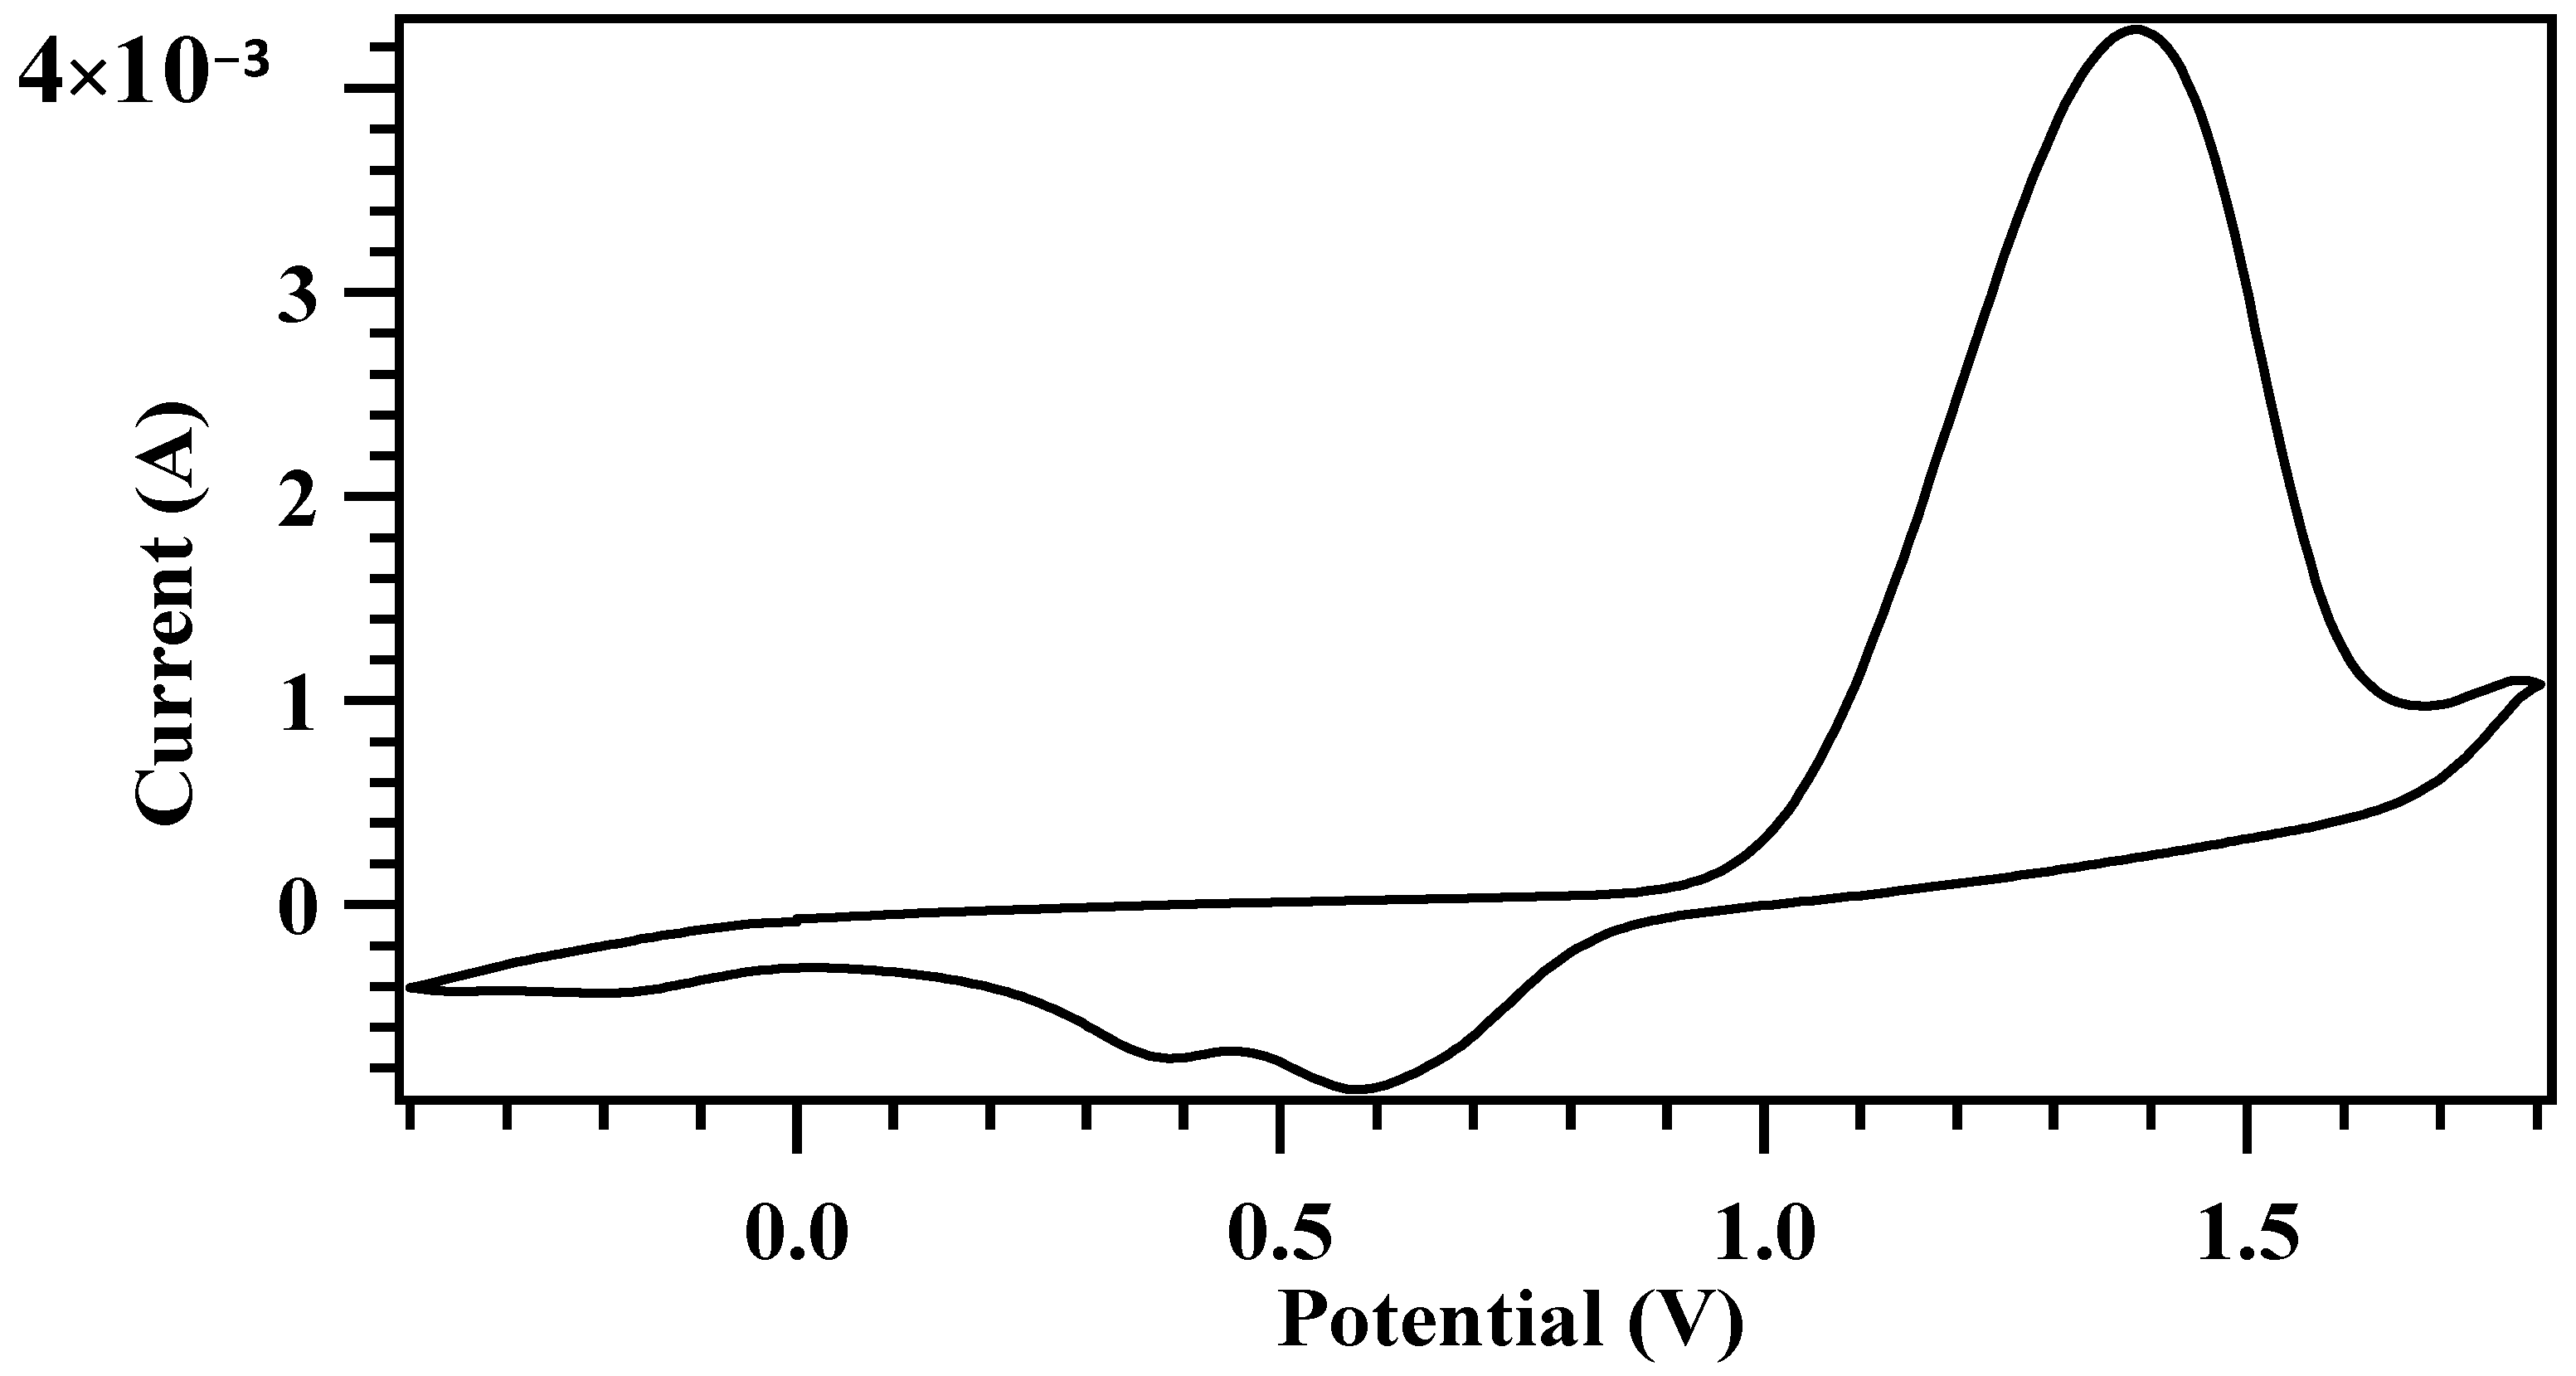
Abstract
:1. Introduction
2. Materials and Methods
2.1. Chemicals
2.2. Fabrication of CeO2-Based Biosensors
2.3. Characterization
2.4. Glucose Detection Test
3. Results and Discussion
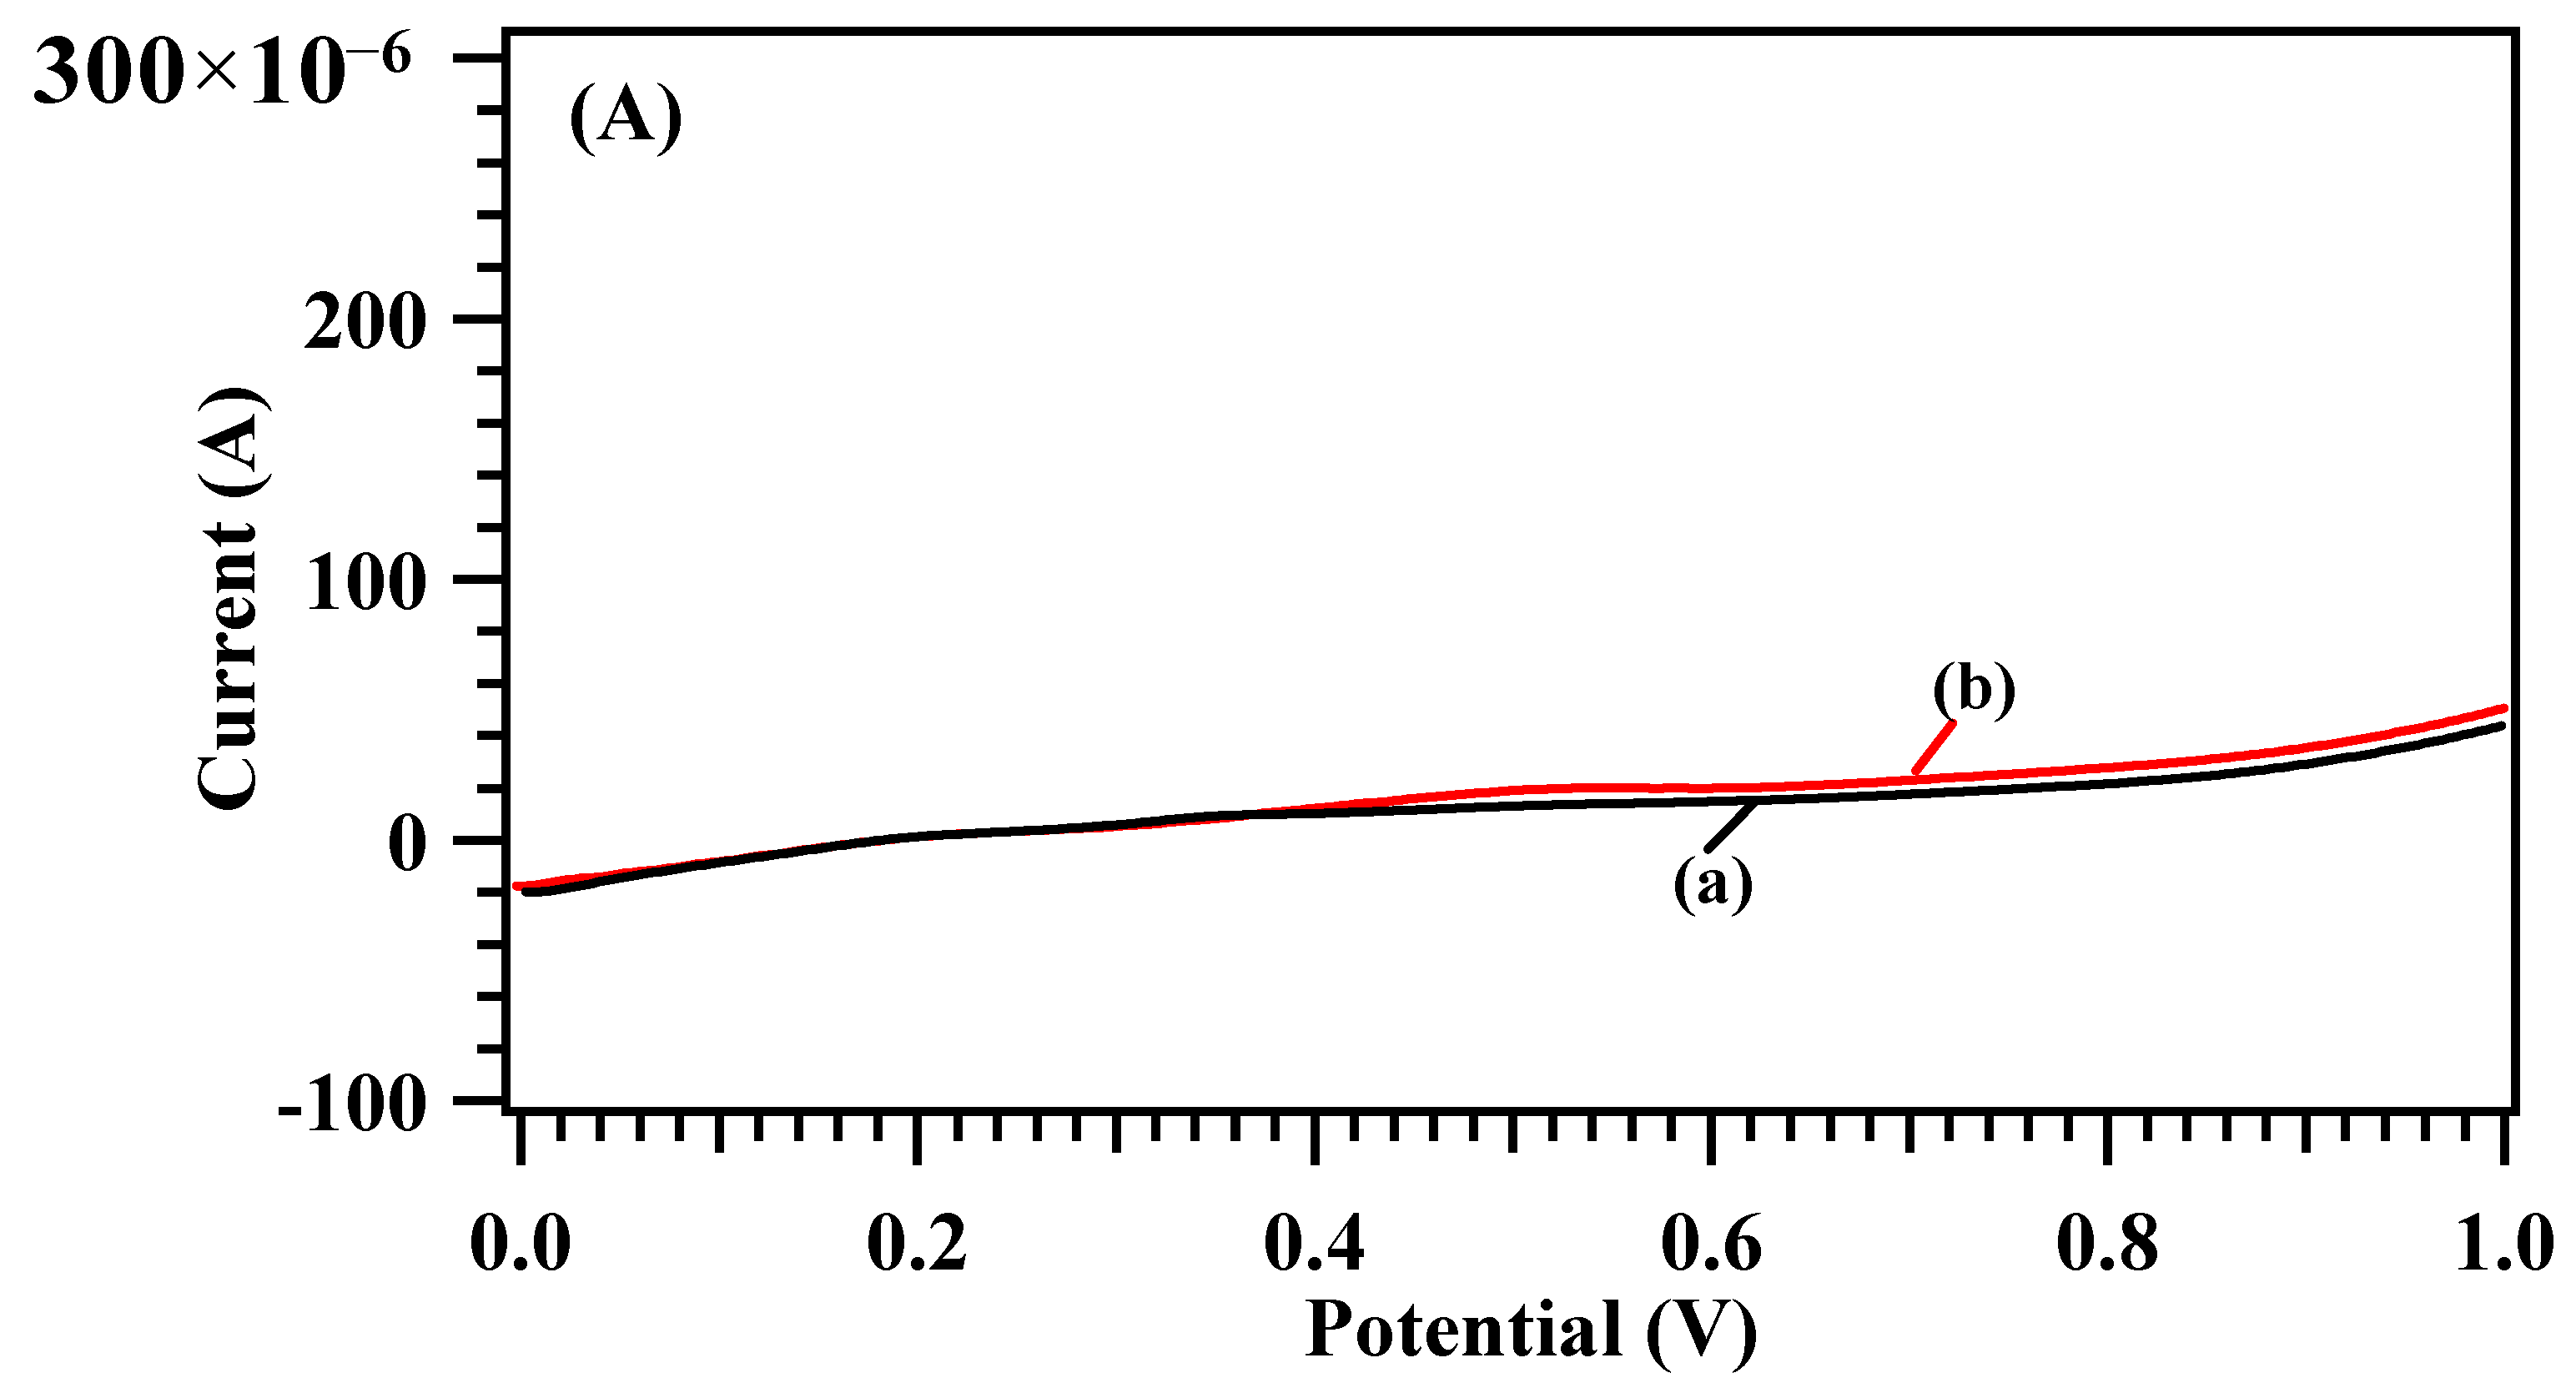
3.1. Cyclic Voltammetry Curves
3.2. Effect of CH3COOH Content
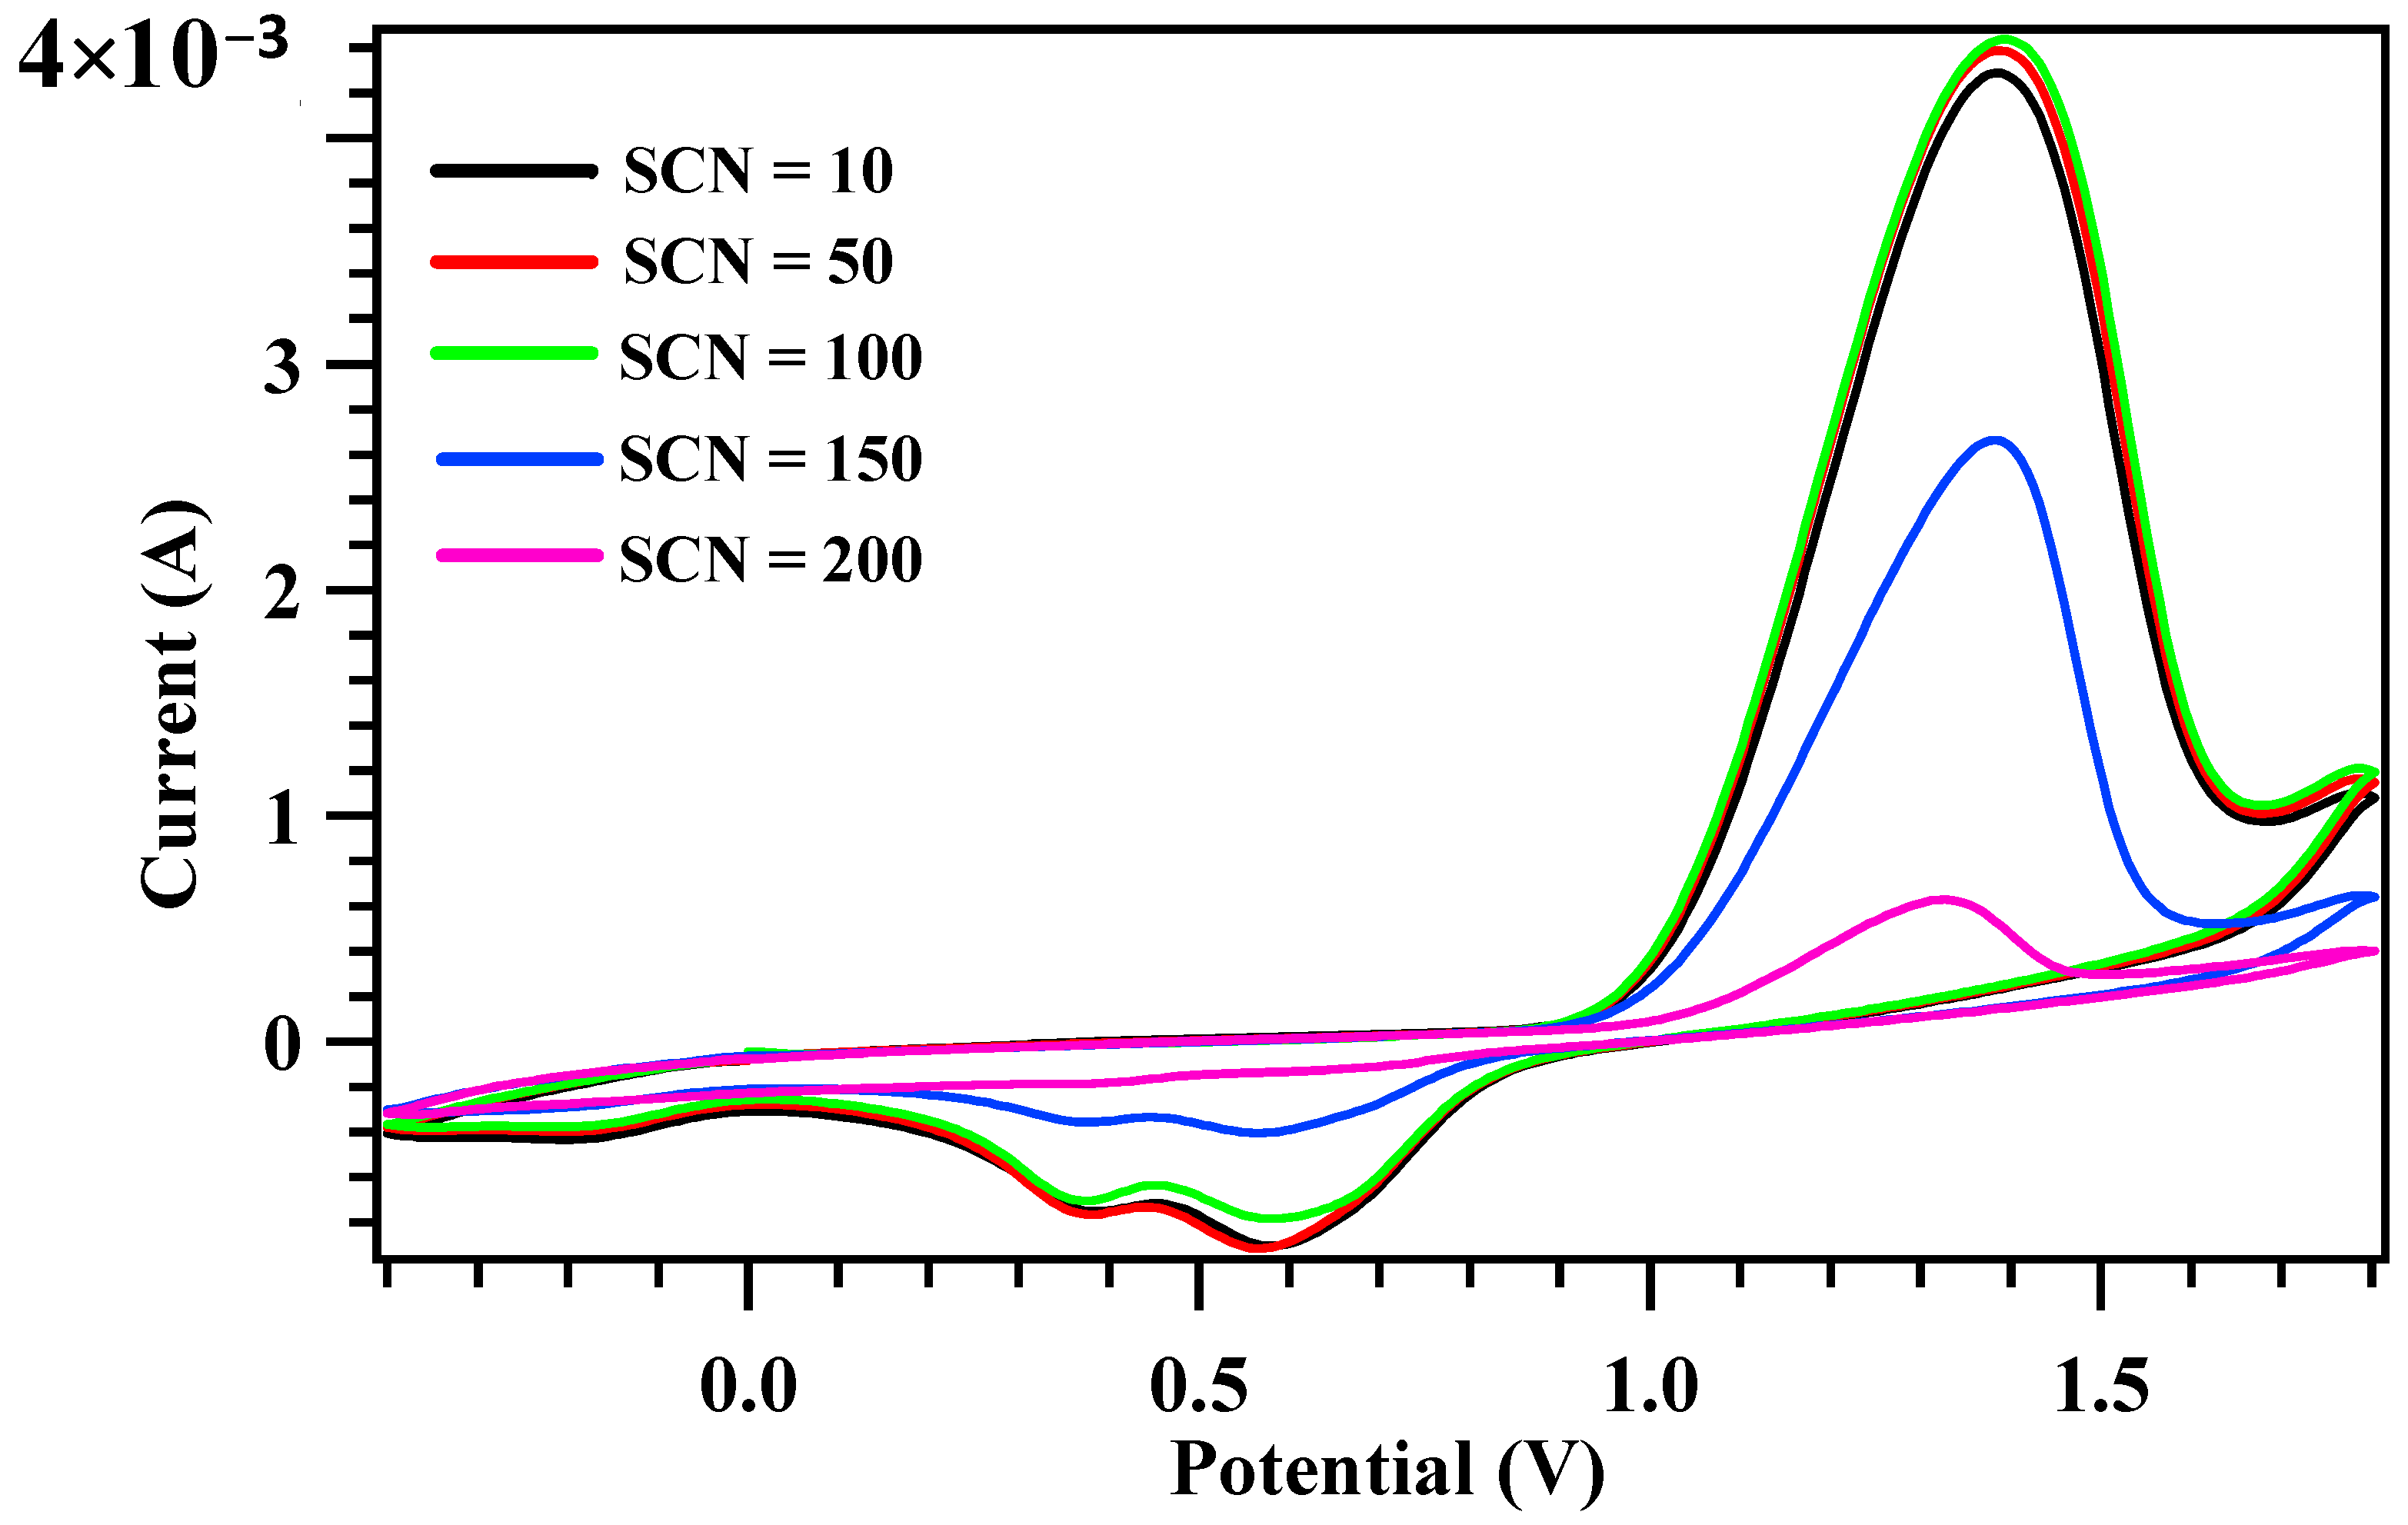
3.3. Effect of Scan Cycle Number
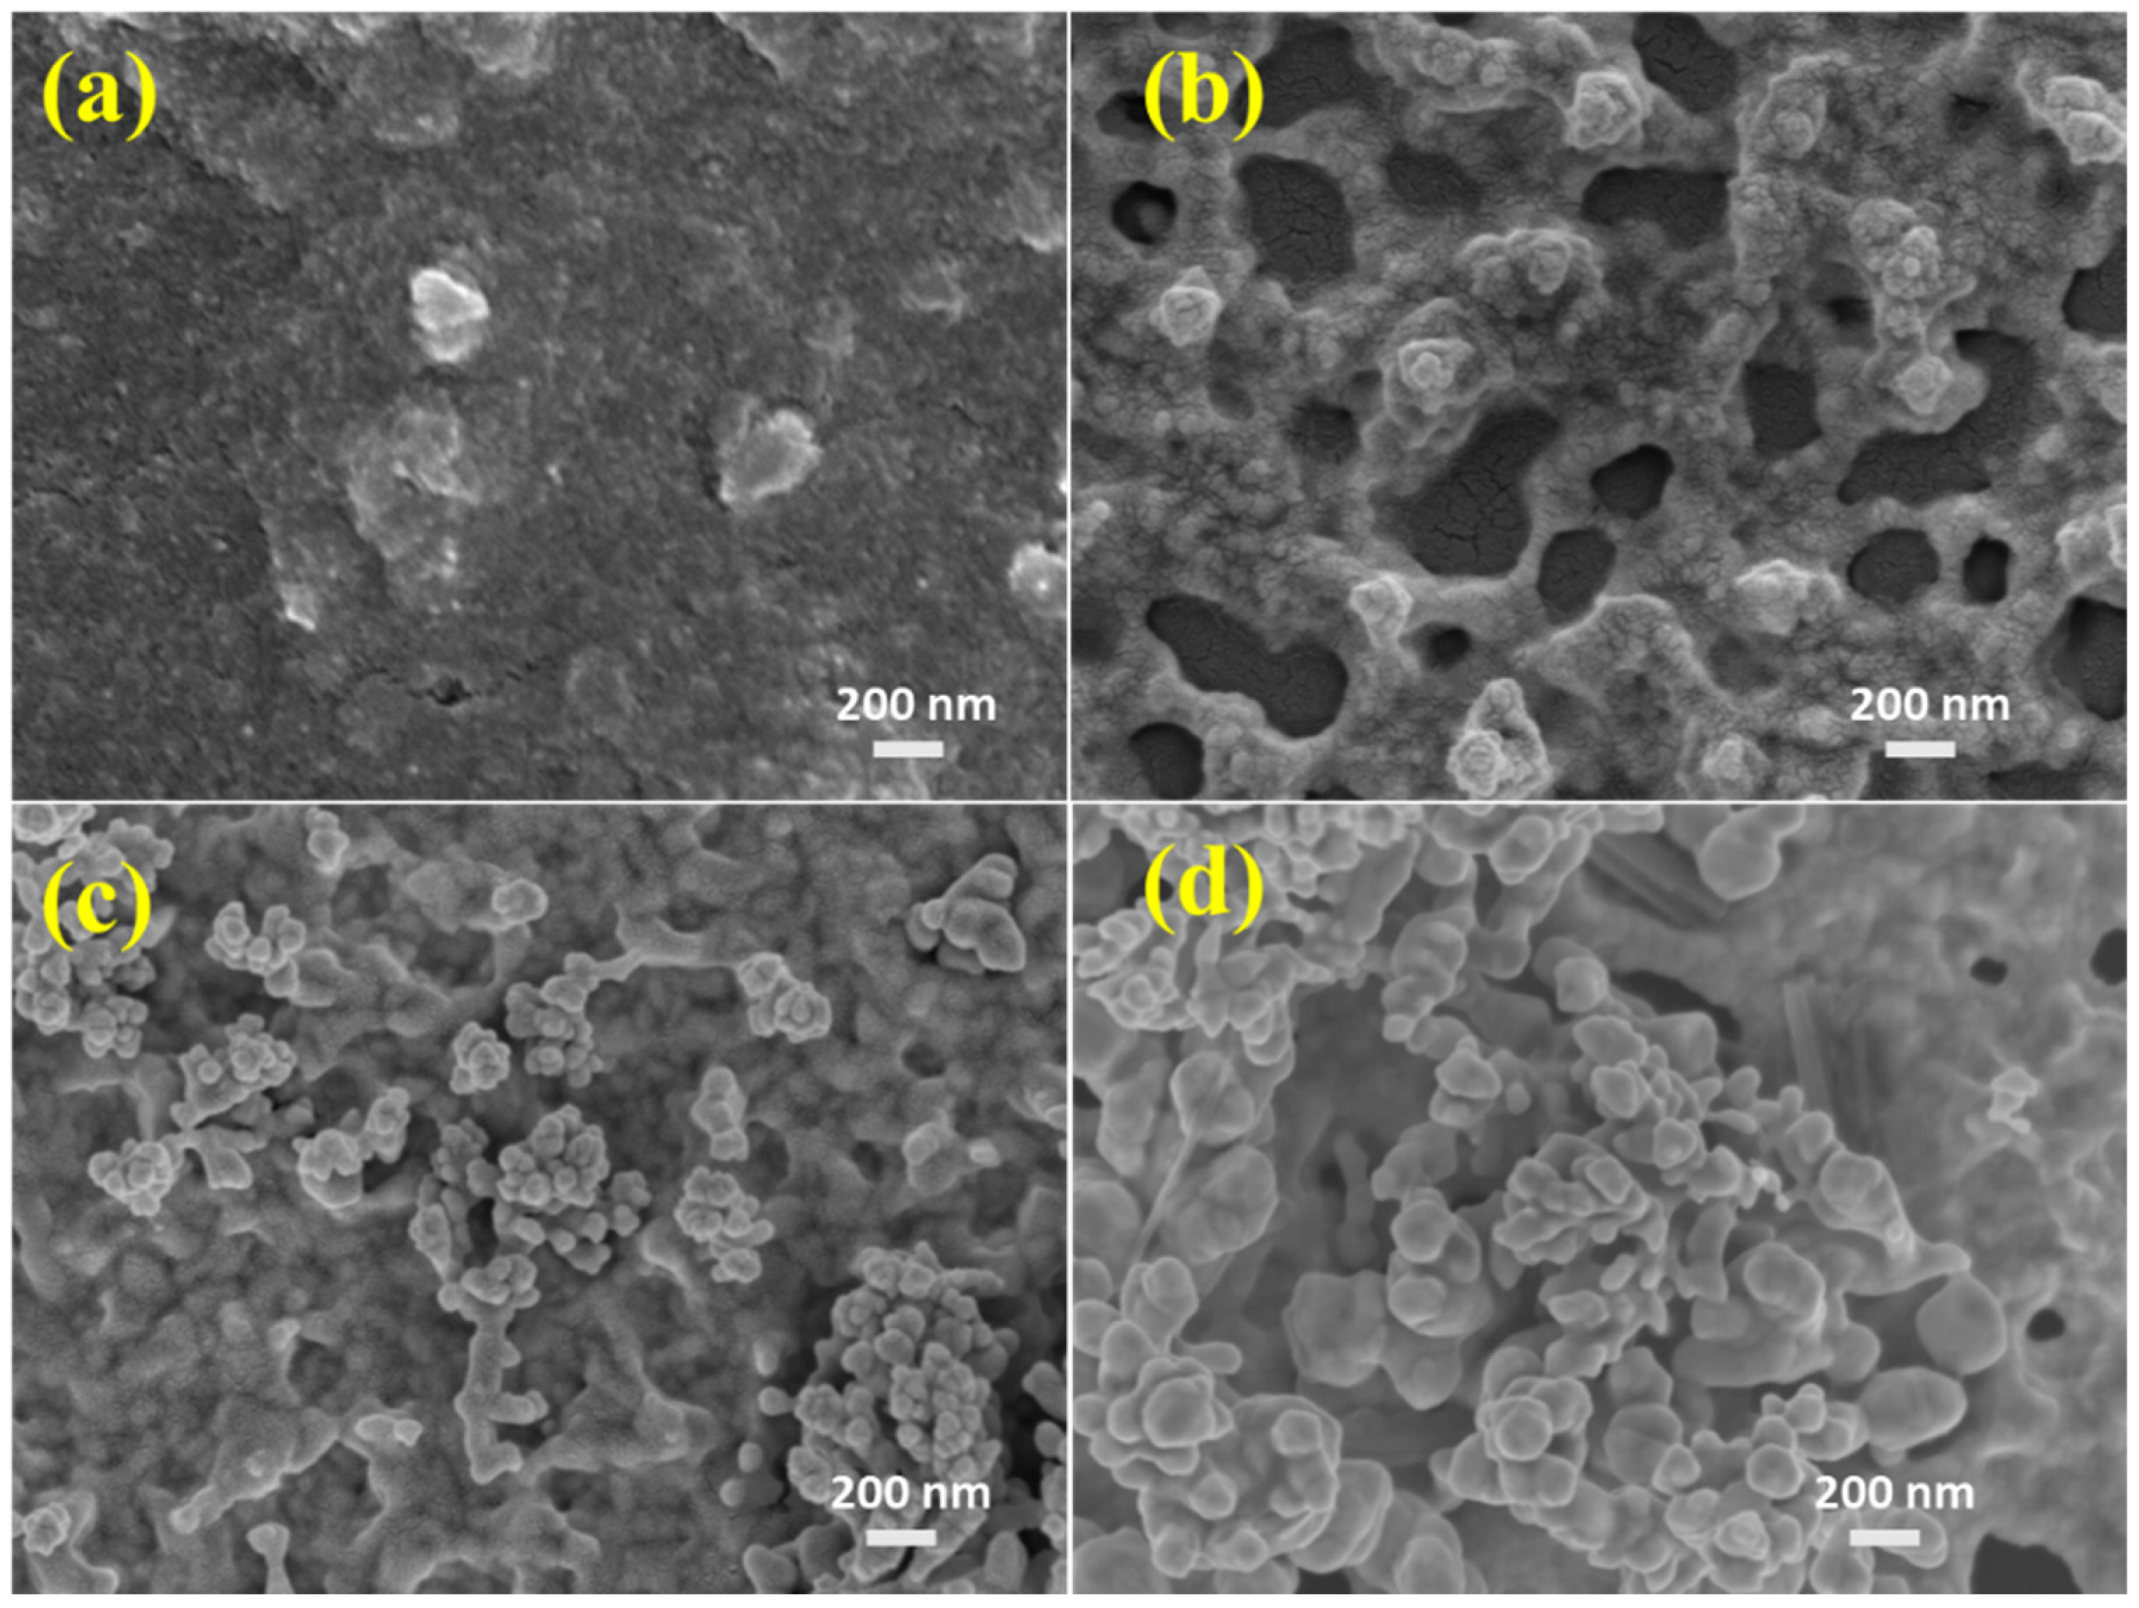
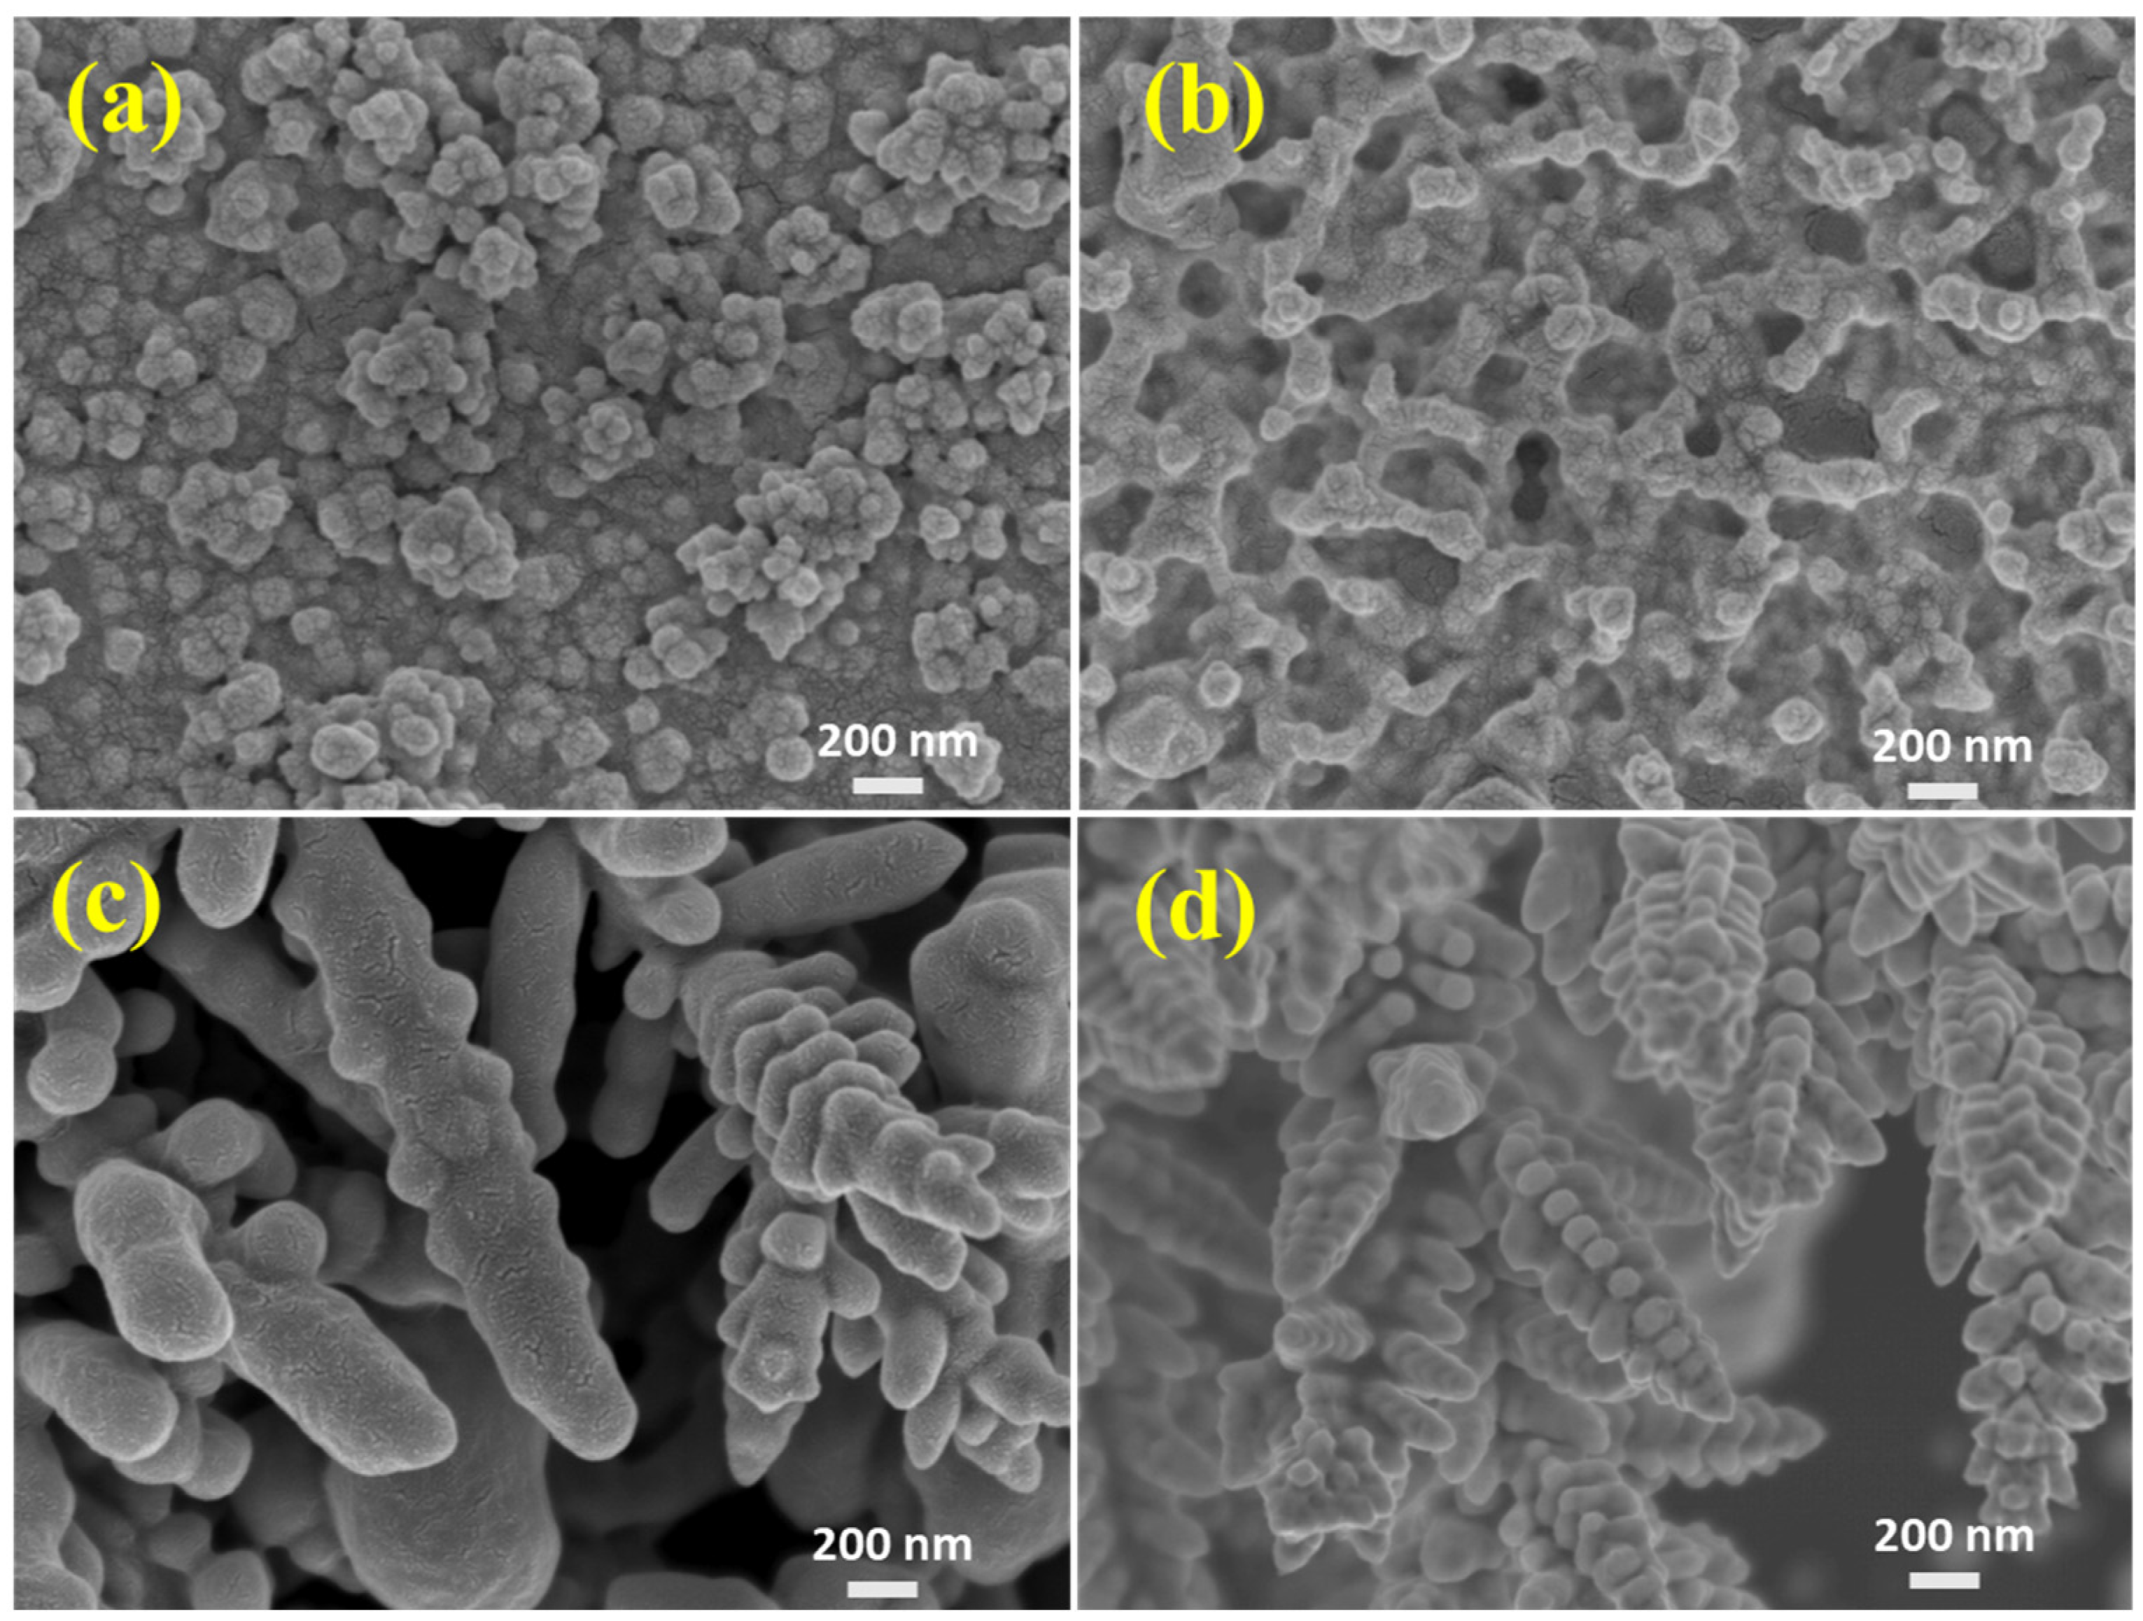
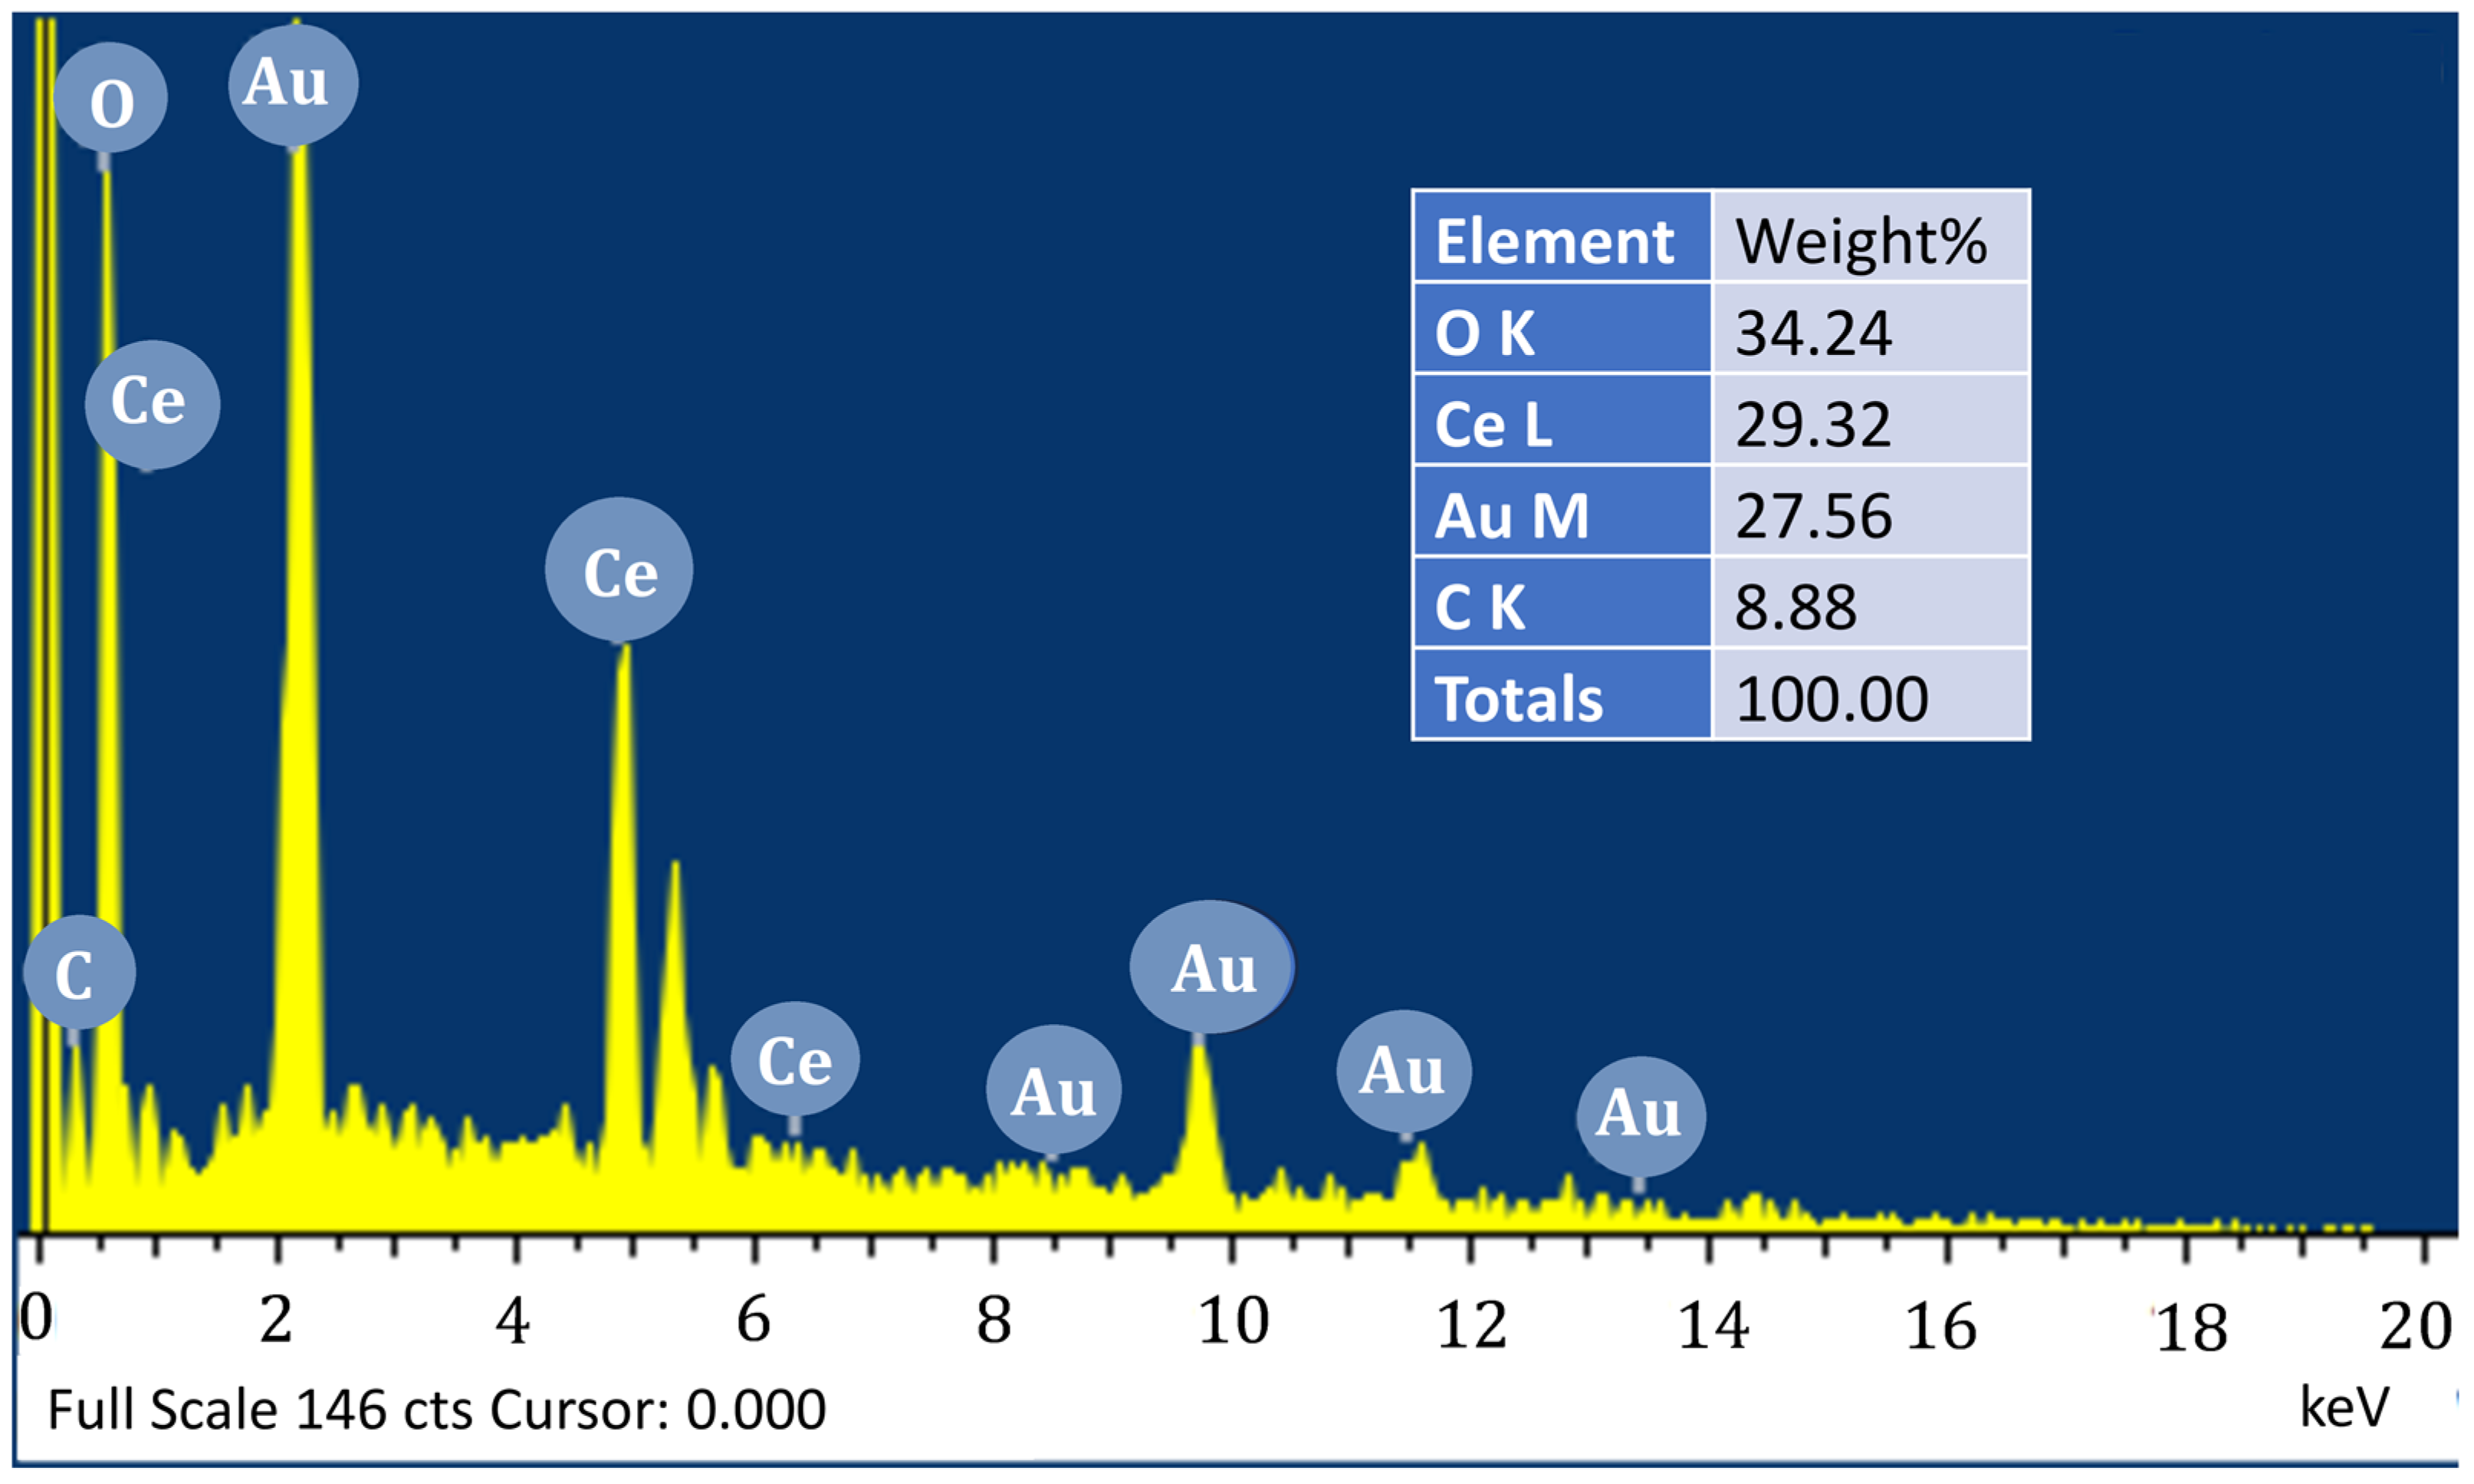
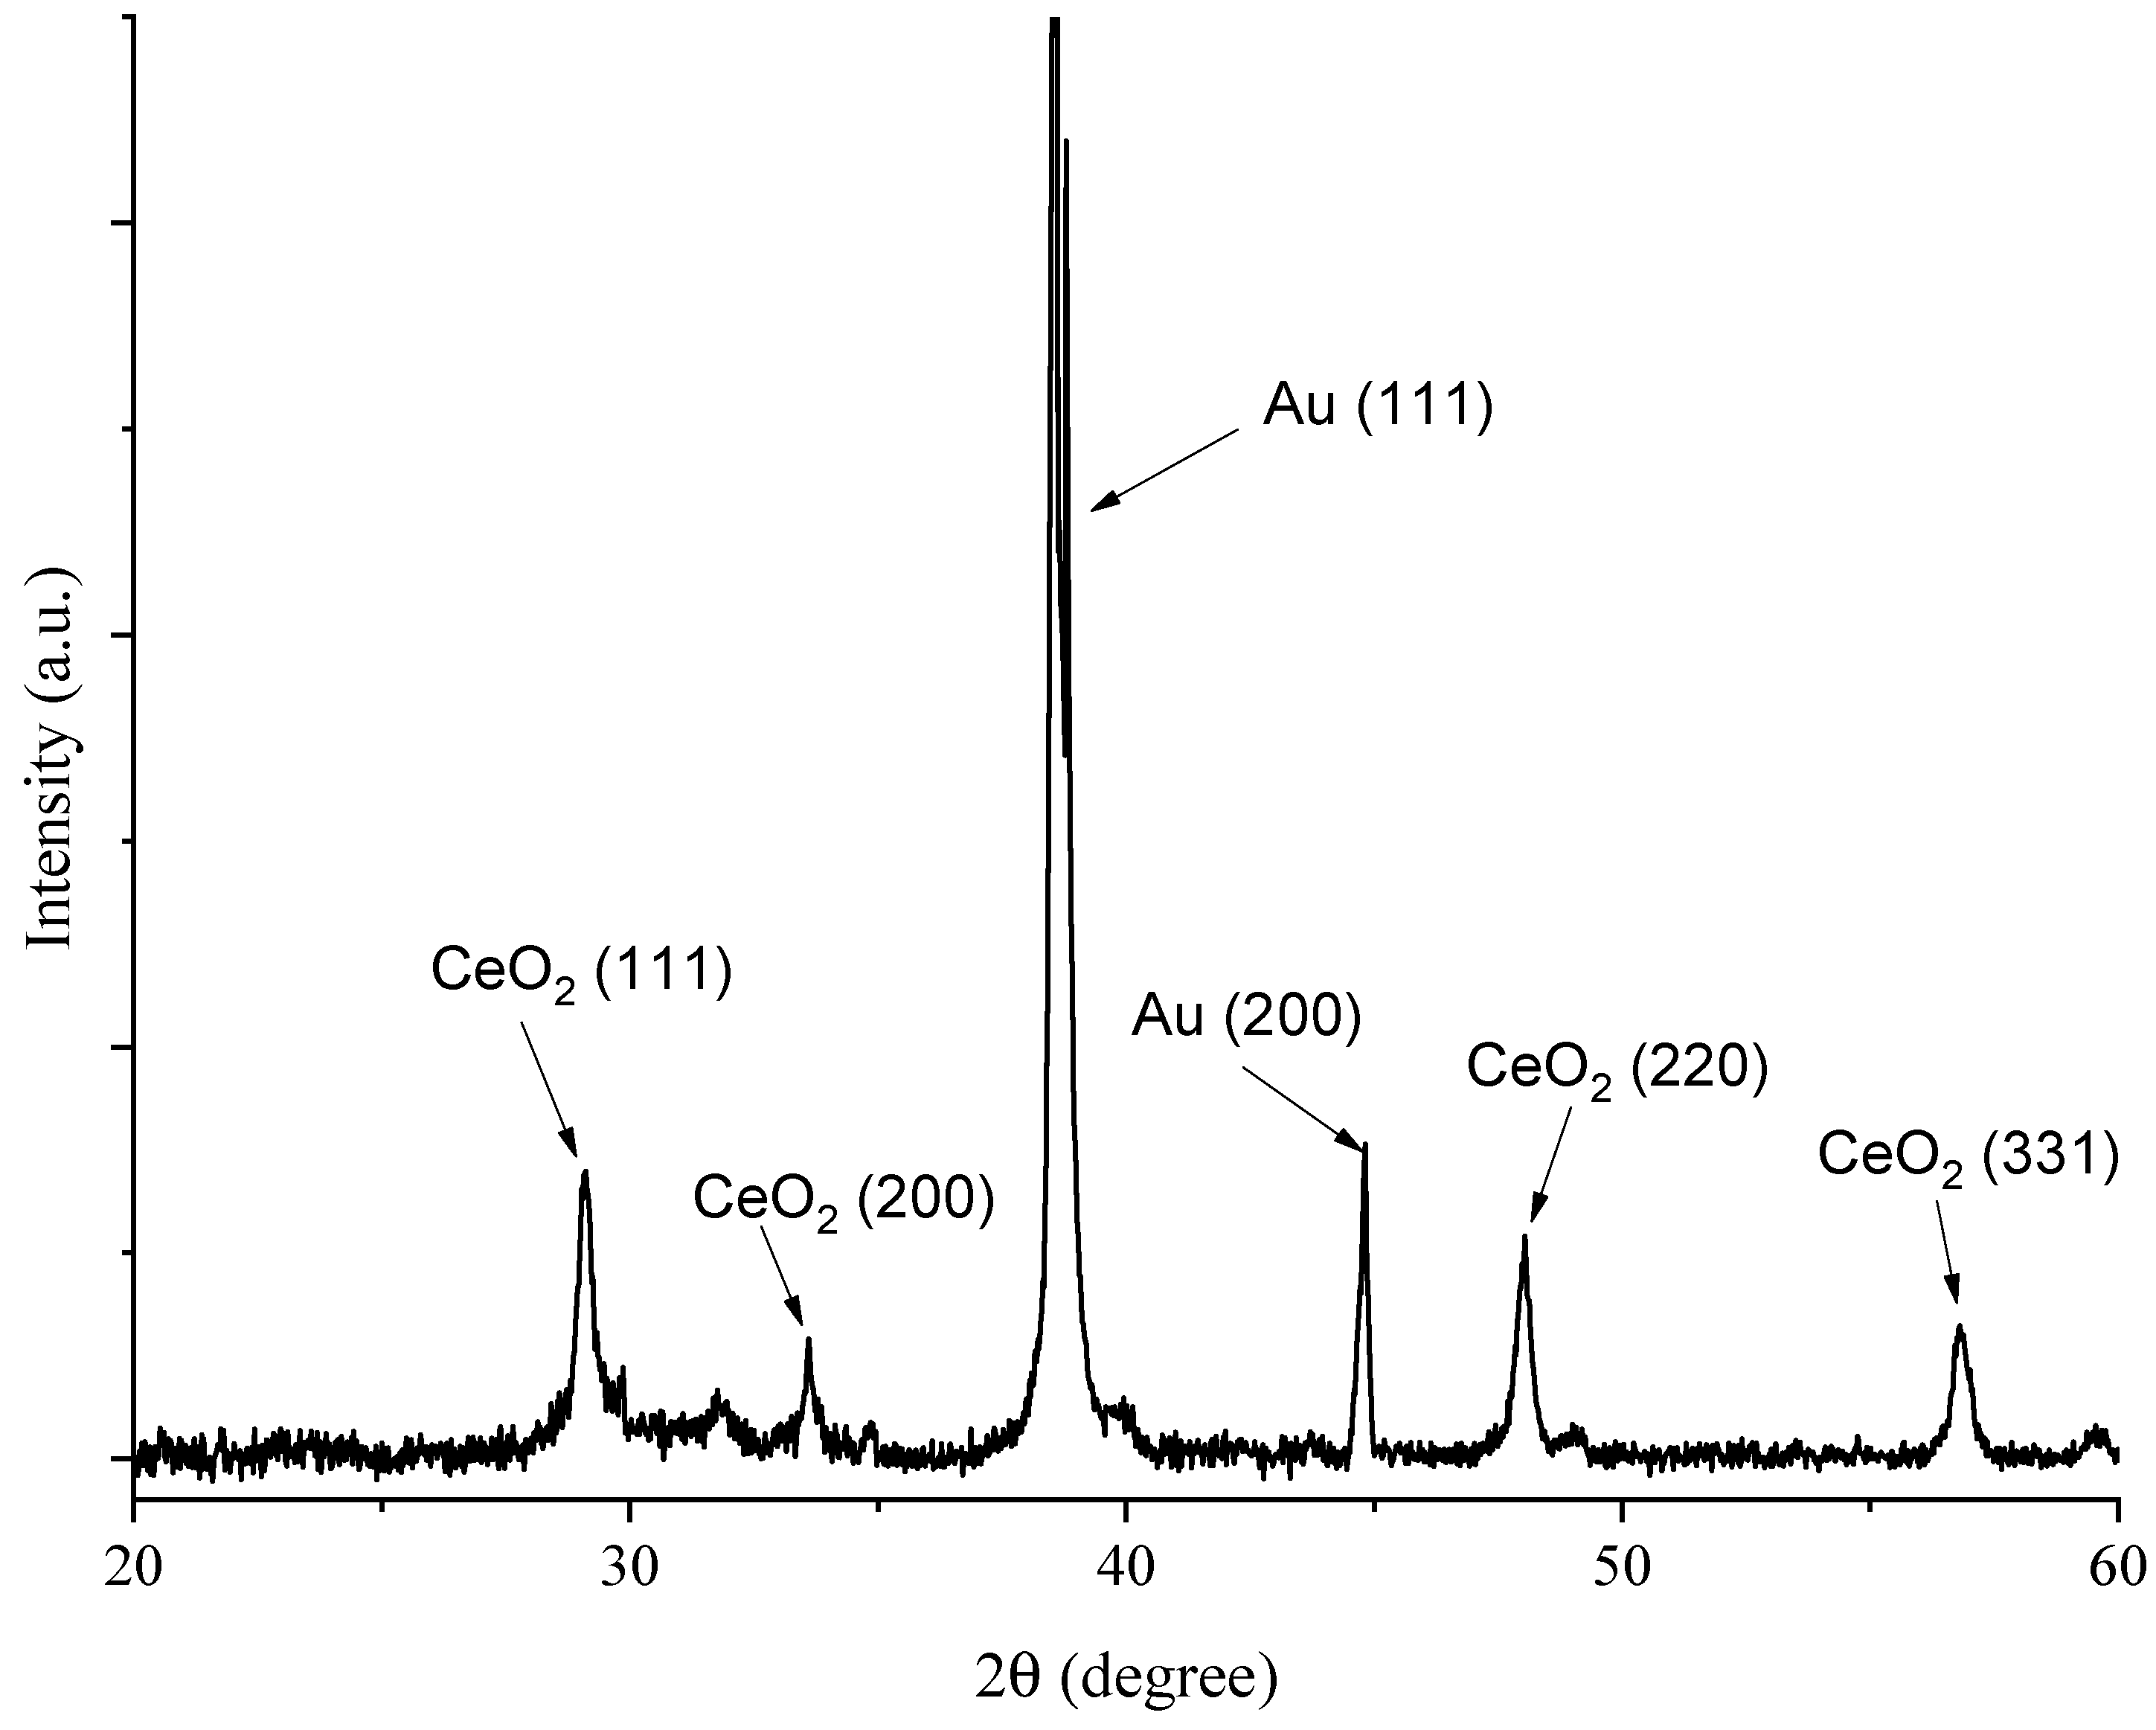
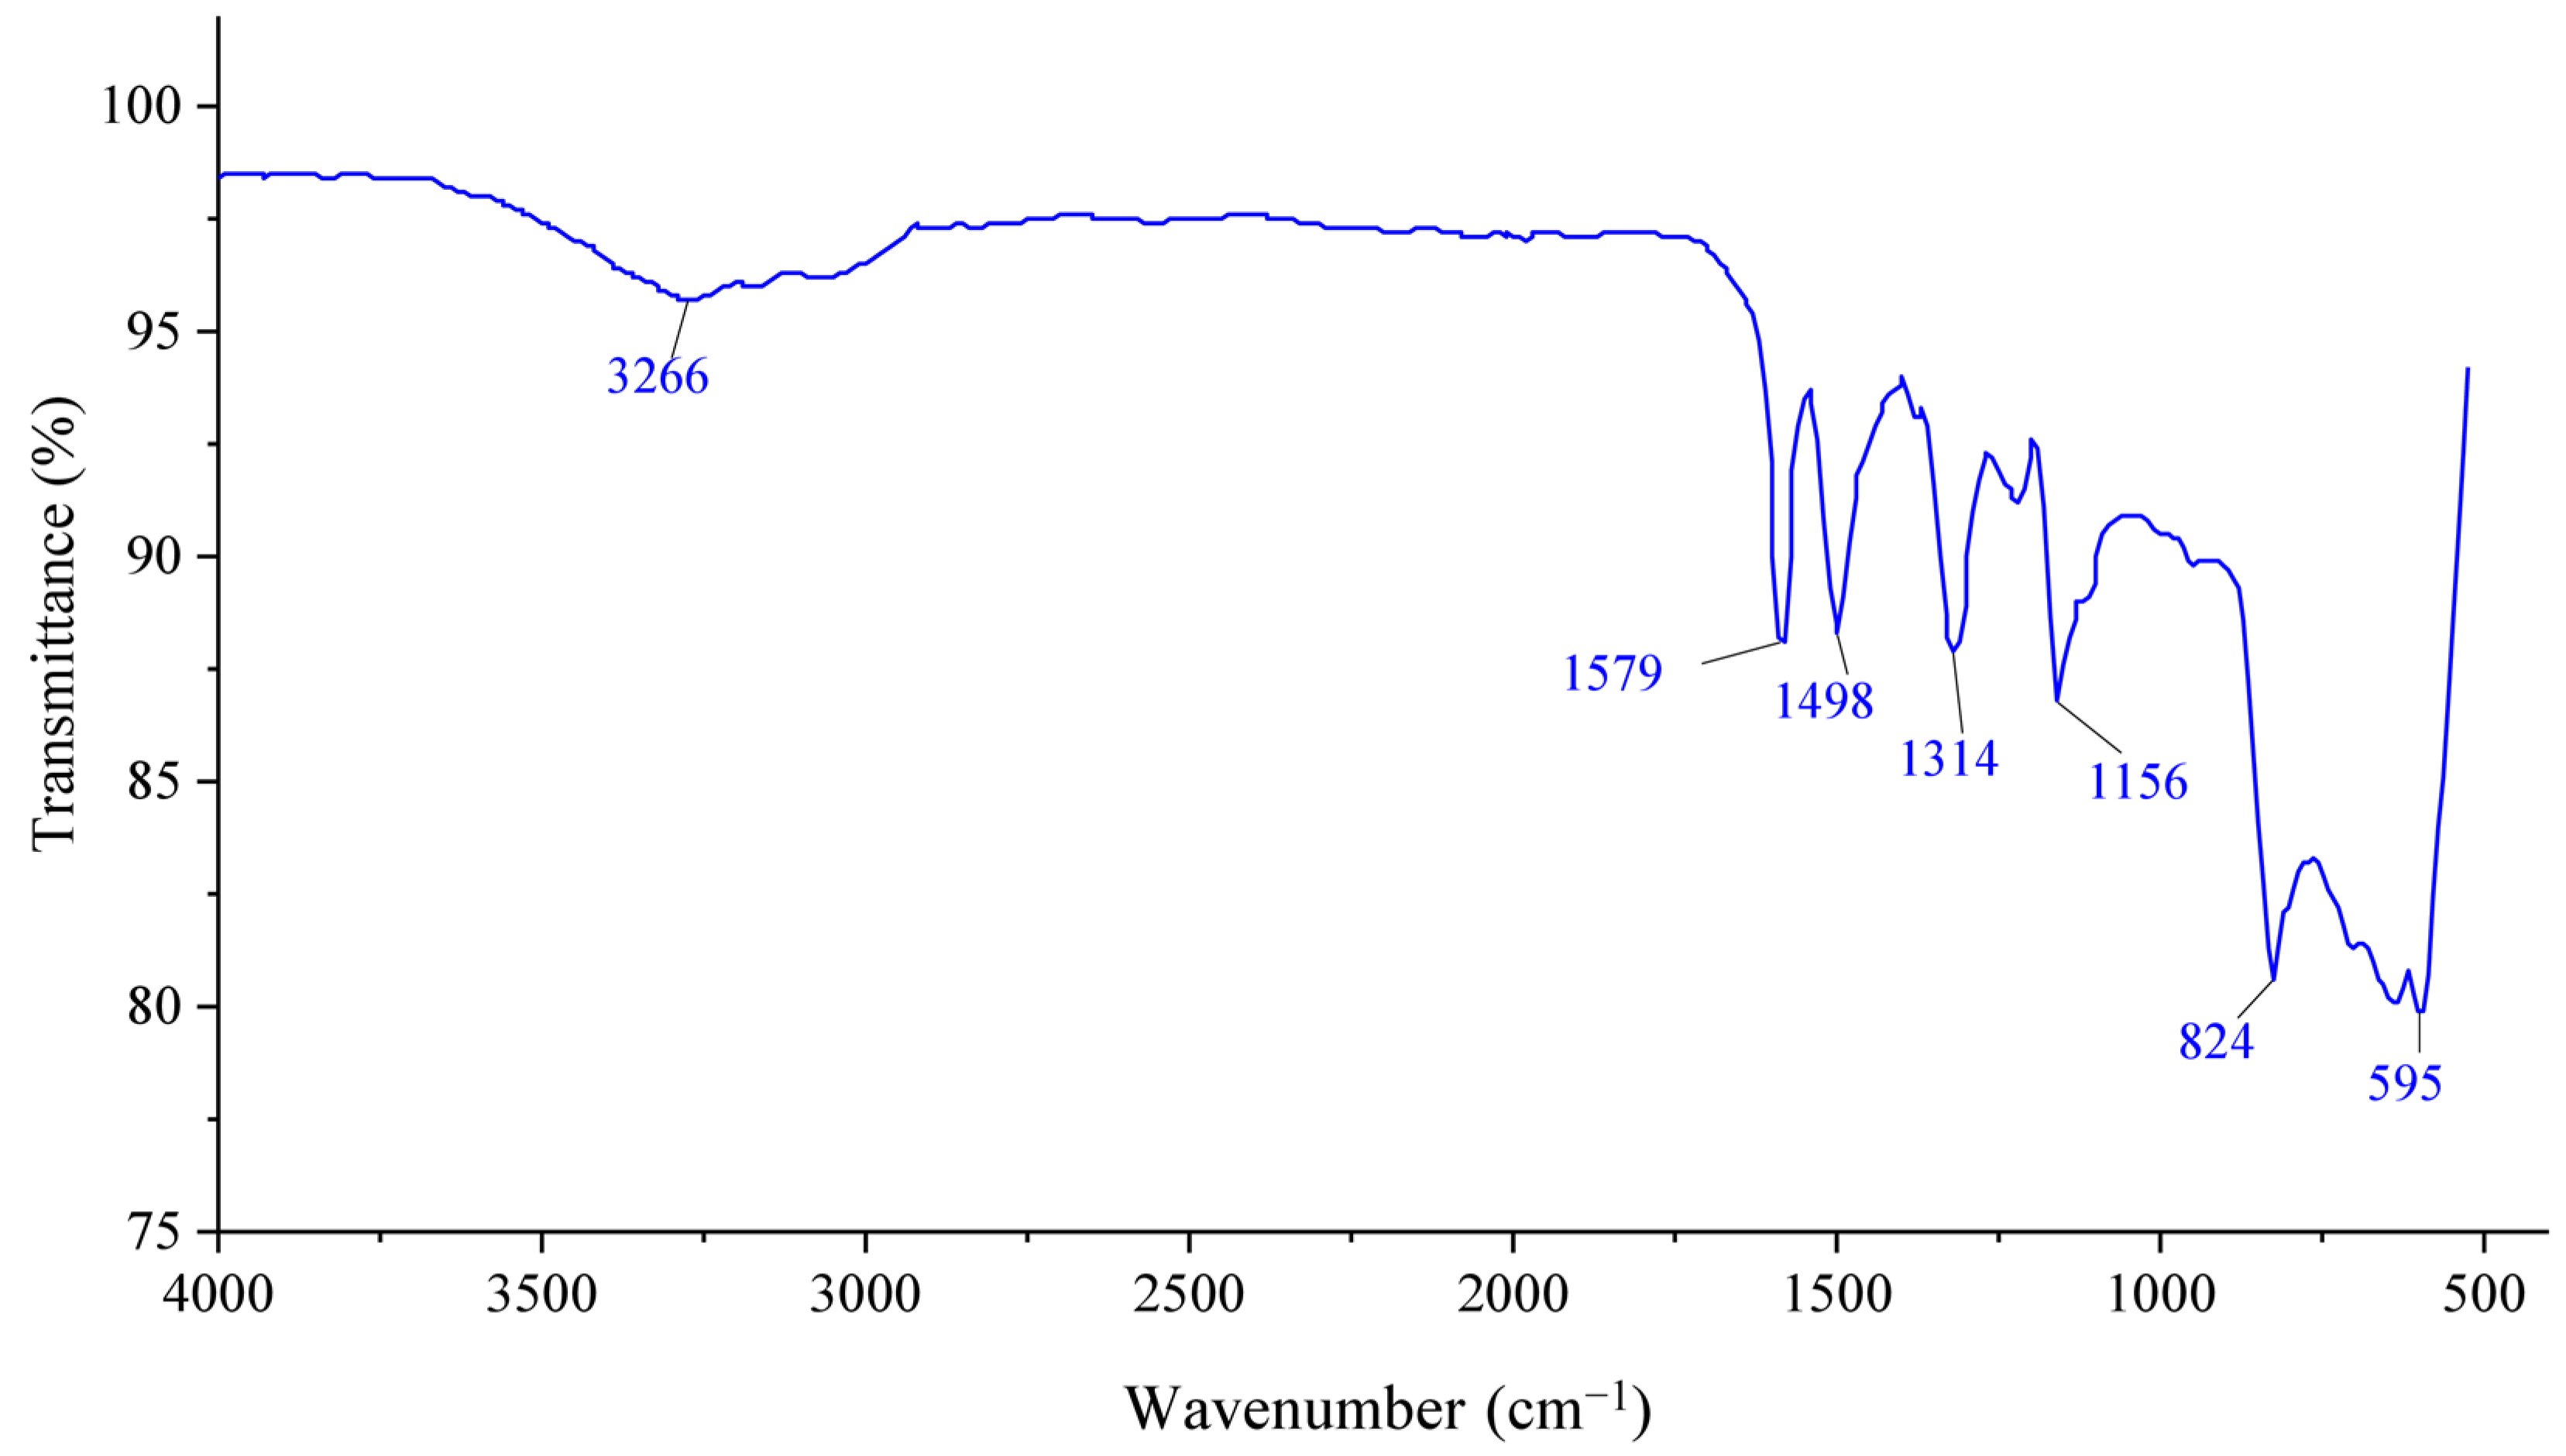
3.4. Electrode Characterization
3.5. Feasibility for Nonenzymatic Glucose Detection
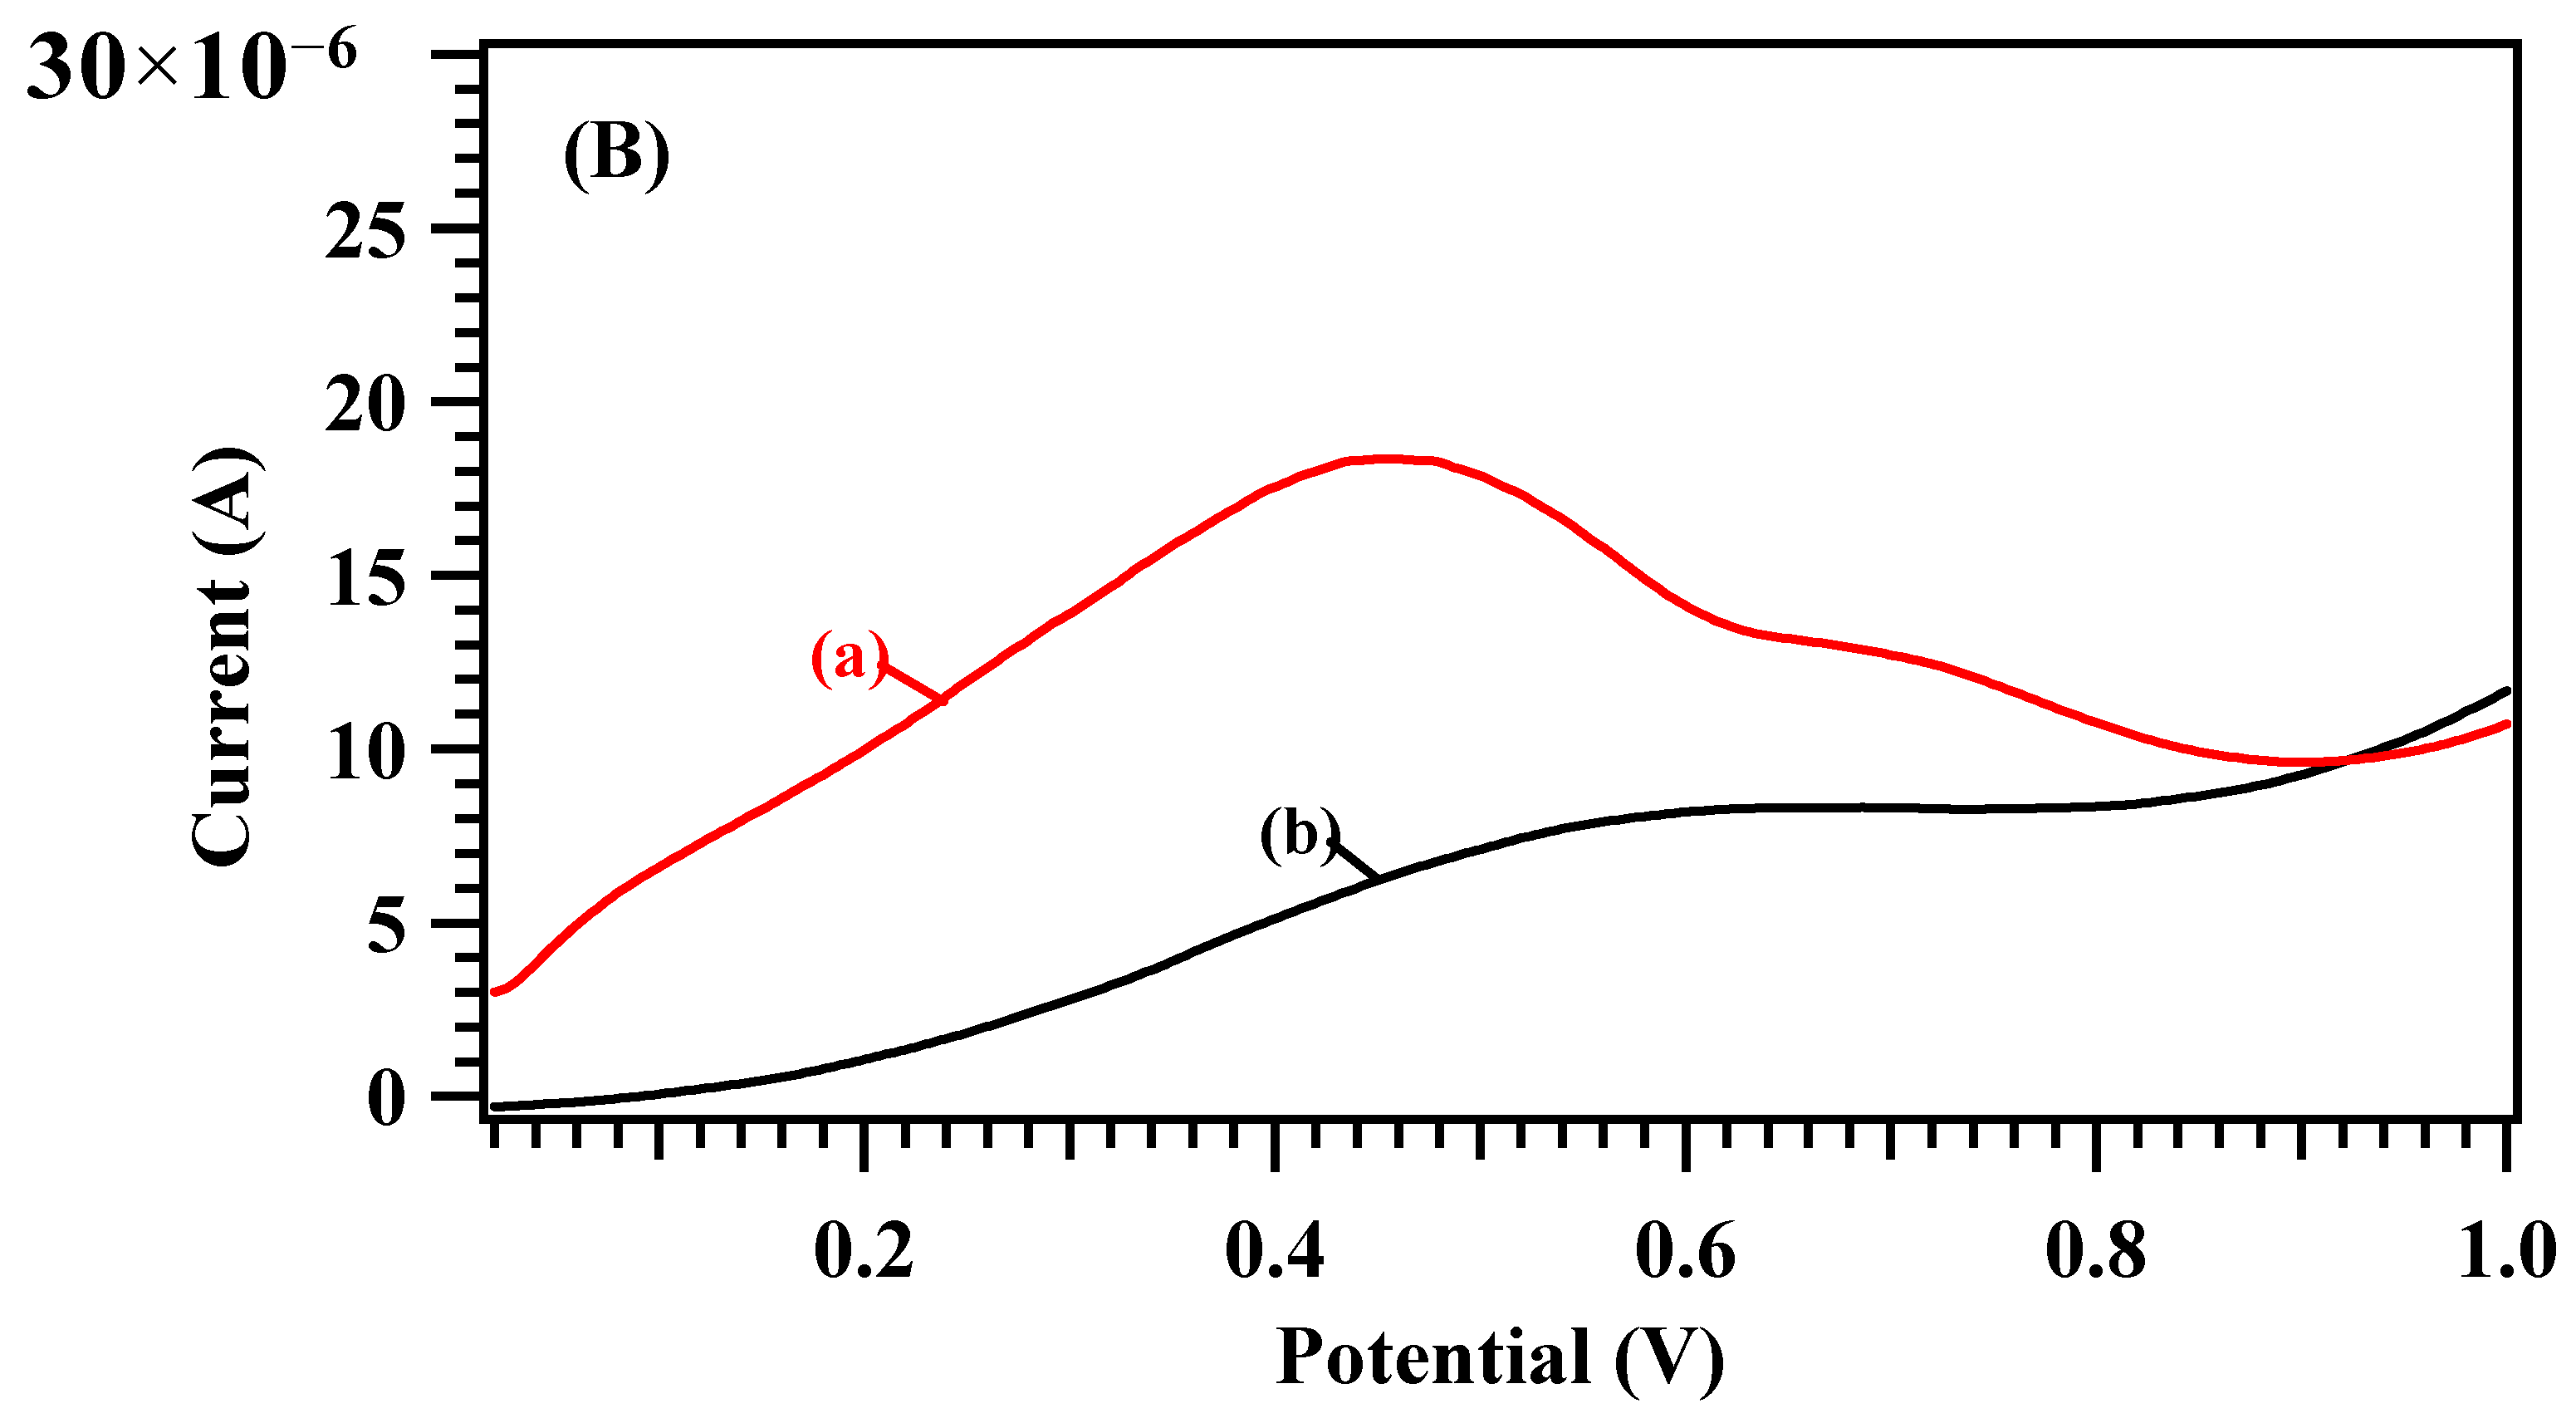
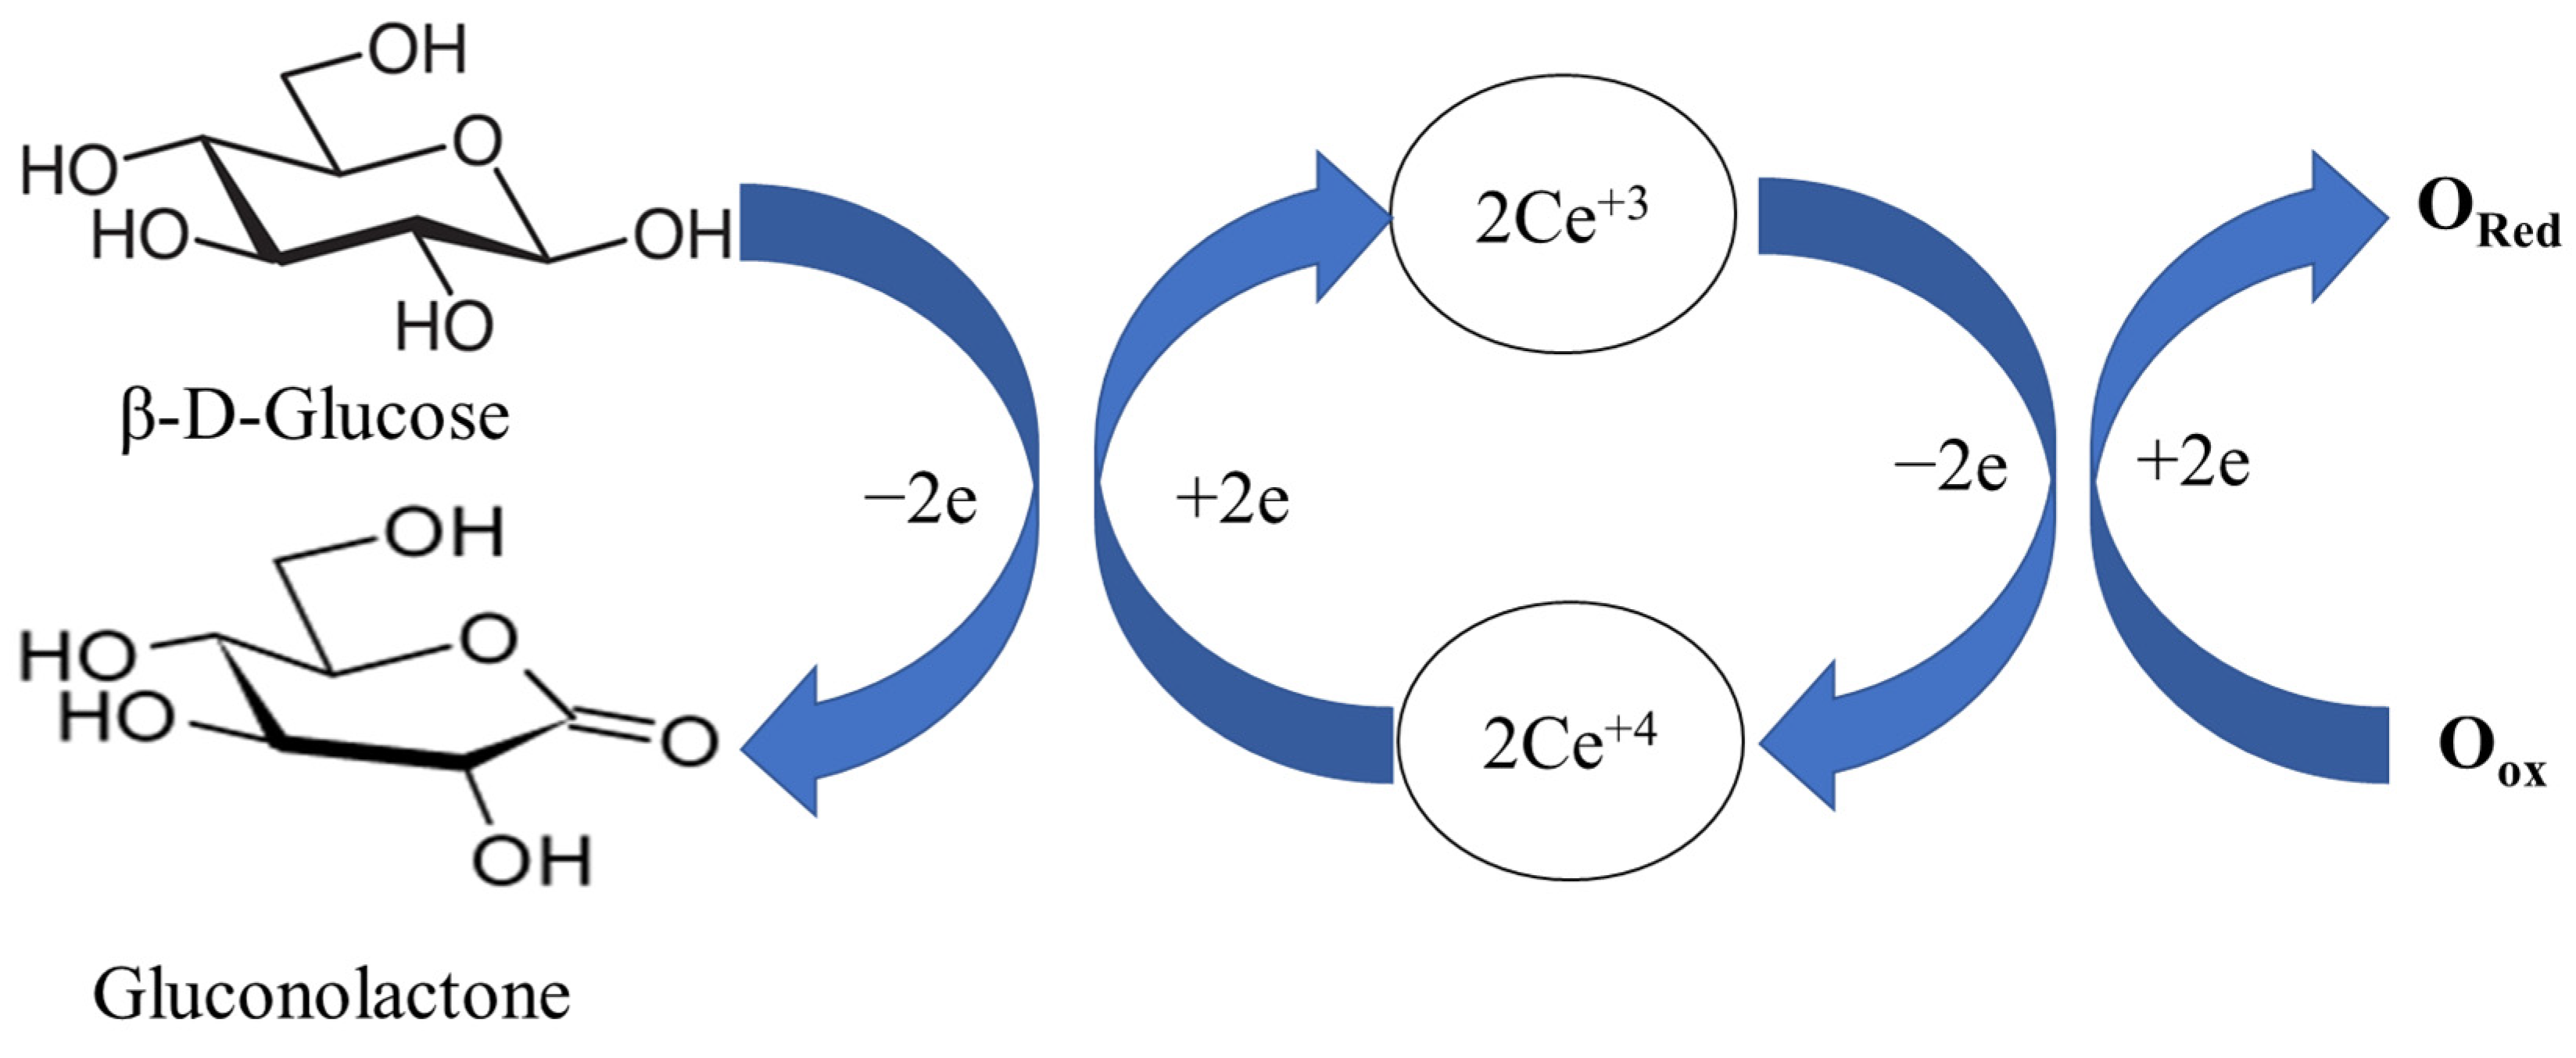
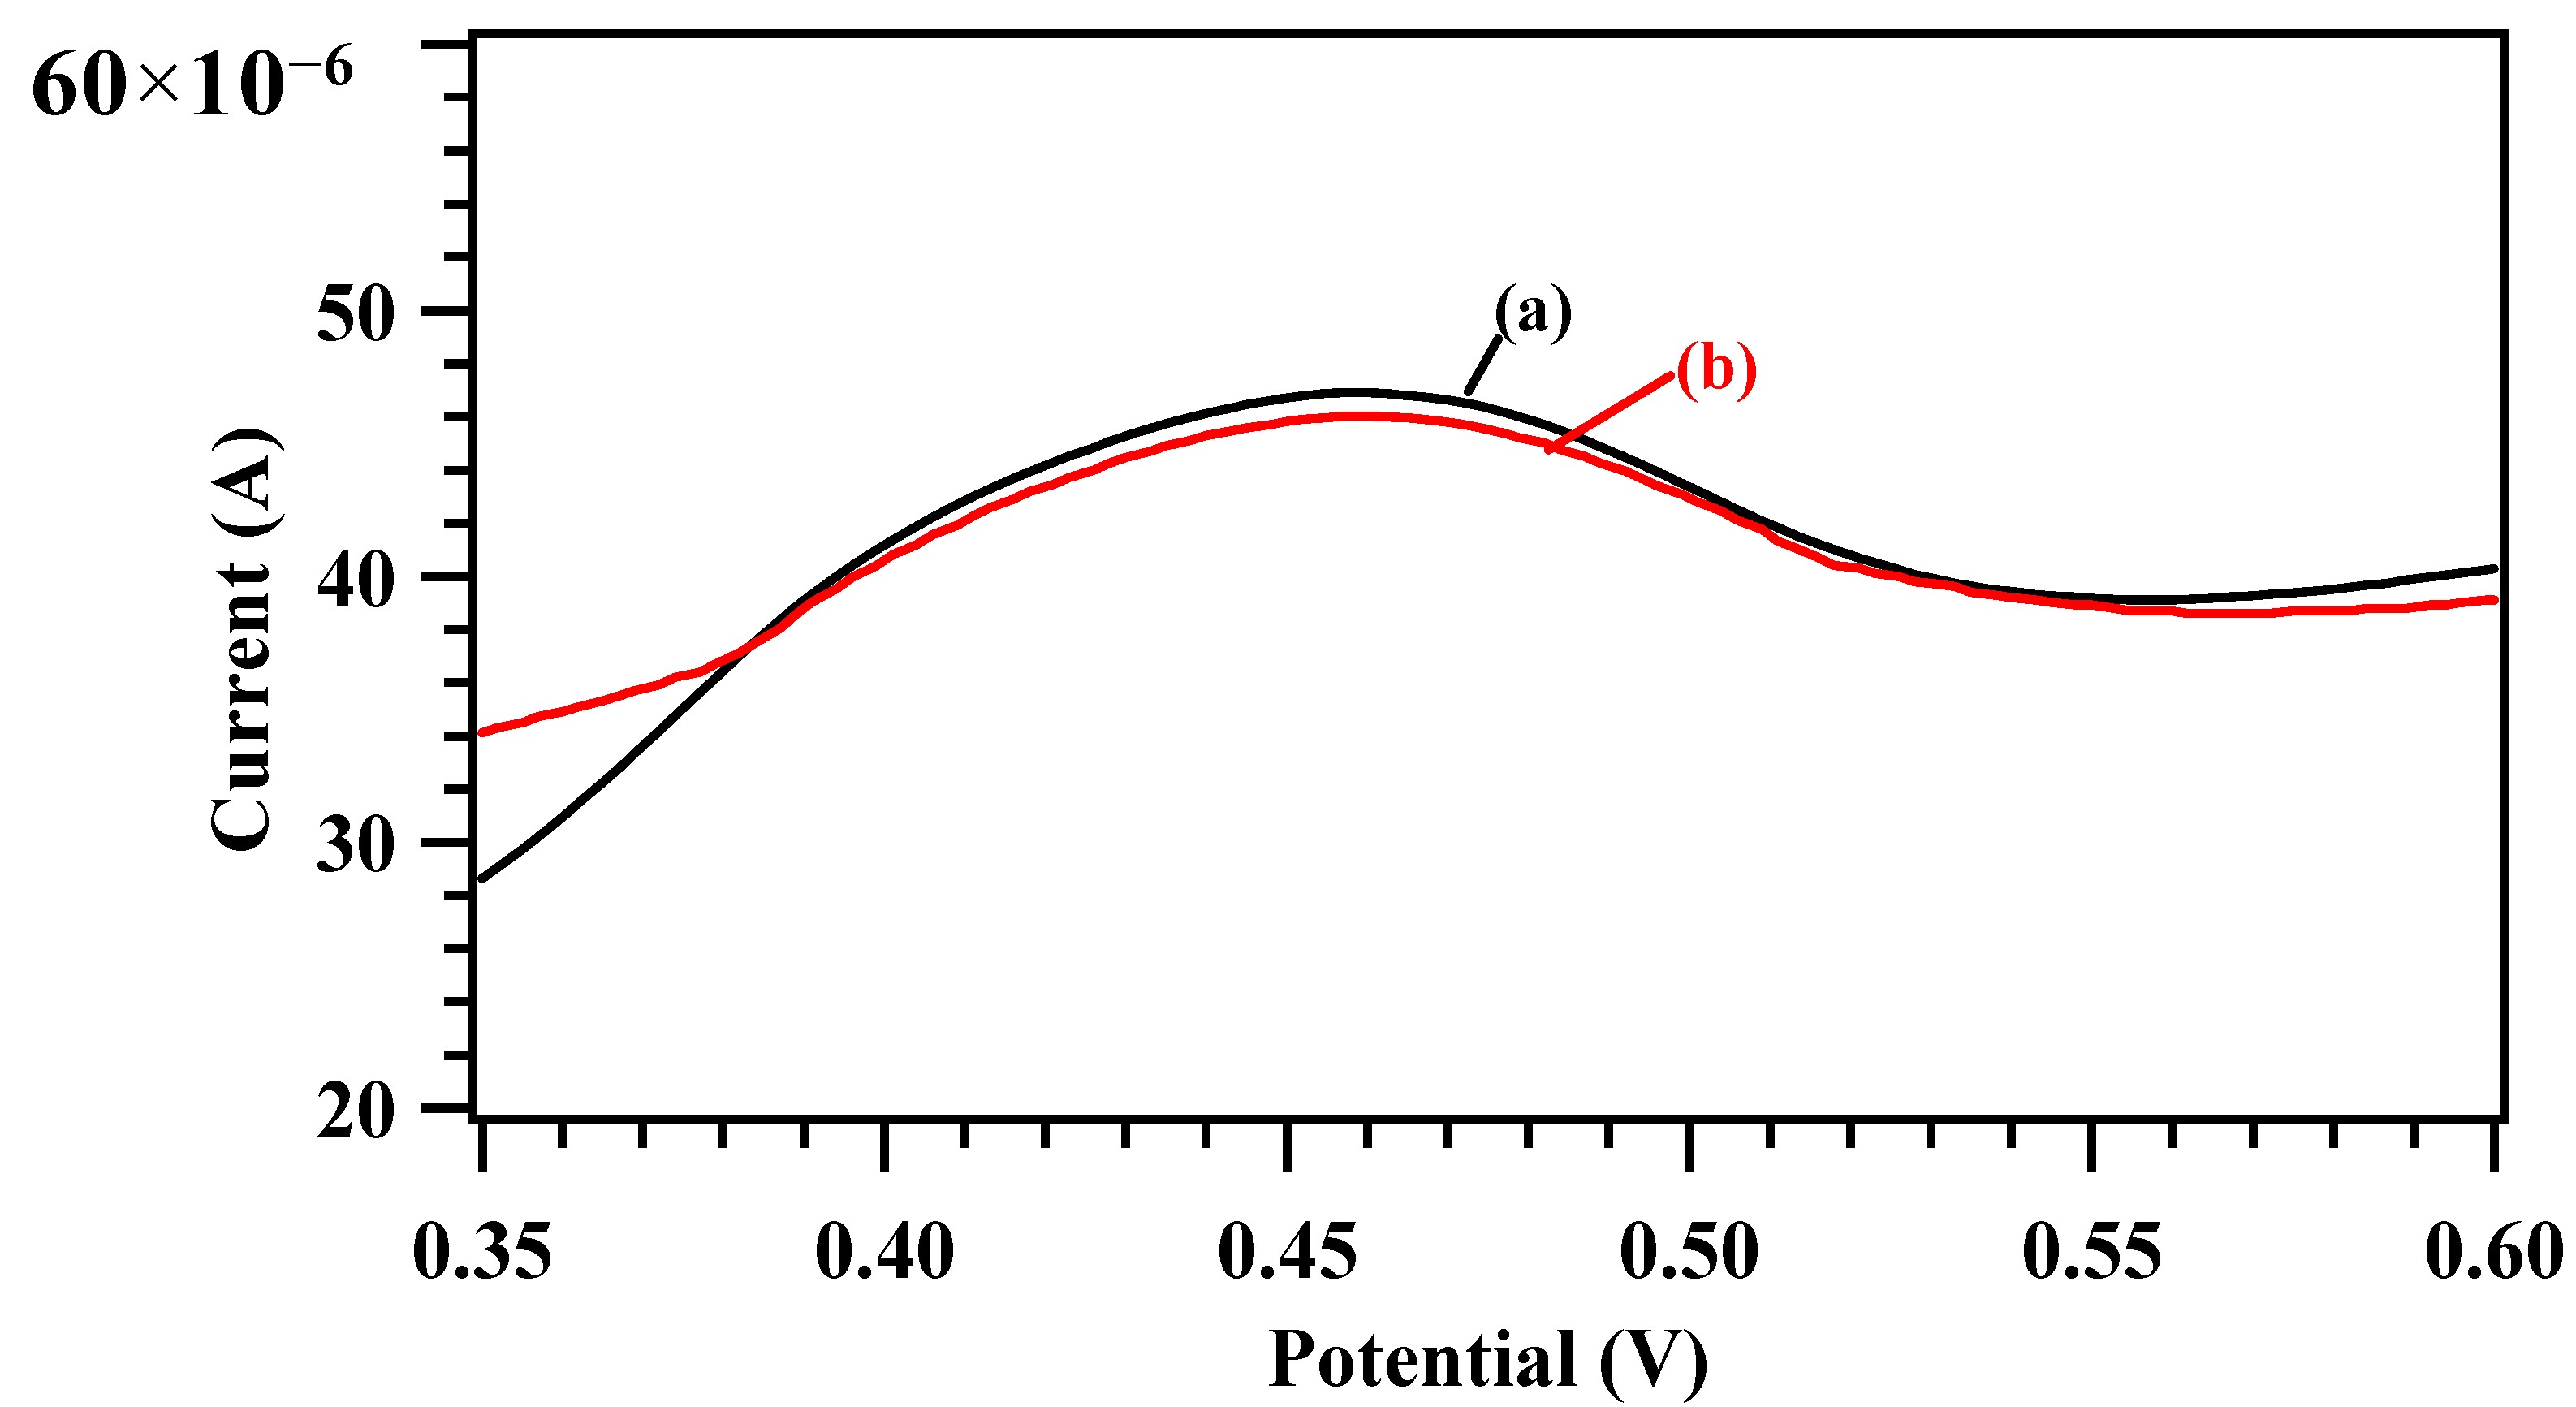
3.5.1. Determination of the Oxidation Potential of β-D-Glucose
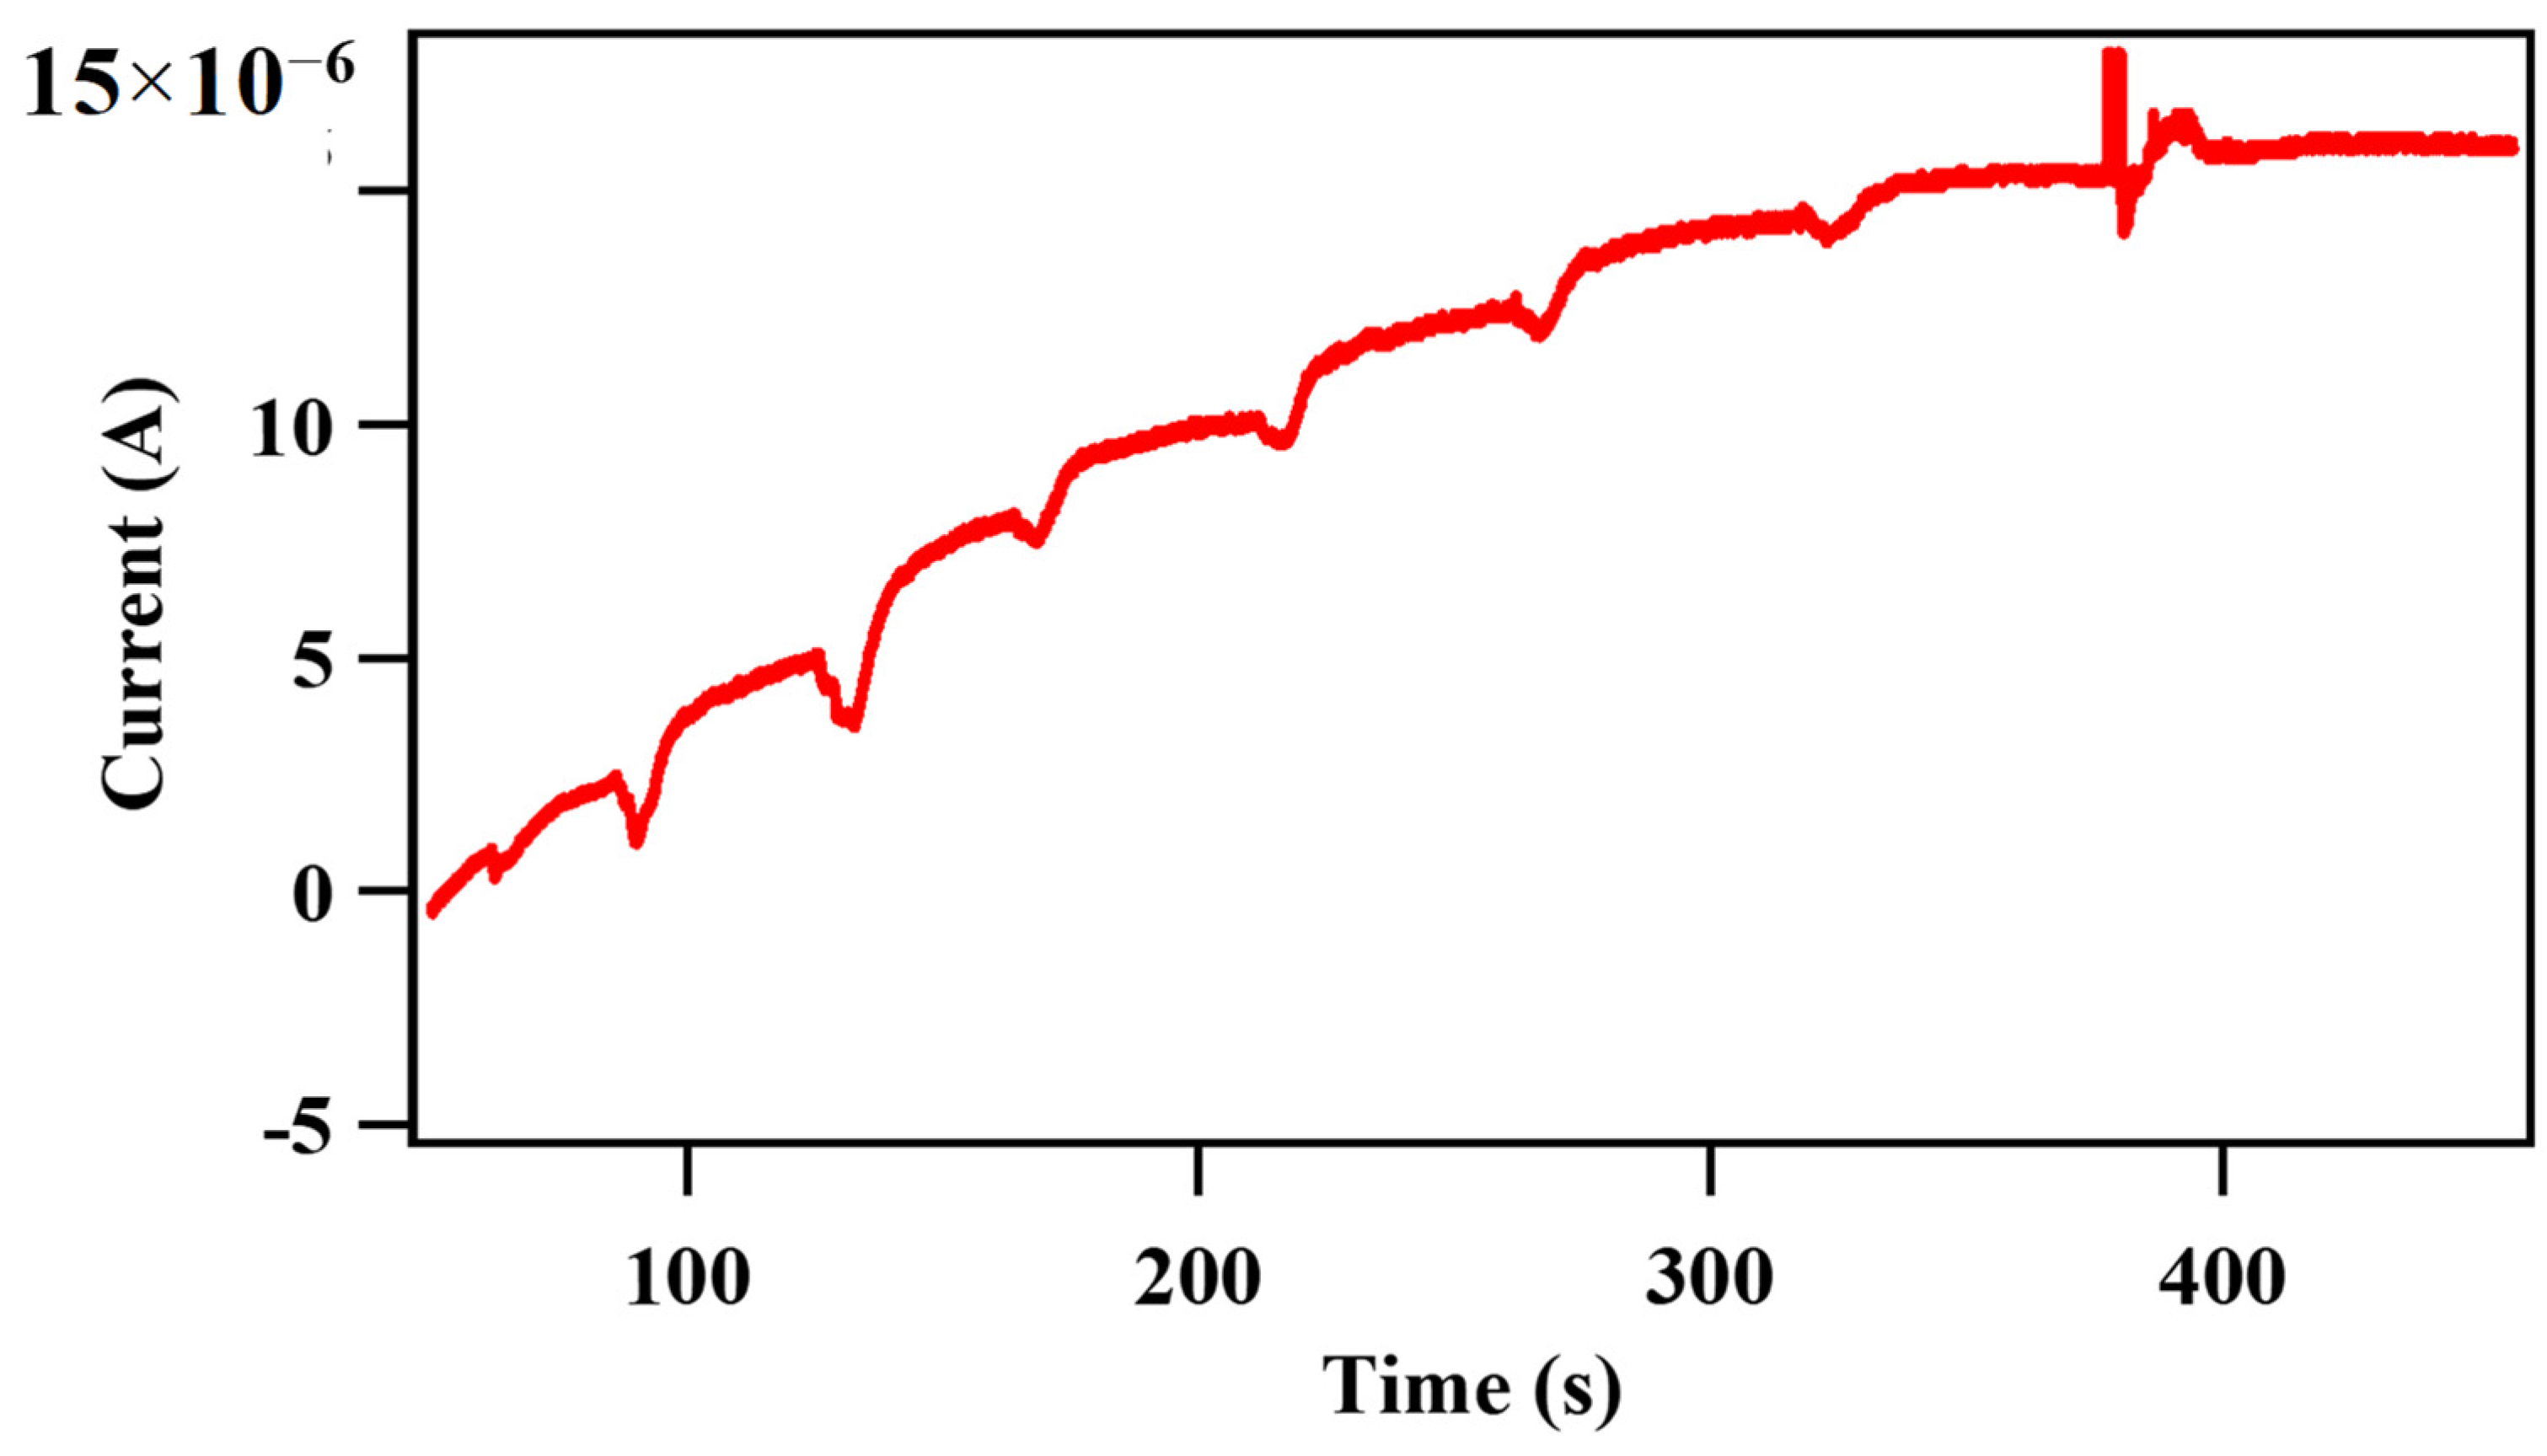
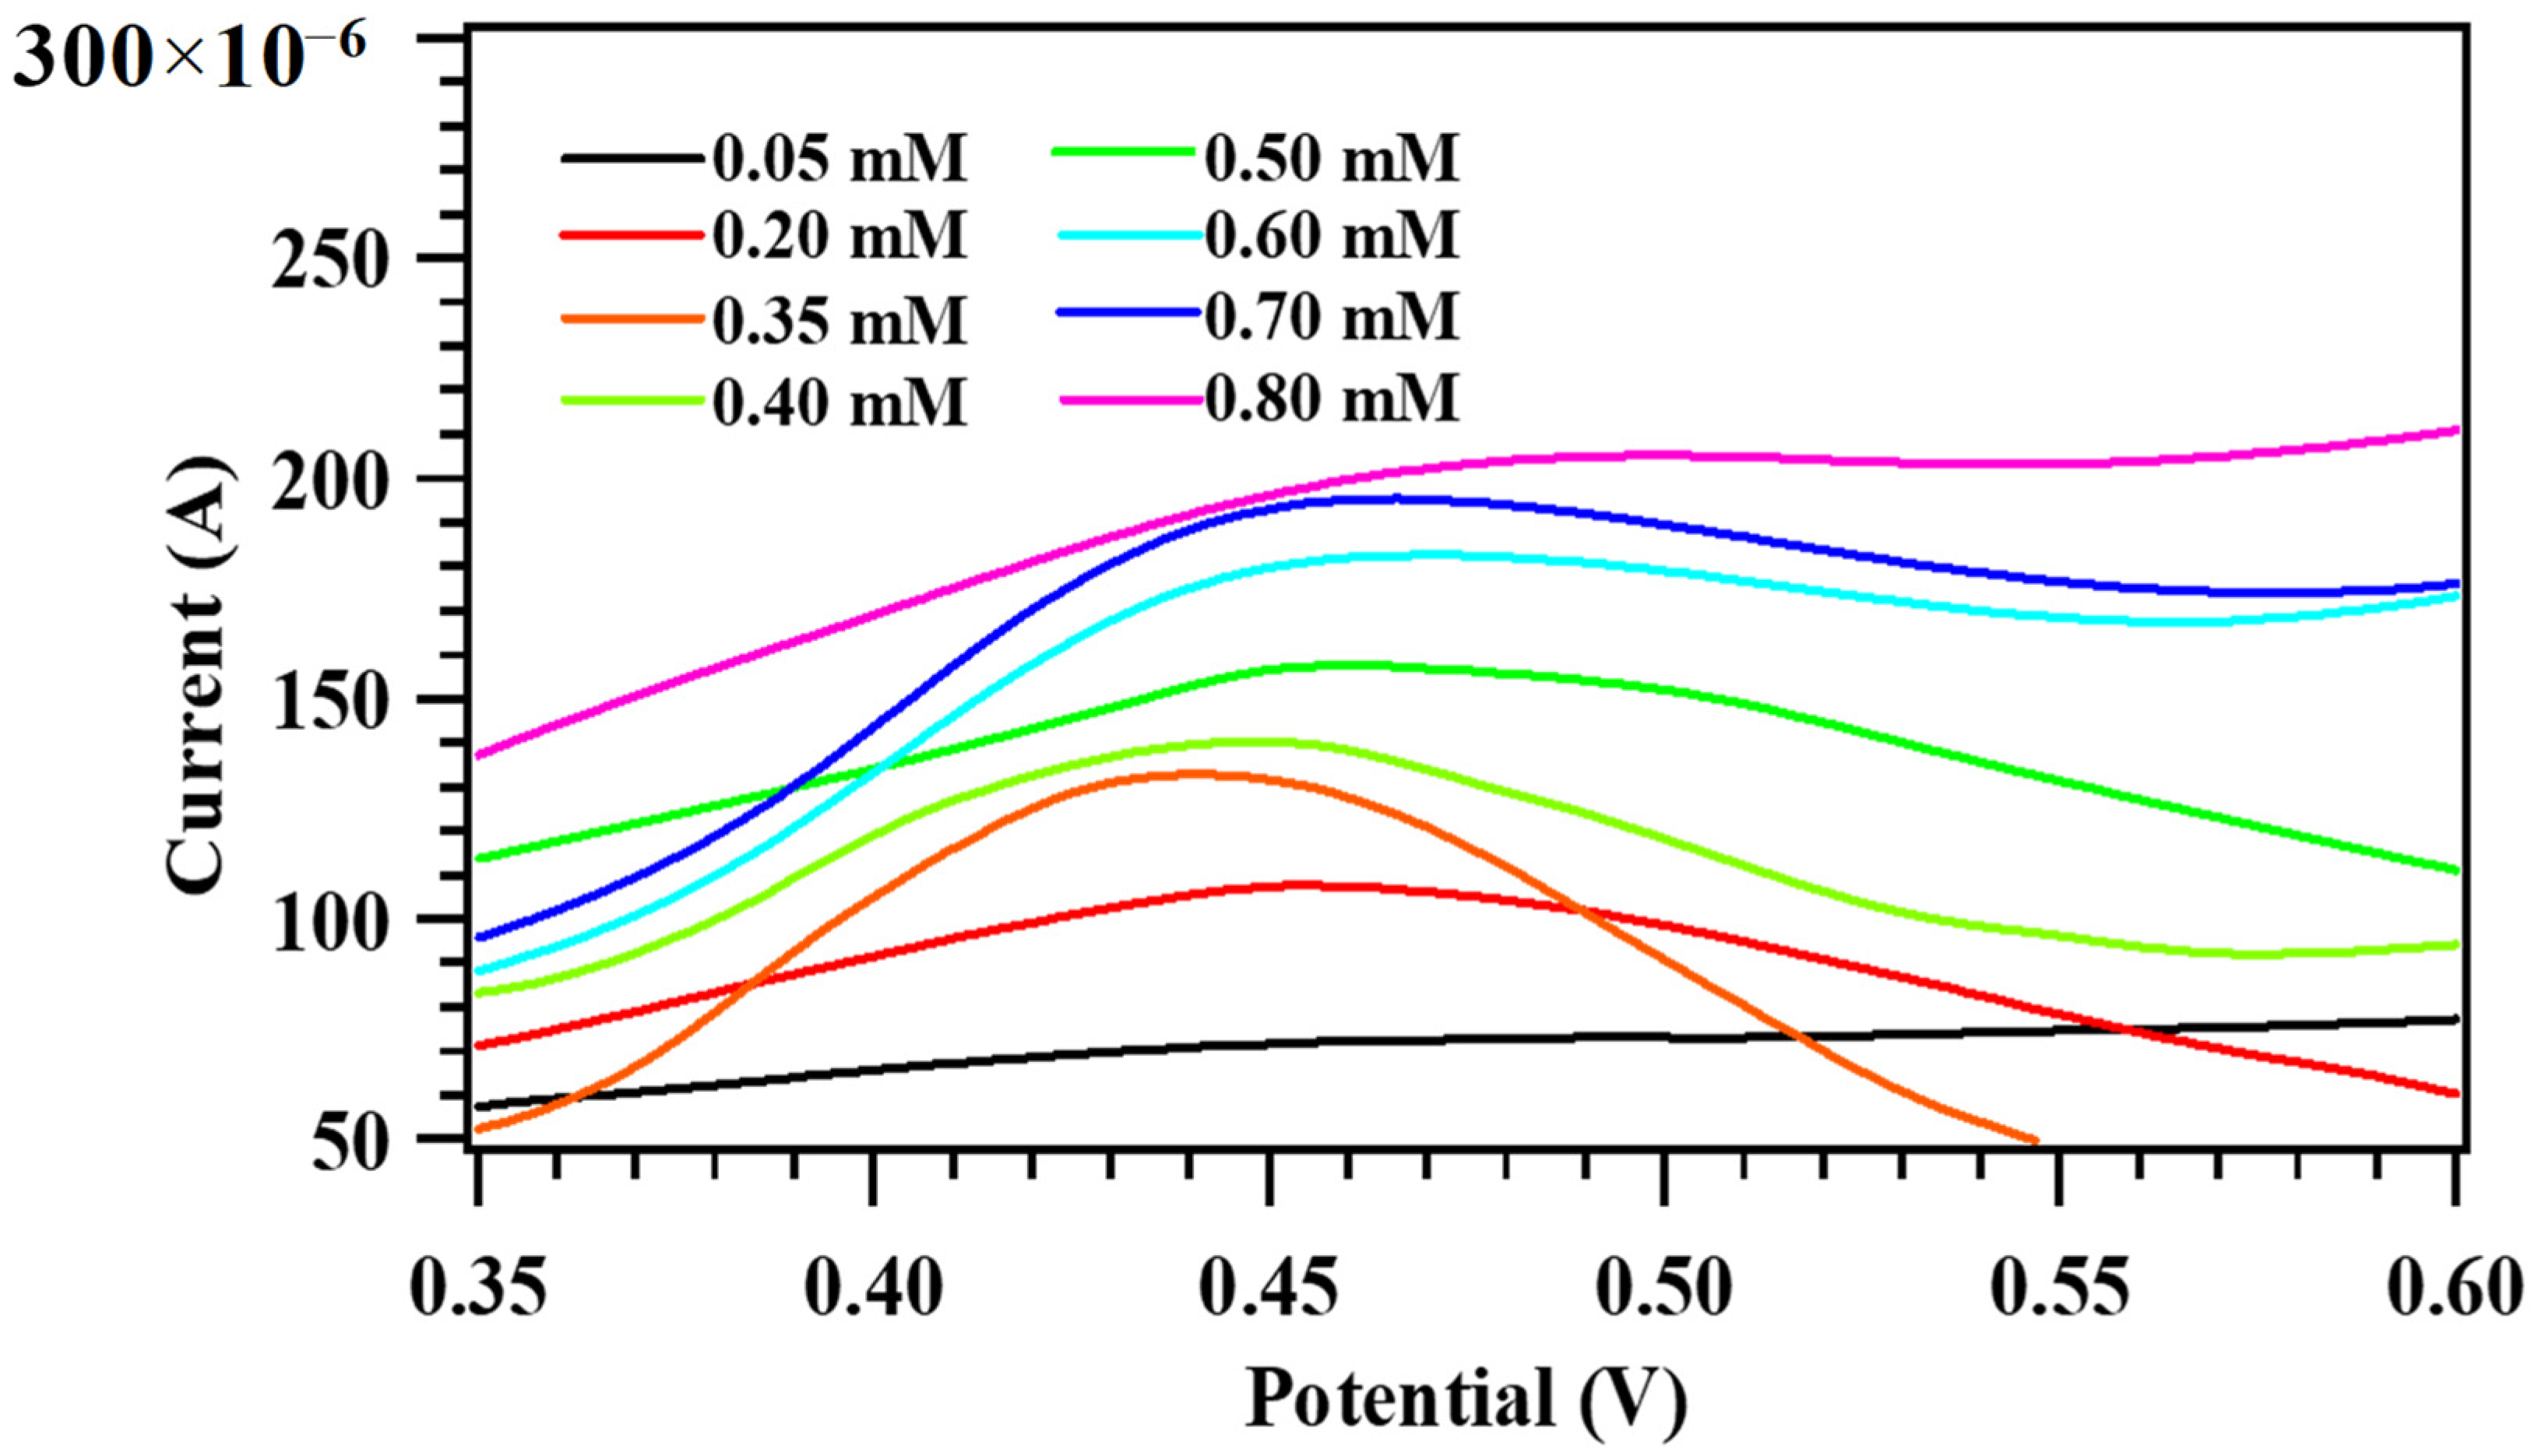
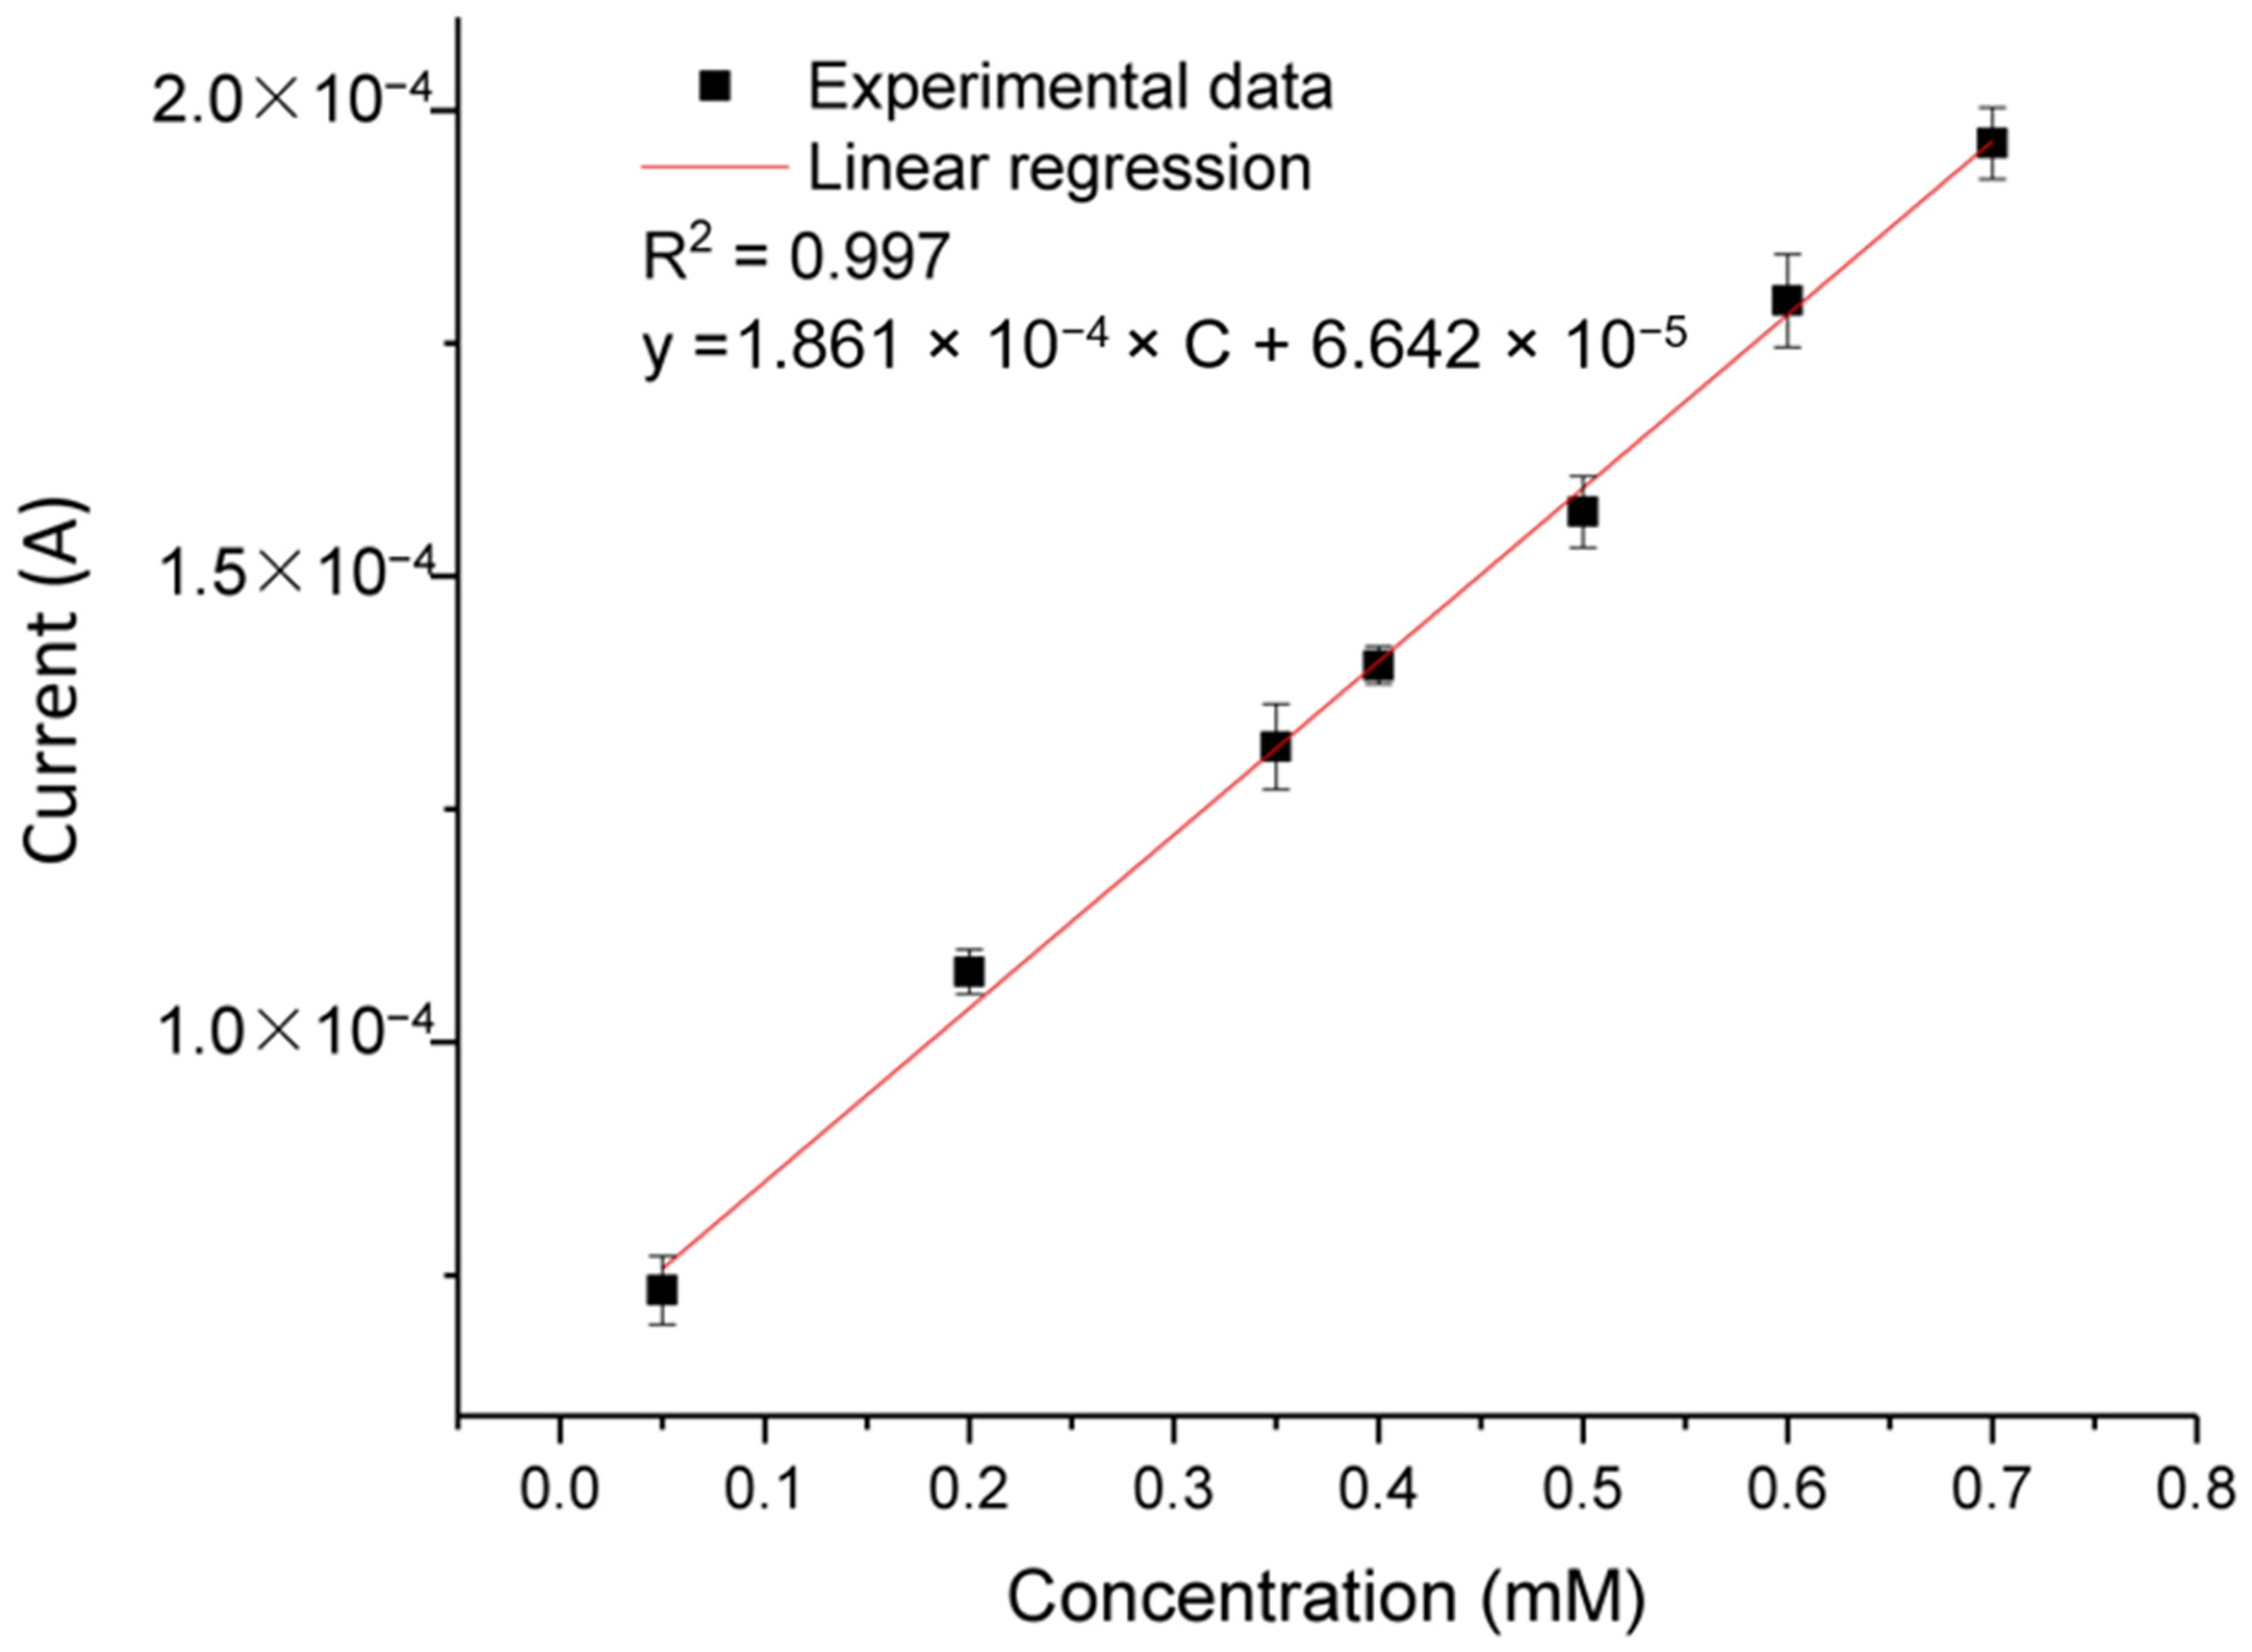
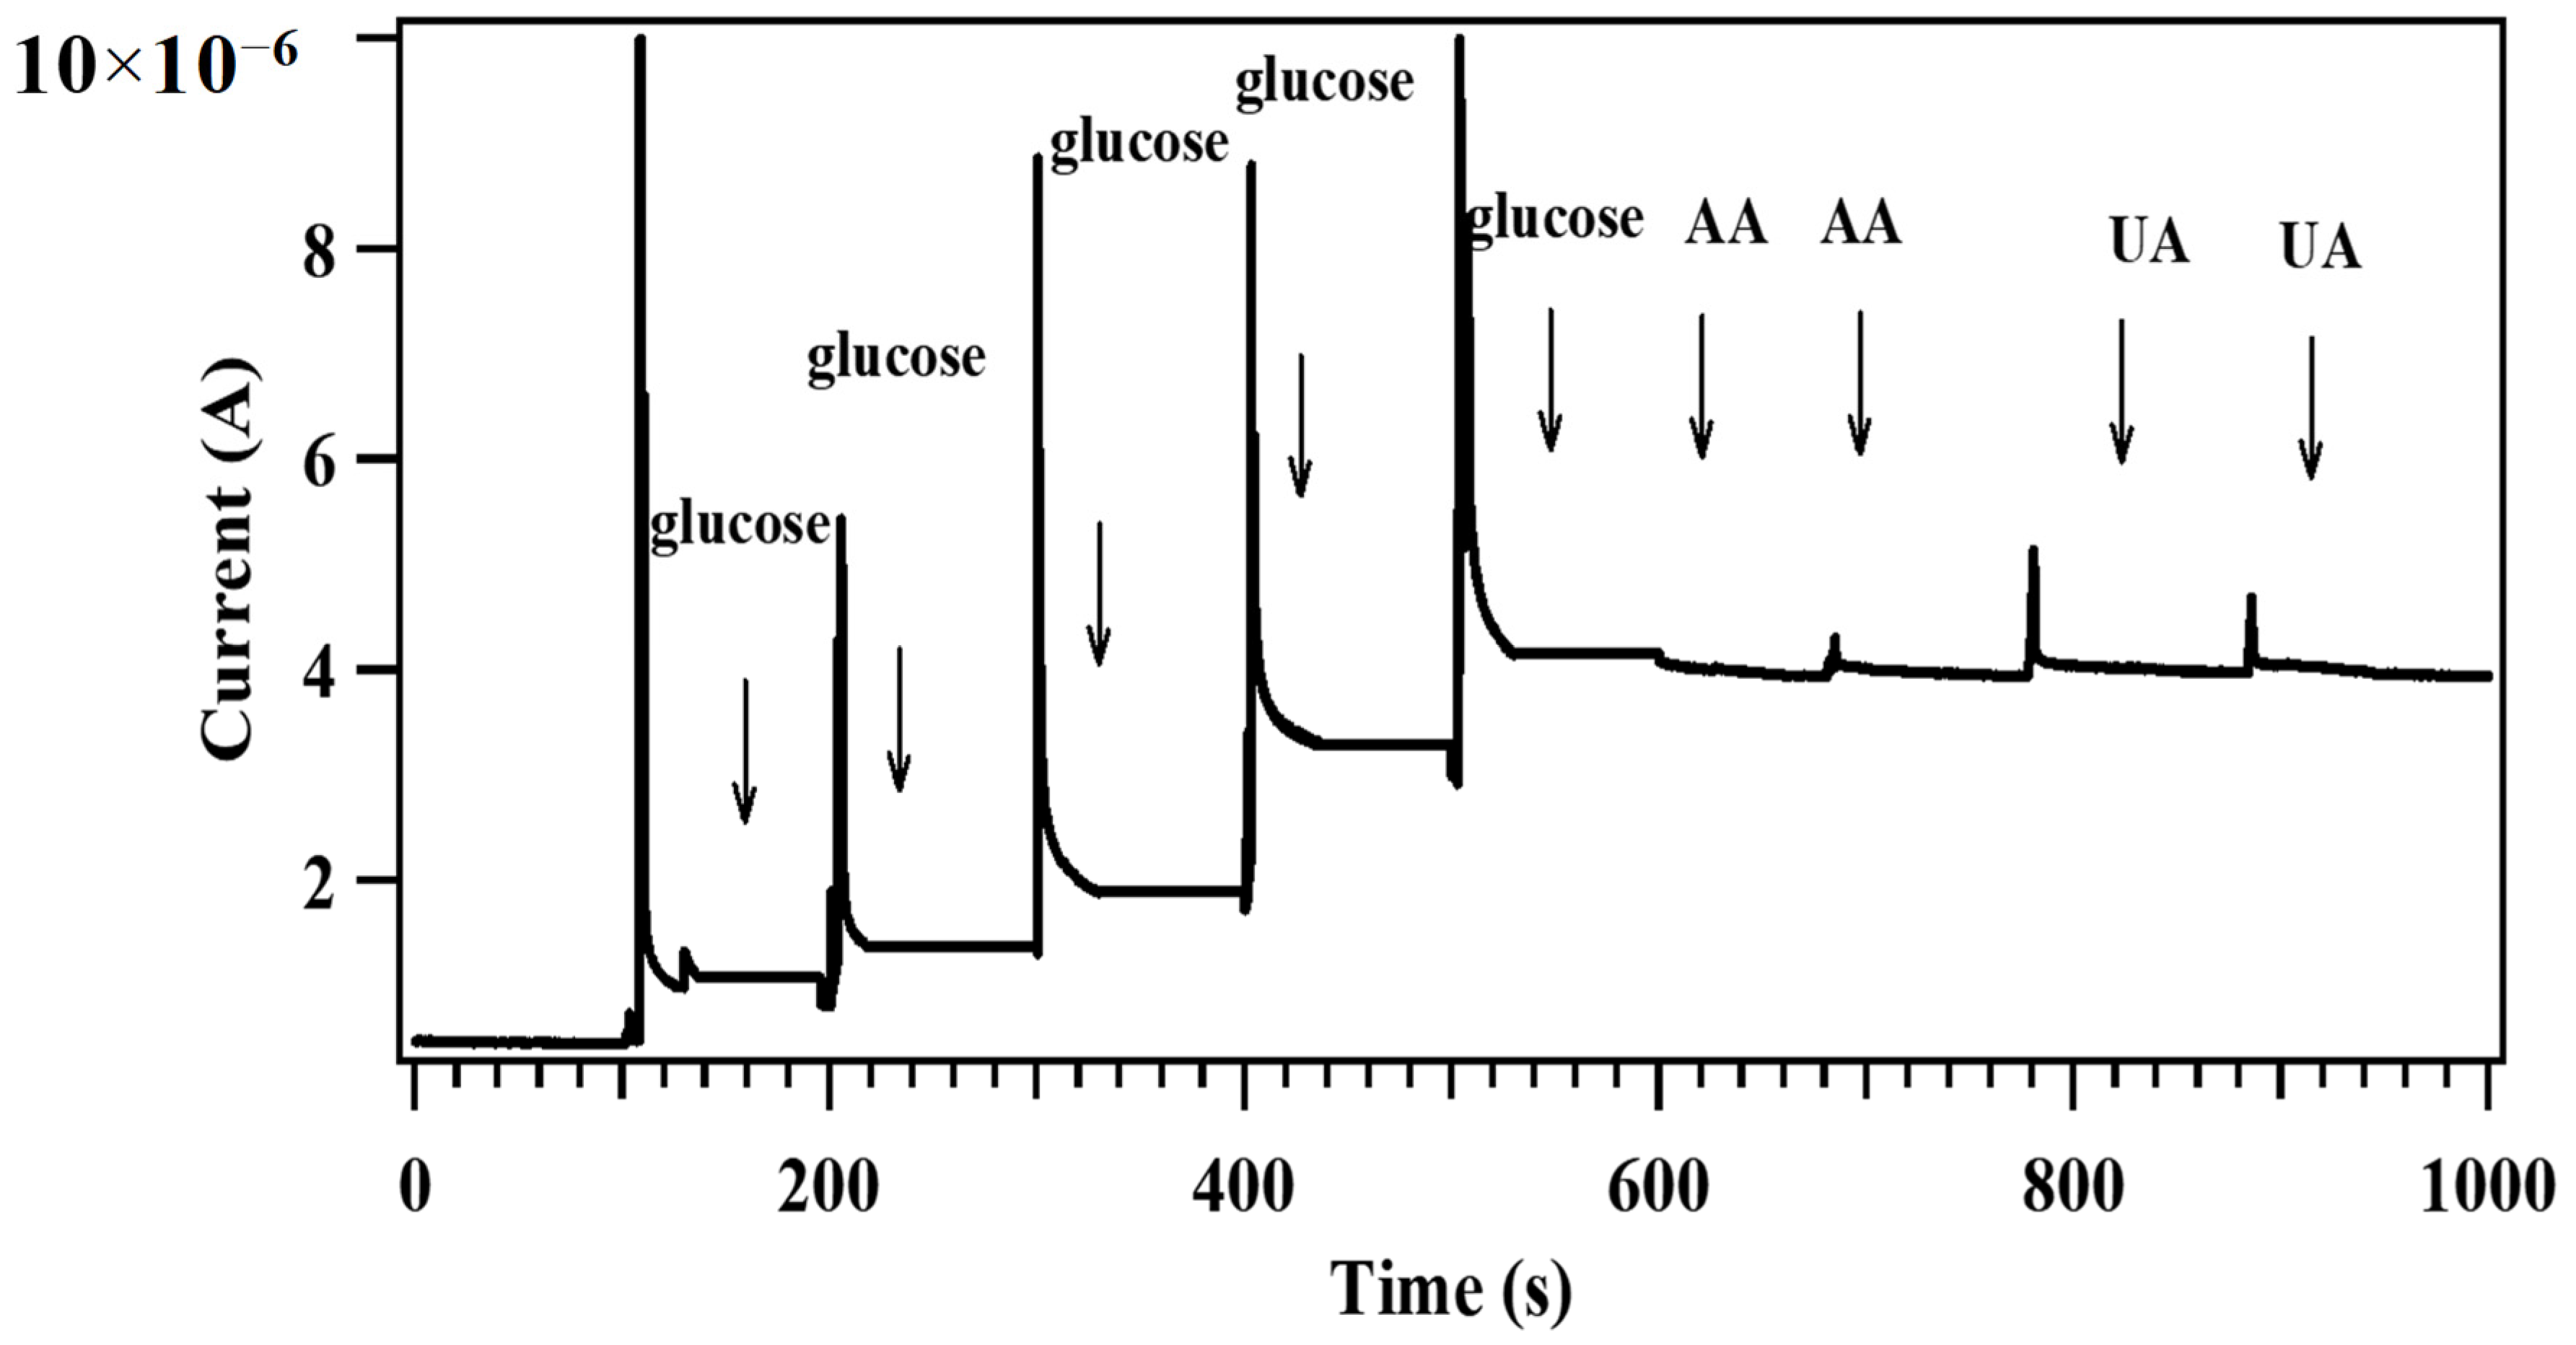
3.5.2. Electrochemical Detection of Glucose
4. Conclusions
Author Contributions
Funding
Institutional Review Board Statement
Informed Consent Statement
Data Availability Statement
Conflicts of Interest
References
- Liu, J.; Lang, Q.; Liang, B.; Zheng, Z.; Zhang, Y.; Liu, A. Sensitive Electrochemical Sequential Enzyme Biosensor for Glucose and Starch Based on Glucoamylase- and Glucose Oxidase-Controllably Co-Displayed Yeast Recombinant. Anal. Chim. Acta 2022, 1221, 340173. [Google Scholar] [CrossRef] [PubMed]
- Wang, Q.; Chen, M.; Xiong, C.; Zhu, X.; Chen, C.; Zhou, F.; Dong, Y.; Wang, Y.; Xu, J.; Li, Y.; et al. Dual Confinement of High–Loading Enzymes within Metal–Organic Frameworks for Glucose Sensor with Enhanced Cascade Biocatalysis. Biosens. Bioelectron. 2022, 196, 113695. [Google Scholar] [CrossRef] [PubMed]
- Güler, M.; Zengin, A.; Alay, M. Fabrication of Glucose Bioelectrochemical Sensor Based on Au@Pd Core-Shell Supported by Carboxylated Graphene Oxide. Anal. Biochem. 2023, 667, 115091. [Google Scholar] [CrossRef] [PubMed]
- Bal Altuntaş, D.; Kuralay, F. MoS2/Chitosan/GOx-Gelatin Modified Graphite Surface: Preparation, Characterization and Its Use for Glucose Determination. Mater. Sci. Eng. B 2021, 270, 115215. [Google Scholar] [CrossRef]
- Li, B.; Wu, X.; Shi, C.; Dai, Y.; Zhang, J.; Liu, W.; Wu, C.; Zhang, Y.; Huang, X.; Zeng, W. Flexible Enzymatic Biosensor Based on Graphene Sponge for Glucose Detection in Human Sweat. Surf. Interfaces 2023, 36, 102525. [Google Scholar] [CrossRef]
- Chavez-Urbiola, I.R.; Reséndiz-Jaramillo, A.Y.; Willars-Rodriguez, F.J.; Martinez-Saucedo, G.; Arriaga, L.G.; Alcantar-Peña, J.; Escalona-Villalpando, R.A.; Ledesma-García, J. Glucose Biosensor Based on a Flexible Au/ZnO Film to Enhance the Glucose Oxidase Catalytic Response. J. Electroanal. Chem. 2022, 926, 116941. [Google Scholar] [CrossRef]
- Hassan, M.H.; Vyas, C.; Grieve, B.; Bartolo, P. Recent Advances in Enzymatic and Non-Enzymatic Electrochemical Glucose Sensing. Sensors 2021, 21, 4672. [Google Scholar] [CrossRef]
- Hwang, D.-W.; Lee, S.; Seo, M.; Chung, T.D. Recent Advances in Electrochemical Non-Enzymatic Glucose Sensors—A Review. Anal. Chim. Acta 2018, 1033, 1–34. [Google Scholar] [CrossRef]
- Lu, X.; Zheng, D.; Zhang, P.; Liang, C.; Liu, P.; Tong, Y. Facile Synthesis of Free-Standing CeO2 Nanorods for Photoelectrochemical Applications. Chem. Commun. 2010, 46, 7721–7723. [Google Scholar] [CrossRef]
- Yin, D.; Zhao, F.; Zhang, L.; Zhang, X.; Liu, Y.; Zhang, T.; Wu, C.; Chen, D.; Chen, Z. Greatly Enhanced Photocatalytic Activity of Semiconductor CeO2 by Integrating with Upconversion Nanocrystals and Graphene. RSC Adv. 2016, 6, 103795–103802. [Google Scholar] [CrossRef]
- Patel, R.L.; Palaparty, S.A.; Liang, X. Ultrathin Conductive CeO2 Coating for Significant Improvement in Electrochemical Performance of LiMn1.5Ni0.5O4 Cathode Materials. J. Electrochem. Soc. 2017, 164, A6236–A6243. [Google Scholar] [CrossRef]
- Das, H.T.; Elango Balaji, T.; Dutta, S.; Das, N.; Das, P.; Mondal, A.; Imran, M. Recent Trend of CeO2-Based Nanocomposites Electrode in Supercapacitor: A Review on Energy Storage Applications. J. Energy Storage 2022, 50, 104643. [Google Scholar] [CrossRef]
- Muccillo, E.; Rocha, R.; Tadokoro, S.; Rey, J.; Muccillo, R.; Steil, M. Electrical Conductivity of CeO2 Prepared from Nanosized Powders. J. Electroceramics 2004, 13, 609–612. [Google Scholar] [CrossRef]
- Munirathnam, R.; Rumana Farheen, S.M.; Manjunatha, S.; Manjunatha, H.C.; Vidya, Y.S.; Sridhar, K.N.; Seenappa, L.; Veera Rethina Murugan, S.; Krishnaveni, S. Tulsi Mediated Green Synthesis of Zinc Doped CeO2 for Super Capacitor and Display Applications. J. Sci. Adv. Mater. Devices 2023, 8, 100551. [Google Scholar] [CrossRef]
- Dao, N.N.; Luu, M.D.; Nguyen, Q.K.; Kim, B.S. UV Absorption by Cerium Oxide Nanoparticles/Epoxy Composite Thin Films. Adv. Nat. Sci. Nanosci. Nanotechnol. 2011, 2, 045013. [Google Scholar] [CrossRef]
- Bao, B.; Sun, Y.; Li, X.; Li, L.; Yu, Y. Tuning the UV Absorbing Ability of CeO2 Nanoparticles with F—Doping. FlatChem 2023, 39, 100494. [Google Scholar] [CrossRef]
- Laubender, E.; Tanvir, N.B.; Yurchenko, O.; Urban, G. Nanocrystalline CeO2 as Room Temperature Sensing Material for CO2 in Low Power Work Function Sensors. Procedia Eng. 2015, 120, 1058–1062. [Google Scholar] [CrossRef]
- Renganathan, B.; Krishna Rao, S.; Ganesan, A.R.; Deepak, A. Investigating the Gas Sensing Potential in CeO2 Fiber Optic Sensor via Trivalent Gadolinium Ion Substitution at Room Temperature. Mater. Lett. 2022, 325, 132766. [Google Scholar] [CrossRef]
- Guan, P.; Li, Y.; Zhang, J.; Li, W. Non-Enzymatic Glucose Biosensor Based on CuO-Decorated CeO2 Nanoparticles. Nanomaterials 2016, 6, 159. [Google Scholar] [CrossRef]
- Nguyet, N.T.; Hai Yen, L.T.; Van Thu, V.; lan, H.; Trung, T.; Vuong, P.H.; Tam, P.D. Highly Sensitive DNA Sensors Based on Cerium Oxide Nanorods. J. Phys. Chem. Solids 2018, 115, 18–25. [Google Scholar] [CrossRef]
- Solanki, P.R.; Ali, M.A.; Kaushik, A.; Malhotra, B.D. Label-Free Capacitive Immunosensor Based on Nanostructured Cerium Oxide. Adv. Electrochem. 2014, 1, 92–97. [Google Scholar] [CrossRef]
- Tam, P.D.; Thang, C.X. Label-Free Electrochemical Immunosensor Based on Cerium Oxide Nanowires for Vibrio Cholerae O1 Detection. Mater. Sci. Eng. C 2016, 58, 953–959. [Google Scholar] [CrossRef] [PubMed]
- Nguyet, N.T.; Yen, L.T.H.; Doan, V.Y.; Hoang, N.L.; Van Thu, V.; Lan, H.; Trung, T.; Pham, V.H.; Tam, P.D. A Label-Free and Highly Sensitive DNA Biosensor Based on the Core-Shell Structured CeO2-NR@Ppy Nanocomposite for Salmonella Detection. Mater. Sci. Eng. C 2019, 96, 790–797. [Google Scholar] [CrossRef] [PubMed]
- Yang, X.; Yu, X.; Li, G. The Effects of Nd Doping on the Morphology and Optical Properties of CeO2 Nanorods. J. Mater. Sci. Mater. Electron. 2016, 27, 9704–9709. [Google Scholar] [CrossRef]
- Li, G.; Lu, X.; Zhao, W.; Su, C.; Tong, Y. Controllable electrochemical synthesis of Ce4+-doped ZnO nanostructures from nanotubes to nanorods and nanocages. Cryst. Growth Des. 2008, 8, 1276–1281. [Google Scholar] [CrossRef]
- Lu, X.; Zheng, D.; Gan, J.; Liu, Z.; Liang, C. Porous CeO2 Nanowires/Nanowire Arrays: Electrochemical Synthesis and Application in Water Treatment. J. Mater. Chem. 2010, 20, 7118–7122. [Google Scholar] [CrossRef]
- Zhang, C.; Zhang, X.; Wang, Y.; Xie, S.; Liu, Y. Facile Electrochemical Synthesis of CeO2 Hierarchical Nanorods and Nanowires with Excellent Photocatalytic Activities. New J. Chem. 2014, 28, 2581–2586. [Google Scholar] [CrossRef]
- Ho, P.H.; Ambrosetti, M.; Groppi, G.; Tronconi, E.; Fornasari, G.; Vaccari, A.; Benito, P. Electrodeposition of CeO2 and Pd-CeO2 on Small Pore Size Metallic Foams: Selection of Deposition Parameters. Catal. Today 2019, 334, 37–47. [Google Scholar] [CrossRef]
- Feng, Z.; Ren, Q.; Peng, R.; Mo, S.; Zhang, M.; Fu, M.; Chen, L.; Ye, D. Effect of CeO2 Morphologies on Toluene Catalytic Combustion. Catal. Today 2019, 332, 177–182. [Google Scholar] [CrossRef]
- Nguyet, N.T.; Trung, T.; Lan, H.; Van Thu, V.; Vuong, P.H.; Tam, P.D. Direct Synthesis of CeO2 Nanospindles on Gold Electrode by Electrochemical Method. Vietnam J. Chem. 2019, 57, 57–63. [Google Scholar] [CrossRef]
- Bard, A.J.; Faulkner, L.R.; White, H.S. Electrochemical Methods: Fundamentals and Applications; John Wiley & Sons: Hoboken, NJ, USA, 2022; ISBN 1119334063. [Google Scholar]
- Pradhan, D.; Reddy, R.G. Mechanistic Study of Al Electrodeposition from EMIC-AlCl3 and BMIC-AlCl3 Electrolytes at Low Temperature. Mater. Chem. Phys. 2014, 143, 564–569. [Google Scholar] [CrossRef]
- Wang, Q. Anodic Electrochemical Synthesis and Characterization of Nanocrystalline Cerium Oxide and Cerium Oxide/Montmorillonite Nanocomposites. Ph.D. Dissertation, University of North Texas, Denton, TX, USA, 2014. [Google Scholar]
- Sabari Arul, N.; Mangalaraj, D.; Kim, T.W.; Chen, P.C.; Ponpandian, N.; Meena, P.; Masuda, Y. Synthesis of CeO2 Nanorods with Improved Photocatalytic Activity: Comparison between Precipitation and Hydrothermal Process. J. Mater. Sci. Mater. Electron. 2013, 24, 1644–1650. [Google Scholar] [CrossRef]
- Kumar, A.M.; Babu, R.S.; Ramakrishna, S.; de Barros, A.L.F. Electrochemical Synthesis and Surface Protection of Polypyrrole-CeO2 Nanocomposite Coatings on AA2024 Alloy. Synth. Met. 2017, 234, 18–28. [Google Scholar] [CrossRef]
- Dinh Van, T.; Dang Thi Thuy, N.; Dao Vu Phuong, T.; Nguyen Thi, N.; Nguyen Thi, T.; Nguyen Phuong, T.; Vu Van, T.; Vuong-Pham, H.; Phuong Dinh, T. High-Performance Nonenzymatic Electrochemical Glucose Biosensor Based on AgNP-Decorated MoS2 Microflowers. Curr. Appl. Phys. 2022, 43, 116–123. [Google Scholar] [CrossRef]


Disclaimer/Publisher’s Note: The statements, opinions and data contained in all publications are solely those of the individual author(s) and contributor(s) and not of MDPI and/or the editor(s). MDPI and/or the editor(s) disclaim responsibility for any injury to people or property resulting from any ideas, methods, instructions or products referred to in the content. |
© 2023 by the authors. Licensee MDPI, Basel, Switzerland. This article is an open access article distributed under the terms and conditions of the Creative Commons Attribution (CC BY) license (https://creativecommons.org/licenses/by/4.0/).
Share and Cite
Nguyet, N.T.; Tuan, C.V.; Ngan, D.T.T.; Tam, P.D.; Nguyen, V.D.; Nghia, N.T. Electrodeposited Fabrication of CeO2 Branched-like Nanostructure Used for Nonenzymatic Glucose Biosensor. Crystals 2023, 13, 1315. https://doi.org/10.3390/cryst13091315
Nguyet NT, Tuan CV, Ngan DTT, Tam PD, Nguyen VD, Nghia NT. Electrodeposited Fabrication of CeO2 Branched-like Nanostructure Used for Nonenzymatic Glucose Biosensor. Crystals. 2023; 13(9):1315. https://doi.org/10.3390/cryst13091315
Chicago/Turabian StyleNguyet, Nguyen Thi, Chu Van Tuan, Dang Thi Thuy Ngan, Phuong Dinh Tam, Vinh Dinh Nguyen, and Nguyen Trong Nghia. 2023. "Electrodeposited Fabrication of CeO2 Branched-like Nanostructure Used for Nonenzymatic Glucose Biosensor" Crystals 13, no. 9: 1315. https://doi.org/10.3390/cryst13091315