Article

Numerical Simulation and Process Study on Laser Shock Peening of 1Cr18Ni9Ti Material

1
Fundamentals Department, Air Force Engineering University, Xi’an 710051, China
2
School of Aircraft Engineering, Nanchang Hangkong University, Nanchang 330063, China
*
Author to whom correspondence should be addressed.
Crystals 2023, 13(8), 1279; https://doi.org/10.3390/cryst13081279
Submission received: 27 July 2023 / Revised: 14 August 2023 / Accepted: 15 August 2023 / Published: 19 August 2023

Abstract

:
This article mainly studies the improvement of the properties of the 1Cr18Ni9Ti material after laser shock peening. The 1Cr18Ni9Ti material is the main material used to make aviation ducts, and improving the fatigue life of aviation ducts can significantly improve the safety performance of aviation engines. The article combines simulation and experiment to study the improvement effect of laser shock peening on the material’s properties. The main results are as follows: The fatigue test showed that, under the same stress load, laser shock peening can greatly extend the fatigue life of the specimen, with the 3J process having the best effect. EBSD analysis showed that the 3J process has the best grain refinement effect. The X-ray diffraction method proved that the measurement results of residual compressive stress under the 3J process are optimal. Overall, it is shown that the properties of the 1Cr18Ni9Ti material can be greatly improved under the 3J process.

1. Introduction

Aero engines play an important role in the military industry, and there are many welding links in the manufacturing process. Once parts are damaged, it is difficult to achieve the original performance of the material by maintenance and repair welding [1]. Aviation conduits, known as the blood vessels of aircraft, are an important part of the aircraft’s control system, with important roles such as transferring pressure, delivering fuel, and protecting electrical cables. While aviation conduits rely mainly on welding for connection, the strength of welded conduit joints is low, coupled with the poor working environment of aviation engines, so aviation conduits are prone to rupture during operation, which has great safety hazards for the operation of aviation engines.
Welding is the main form of joining modern steel. Its advantages are that the member section is not weakened, the assembly plate can be omitted, the structure is simple, the steel is saved, the manufacturing and processing are convenient, and the sealing performance is good. However, the local temperature at the joint of the weldment is higher; the forming quality of the heat-affected zone material is poor; the cooling is fast; the heat-affected zone shrinks unevenly, which easily results in residual stress in the welding seam, residual deformation of the welding seam, and even cracks, resulting in brittle fracture. Laser shock peening (LSP) has been developed rapidly in the field of welding due to its advantages such as no introduction of foreign medium, flexible laser transmission, good surface condition after strengthening and a deeper residual compressive stress layer. Logesh [2] and Leo [3] conducted research on weld strengthening and found that laser shock peening can effectively enhance the weld strength values. Chattopadhyay [4], Feng [5], and Shi [6] found that laser shock peening enhances the fatigue limit of the welding of different materials.
The principle of laser shock peening is illustrated in Figure 1 below. An absorbent protective layer is covered on the surface of the material, which acts on the surface of the material using high-power-density (greater than 1 GW/cm2) and short pulses (nanosecond order) of laser light. The absorbent protective layer is capable of rapidly absorbing the laser energy, producing an explosive vaporization reaction, and forming a plasma at a high temperature (about 104 K) and a high pressure (greater than 1 GPa), which ejects into the surface of the metal under the confinement layer, thus inducing intense high-pressure shock stress waves. When a high-pressure impact stress wave propagates into a material’s interior, a plastic deformation layer forms on the material if its peak pressure is between the dynamic yield strength and the tensile strength of the material. The high-density dislocations and surface residual compressive stresses in this plastic layer are combined to improve the mechanical properties of the material [7]. Compared to the typical shot-peening procedure, the residual compressive stress layer that is generated has a significant depth and has little influence on the surface roughness [8,9,10]. The greater the roughness, the more significant the decrease in the fatigue life is [11]. Many experts in this field have also confirmed that laser shock peening improves the fatigue limit of various different materials [12,13,14,15].

2. Materials and Methods

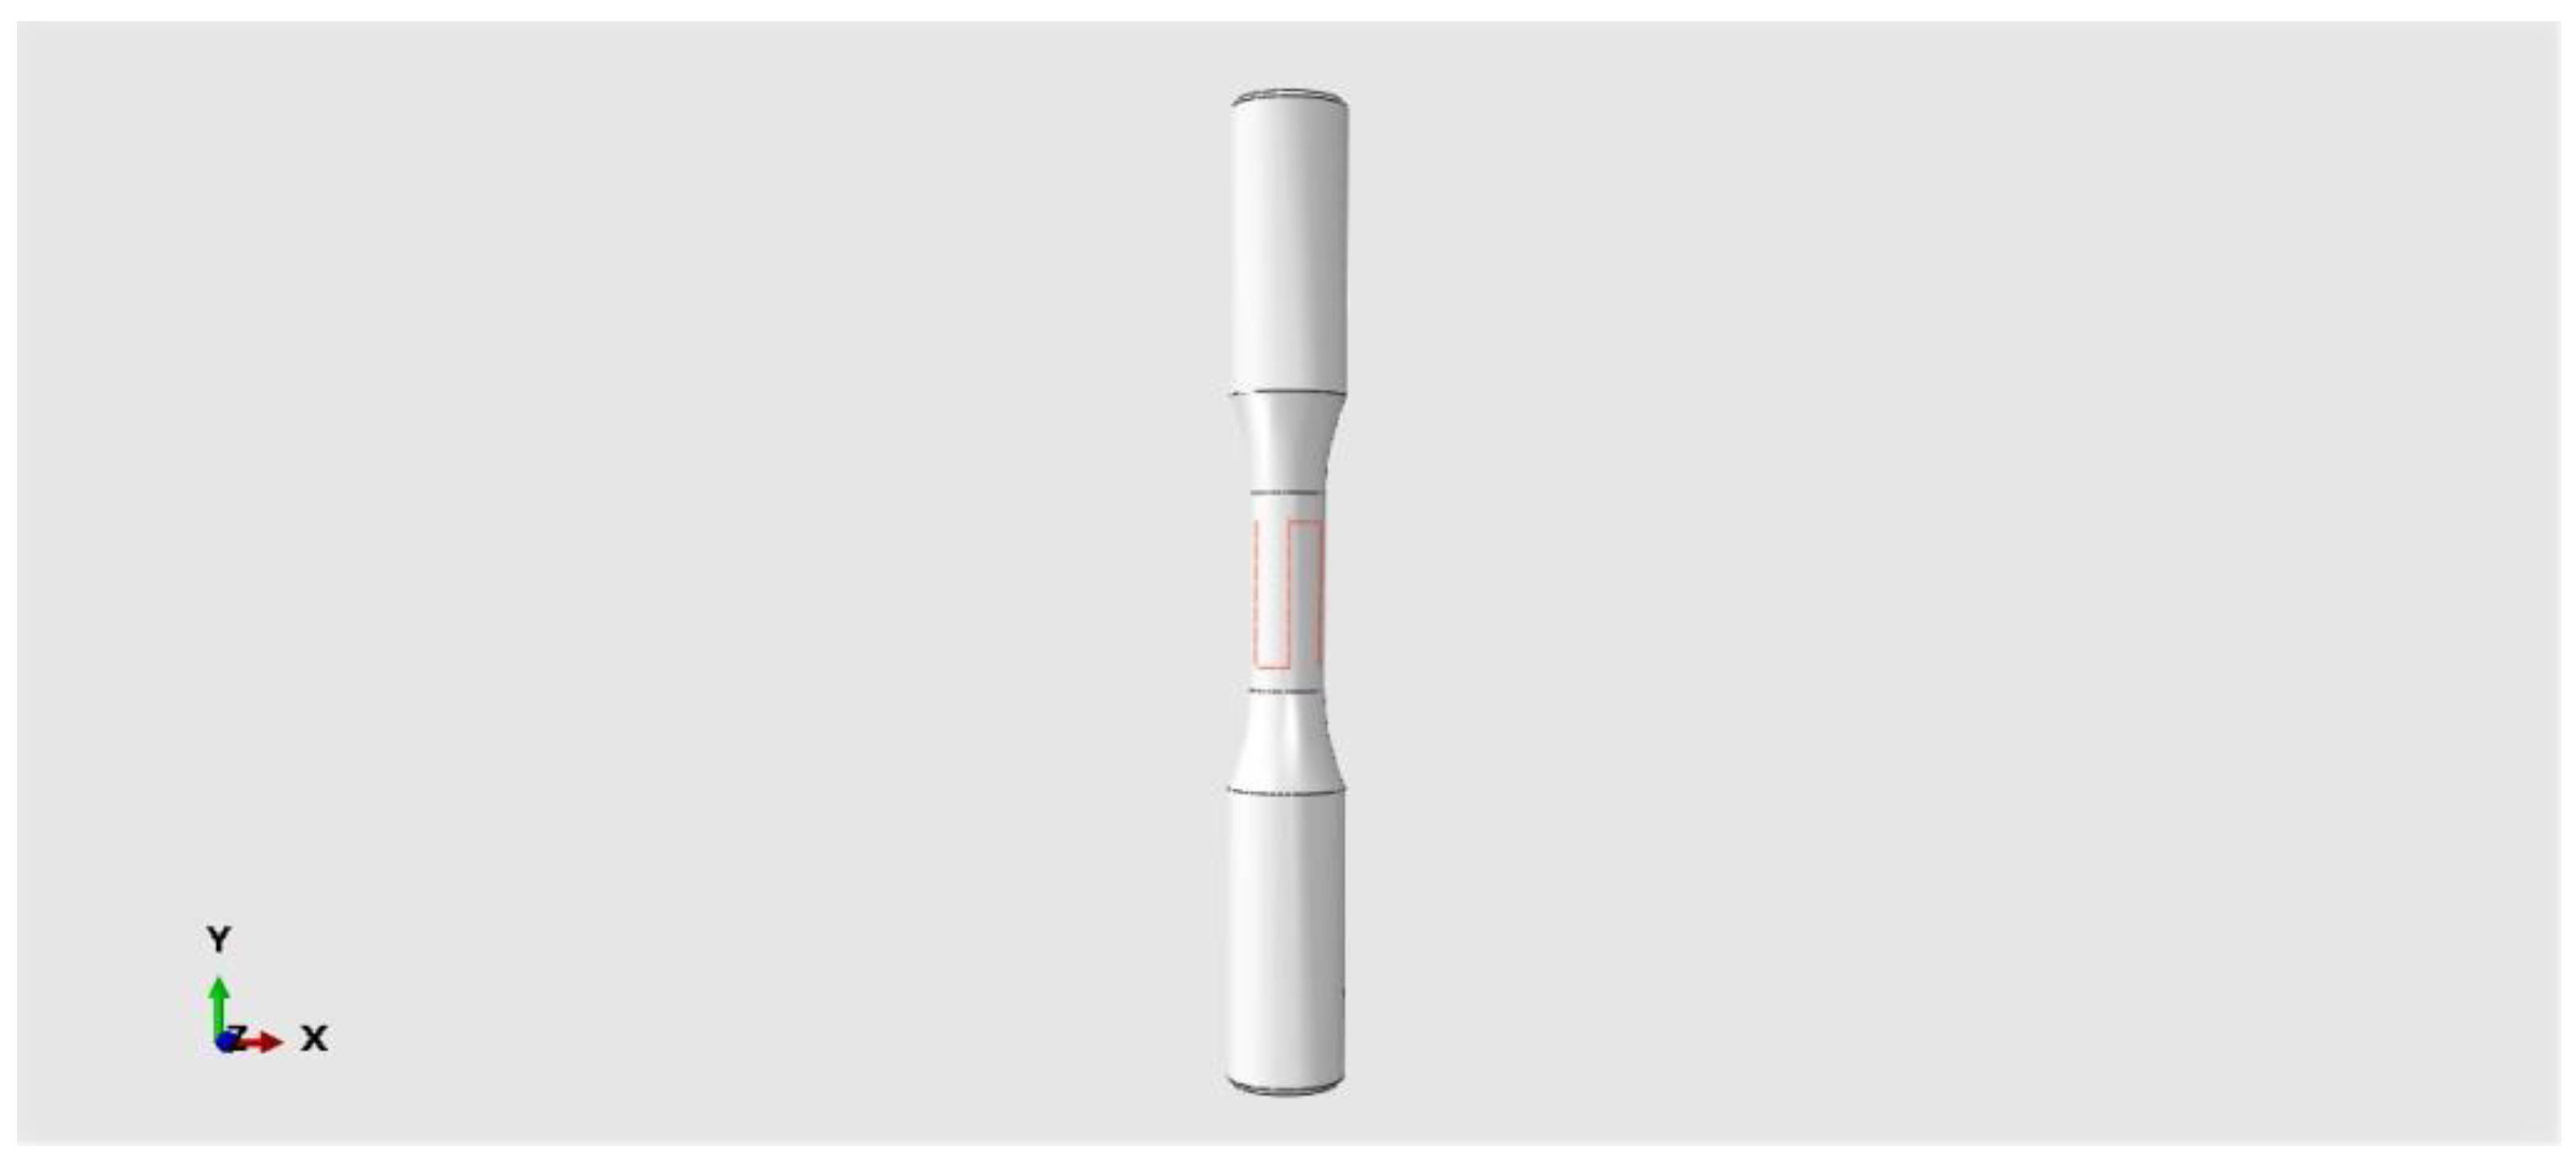
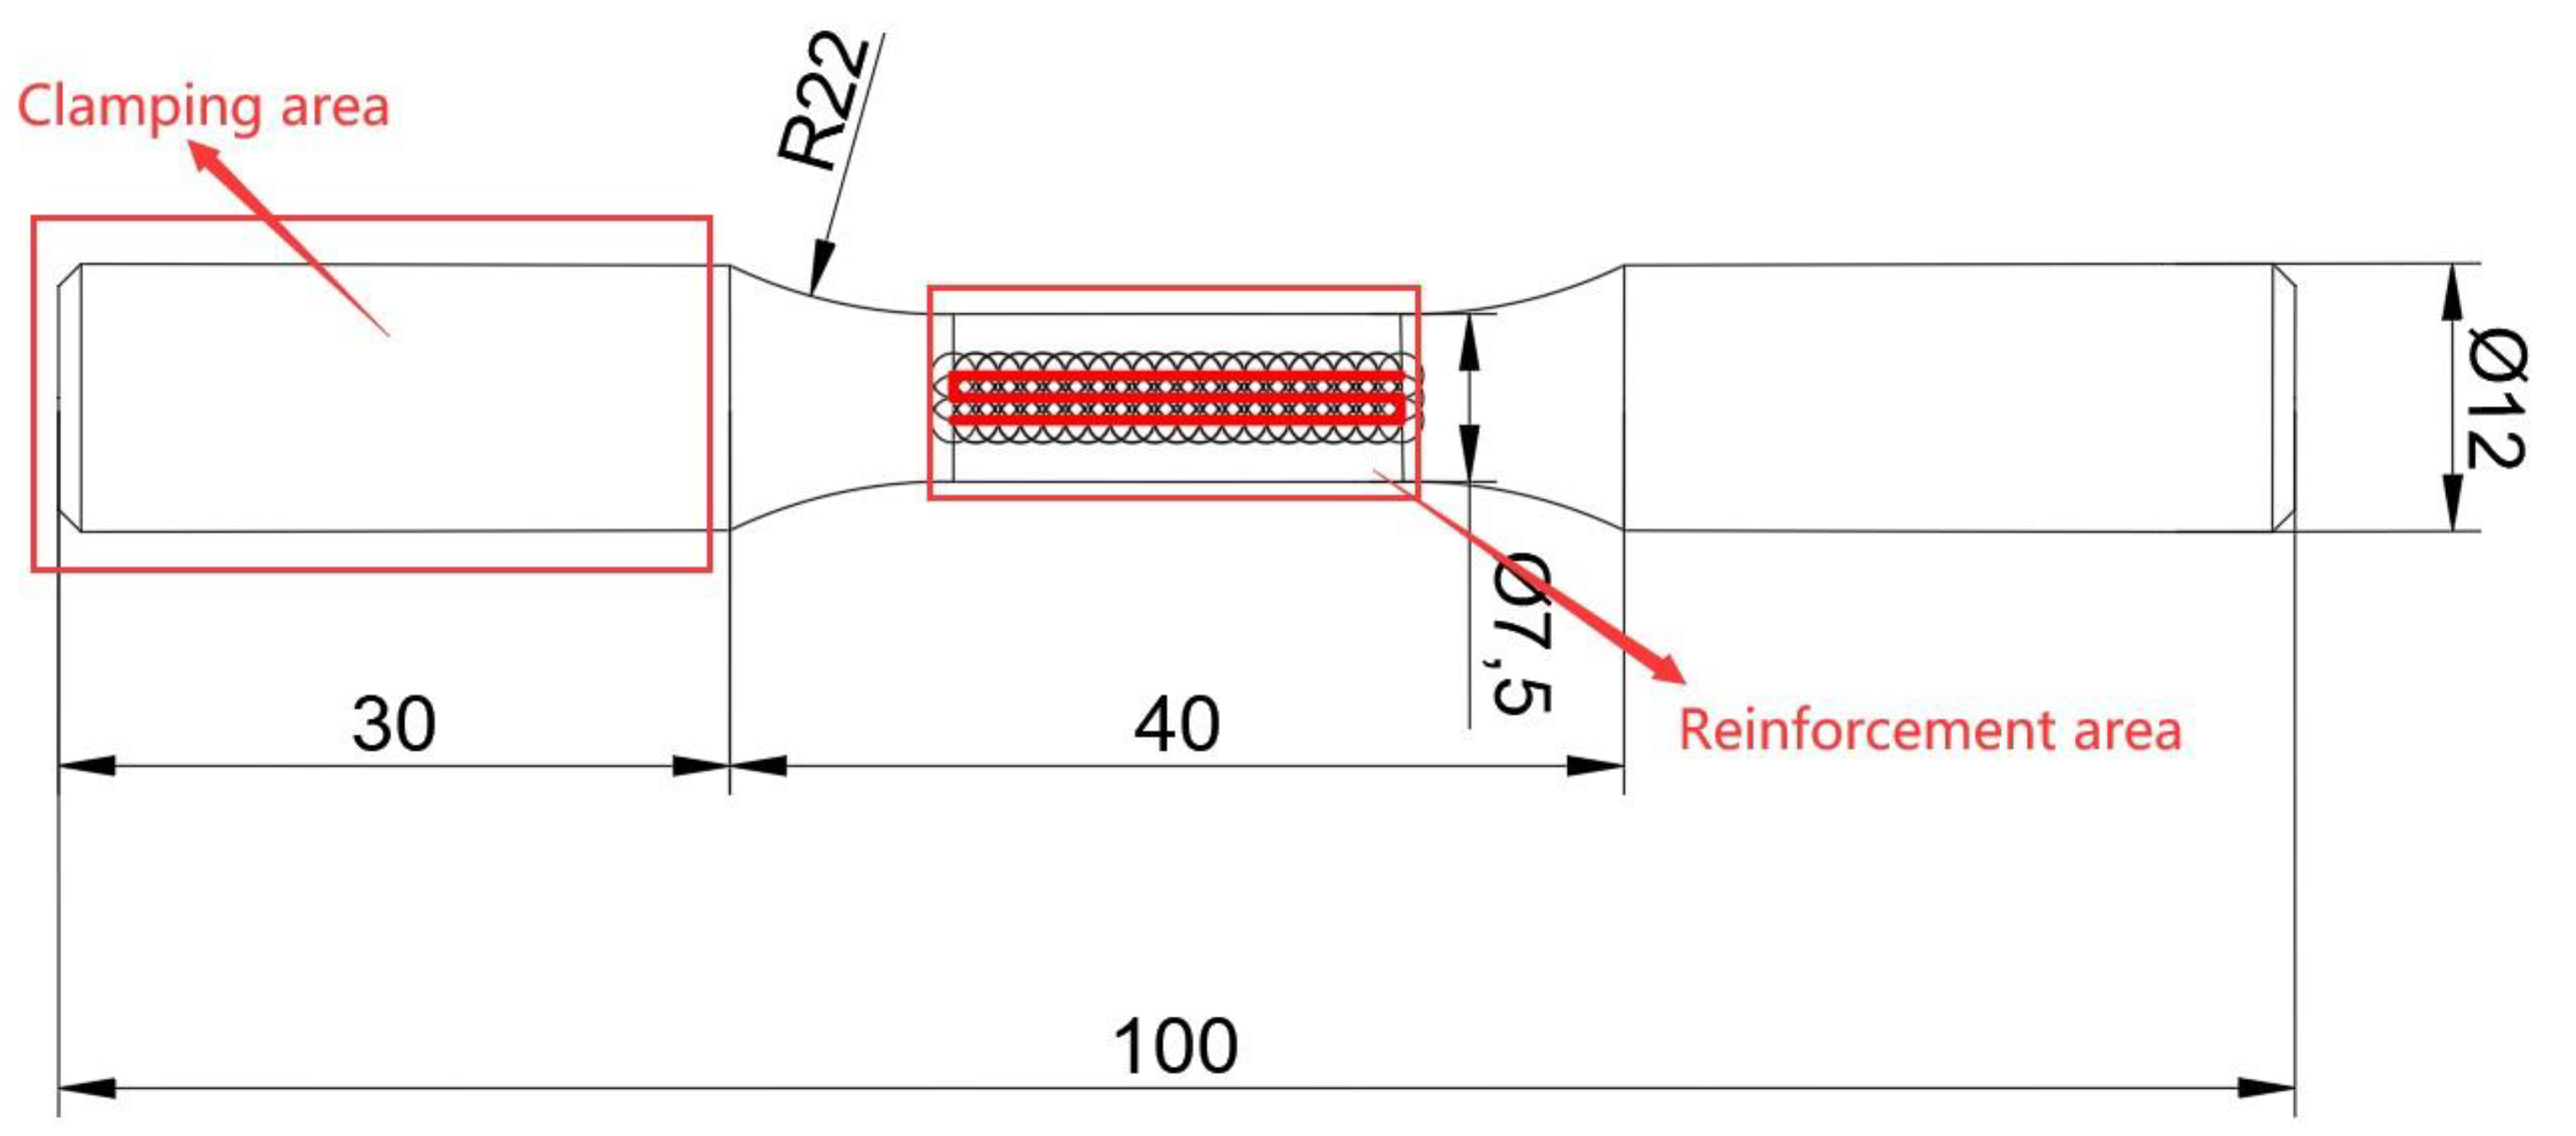
2.1. Simulation Analysis of Impact Strengthening of Fatigue Test Article

Due to the extremely short nanosecond action time of the laser shock, the action process of the shock wave cannot be observed by conventional experimental means. The complete process of shock wave action can be simulated by the finite element method, so finite element simulation is an effective means to study the laser shock processing parameters. Modelling in this article refers to the standard GBT4337-2015 for fatigue testing of metallic materials. The selected dimensions are shown in Figure 2, and the established model is shown in Figure 3 (in mm).
A large number of constituent models have been proposed to describe the dynamic response processes of materials, such as the power-law (PL) [16] model, Steinberg–Guinan (SG) [17] model, Zerilli–Armstrong (ZA) [18] model, Johnson–Cook (JC) [19] model, etc. In the Johnson–Cook model, the strain, strain rate, and temperature are taken into account, so the JC model was chosen for the simulation, which is also the parameter model that is being used in the field of laser shock peening at home and abroad.
σ = A + B ε n 1 + C ln ( ε ˙ * ) 1 ( T * ) m
where A is the yield strength of the material; B is the working hardening modulus; N is the coefficient of hardening; C reflects the strain rate hardening effect of the material; ε is the plastic strain; ε ˙ * is the dimensionless plastic strain rate; T*= (TT0)/(Tm T0) is the dimensionless temperature; T0 is room temperature; Tm is the melting point of the material; and m reflects the temperature-weakening effect of the material. The material JC model parameters are shown in Table 1 [20].

2.1.1. Grid and Boundary Conditions Setting

The grid uses a hexahedral grid with a size of 0.2 mm × 0.2 mm, a total number of grids of 305,694. To better relate simulations to experiments, the boundary settings are consistent with experimental processing. Figure 4 shows the boundary settings. Arrows indicate the direction of laser impact; the red area of the specimen represents the laser strengthened area; the orange part represents the clamping area of the specimen, which is represented by multiple points for easy identification and viewing. Figure 5 shows the impact path of the S type.

2.1.2. Laser Parameter Selection

Normal stress at the yield of the material under one-dimensional strain impact compression σ x is the Hugoniot elastic limit, denoted as σ H E L [21].
σ x = σ H E L = K ε H E L + 2 3 Y 0 = K + 4 3 G ε H E L
where Y0 is the Tresca yield stress of the material, K is the bulk modulus, and G is the shear modulus. The modulus of elasticity and Poisson’s ratio of a material are as follows:
K = λ + 2 3 μ = E 3 1 2 ν
G = μ = E 2 1 + ν
The following formula is then obtained:
σ H E L = K 2 G + 2 3 Y 0
According to the shock wave peak pressure P, the material Hugoniot elastic limit σ H E L gives the amount of plastic deformation on the surface of metal parts strengthened by laser shock [22]:
ε P = 2 σ H E L 3 λ + 2 μ P σ H E L 1
As shown in Figure 6, when P < σ H E L , there is only elastic deformation; when σ H E L < P < 2 σ H E L , plastic deformation occurs, accompanied by elastic recovery, which increases linearly with the impact peak pressure P; when 2 σ H E L   < P < 2.5 σ H E L , plastic deformation is saturated, reaching and maintaining a maximum of −2 σ H E L /(3 λ + 2 μ ); when P > 2.5 σ H E L , the residual compressive stress on the metal surface is somewhat reduced due to the surface unloading wave. Therefore, the theoretical optimal peak pressure for laser shock peening should be taken as P = 2~2.5 σ H E L .

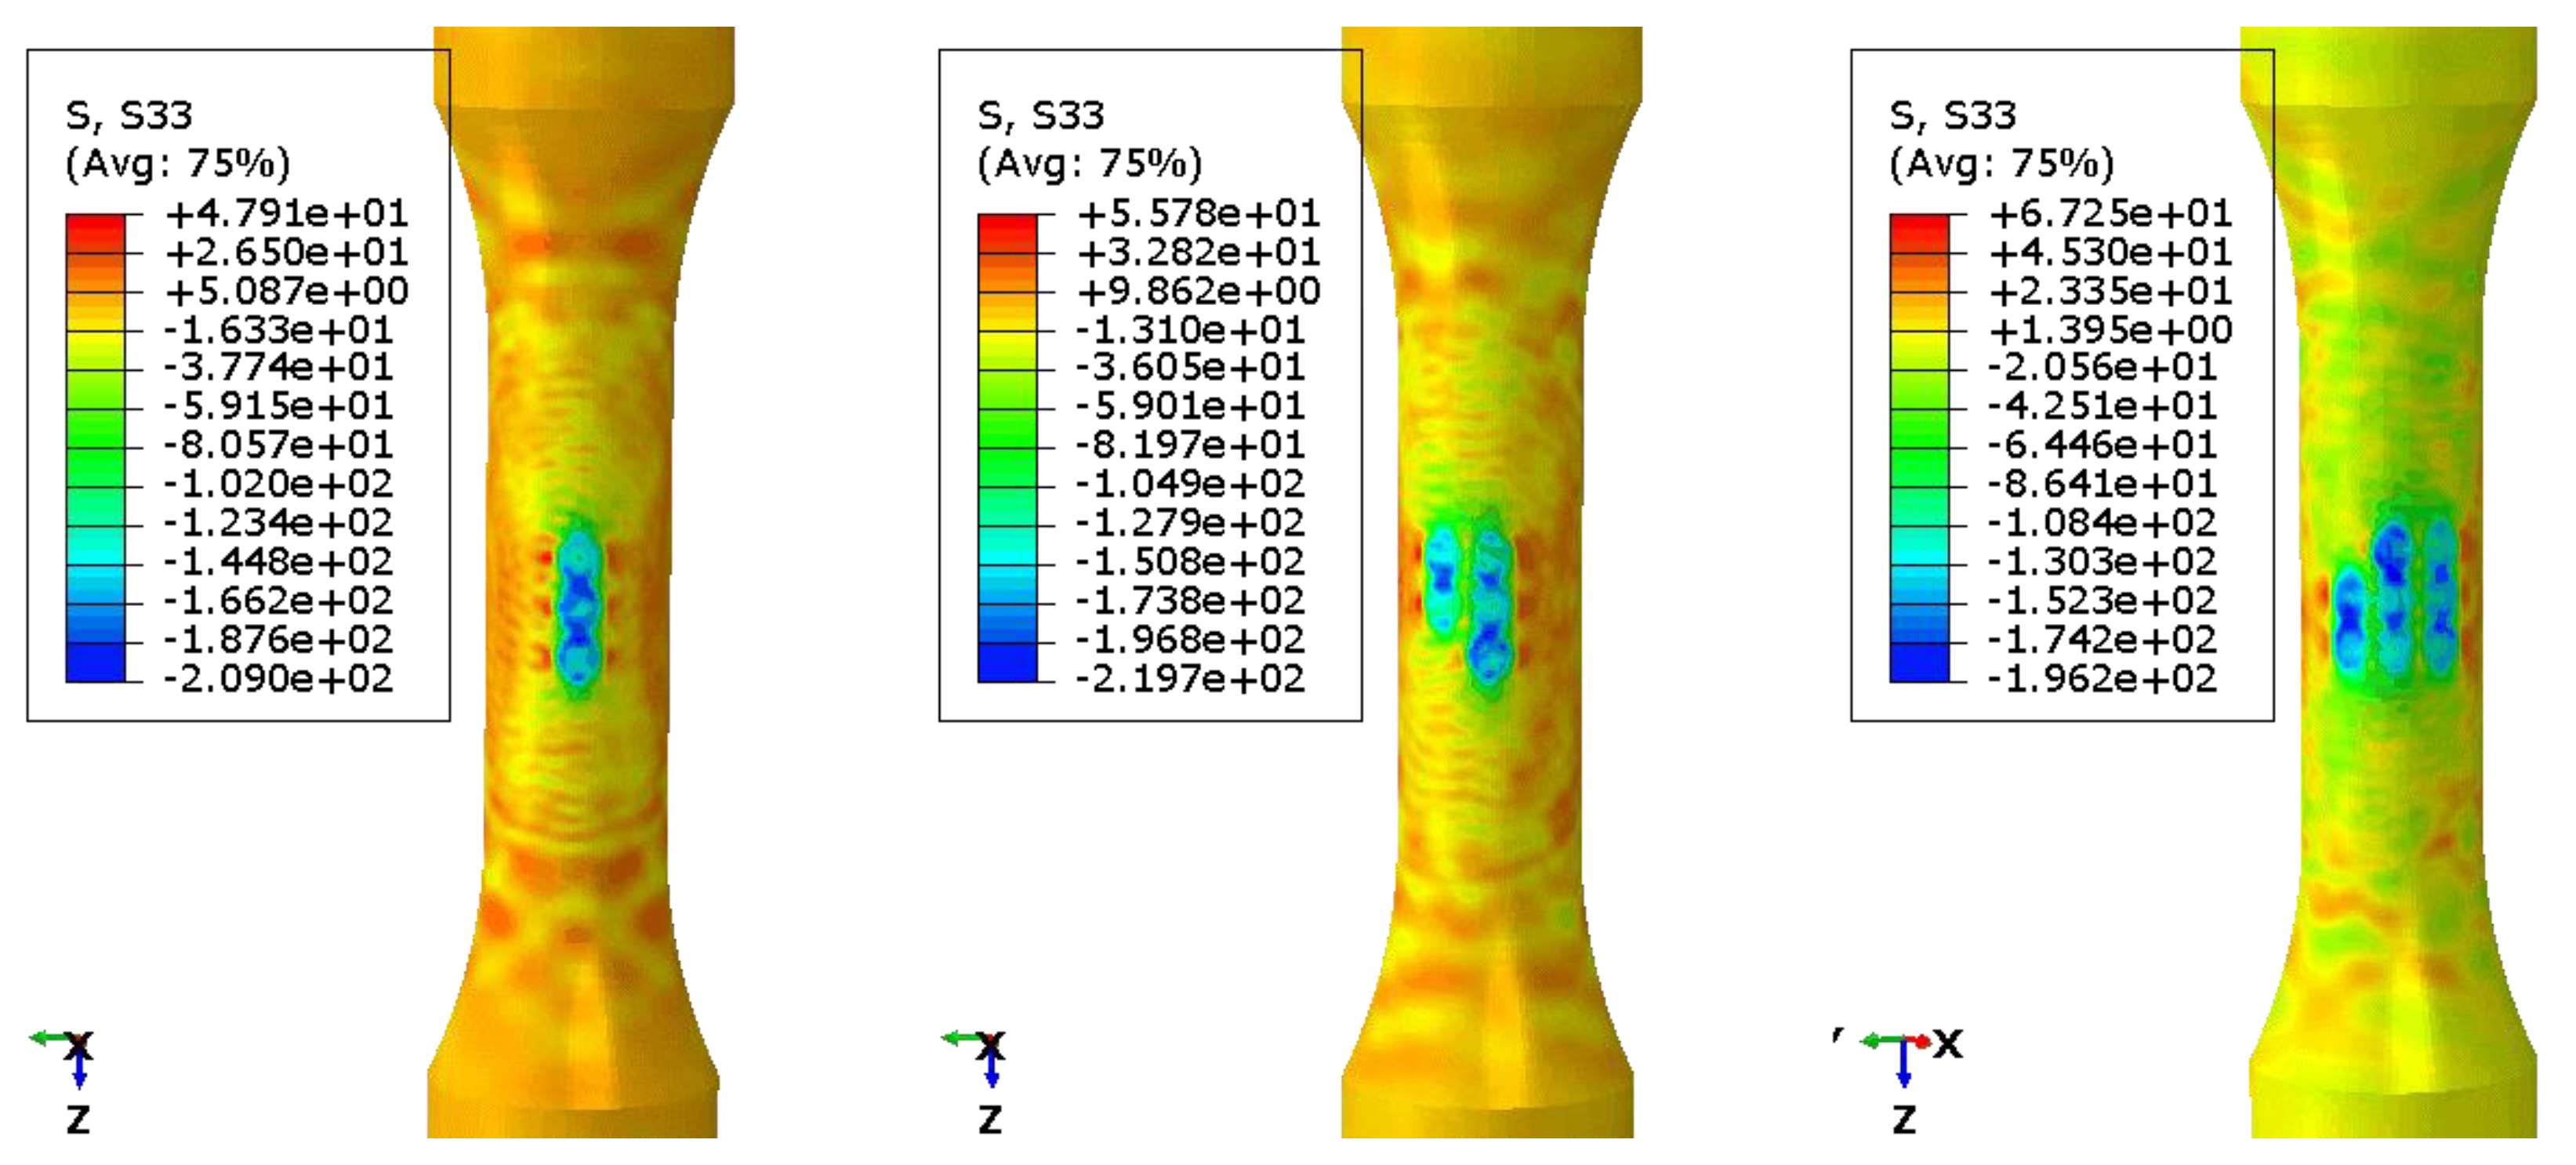
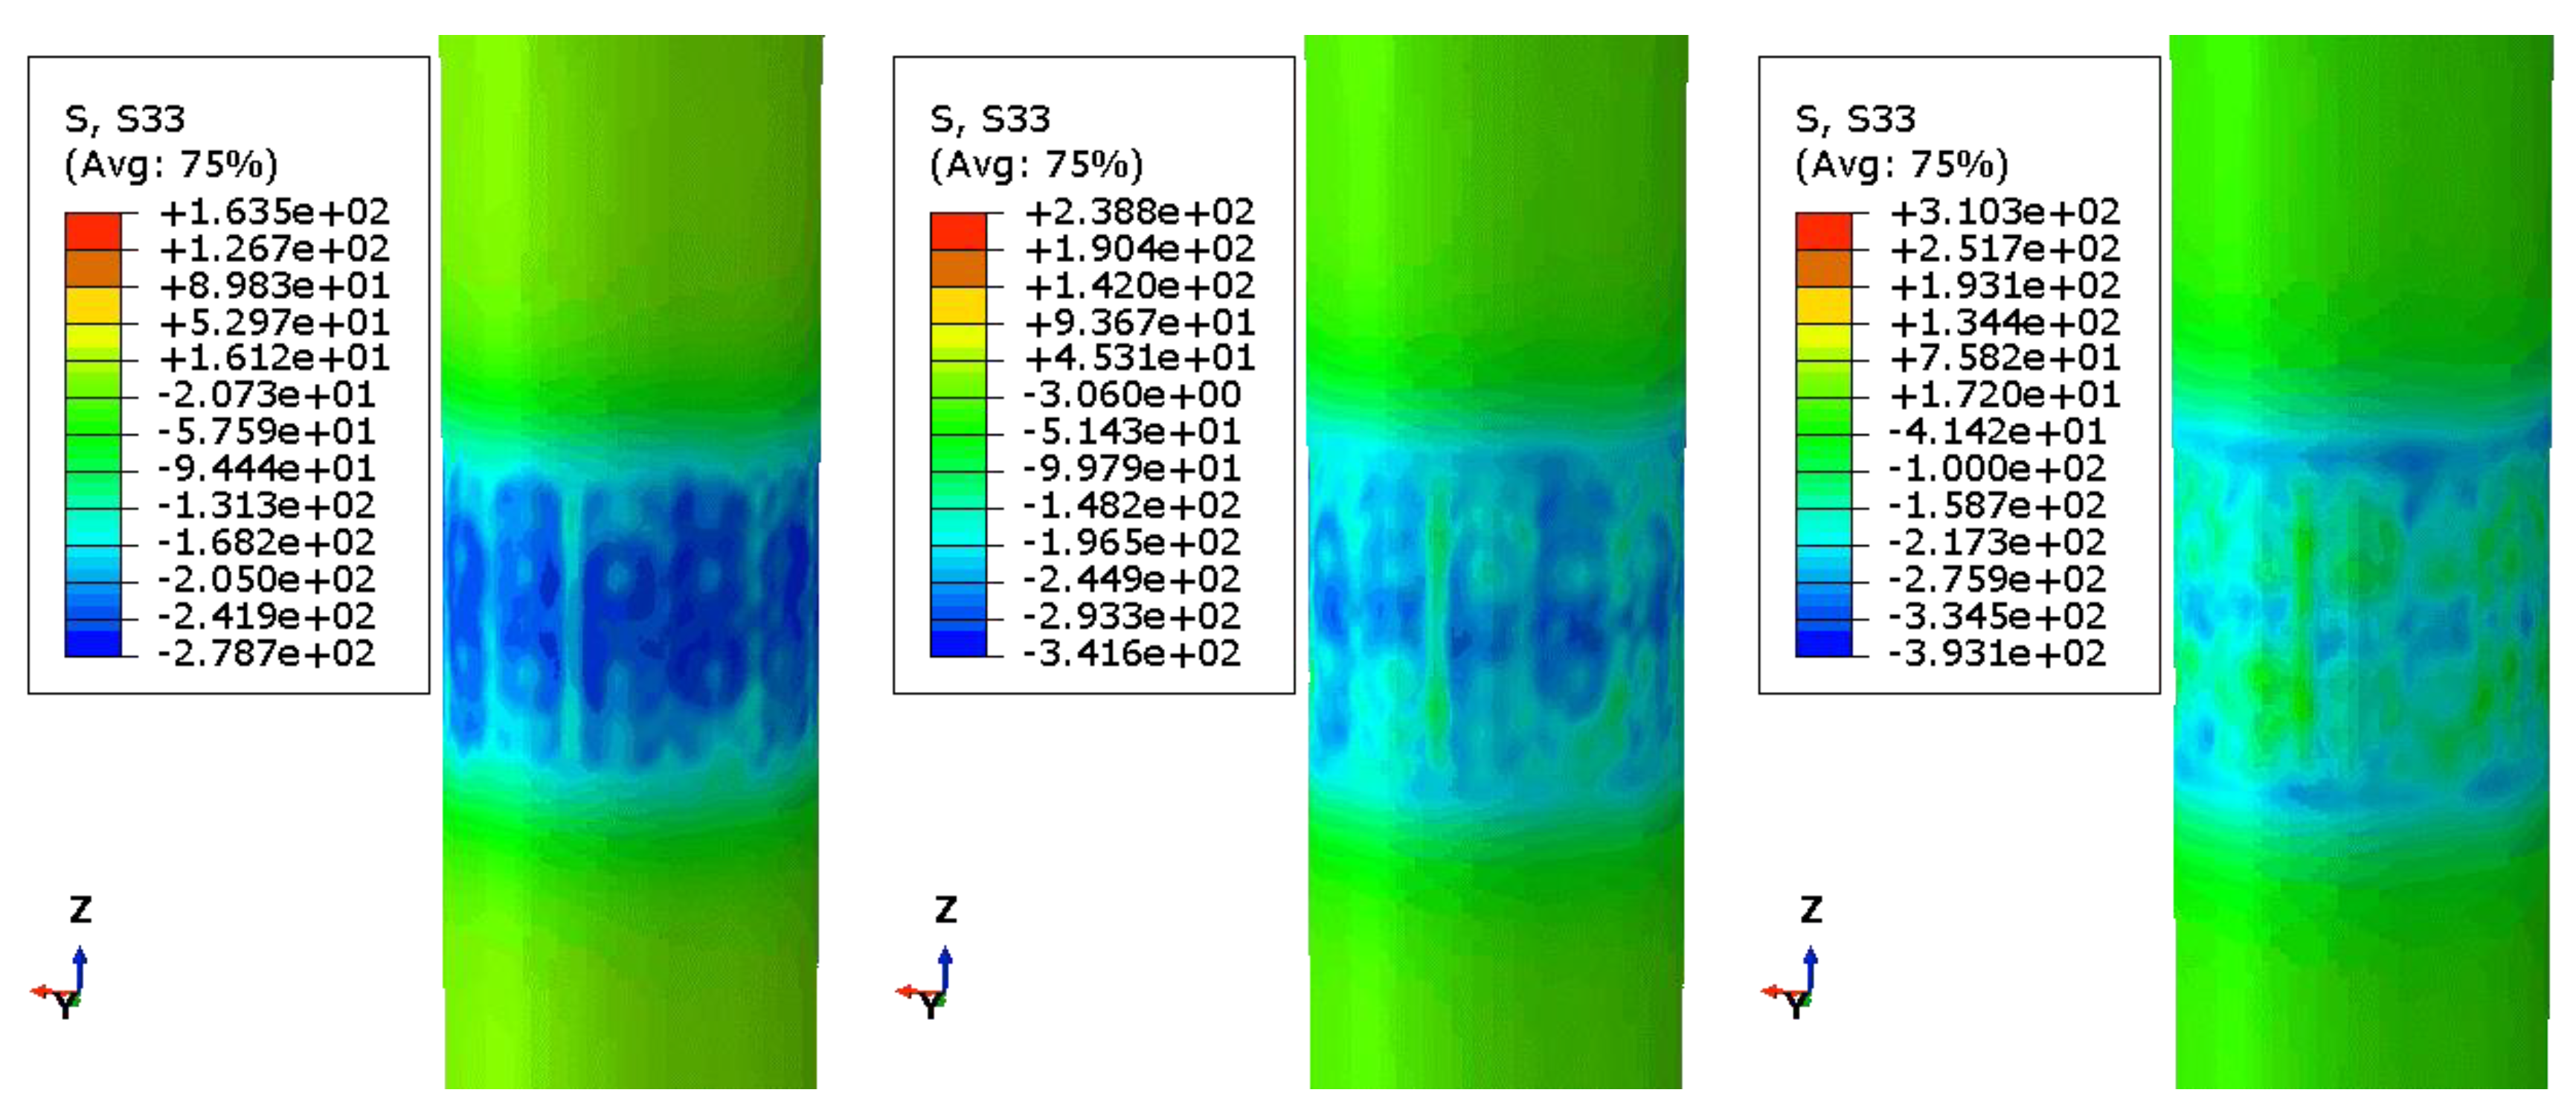
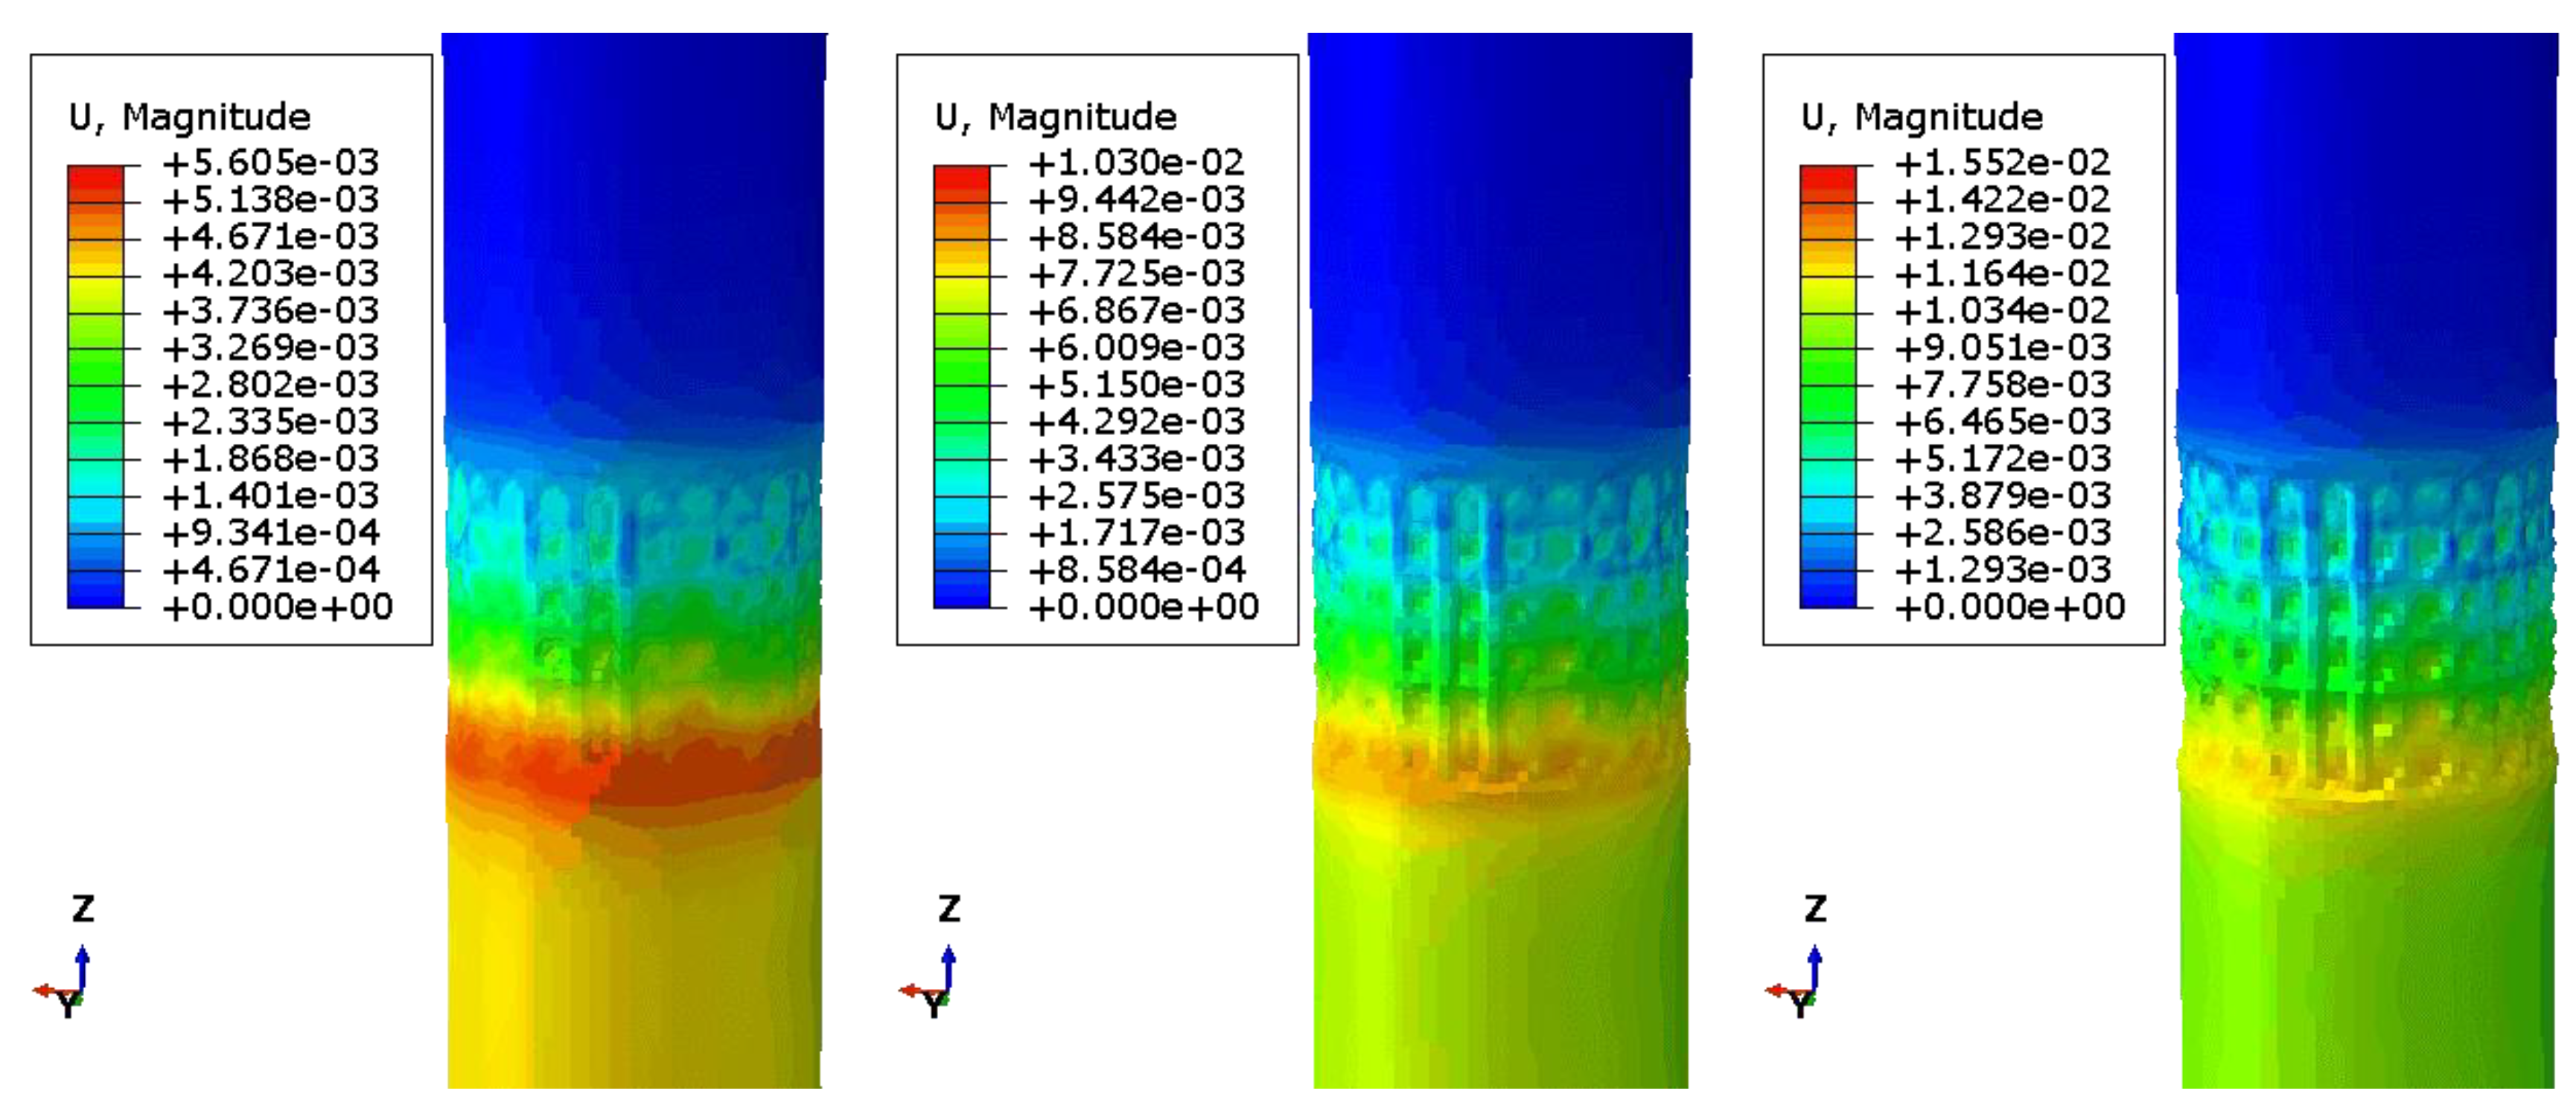
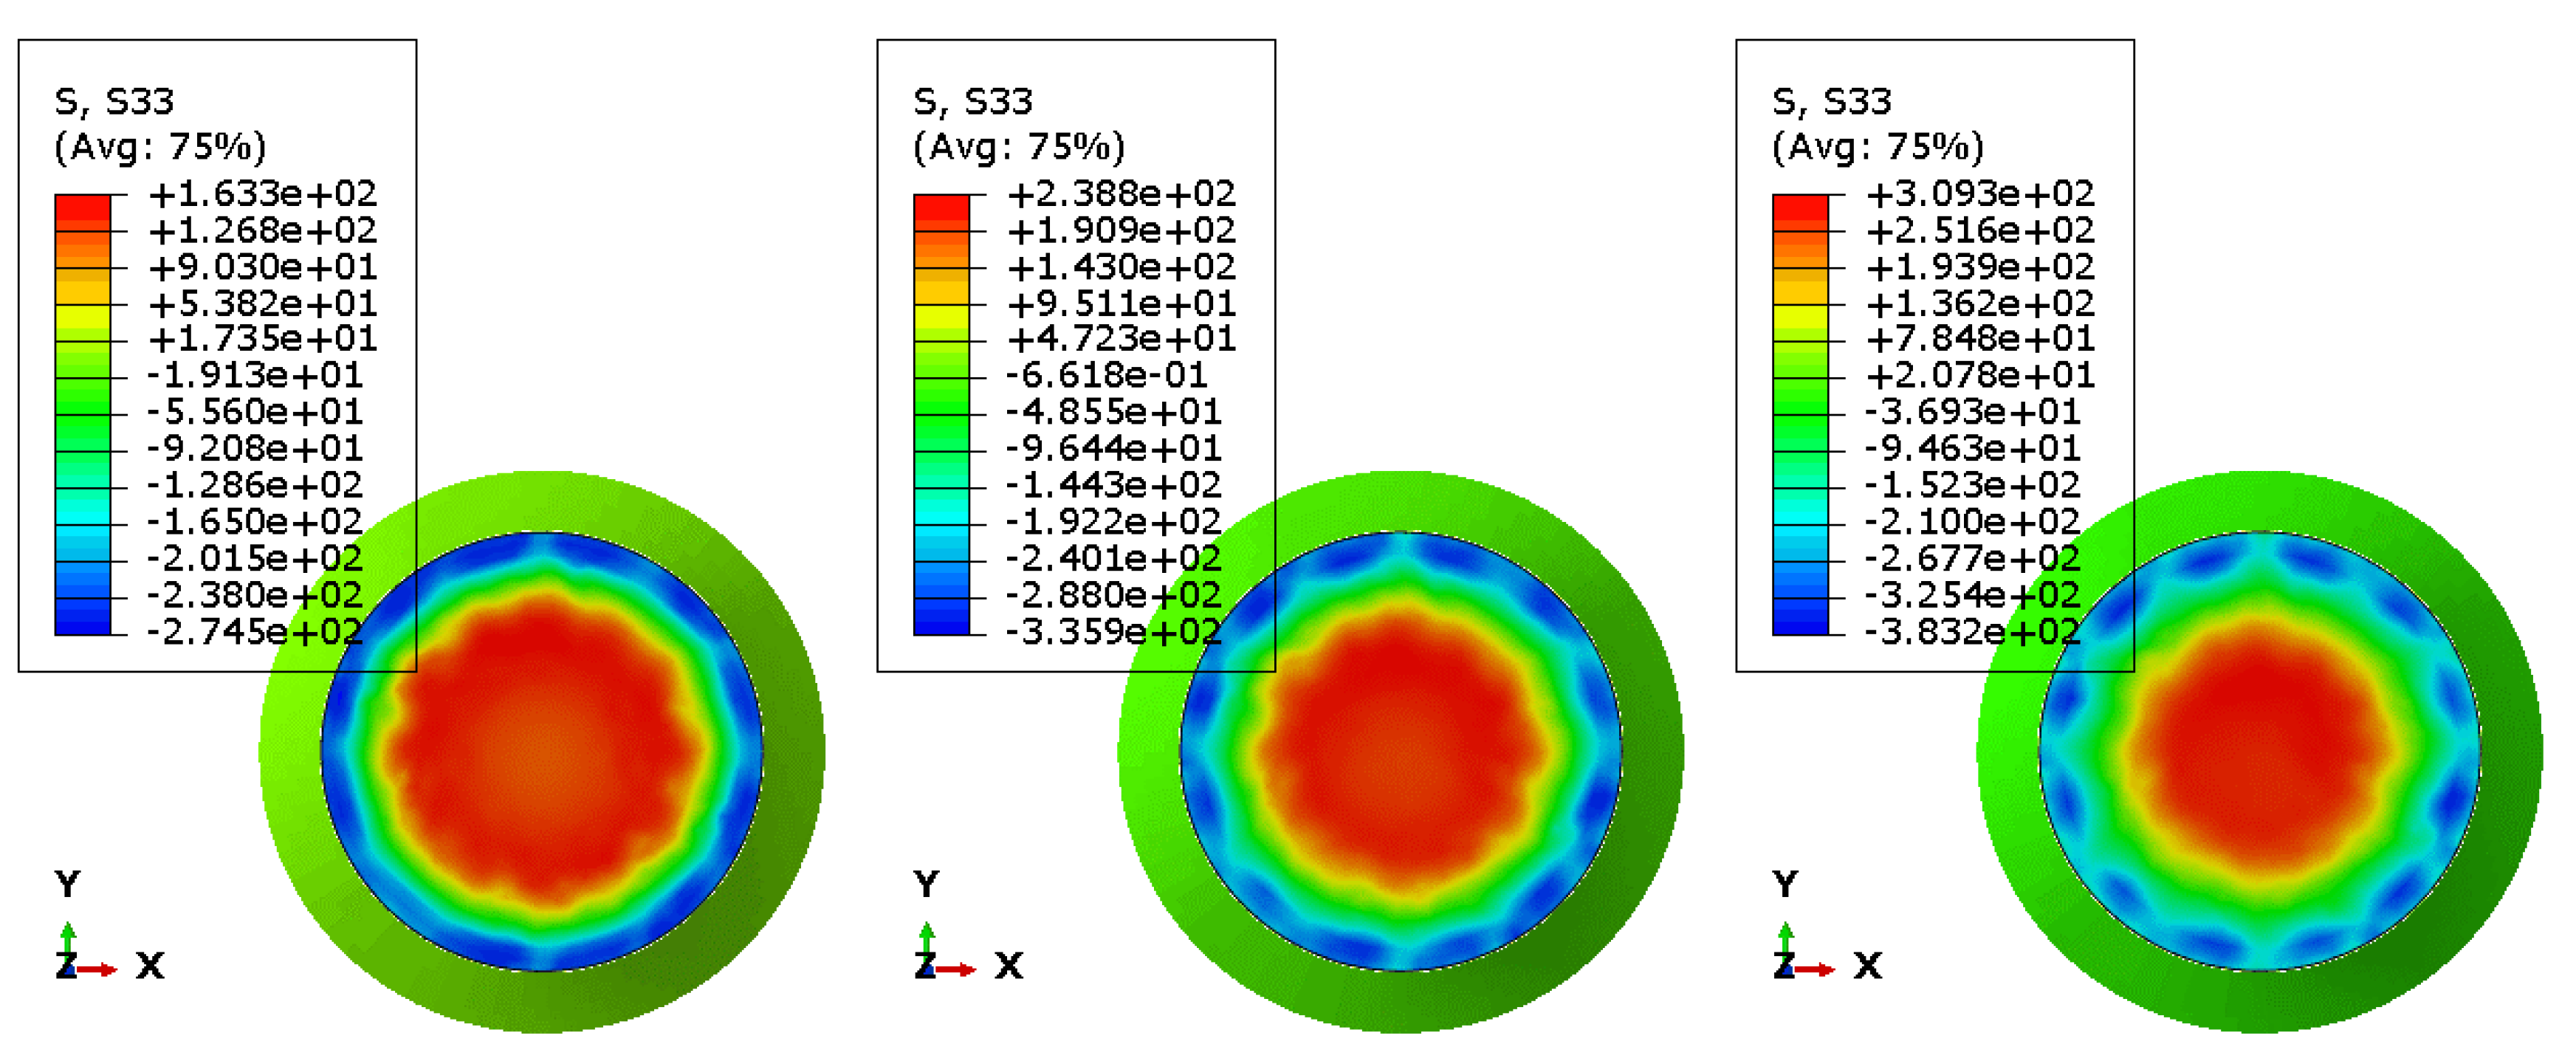
2.1.3. Analysis of Simulation Results

Simulations set up multipoint continuous impacts, similar to the actual machining mode, with each impact point spaced 5000 ns apart for dynamic stabilization time to achieve stabilization at each impact point, while precluding mutual interference between each impact point. A 50% overlap rate was achieved between impact points to ensure the strengthening effect, and the strengthening path is shown in Figure 7. The impact points were 5 in each column, with a longitudinal overlap in the circumference and a spot diameter of 2 mm, and the peak pressure was the control variable, uniformly strengthening for one week.
According to the previous calculation, the theoretically most-suitable peak impact pressure is controlled between 2539 MPa and 3173 MPa. If a smaller pressure is selected to convert it into laser parameters, this parameter exceeds the lower limit of the experimental equipment parameters. If the difference in peak pressure selection is too small, it is difficult to compare the enhancement effect. Therefore, peak pressures of 3000 MPa, 4000 MPa, and 5000 MPa were selected for analysis and calculation in this section to verify the theoretical calculation parameters. The simulation results from left to right peak pressures of 3000 MPa, 4000 MPa, and 5000 MPa, respectively, are as follows:
From Figure 8, it can be seen that in the S33 direction, the surface residual stress generated under the 3000 MPa parameter is the smallest, about 278 MPa compressive stress, while the surface residual stress generated under 4000 MPa is 393 MPa, and the surface residual stress generated under 5000 MPa is 341 MPa. However, the surface stress distribution of the material is the most uniform under the 3000 MPa parameter.
The material plastic deformation simulation results are shown in Figure 9. Plastic deformation can cause damage to the material’s surface roughness, which can be reduced to damage the material’s properties, especially for some precision parts such as turbine blades, which have extremely high requirements for the material’s surface roughness. Cloud charts show that the local shaping deformation of the material is minimal and the surface roughness is highest when the peak pressure is 3000 MPa.
The rebound of shock waves while residual compressive stresses form on the surface of a part strengthened by laser shock can cause tensile stresses in the interior of the part, and the magnitude and depth of residual tensile stresses present on the subsurface under different processes vary, as shown in Figure 10. The maximum tensile stresses all occur near the center of the circle, 163 MPa at 3000 MPa, 238 MPa at 4000 MPa, and 309 MPa at 5000 MPa. Larger internal tensile stresses can have a large negative effect on the life of the material, most likely exacerbating the propagation of internal cracks, so it can be seen that unsuitable machining parameters can have counterproductive effects.

2.1.4. Comprehensive Results and Analysis

The simulation results are summarized in Table 2:
The conversion of the simulation parameters to the actual machining parameters is based on the macro equations also proposed by Fabbro:
P GPa = 0.01 · α α + 3 · Z g · cm 2 · s 1 · A · I GW · cm 2
In the formula above, α is the process efficiency, typically between 0.25 and 0.4, A is the average absorption, between 0.75 and 0.9, Z is the target and confinement layer acoustic impedance, and I is the laser power density. Their specific values are shown in Table 3:
Comparing the results of the three peak pressure impacts, an average deformation of 3.26 μm is generated at 3000 MPa, while 6.00 μm and 9.05 μm are generated at 4000 MPa and 5000 MPa, respectively, which shows that the deformation of the surface is getting bigger and bigger with the increase of the peak pressure. Here, 3000 MPa has the most homogeneous distribution of the stresses, and the internal tensile stresses are small, but the relative layer of the residual compressive stresses is thinner and the surface residual stress the smallest at 3000 MPa, which is about 278 MPa and 393 MPa, respectively. The residual stress on the surface at 3000 MPa is the smallest, about 278 MPa, which is less than the corresponding 341 MPa and 393 MPa at 4000 MPa and 5000 MPa. From the simulation results, it can be seen that the maximum residual compressive stress on the surface and the depth of the residual compressive stress layer under the peak pressure of 3000 MPa are slightly smaller than the other two parameters, but the residual tensile stress and deformation caused by it are much smaller than the other two parameters. The above results are all factors that affect the fatigue life of the specimen. In summary, the simulation results showed that the parameter of 3000 MPa is the best for improving the fatigue life of the specimen. Finally, the actual processing parameters were calculated from the peak impact pressure according to Fabbro’s semi-empirical formula (Formula (6)), and the converted parameters were 3J (the energy level of the laser), 2 mm (laser spot diameter), 5J, 2 mm, and 8J, 2 mm, respectively.

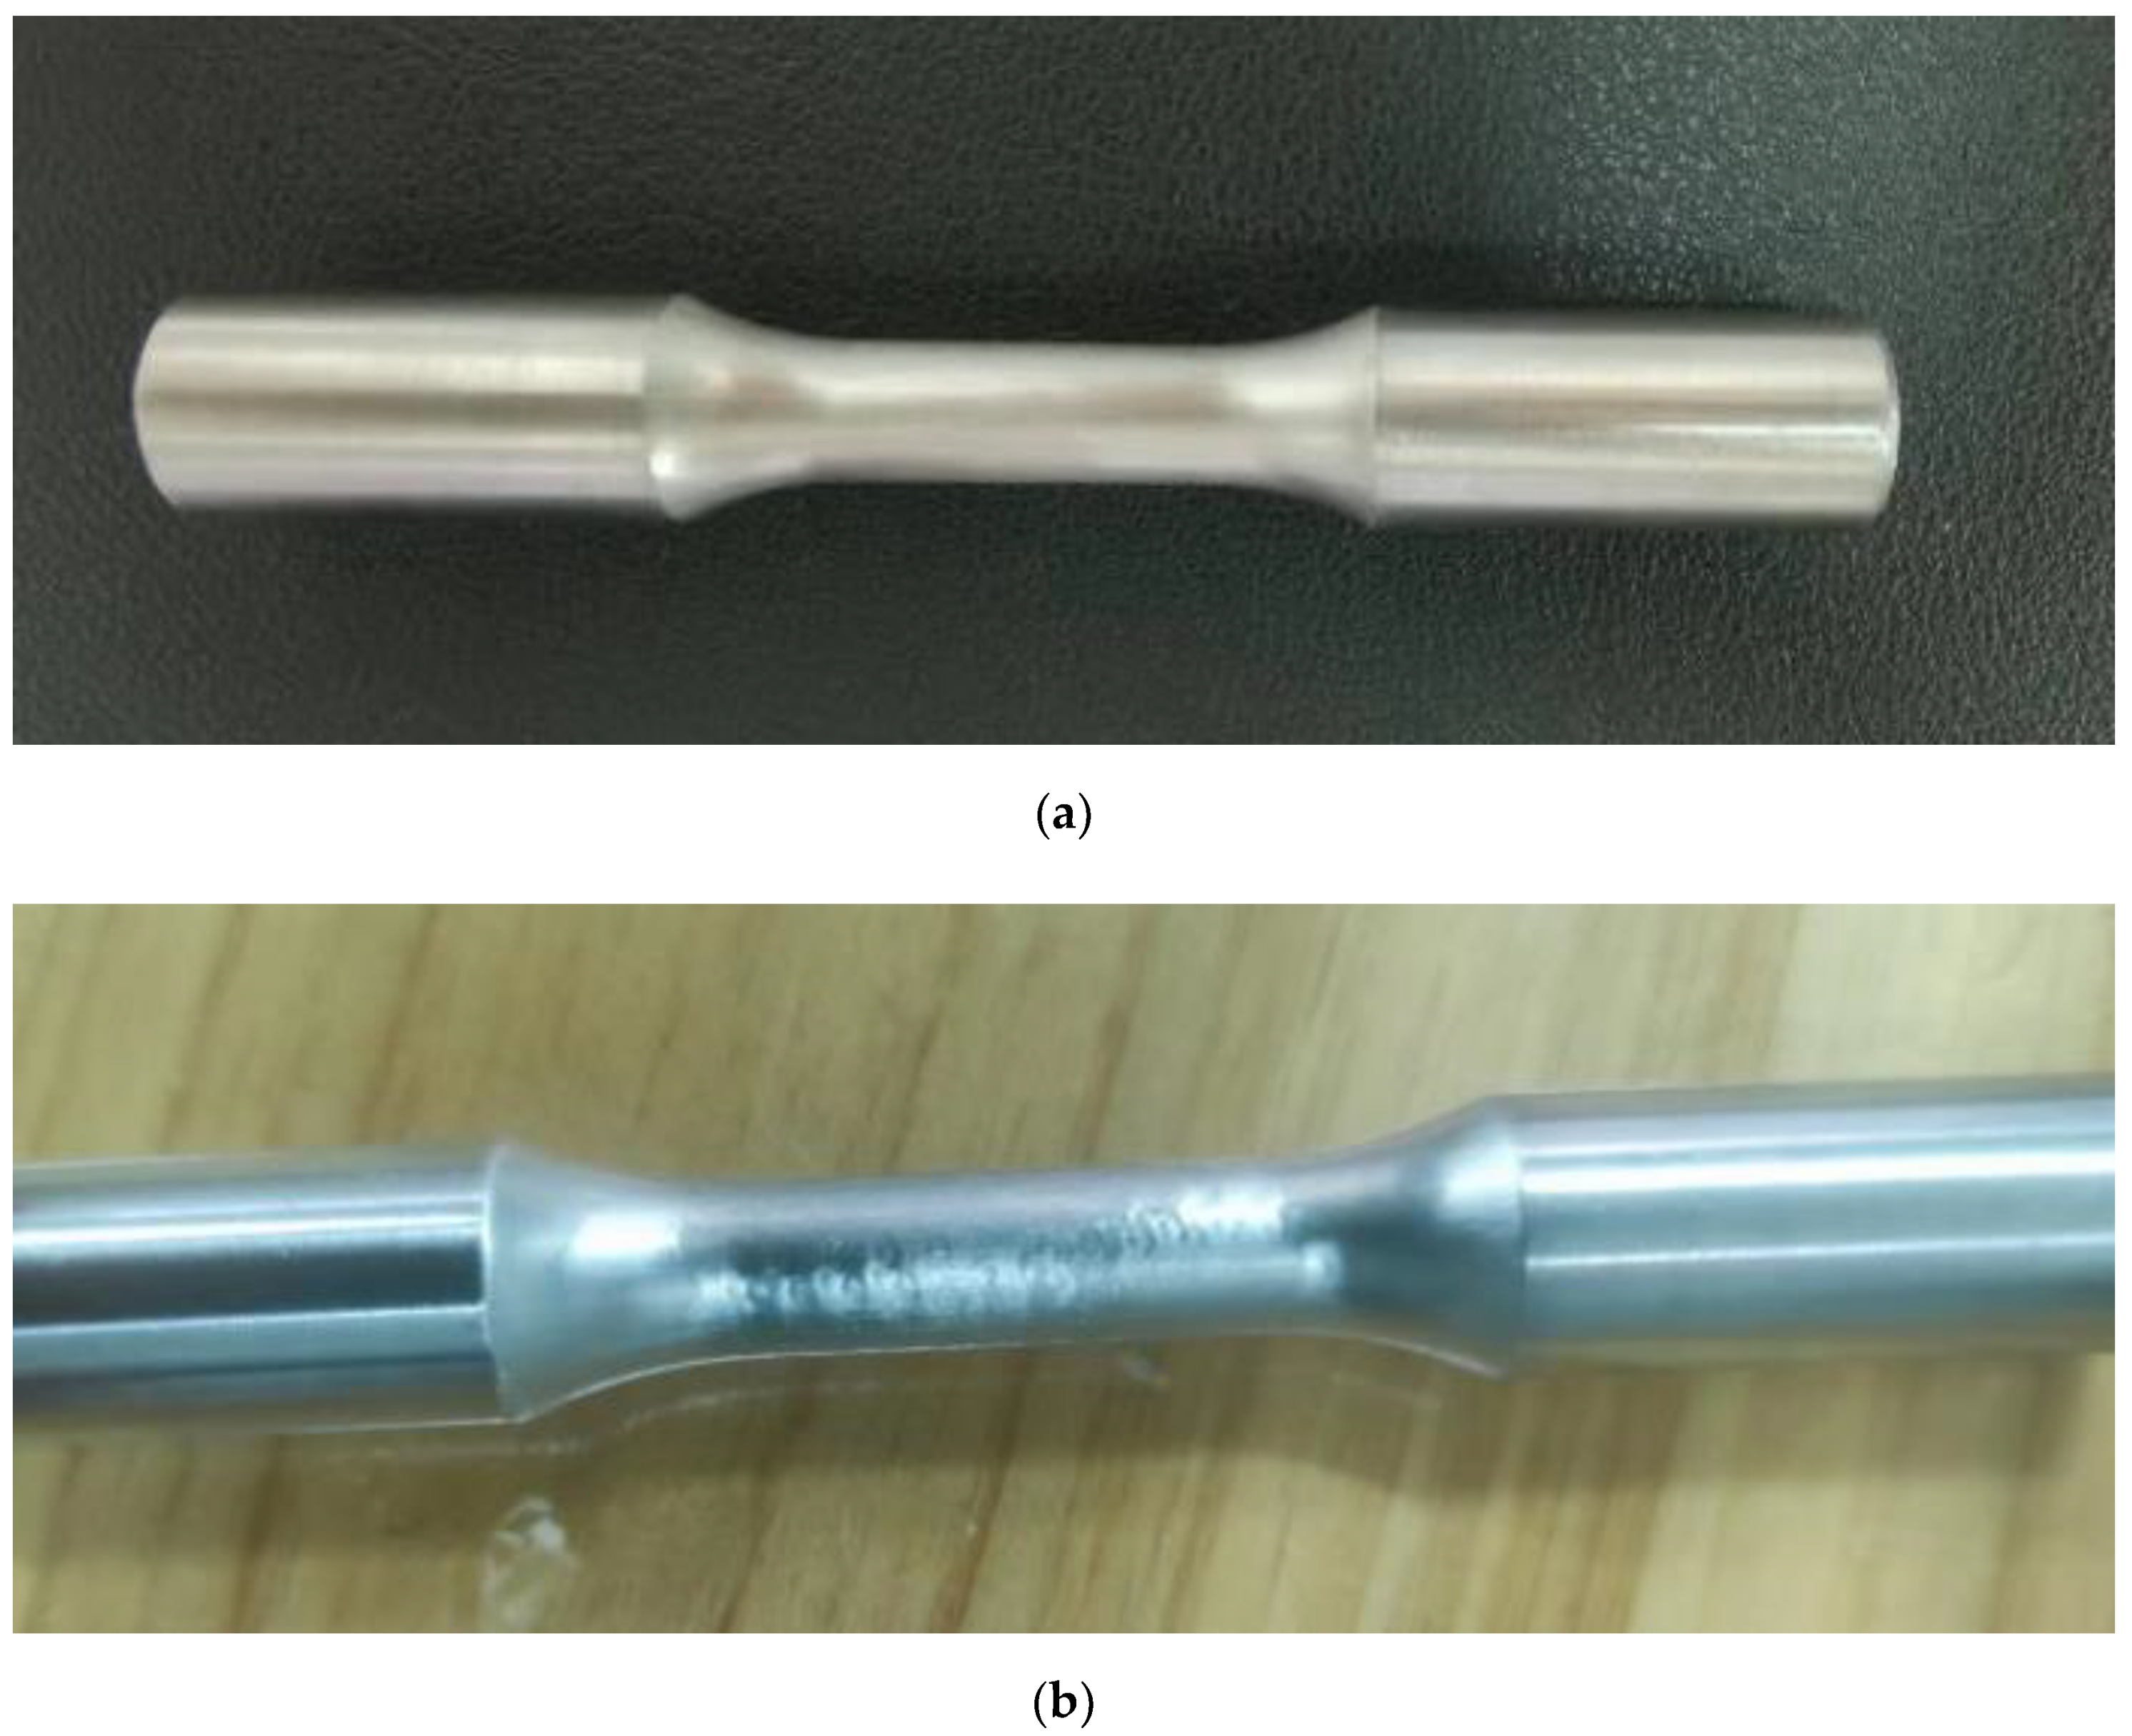
2.2. Validation of Strengthening Parameters for 1Cr18Ni9Ti Materials

Laser-impact-strengthening experiments were performed using the YS0805-R200A laser-impact-strengthening equipment, and the system uses a LAMBER-H08 YAG solid-state laser with the following settings: maximum pulse energy 8J, pulse width 18~20 ns, focused spot 2~5 mm, pure water as a constraint layer, controlling the water flow on the surface of the workpiece to maintain the thickness of 1~3 mm, the absorption of the protective layer of black tape, a spot overlap rate of 50%.
Rotational bending fatigue round bar specimens were clamped and impact-strengthened in the manner shown in Figure 11. Specimens before and after the impact of the are shown in Figure 12.
LSP can generate residual compressive stress to inhibit surface crack initiation and expansion [23,24], significantly improving the overall fatigue life of components [25]. Therefore, in this paper, a QBWP-10000 rotary bending fatigue testing machine was used to detect the fatigue life of the test pieces before and after strengthening; the X-ray diffraction method was used to measure the residual compressive stress on the surface of the material; a Vickers hardness tester was used to detect the hardness of the material; a scanning electron microscope (SEM) was used to analyze the fatigue fracture morphology; electron backscattering diffraction (EBSD) was used to observe and analyze the microstructure of the surface layer after strengthening. The microstructure of the strengthened surface layer was observed and analyzed by EBSD.

3. Analysis of Experimental Results

3.1. Analysis of Rotational Bending Fatigue Test Results

The experimental data are shown in Table 4. The experimental final load of 498 MPa was determined by the first eight failures, and the average number of load cycles of the unprocessed original was 258,303 under the same load, while the number of load cycles was significantly increased after LSP, with an average of 369,587 cycles under the 8J process and an average of 439,547 cycles under the 5J process, which is about 1.7-times higher compared to the original fatigue. The 3J and 2 mm processes had the greatest improvement in fatigue performance due to the minimization of the internal tensile stress in the specimen and the smaller influence of the surface morphology, and the number of rotational cycles passed 107 times. The average data under different parameters are shown in Figure 13.

3.2. Analysis of Hardness Results

The machine was set to pressurize and unload for a time of 12 s, with a holding time of 15 s, and an average of seven positions were measured for each workpiece. The hardness microscope directly measured the diagonal lengths d1 and d2 of the indentation area and calculated the hardness (HV). After the measurement was completed, the experimental data were exported through the system, as shown in Figure 14.
The experimental results showed that the average hardness of the unprocessed parts was 293.2 HV, and the hardness of the LSP-strengthened parts was significantly improved up to 347.3 HV, while the micro-hardness gradually decreased along the depth direction due to the reflection of the shock wave in the internal part of the material; the results showed that the micro-hardness was maximally increased by 19.3%. This was due to the high-pressure plasma shock wave generated by the laser impact pressure up to several GPa, inducing plastic deformation up to a 107 s−1 high strain rate on the surface of the metal material [26], generating more dislocations, thus increasing the surface hardness of the material [27].

3.3. Residual Compressive Stress Result on Specimen’s Surface

Residual stress on the surface of the material has an important impact on the material’s properties, residual compressive stress can inhibit the generation and expansion of cracks on the surface of the material [28,29]. Residual compressive stress will decrease with depth [30]. The results of the laser impact strengthening of the 1Cr18Ni9Ti stainless steel surface’s X-direction residual stress are shown in Table 5; the results show that the data obtained under the 3J parameter is the best. The experimental data line chart is shown in Figure 15.

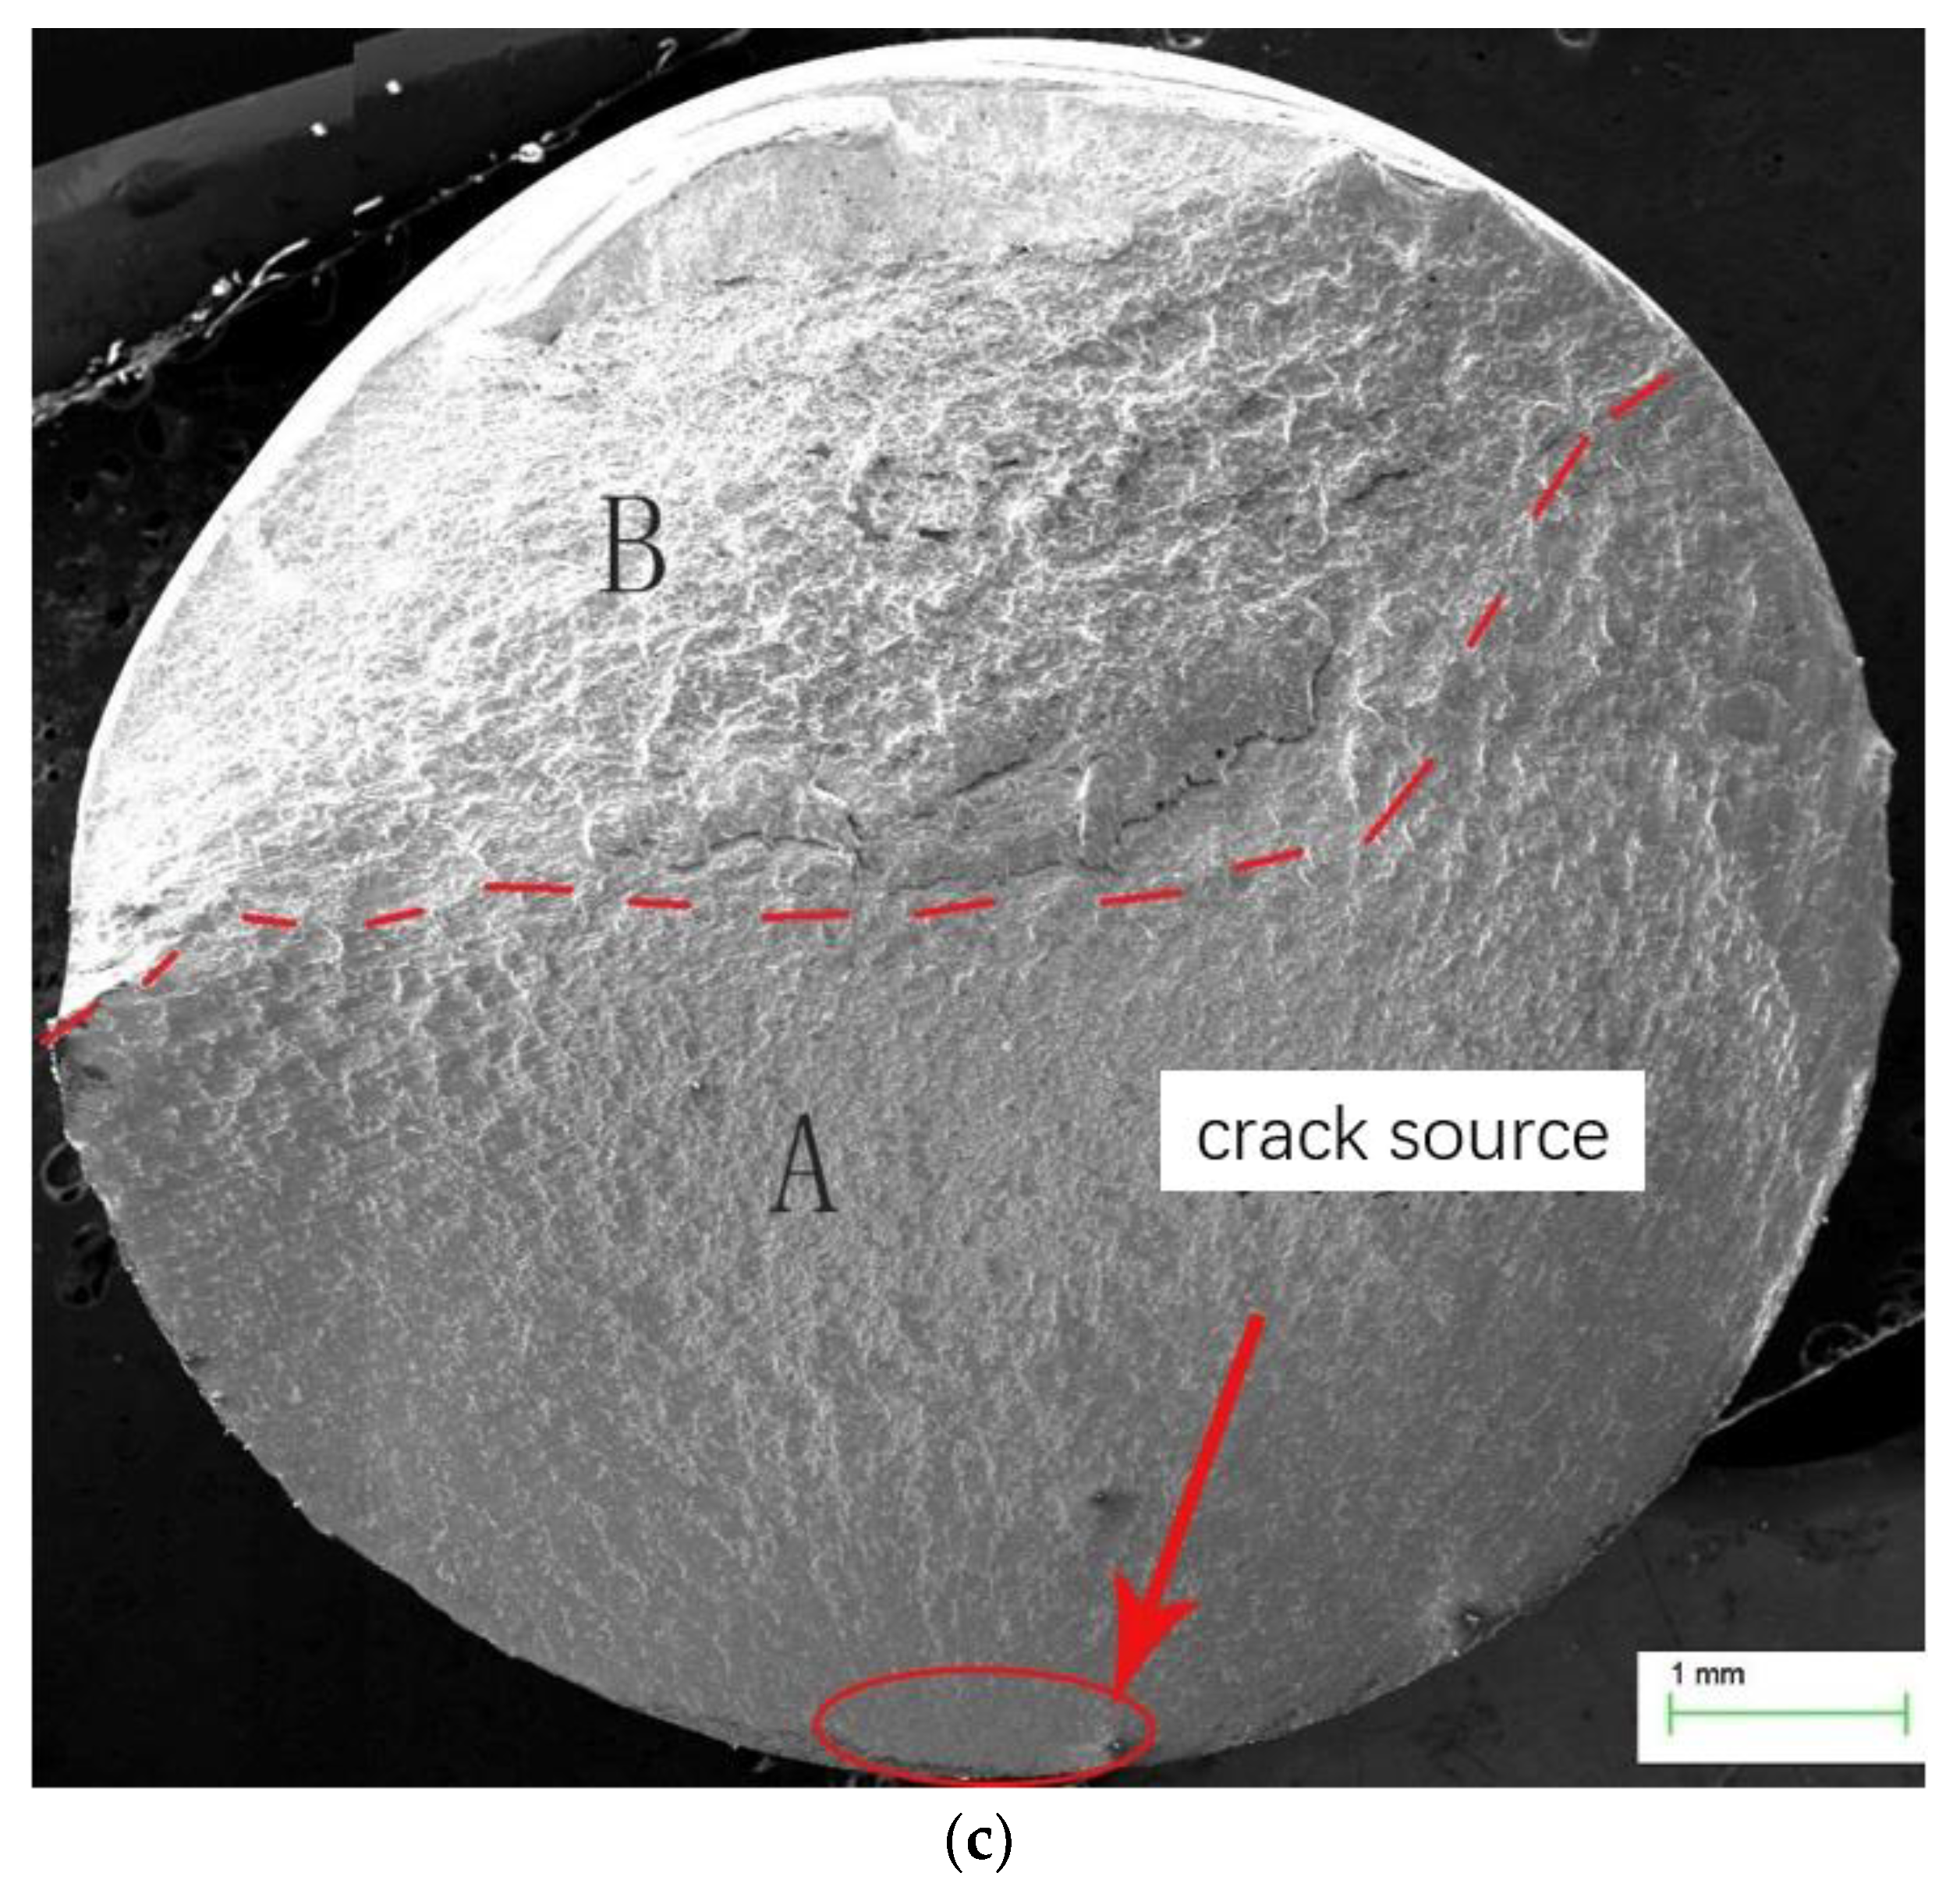
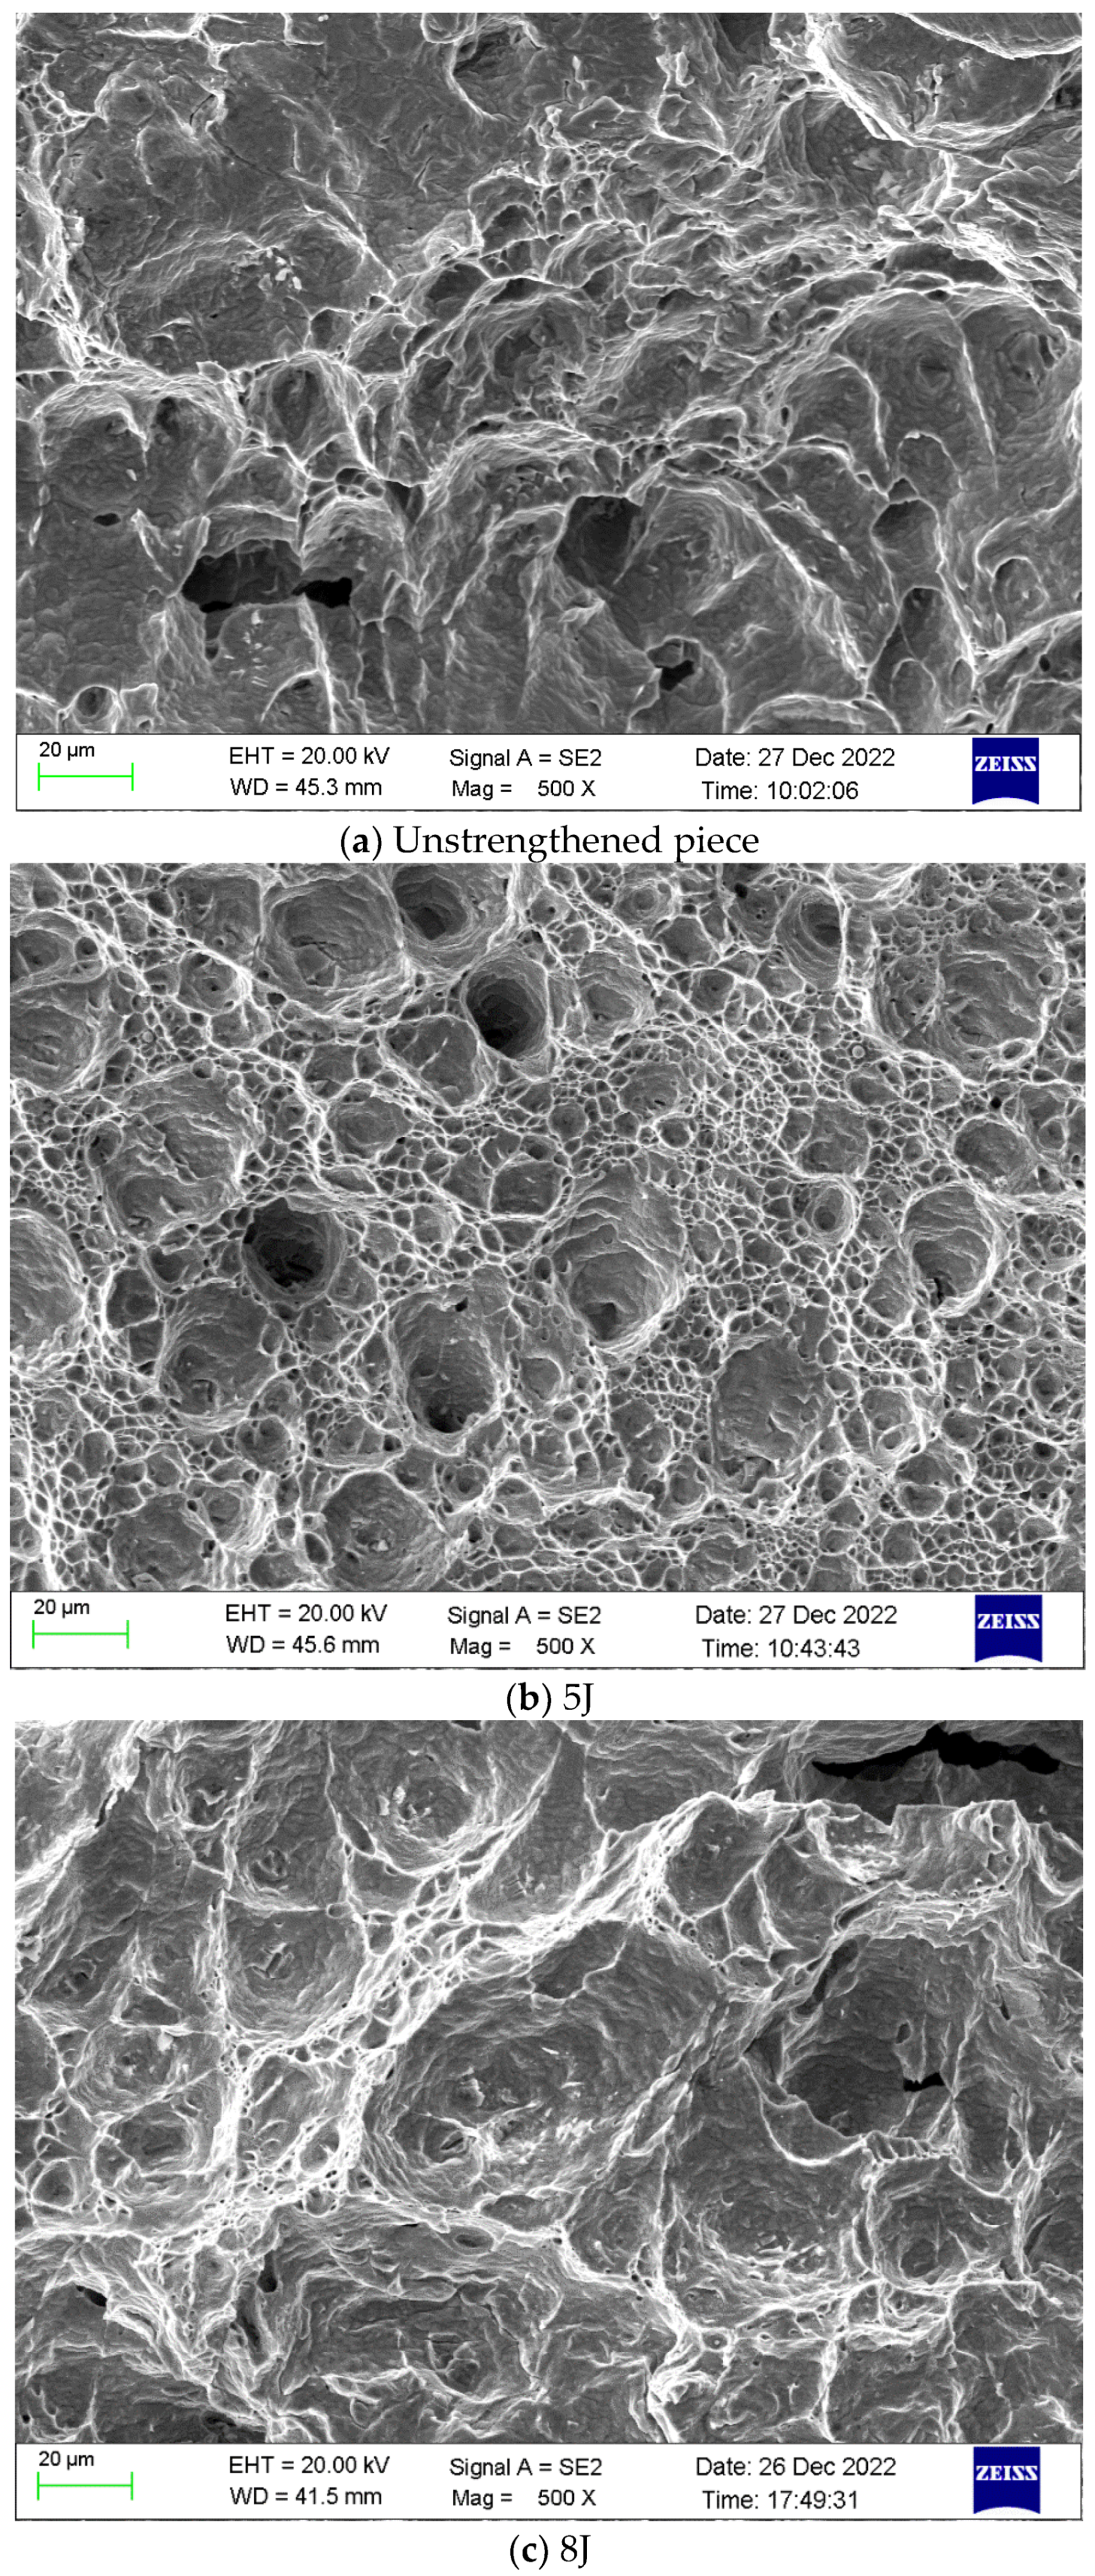
3.4. Fatigue Specimen Fracture Observation and Analysis

The fracture morphology is shown in Figure 16. The original section can be divided into three areas, A, B, and C. Area A is a relatively straight area of about 1/2 of the section; the cross-section shows that the crack originated from the elliptical marked part of region A, so region A is the crack source area, while region B has a rough and ductile morphology, which is a fatigue transient zone.
Under the 5J and 8J processes, the section can be divided into two regions, A and B, where Region A is relatively straight and has visible crack, which is the crack source region, and Region B is the transient fracture region.
Separate analysis of each specimen’s fracture showed that the original crack had a river-like diffraction pattern and a large number of friction–extrusion traces, and the crack was generated from the surface of the specimen and extended inward. Cracks under a 5J impact also appeared near the edges, but did not originate from the surface, which can indicate the inhibition of crack initiation on the surface of the material after impact strengthening. The fatigue life was also improved as a result.
In Figure 17, by comparing and observing the fatigue transient fracture zones of the three fracture surfaces, it can be seen after magnification that the main morphology is a large and dense number of dimples, which also indicates that they are all ductile fractures. Generally, when the fracture conditions are the same, the larger the size of the dimple, the better the plasticity of the material. As shown in Figure 17, the number and density of the dimples under 5J increased compared with the other two, and the size of the dimples under 8J was obviously larger, so the plasticity of the material was significantly improved by the laser impact strengthening. The increase in plasticity also means that the material is less prone to fracture and the fatigue limit has increased.

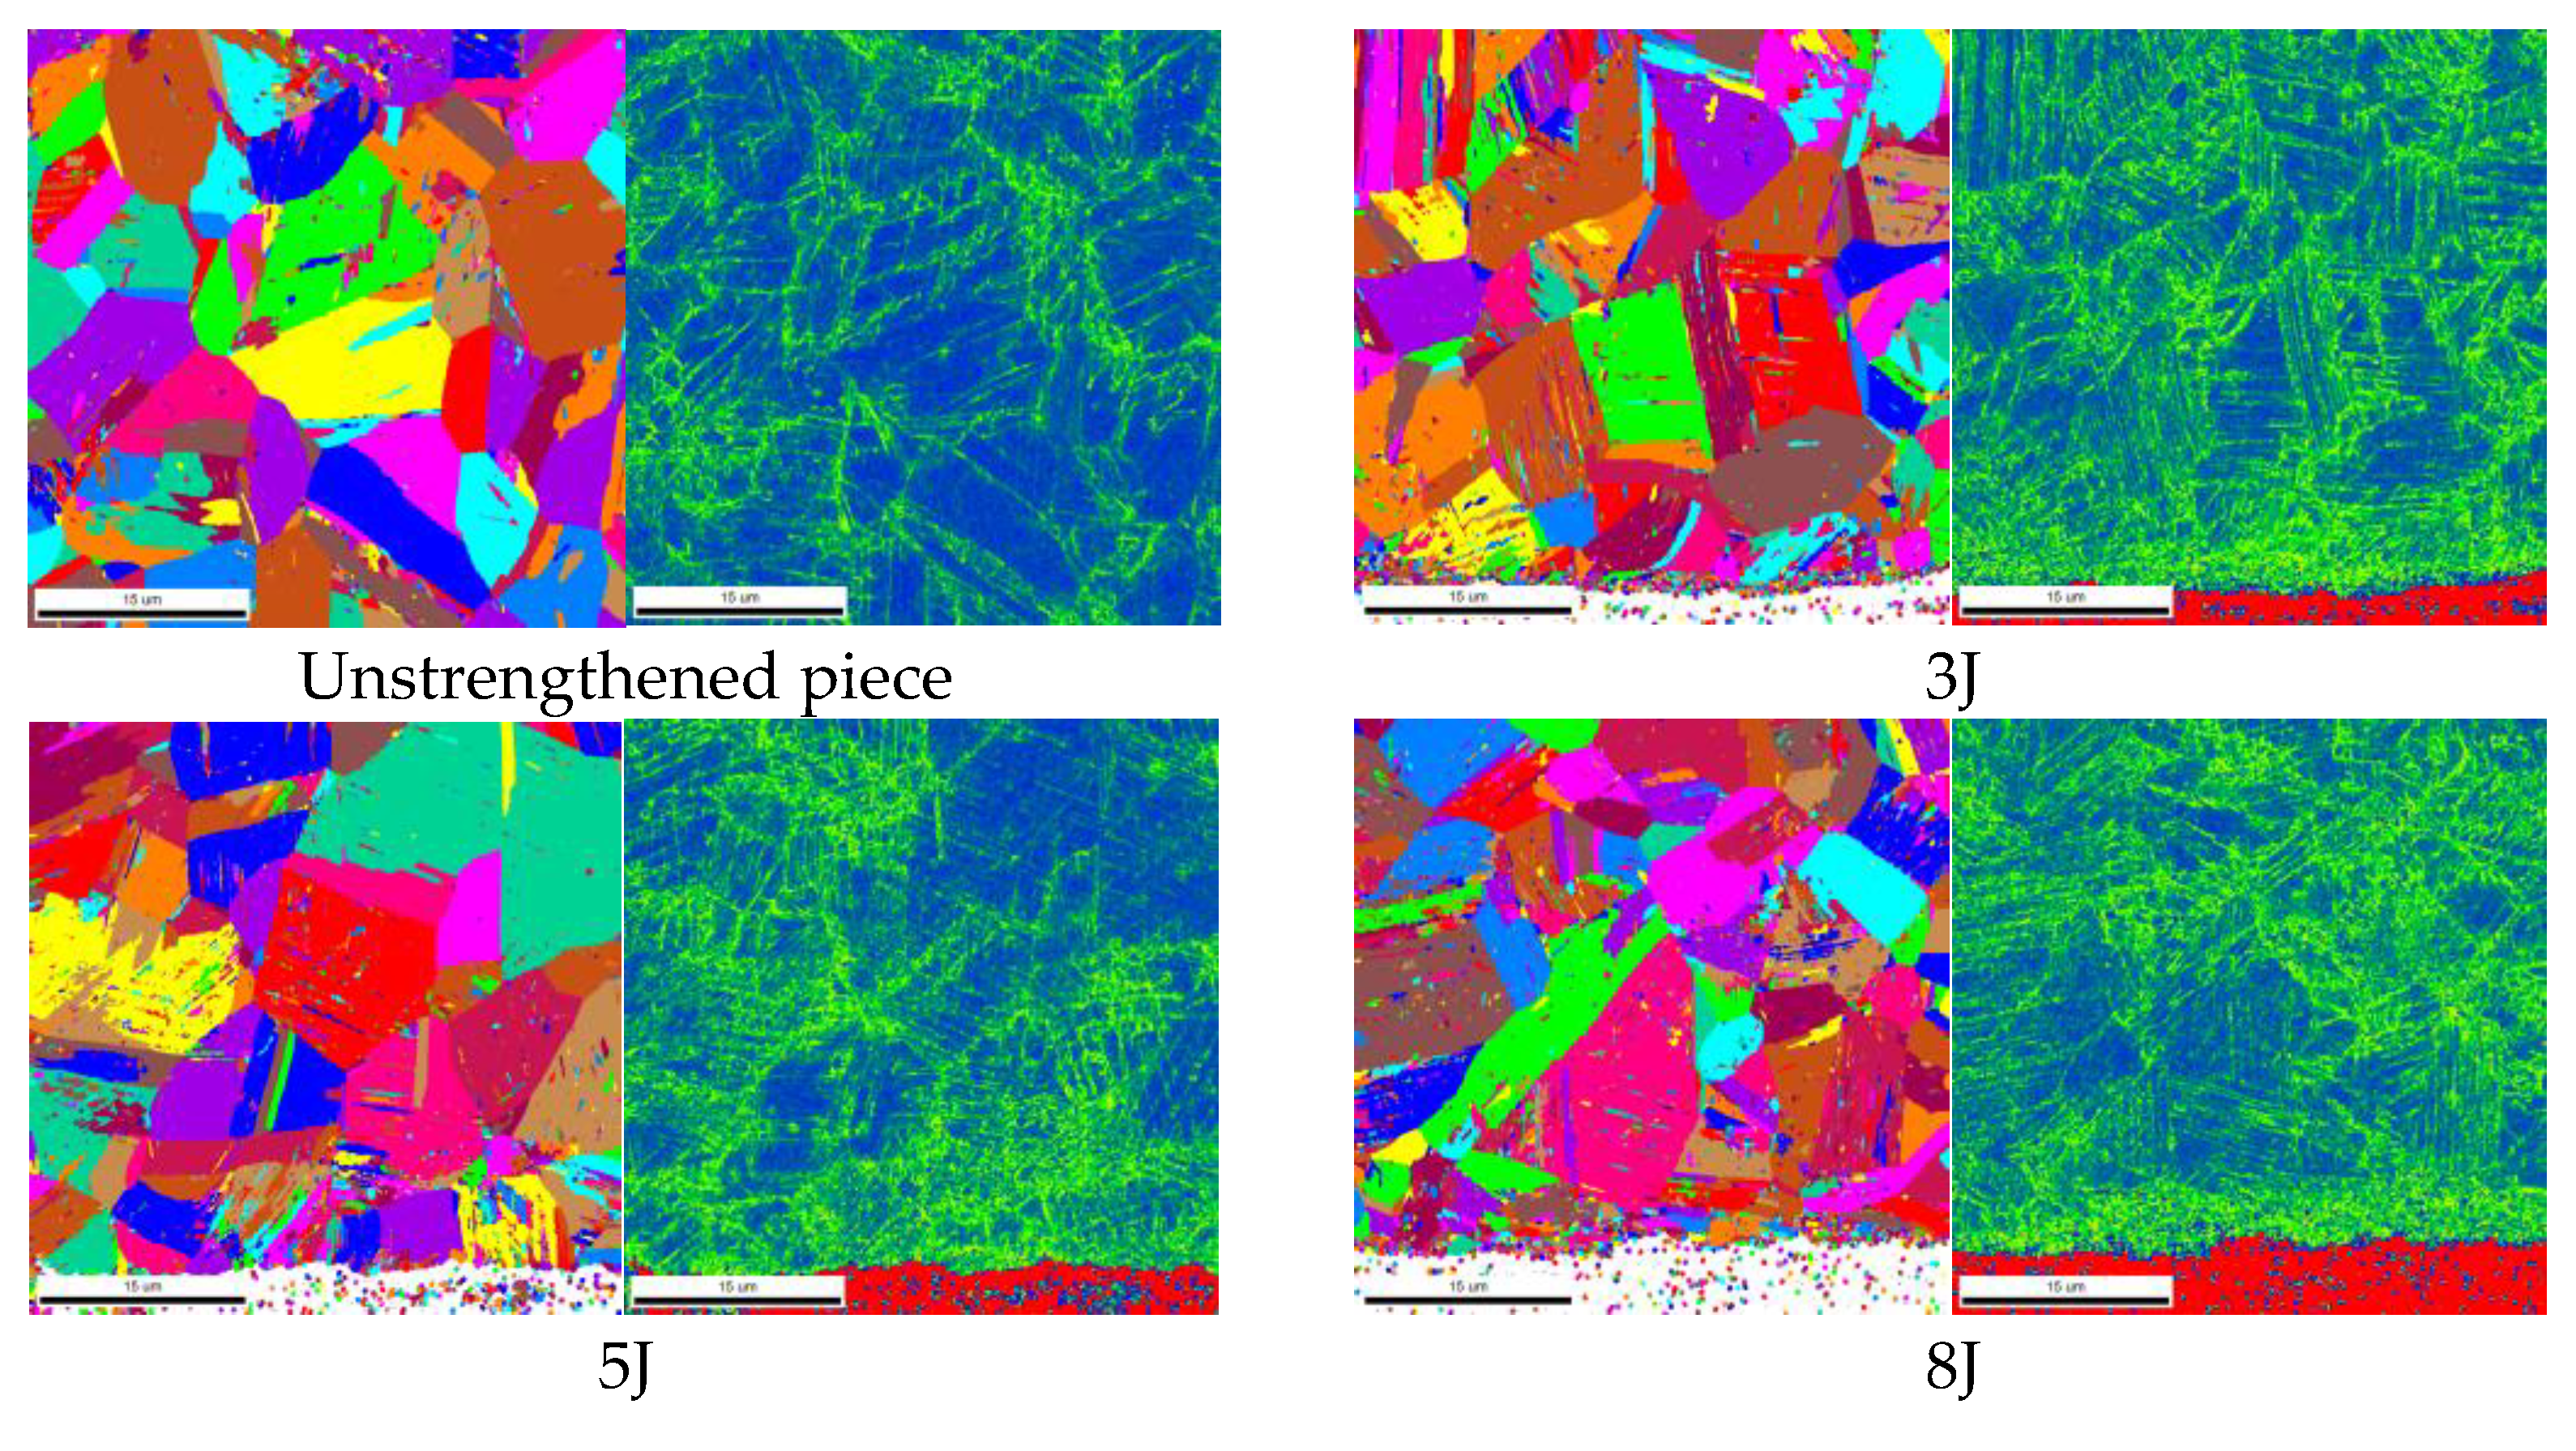
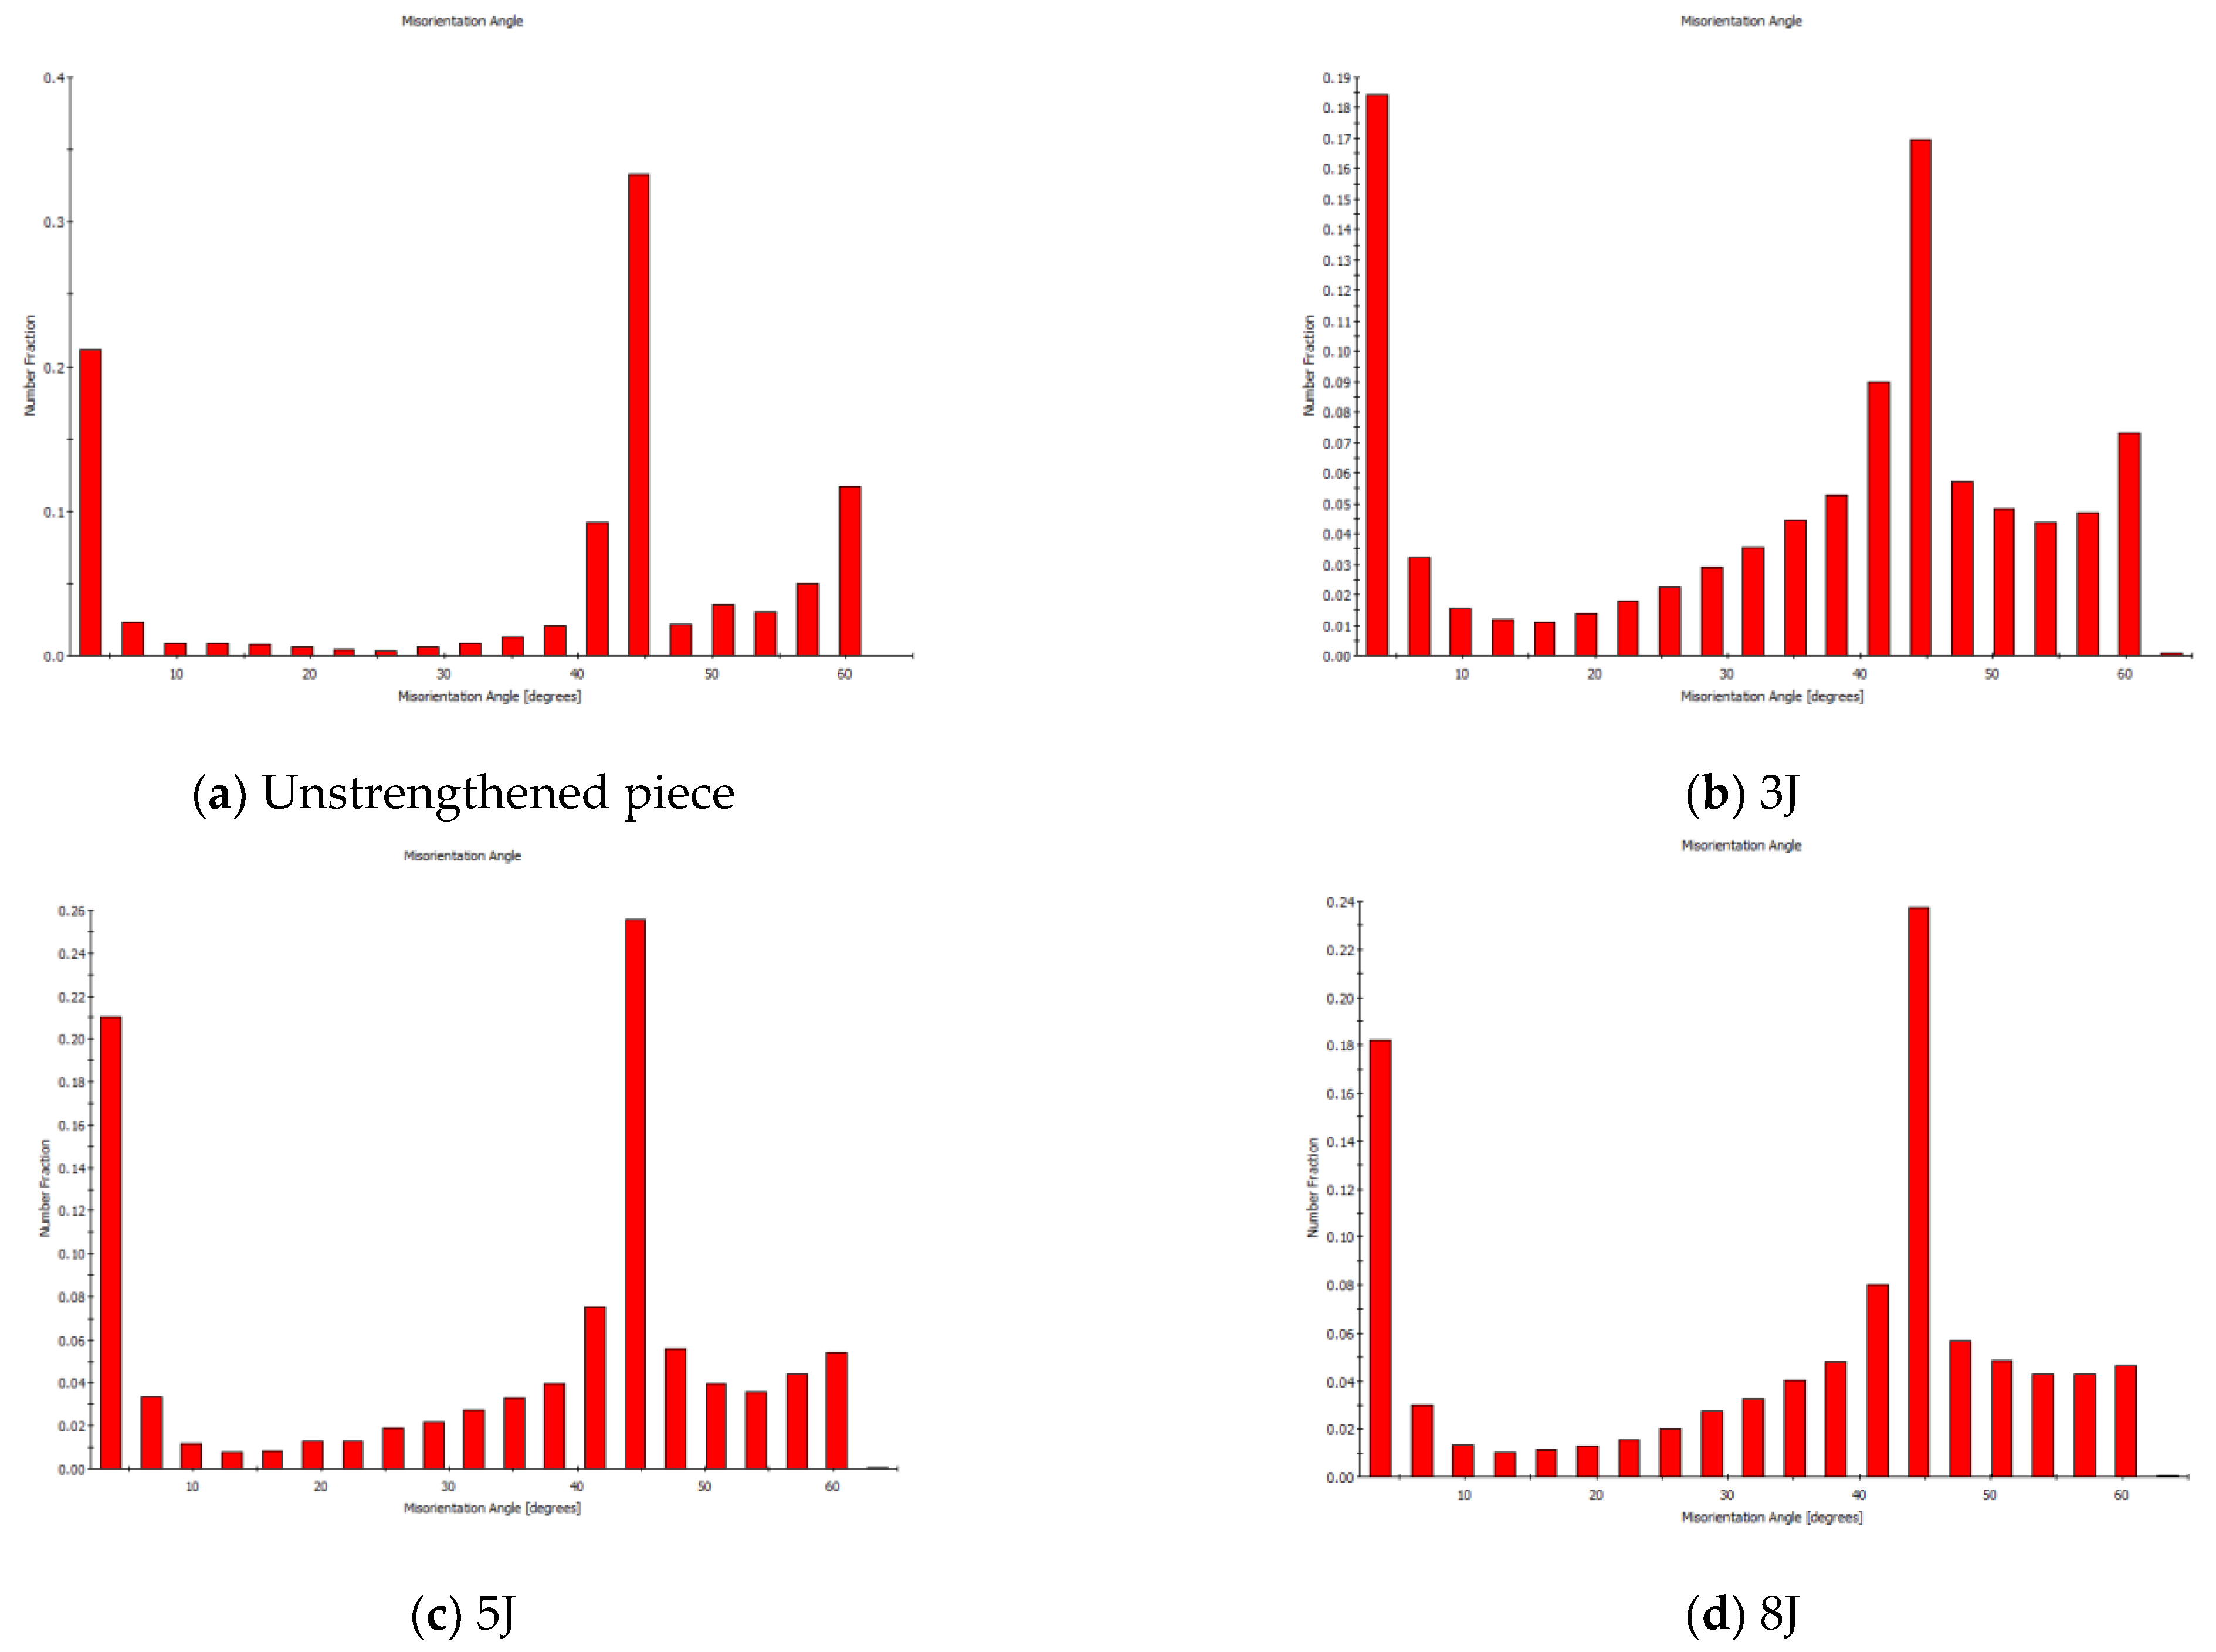
3.5. Analysis of EBSD Experiment Results

The test article reverse pole diagram and local orientation difference distribution diagram (KAM) at different process parameters are as follows.
Figure 18 shows that the grain size of the unprocessed specimen was the coarsest and uneven, while the grain size of the intensified specimen was refined to different degrees, and a nanolayer with a depth of about 2 μm was formed on the surface; a high dislocation density near the impacted surface can be clearly seen in the KAM diagram. A comparison of the images shows that the laser energy of 5J produced the largest high-density dislocation area, but the energy of the 8J surface grain refinement was the highest. This also indirectly explains why the fatigue life has been improved [29,31].
From the size–angle distribution diagram, it can be seen that, after the material undergoes stress deformation, a large number of dislocations are accumulated in the interior, and with the increase of the dislocation density, subcrystalline boundaries are formed inside the material, which further constitutes to the subcrystals. When the stress accumulates to a certain critical value, the subcrystalline boundaries will continue to absorb dislocations, resulting in dynamic recrystallization, and gradually be transformed into large-angle grain boundaries. Therefore, a large number of dislocations exist within the deformed grain, and these dislocations form general deformed grain boundaries with an orientation difference of no more than 2° on both sides, while the angle of the subcrystalline boundaries is generally between 2 and 15° and the angle of the large-angle grain boundaries is more than 15°. From Figure 19a, it can be seen that the proportion of subgrain boundaries with an orientation difference of 2–15° on both sides of the grain boundary on the surface of the raw material is 24.8%. From Figure 19b, it can be seen that the proportion of subgrain boundaries with an orientation difference of 2–15° on both sides of the grain boundary on the surface of the material processed under the 3J parameter is 26.7%. From Figure 19c, it can be seen that the proportion of subgrain boundaries with an orientation difference of 2–15° on both sides of the grain boundary on the surface of the material processed under the 5J parameter is 23.3%. From Figure 19d, it can be seen that the proportion of subgrain boundaries with an orientation difference of 2–15° on both sides of the grain boundary on the surface of the material processed under the 8J parameter is 23.5%. This indicates that the material increases the number of high-density dislocations under the 3J and 5J parameters, while the effect of increasing dislocations under the 8J parameter is poor. This is due to the excessive impact pressure causing the internal plastic wave to rebound and generate tensile stress in the material, resulting in weaker grain refinement and a decrease in the shear dislocation area.

4. Discussion

This article explored the laser shock peening effect of materials through simulation and then verified the strengthening effect through the fatigue testing of the specimens. The specimens were subjected to hardness testing, residual compressive stress, fracture analysis, and microstructure observation, explaining from multiple perspectives how laser shock peening can improve the fatigue life of specimens. The summary is as follows:
(1)
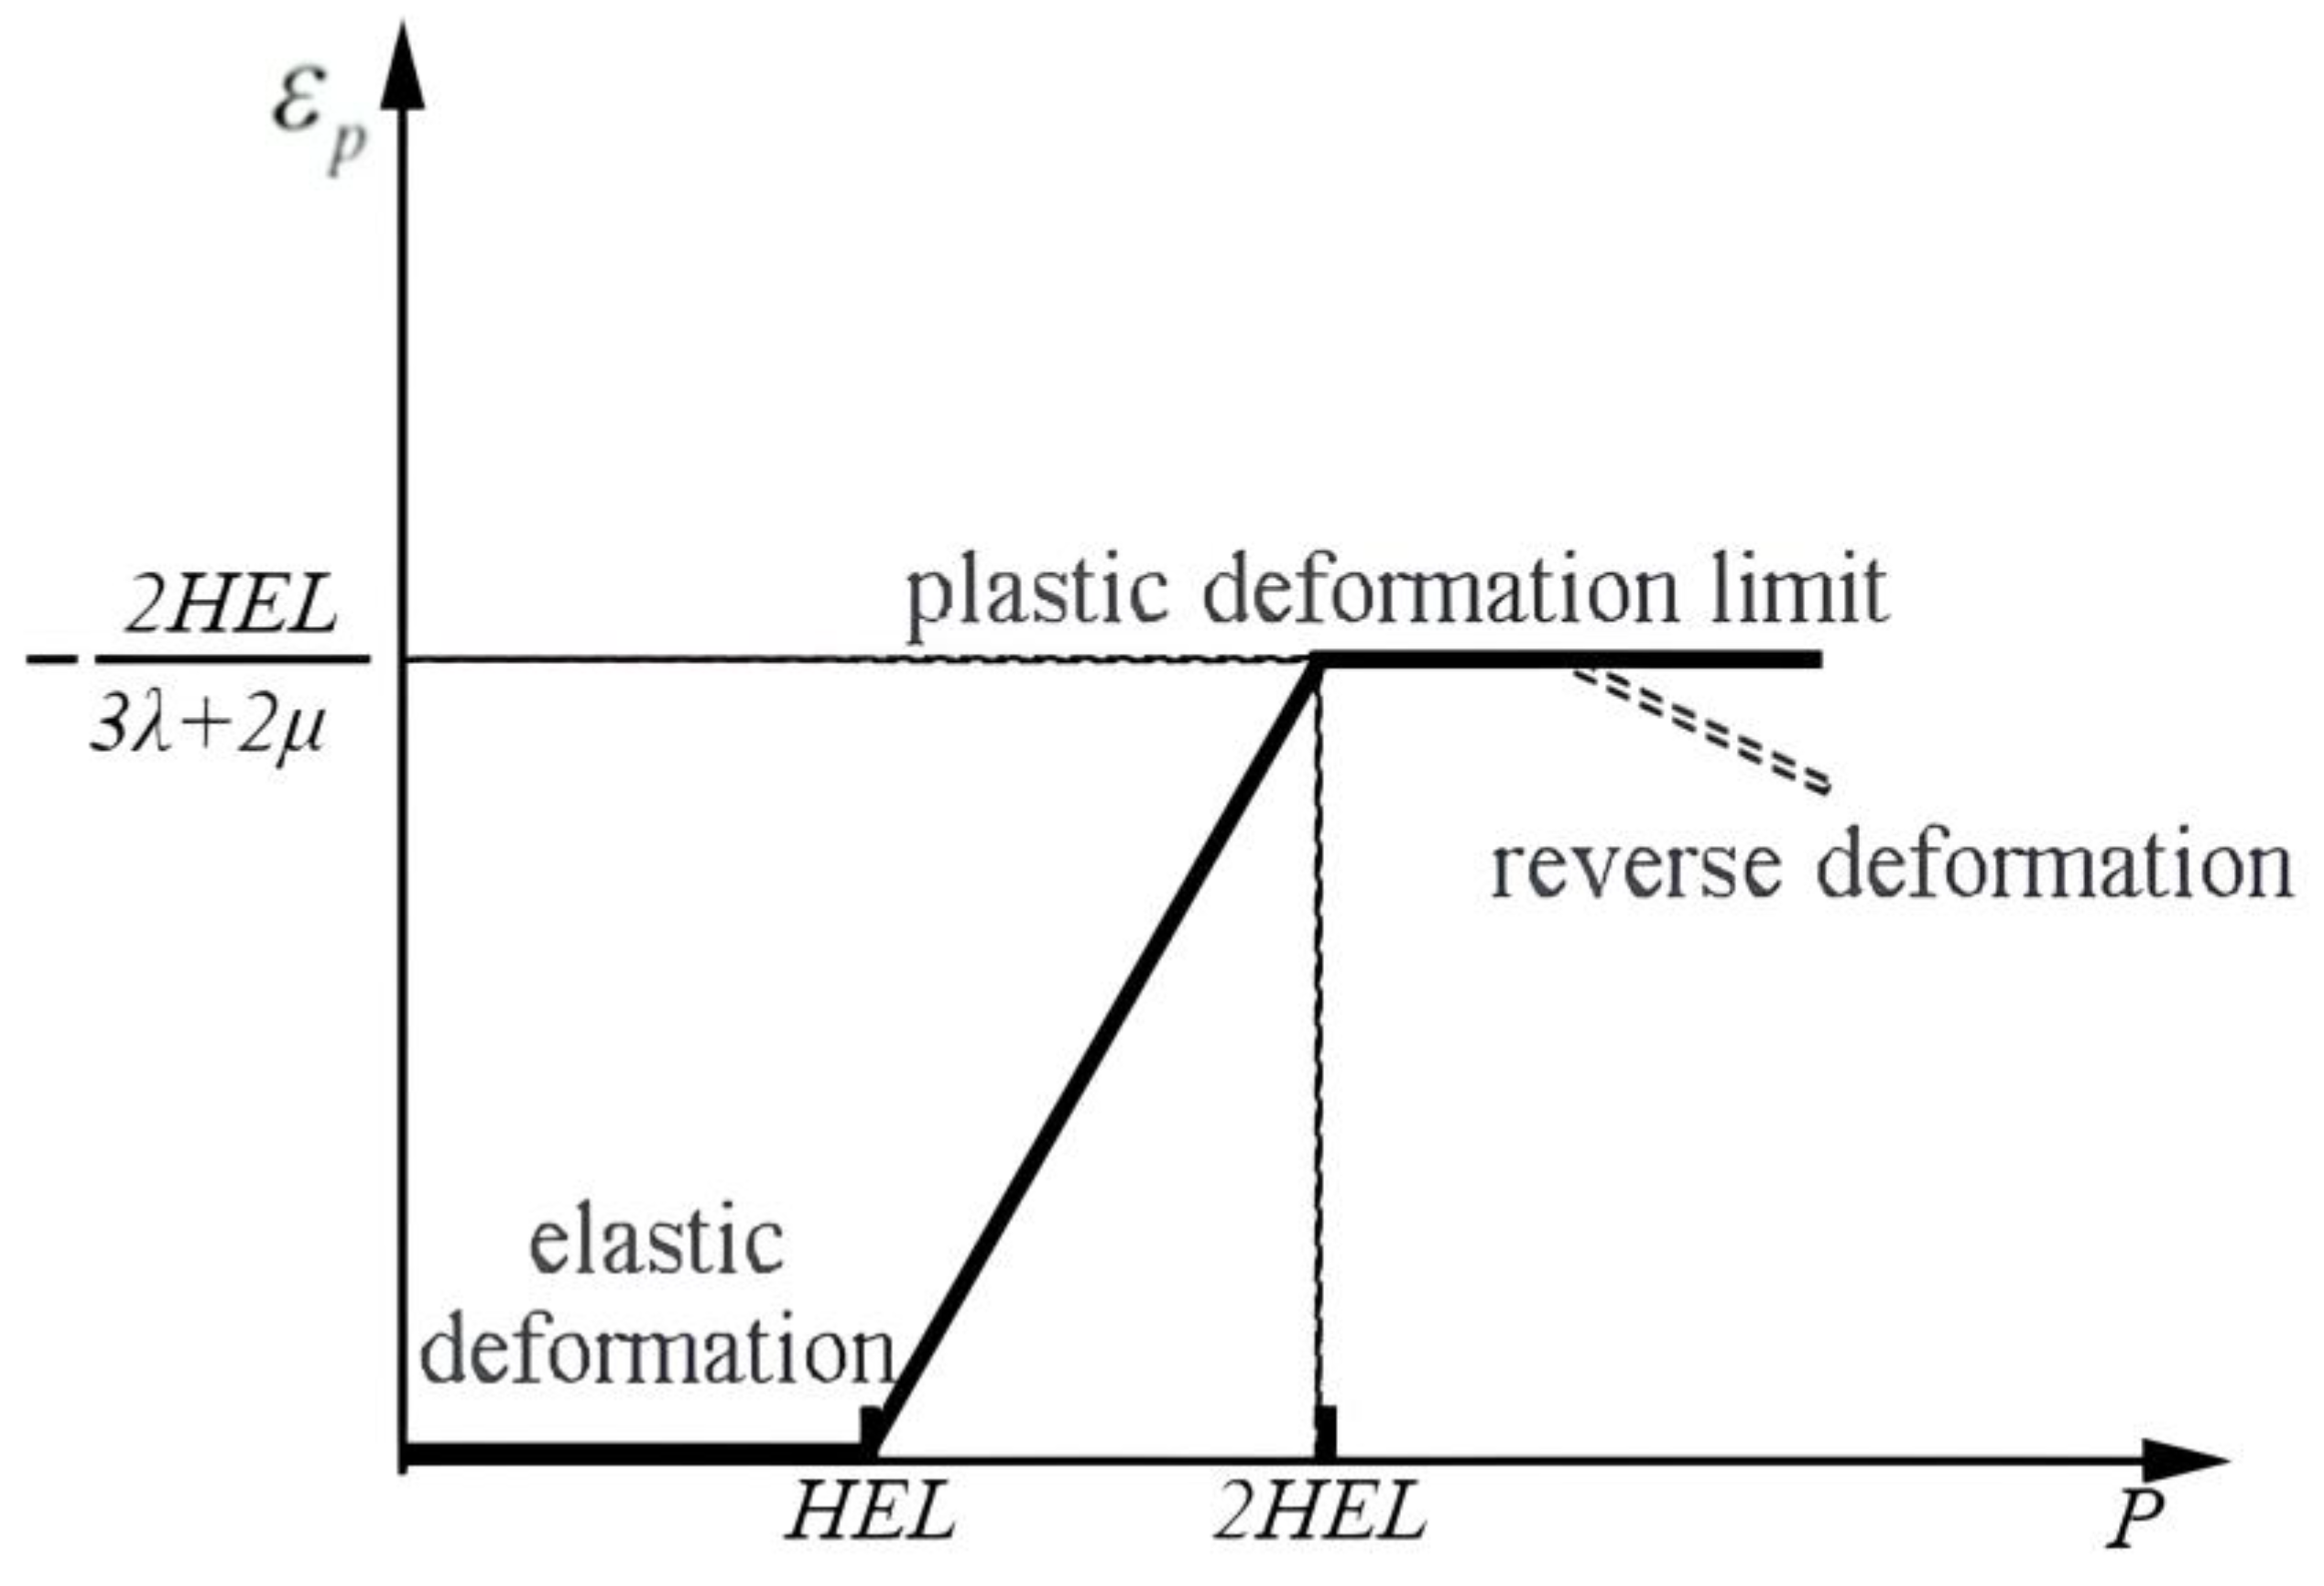
Based on the Hugoniot elastic limit, the simulation parameters were determined to explore the strengthening effect of the specimen. The simulation results showed that the specimen obtained the best strengthening effect under a peak pressure of 3000 MPa.
(2)
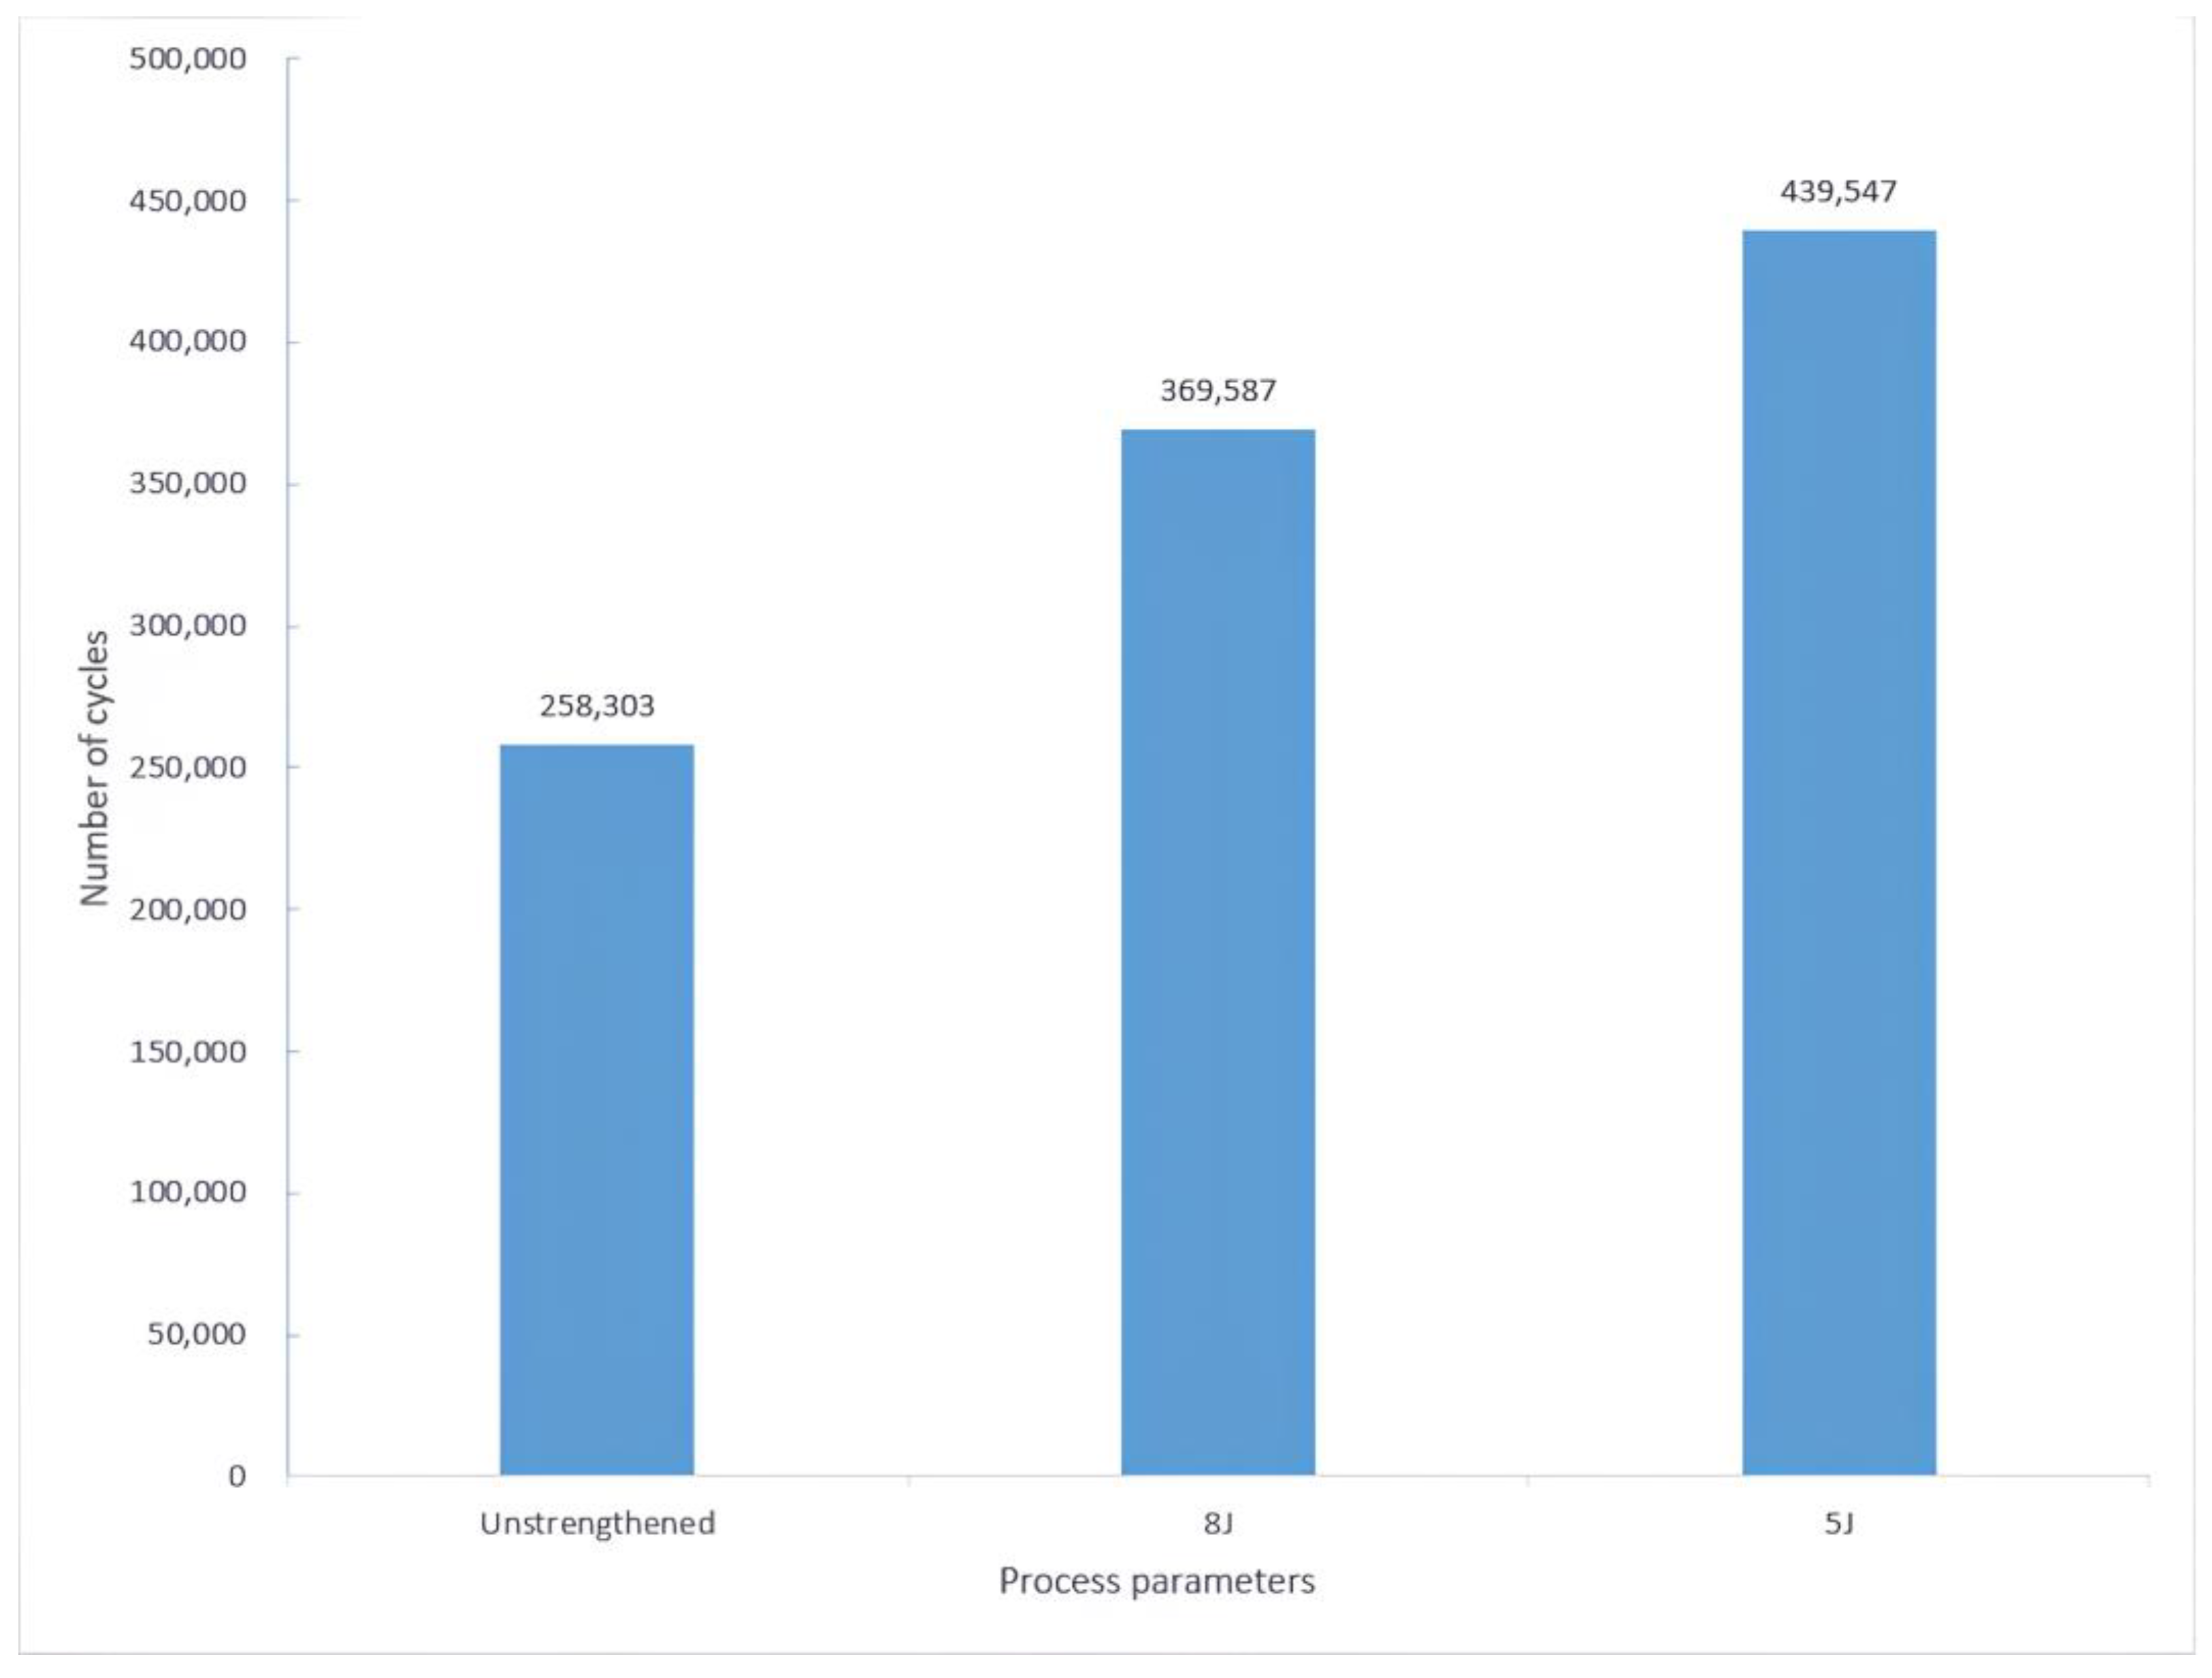
Fatigue tests were conducted on the specimens, and the fatigue life of the specimens was compared before and after strengthening. The results showed that the fatigue life improvement was the highest under the 3J and 2 mm parameters, which is consistent with the optimal strengthening effect under the corresponding simulation of 3000 MPa.
(3)
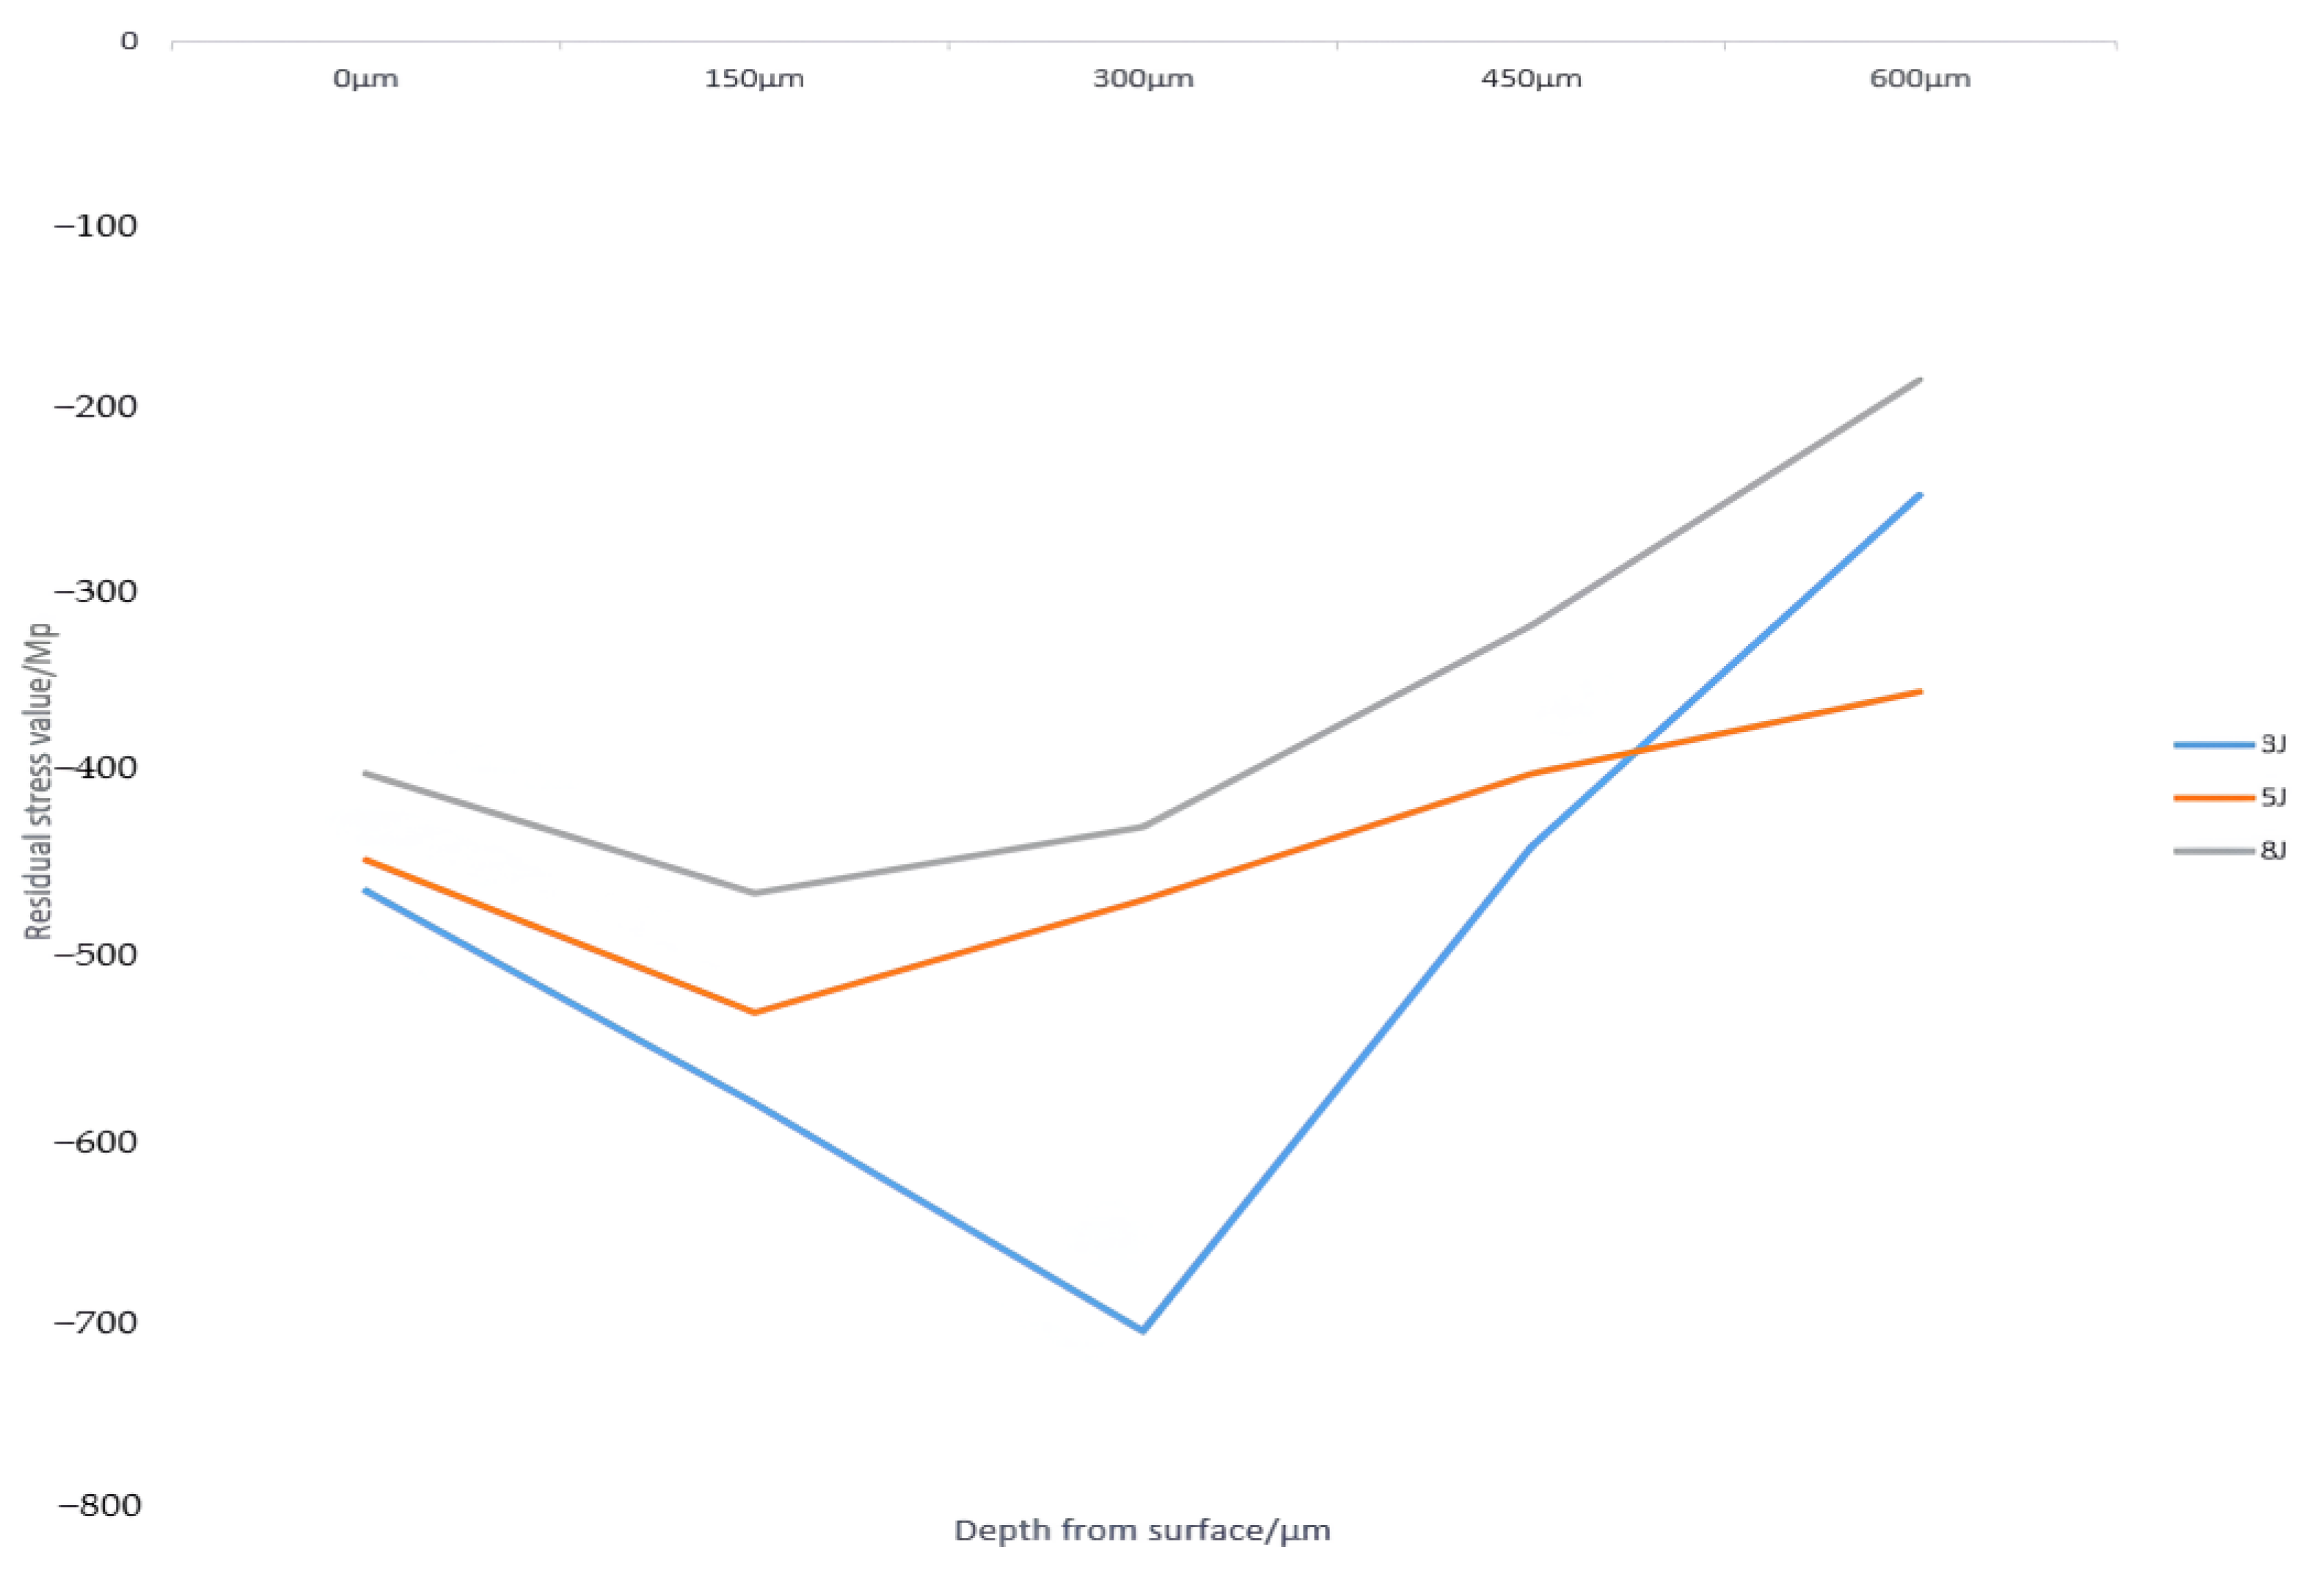
After laser shock peening, a deep residual compressive stress layer can be generated on the surface of the material, which can effectively suppress the initiation and expansion of surface cracks, and the suppression of cracks can improve the fatigue life. Among them, the best stress effect was generated under the parameters 3J and 2 mm.
(4)
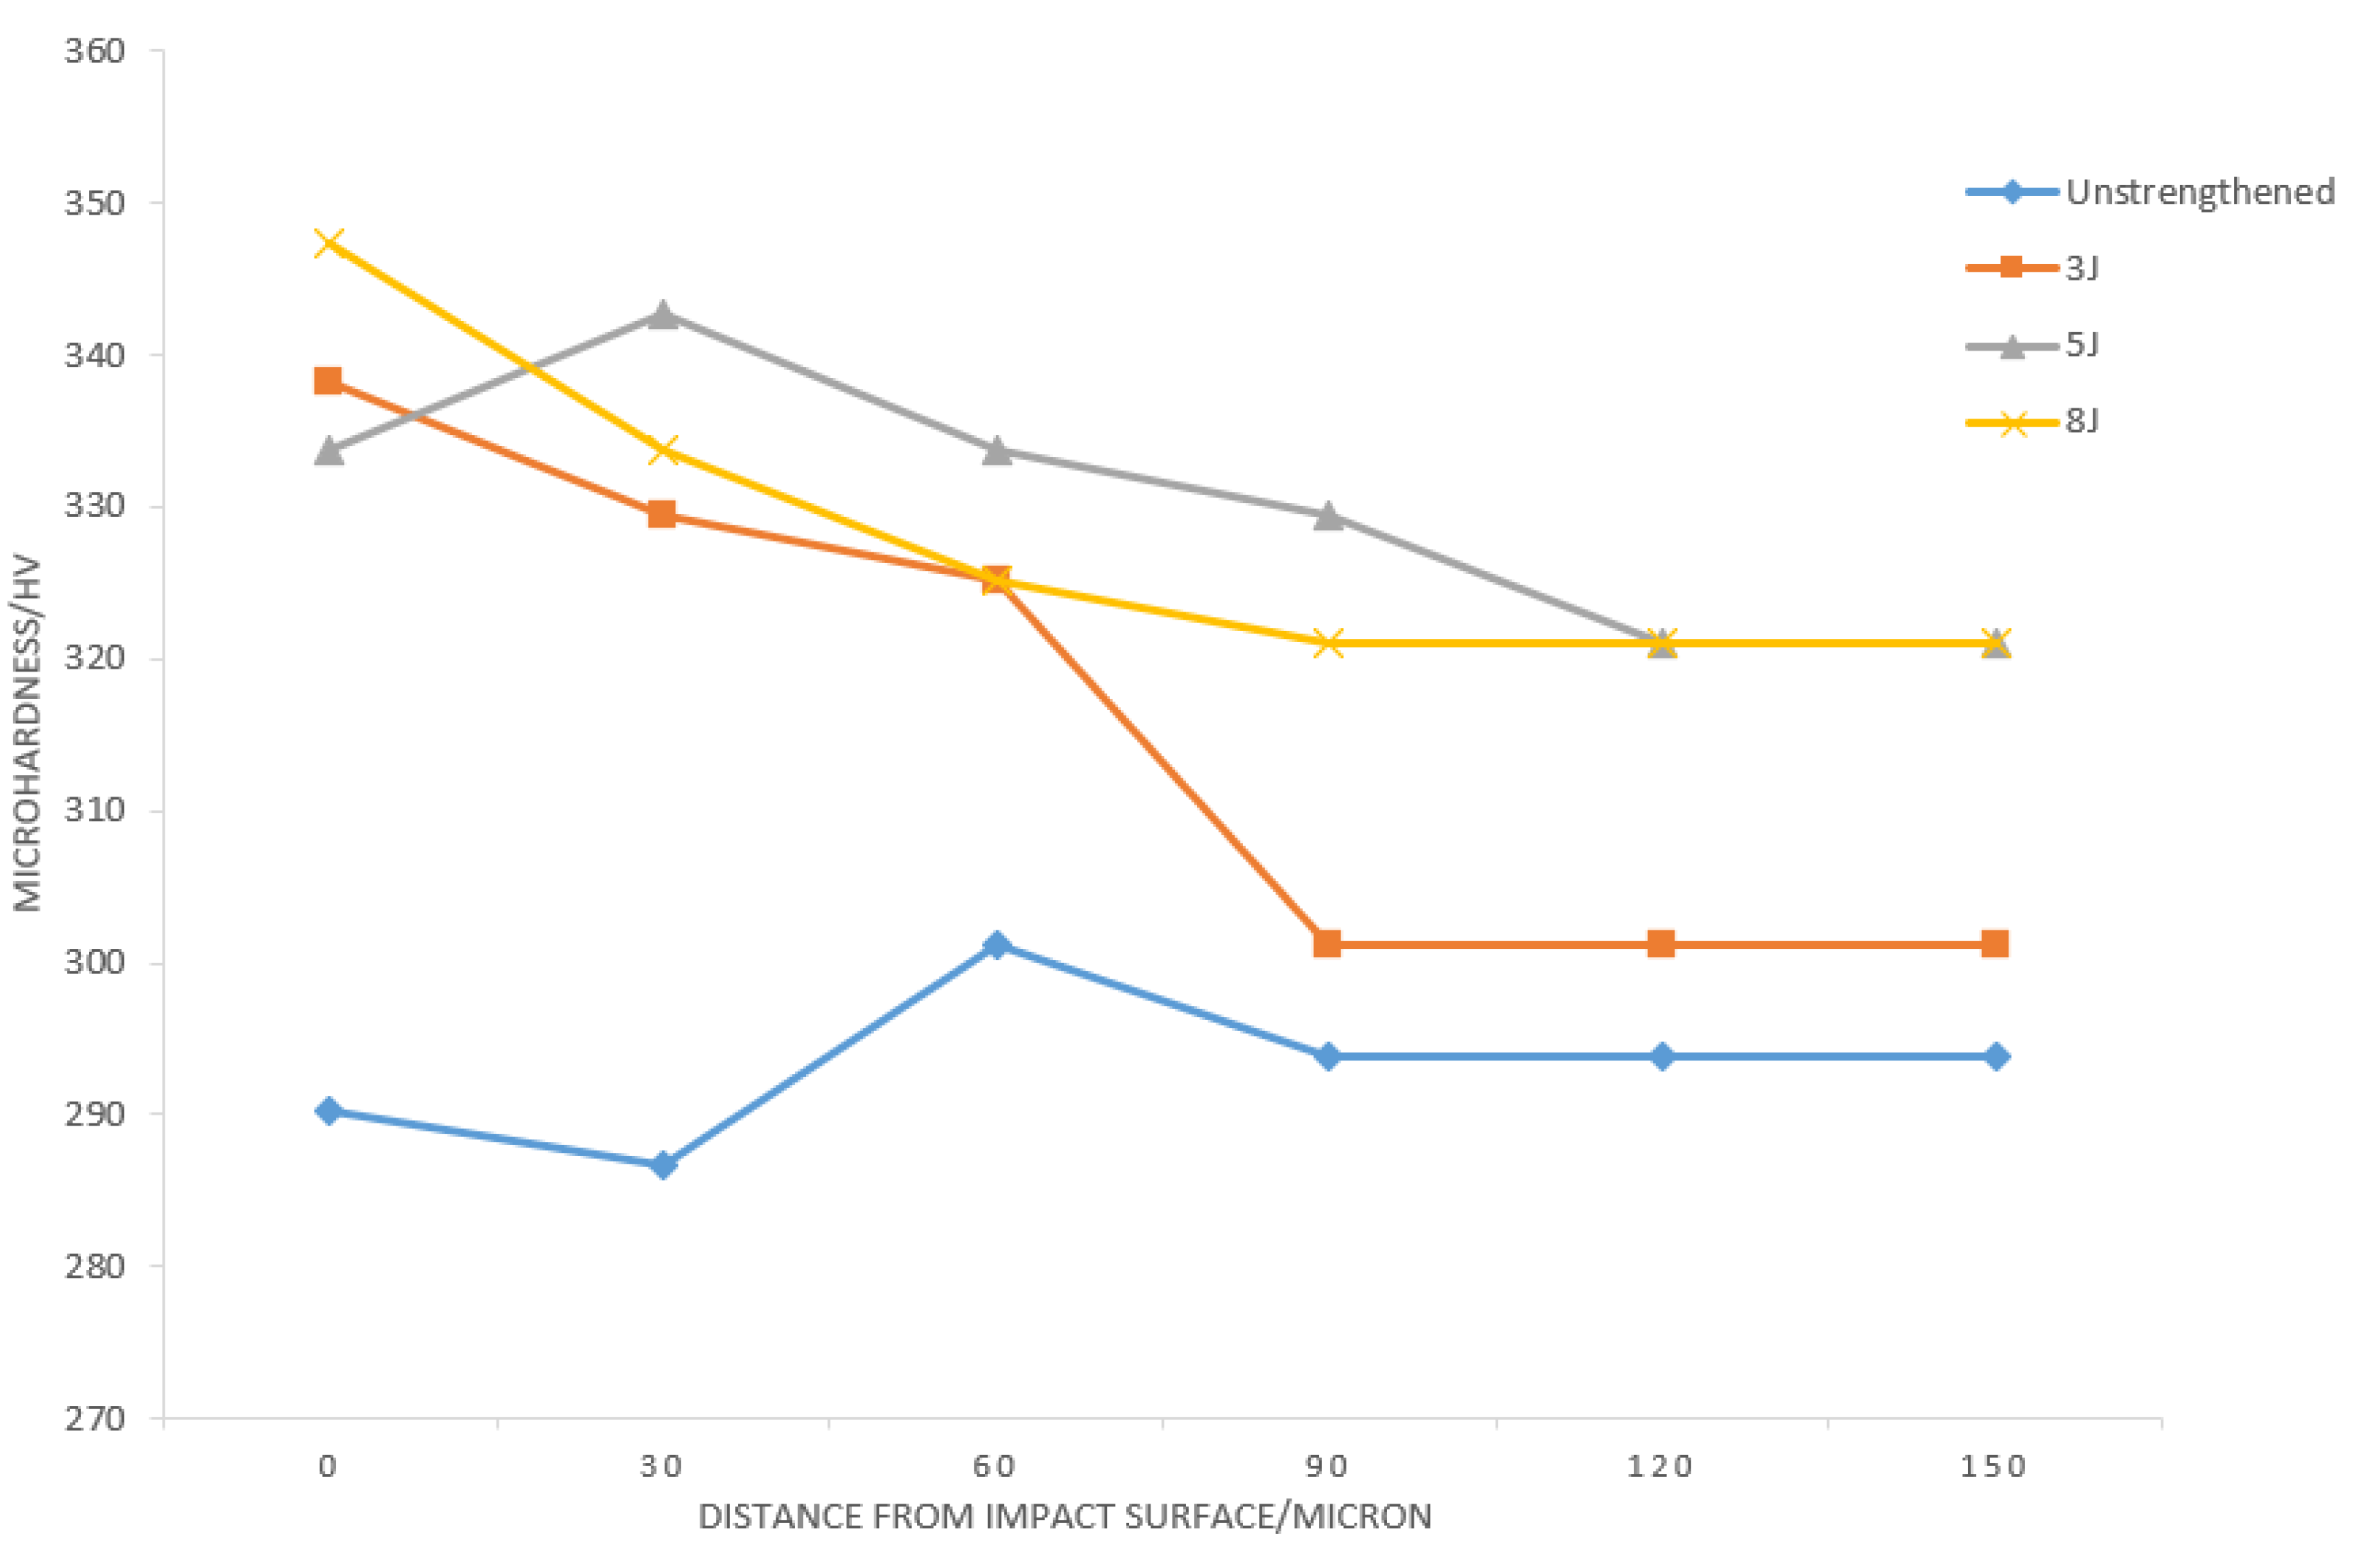
Laser shock peening can effectively improve the microhardness of the 1Cr18Ni9Ti’s surface, but its strengthening effect weakens with increasing depth. The maximum microhardness can be increased by 19.3% under the 8J process, 17.7% under the 5J process, and 16.2% under the 3J process. The increase in hardness also indicates an increase in fatigue strength.
(5)
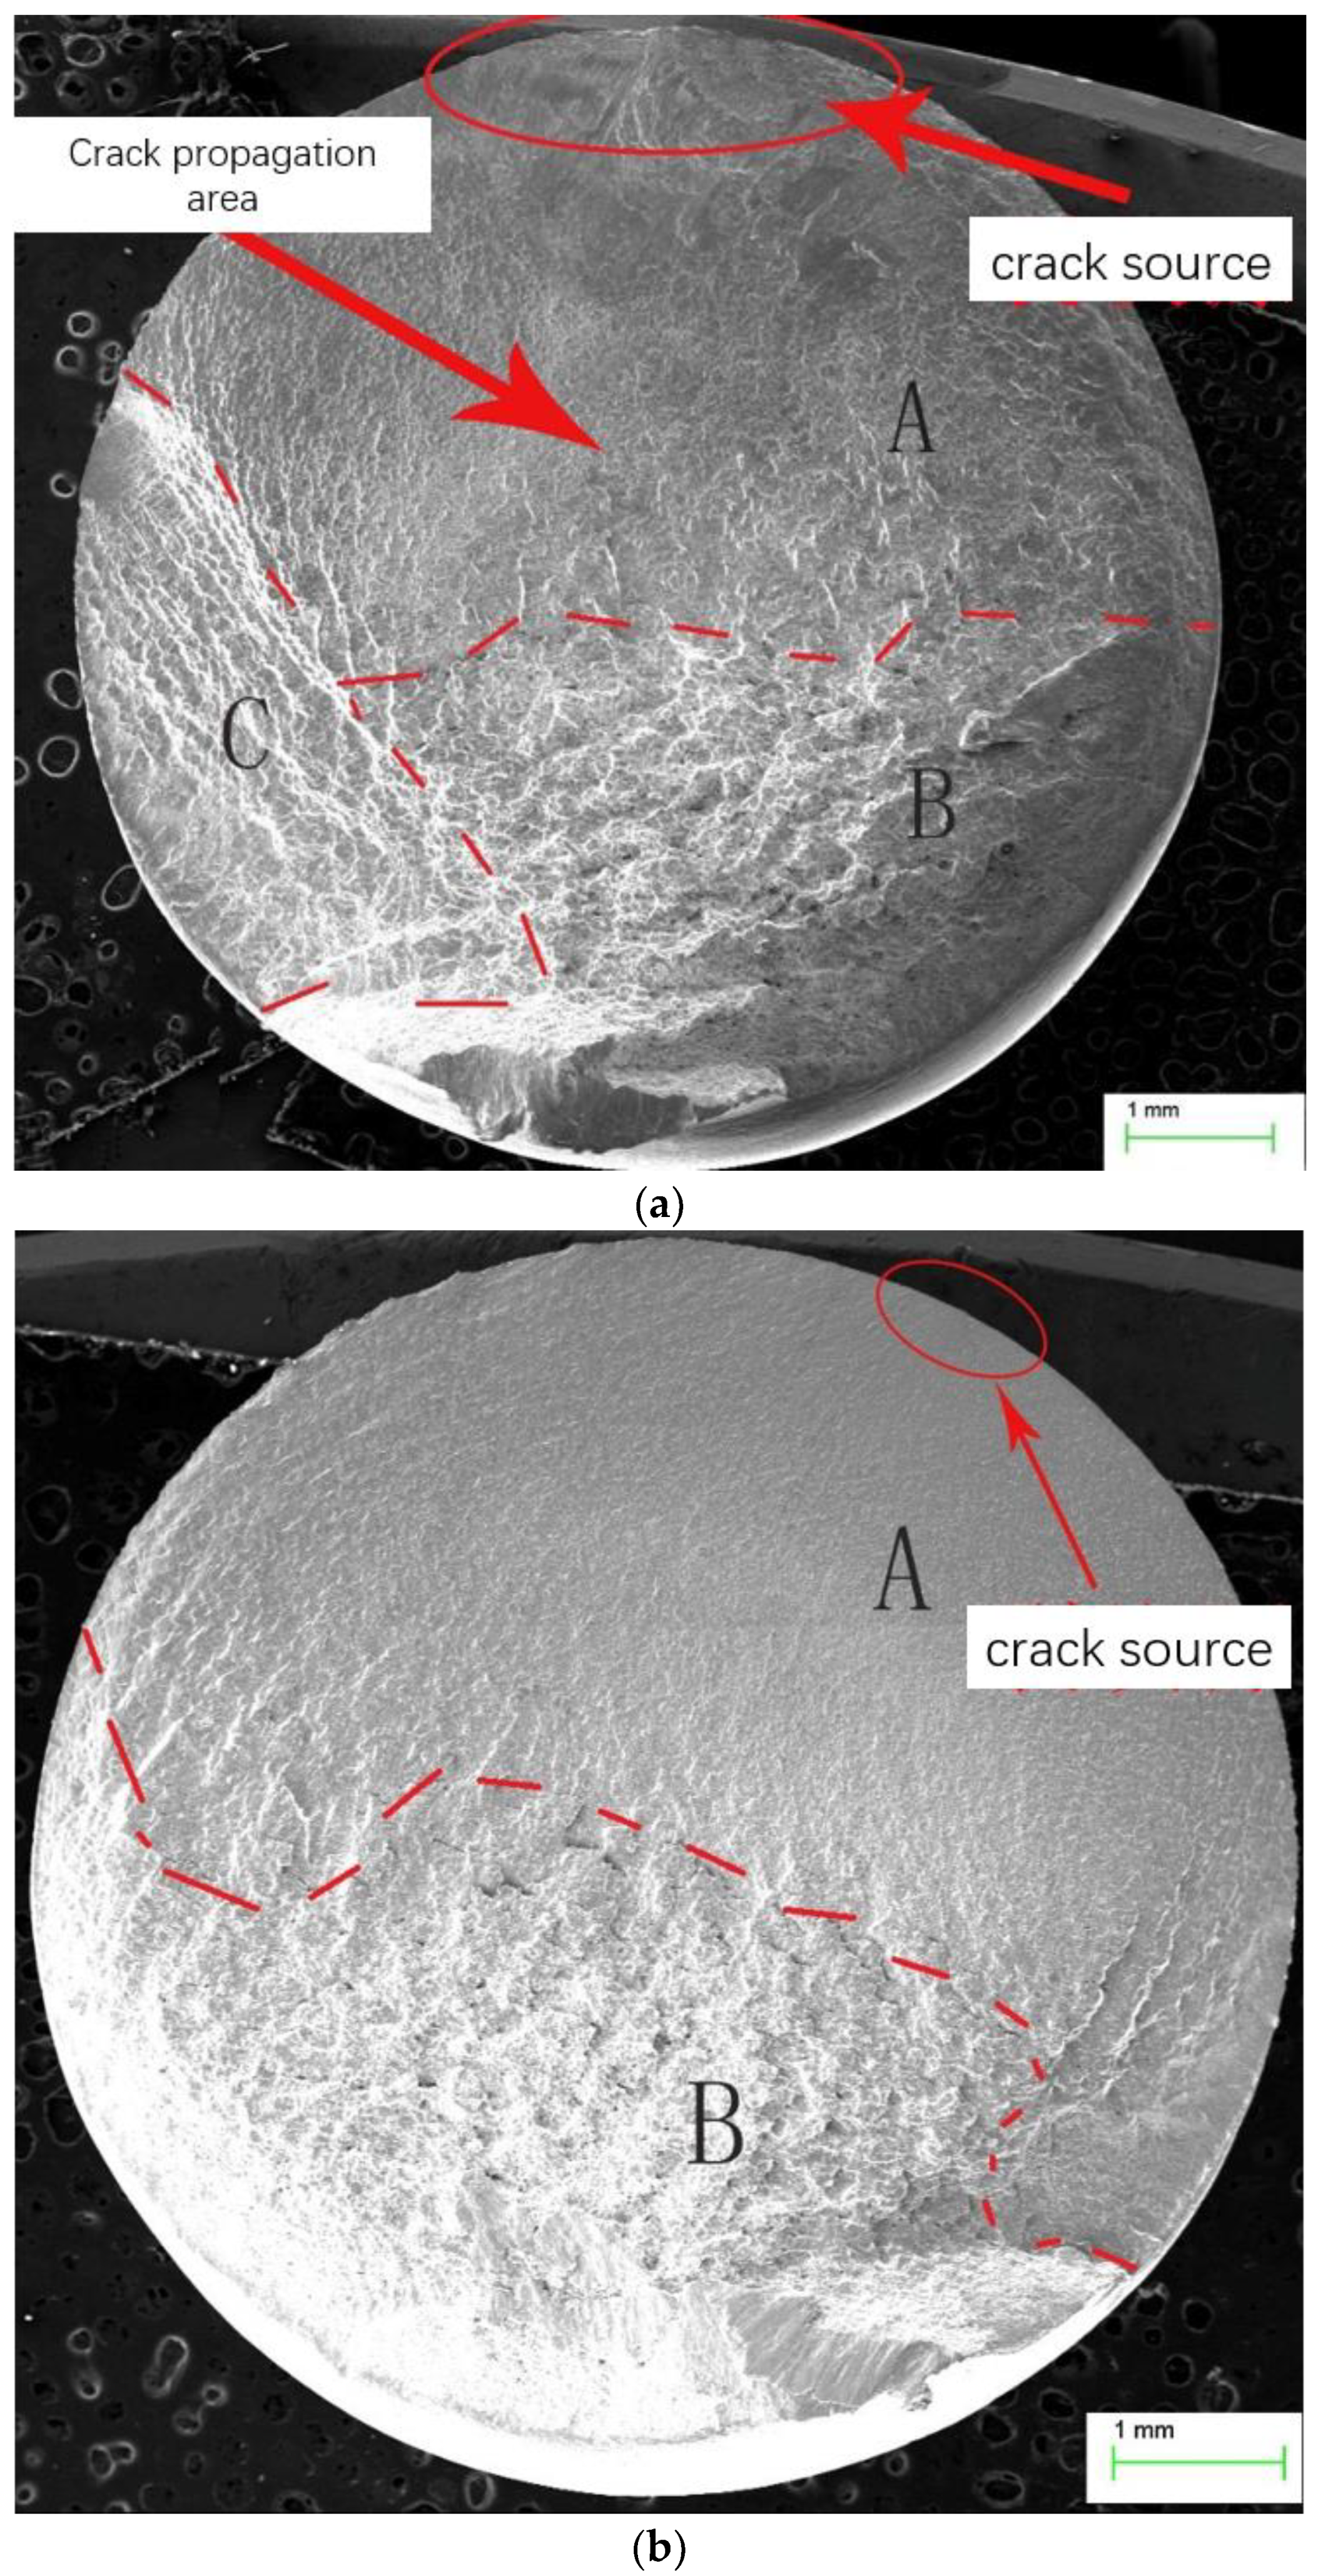
Scanning electron microscope observation of the fatigue fracture and EBSD experiments found that a high density of dislocations occurred inside the specimen after impact, which was able to delay the expansion rate of fatigue cracks inside the specimen, thus prolonging the fatigue life of the specimen, and the fast fracture zone of the treated specimen showed rough dimples of a relatively large size and depth, thus explaining the reason for the increase of the fatigue life of the material due to the laser-strengthening effect, from a microscopic point of view. The best effect of grain refinement was achieved with the 3J process.
The above experimental results showed that the specimens were optimally strengthened under the parameters 3J and 2 mm, which is consistent with the optimal strengthening effect under the simulated peak pressure of 3000 MPa.
According to the above results, the fatigue performance of the 1Cr18Ni9Ti material was significantly improved by laser impact strengthening, and it can be inferred that laser impact strengthening can improve the fatigue performance of aviation conduits made of the 1Cr18Ni9Ti material.

Author Contributions

X.D.: conceptualization, investigation, writing—original draft; S.M.: methodology, validation; J.Z. (Junlong Zhang): investigation, data curation; Z.J.: methodology; H.L.: investigation; S.W.: validation; C.W.: methodology; J.Z. (Jida Zhong): conceptualization, methodology, writing—review and editing. All authors have read and agreed to the published version of the manuscript.

Funding

This work was supported by the Key Research and Development Program of Jiangxi Province (Grant Number 20223BBE51004).

Data Availability Statement

The data that support the findings of this study are available from the corresponding author upon reasonable request.

Conflicts of Interest

The authors declare no conflict of interest.

References

  1. Zhuo, Y.; Chen, Y.; Yang, C. Research status and prospect of welding repair technology for aero-engine blades. Aerosp. Manuf. Technol. 2021, 64, 22–28. [Google Scholar]
  2. Logesh, M.; Selvabharathi, R.; Thangeeswari, T.; Palani, S. Influence of severe double shot peening on microstructure properties of Ti 6Al-4V and Titanium Grade 2 dissimilar joints using laser beam welding. Opt. Laser Technol. 2020, 123, 105883. [Google Scholar] [CrossRef]
  3. Leo, P.; D’Ostuni, S.; Nobile, R.; Mele, C.; Tarantino, A.; Casalino, G. Analysis of the process parameters, post-weld heat treatment and peening effects on microstructure and mechanical performance of Ti-Al dissimilar laser weldings. Metals 2021, 11, 1257. [Google Scholar] [CrossRef]
  4. Chattopadhyay, A.; Muvvala, G.; Sarkar, S.; Racherla, V.; Nath, A.K. Effect of laser shock peening on microstructural, mechanical and corrosion properties of laser beam welded commercially pure titanium. Opt. Laser Technol. 2021, 133, 106527. [Google Scholar]
  5. Feng, X.; Pan, X.; He, W.; Liu, P.; An, Z.; Zhou, L. Improving high cycle fatigue performance of gas tungsten arc welded Ti6Al4V titanium alloy by warm laser shock peening. Int. J. Fatigue 2021, 149, 106270. [Google Scholar] [CrossRef]
  6. Shi, X.; Feng, X.; Teng, J.; Zhang, K.; Zhou, L. Effect of laser shock peening on microstructure and fatigue properties of thin-wall welded Ti-6Al-4V alloy. Vacuum 2021, 184, 109986. [Google Scholar] [CrossRef]
  7. Trdan, U.; Skarba, M.; Grum, J. Laser shock peening effect on the dislocation transitions and grain refinement of Al–Mg–Si alloy. Mater. Charact. 2014, 97, 57–68. [Google Scholar]
  8. Peyre, P.; Carboni, C.; Forget, P.; Beranger, G.; Lemaitre, C.; Stuart, D. Influence of thermal and mechanical surface modifications induced by laser shock processing on the initiation of corrosion pits in 316L stainless steel. J. Mater. Sci. 2007, 42, 6866–6877. [Google Scholar] [CrossRef]
  9. Irizalp, S.G.; Saklakoglu, N.; Akman, E.; Demir, A. Pulsed Nd:YAG laser shock processing effects on mechanical properties of 6061-T6 alloy. Opt. Laser Technol. 2014, 56, 273–277. [Google Scholar] [CrossRef]
  10. Gao, Y.; Yang, W.; Huang, Z.; Lu, Z. Effects of residual stress and surface roughness on the fatigue life of nickel aluminium bronze alloy under laser shock peening. Eng. Fract. Mech. 2021, 244, 107524. [Google Scholar]
  11. Meng, L.; Zhao, S.; Liang, Z.; Lv, Y. Study on the Influence of Surface Roughness and Roughness Ratio on the Fatigue Performance of DD10 Alloy. Shanxi Metall. 2023, 46, 4–6+9. [Google Scholar]
  12. Fueki, R.; Takahashi, K. Improving the fatigue limit and rendering a defect harmless by laser peening for a high strength steel welded joint. Opt. Laser Technol. 2021, 134, 106605. [Google Scholar] [CrossRef]
  13. Soyama, H. Laser Cavitation Peening and Its Application for Improving the Fatigue Strength of Welded Parts. Metals 2021, 11, 531. [Google Scholar] [CrossRef]
  14. Soyama, H.; Simoncini, M.; Cabibbo, M. Effect of Cavitation Peening on Fatigue Properties in Friction Stir Welded Aluminum Alloy AA5754. Metals 2021, 11, 59. [Google Scholar] [CrossRef]
  15. Yu, K.; Wang, L.; Zhao, T.; Shu, S.; Zhou, L. Optimization of Residual Stress Field and Improvement of Fatigue Properties of Thin-Walled Pipes by Filling Laser Shock Peening. Metals 2022, 12, 1733. [Google Scholar] [CrossRef]
  16. Jiang, F.; Li, J.; Sun, J.; Zhang, S.; Wang, Z.; Yan, L. Al7050-T7451 turning simulation based on the modified power law material model. Int. J. Adv. Manuf. Technol. 2010, 48, 871–880. [Google Scholar] [CrossRef]
  17. Steinberg, D.J.; Cochran, S.G.; Guinan, M.W. A constitutive model for metals applicable at high rate. J. Appl. Phys. 1980, 51, 1498–1504. [Google Scholar] [CrossRef]
  18. Zerilli, F.J.; Armstrong, R.W. Dislocation-mechanics-based constitutive relations for materials dynamic calculations. J. Appl. Phys. 1987, 61, 1816–1825. [Google Scholar] [CrossRef]
  19. Johnson, G.R.; Cook, W.H. A constitutive model and data for metals subjected to large strains, high strain rates and high temperatures. In Proceedings of the 7th International Symposium on Ballistics, Hague, The Netherlands, 19–21 April 1983; pp. 541–547. [Google Scholar]
  20. Wu, J. Basic Research on Drilling Technology of Typical Difficult-to-Machine Materials. Ph.D. Thesis, Harbin Institute of Technology, Harbin, China, 2010; pp. 64–78. [Google Scholar]
  21. Chou, P.C.; Hopkins, A.K. Dynamic Response of Materials to Intense Impulsive Loading; Defense Technical Information Center: Belvoir, VA, USA, 1973. [Google Scholar]
  22. Ballard, P.; Fournier, J.; Fabbro, R.; Frelat, J. Residual stresses induced by laser-shocks. Le Journal de Physique IV 1991, 1, C3-487–C3-494. [Google Scholar] [CrossRef]
  23. Montross, C.S.; Wei, T.; Ye, L.; Clark, G.; Mai, Y.W. Laser shock processing and its effects on microstructure and properties of metal alloys: A review. Int. J. Fatigue 2002, 24, 1021–1036. [Google Scholar] [CrossRef]
  24. Ruschau, J.J.; John, R.; Thompson, S.R.; Nicholas, T. Fatigue crack nucleation and growth rate behavior of laser shock peened titanium. Int. J. Fatigue 1999, 21, S199–S209. [Google Scholar] [CrossRef]
  25. Zhang, Y.; You, J.; Lu, J.; Cui, C.; Jiang, Y.; Ren, X. Effects of laser shock processing on stress corrosion cracking susceptibility of AZ31B magnesium alloy. Surf. Coat. Technol. 2010, 204, 3947–3953. [Google Scholar] [CrossRef]
  26. Li, Y. Theory and Technology of Laser Impact Peening; Science Press: Beijing, China, 2013. [Google Scholar]
  27. Nie, X.; Long, N.; Liu, H.; He, W.; Li, Q. Effect of laser impact strengthening on surface hardness of TC17. Mech. Des. Manuf. 2012, 198–200. [Google Scholar] [CrossRef]
  28. Xiong, J.; Mao, W.; Yu, T. Effect of residual stress on fatigue crack extension. J. Hubei Inst. Technol. 1996, 4, 9–13. [Google Scholar]
  29. Zhou, L.; Zhao, T.; Yu, Y.; Liu, P.; Pan, X. Effect of Laser Shock Peening on High-Cycle Fatigue Performance of 1Cr18Ni9Ti/GH1140 Weld. Metals 2022, 12, 1495. [Google Scholar] [CrossRef]
  30. Sanchez, A.G.; You, C.; Leering, M.; Glaser, D.; Furfari, D.; Fitzpatrick, M.E.; Wharton, J.; Reed, P.A.S. Effects of laser shock peening on the mechanisms of fatigue short crack initiation and propagation of AA7075-T651. Int. J. Fatigue 2021, 143, 106025. [Google Scholar] [CrossRef]
  31. Zhang, W.; Simpson, C.A.; Lopez-Crespo, P.; Mokhtarishirzabad, M.; Buslaps, T.; Pippan, R.; Withers, P.J. The effect of grain size on the fatigue overload behaviour of nickel. Mater. Des. 2020, 189, 108526. [Google Scholar] [CrossRef]
Figure 1. Principles of laser shock peening.
Crystals 13 01279 g001
Figure 2. Fatigue test standard for metal materials GBT4337-2015.
Crystals 13 01279 g002
Figure 3. ABAQUS simulation model.
Crystals 13 01279 g003
Figure 4. Loads and boundary conditions schematics.
Crystals 13 01279 g004
Figure 5. Processing path diagram.
Crystals 13 01279 g005
Figure 6. A diagram of metal elastoplastic deformation as a function of impact peak pressure.
Crystals 13 01279 g006
Figure 7. A diagram of the impact-strengthening process.
Crystals 13 01279 g007
Figure 8. Cloud diagram of surface residual stress with different parameters.
Crystals 13 01279 g008
Figure 9. Enlarged cloud map of surface deformation at different parameters.
Crystals 13 01279 g009
Figure 10. Stress cloud in internal tensile direction under different parameters.
Crystals 13 01279 g010
Figure 11. Schematic of clamping and impact areas.
Crystals 13 01279 g011
Figure 12. Comparison of specimens before (a) and after (b) impact strengthening.
Crystals 13 01279 g012
Figure 13. Average number of cycles for different processes.
Crystals 13 01279 g013
Figure 14. Hardness measurement results.
Crystals 13 01279 g014
Figure 15. Residual stress line plot.
Crystals 13 01279 g015
Figure 16. The macroscopic fracture morphology of unreinforced specimens (a), specimens after 5J strengthening (b), and specimens after 8J strengthening (c).
Crystals 13 01279 g016aCrystals 13 01279 g016b
Figure 17. Images of transient fracture fatigue zone under different processes.
Crystals 13 01279 g017
Figure 18. EBSD plot and KAM plot for different processes.
Crystals 13 01279 g018
Figure 19. Distribution of large and small angular grain boundaries under different processes.
Crystals 13 01279 g019
Table 1. 1Cr18Ni9Ti material’s property parameters and Johnson–Cook model parameters.
Density ρ (kg∙m−3)Modulus of Elasticity E (MPa)Poisson Ratio μMelting Point of Material T (°C)A (MPa)B (MPa)Cnm
7930206,0000.2714462248570.010.2081.7855
Table 2. Summary of simulation results.
Peak PressureMaximum Residual Compressive Stress on the SurfaceThickness of Residual Compressive Stress LayerInternal Maximum Tensile StressMean Deformation
3000 MPa−274.5 MPa0.83 mm163.3 MPa3.26 μ m
4000 MPa−335.9 MPa0.96 mm238.8 MPa6.00 μ m
5000 MPa−383.2 MPa1.04 mm309.3 MPa9.05 μ m
Table 3. Conversion table of impact peak pressure and processing parameters.
PαZ1 (Target Material)Z2 (Constrained Layer)ZdτEI
3093 MPa0.24.34 × 106 g·cm−2·s−11.65 × 10⁵ g·cm−2·s−13.18 × 10⁵ g·cm−2·s−12 mm 3J4.77 Gw/cm2
4077 MPa20 ns5J7.32 Gw/cm2
5030 MPa 8J11.1 Gw/cm2
Table 4. Rotational bending fatigue test data.
Experimental Temperature (°C)Maximum Stress (MPa)Frequency of Tests (Hz)Stress Ratio RNumber of Cycles (Times)ResultsProcess Parameters
23540100−17026Failunprocessed
23500100−1102,080Fail
23470100−110,000,000Pass
23485100−110,000,000Pass
23493100−110,000,000Pass
23498100−1121,356Fail
23498100−1301,411Fail
23498100−1352,114Fail
23498100−1414,107Fail8J 2 mm
23498100−1325,067Fail
23498100−1492,191Fail5J 2 mm
23498100−1386,903Fail
23498100−110,000,000Pass3J 2 mm
23498100−110,000,000Pass
Table 5. Residual compressive stress results at different depths on the specimen surface.
Specimen 1 (3J, 2 mm)Specimen 2 (5J, 2 mm)Specimen 3 (8J, 2 mm)
0 μm (depths)−464 MPa−447 MPa−400 MPa
150 μm−579 MPa−530 MPa−465 MPa
300 μm−704 MPa−468 MPa−429 MPa
450 μm−439 MPa−400 MPa−319 MPa
600 μm−248 MPa−355 MPa−185 MPa
Disclaimer/Publisher’s Note: The statements, opinions and data contained in all publications are solely those of the individual author(s) and contributor(s) and not of MDPI and/or the editor(s). MDPI and/or the editor(s) disclaim responsibility for any injury to people or property resulting from any ideas, methods, instructions or products referred to in the content.

