1. Introduction
Texture modelling has become a powerful tool to predict metal deformation behaviours from macro- to micro-scale (e.g., [
1,
2]). Among these various crystal plasticity (CP) models, the so-called ‘full-field’ CP finite element (CPFE) model is supposed to be the best one for modelling the texture evolution [
2,
3,
4]. The CPFE model introduces CP constitutive laws into the finite element (FE) package; the FE solves the boundary problems and the CP model is used to determine the plastic deformation at material points [
5]. In each FE increment, the equilibrium in all elements is met with fundamental mechanical principles [
2], which results in an obvious demerit: huge computation time. Increasing the mesh resolution is beneficial to improving the texture prediction [
4,
6,
7,
8], but reducing the element size results in a huge computation time. This explains why the mesh refinement ratios are very low in the literature, usually below 100 [
5,
6]. In this research, Submodelling was applied to a small region with fine mesh. The Submodel successfully reproduced the predictions in the Wholemodel, and the computation time was exceedingly reduced.
2. Materials and Experiments
High-purity aluminium alloy sheets were processed using rolling in this work. The material was fully annealed at 450 °C for 2 h, and sheet materials were cut into a dimension of 200 mm (length) × 40 mm (width) × 2 mm (thickness). The rolling at 50% reduction was performed on a rolling mill, consisting of 125 mm diameter rolls. After rolling, electron backscattered diffraction (EBSD) scans were performed to characterize the through-thickness textures on the rolling direction (RD)–normal direction (ND) plane. The EBSD samples were taken from the sheet centre, and the cross-section was mechanically ground and then polished up to 1 µm and finally electro-polished (16 °C, 25 V) in an A3 Struers electrolyte. EBSD scans were performed with a working distance of 15 mm and an accelerating voltage of 15 kV. HKL Channel-5 was used to postprocess the EBSD scanning.
3. Submodel Modelling
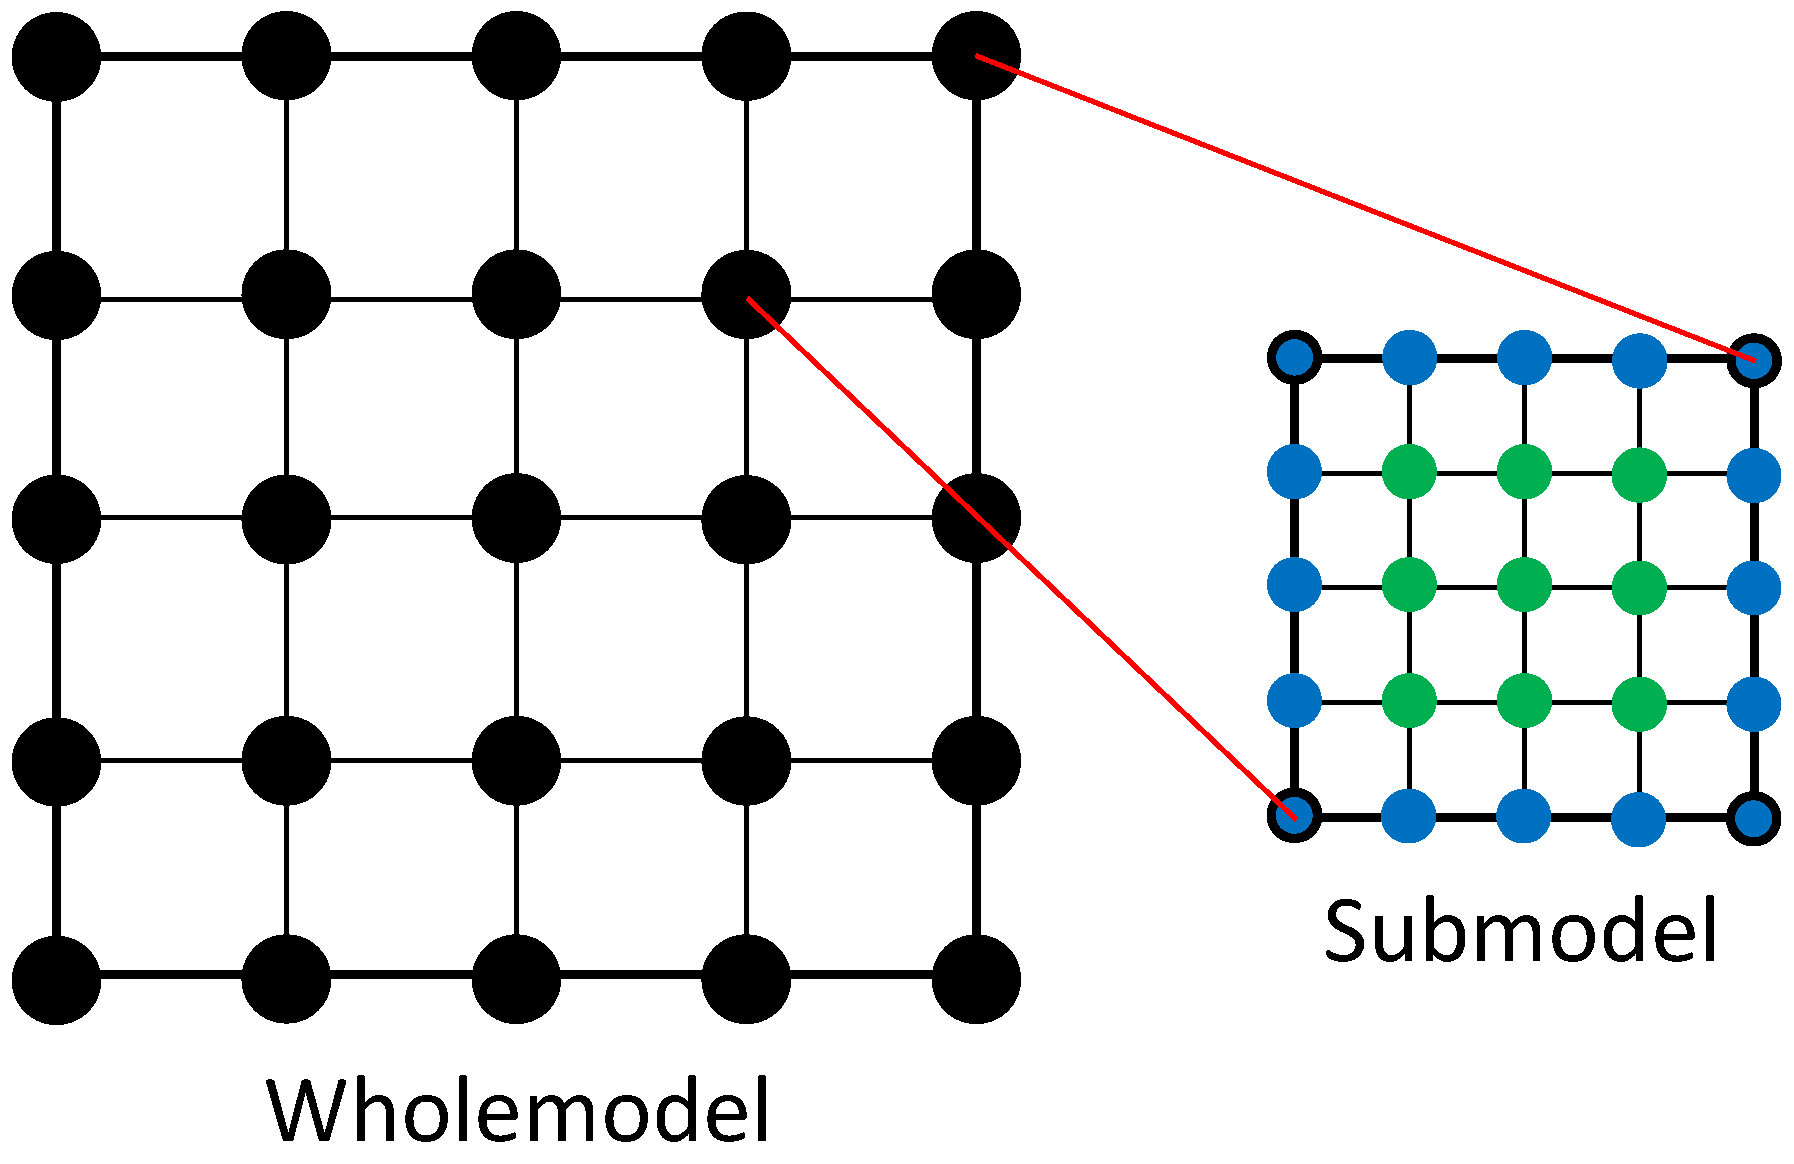
When employing FE modelling, there is a trade-off between computation time and mesh resolution, and thus the mesh refinement ratios are usually low. Submodelling is an alternative to assess a feature region, as this method is schematically shown in
Figure 1. A coarse-mesh Wholemodel (whole sample) is firstly developed and then numerically solved. A critical part is selected and reconstructed in a fine-mesh Submodel. The displacement of nodes on the driven surface (in blue), which is extracted from the Wholemodel, acts as the boundary conditions for the Submodel, while the inner nodes (in green) are free to move according to the Submodel deformation.
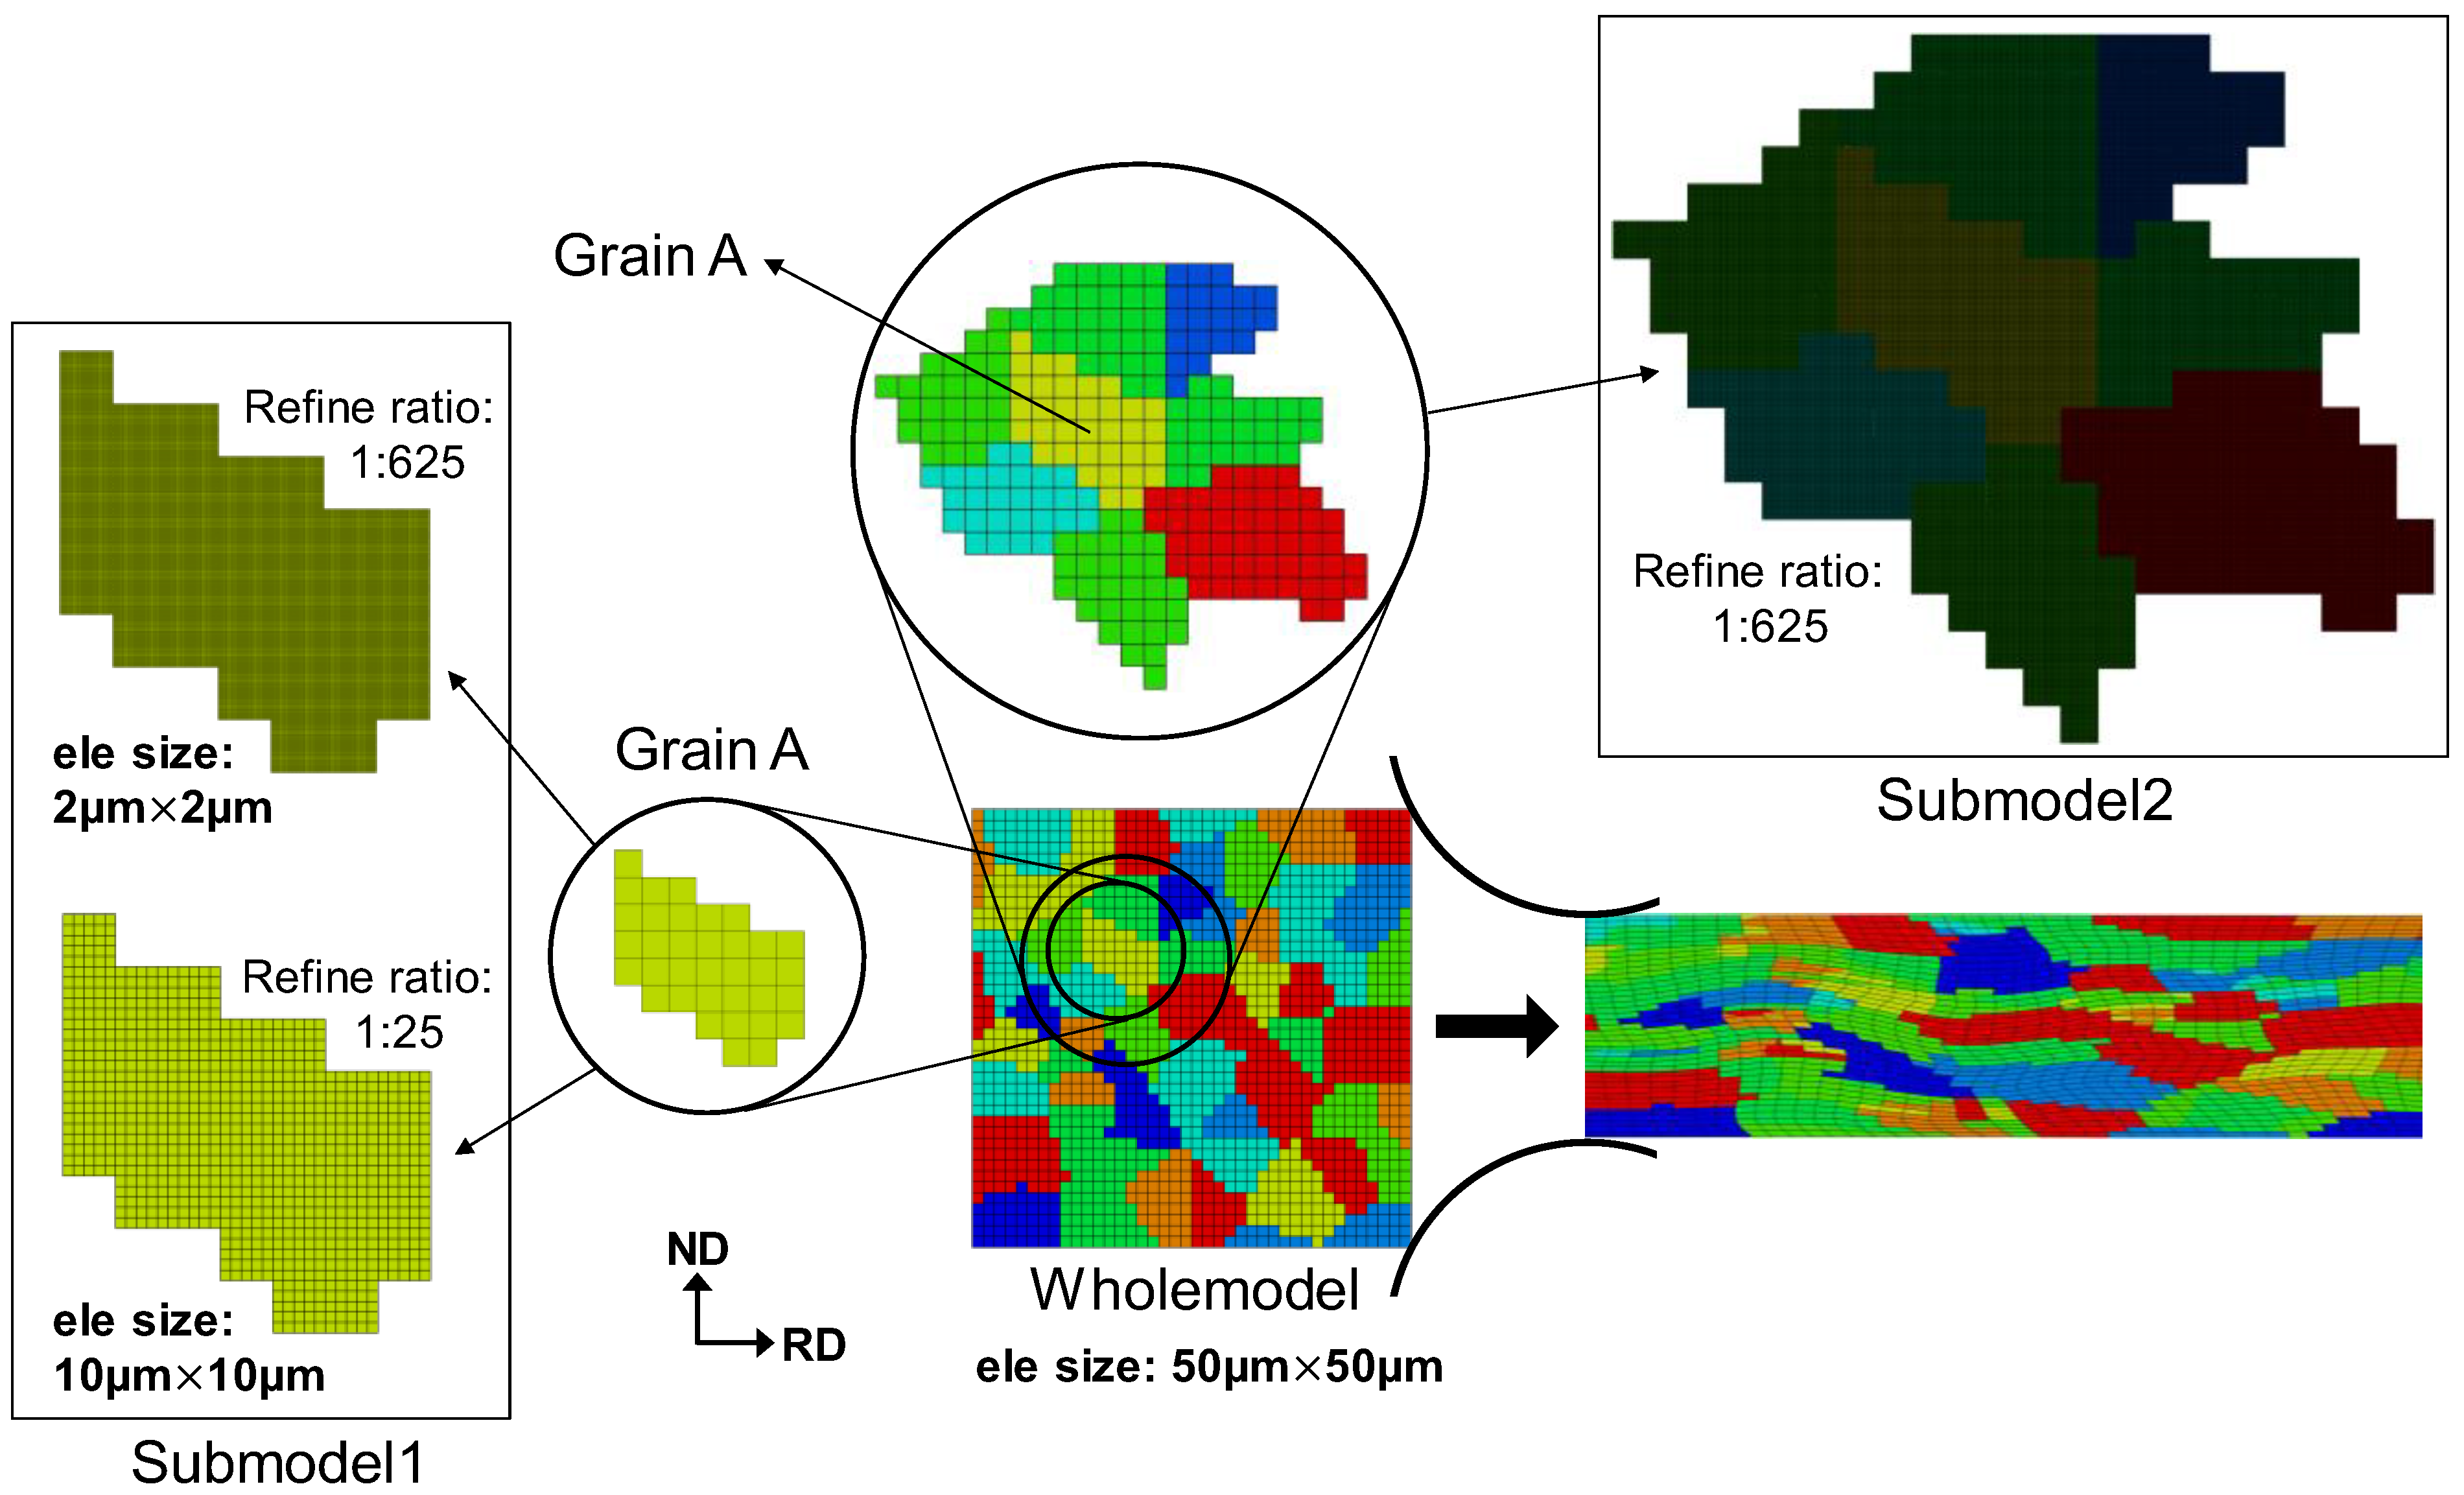
The simulation, following the experimental conditions and procedure, was carried out using the commercial FE package Abaqus/Standard ver.6.9. A two-dimensional FE model under plain-strain conditions was developed. The rolls (125 mm in diameter) were modelled as analytical rigid bodies. The element type is CPE4R, four-node elements with a reduced integration point. A polycrystal model with a coarse mesh (element size: 50 µm
50 µm), i.e., Wholemodel, was developed, as shown in
Figure 2. After the Wholemodel, a feature region, Grain A in
Figure 2, was reconstructed in the Submodel-1 and was then finely meshed with refinement ratios of 1:25 and 1:625. In the former and latter cases, one Wholemodel element was divided into 25 elements (element size: 10 µm
10 µm) and 625 elements (element size: 2 µm
2 µm), respectively. The element size of 2 µm
2 µm in the Submodel-1 is comparably large as the step size used in EBSD scans. In the Submodel-2 (
Figure 2), not only Grain A but also its neighbouring grains were included. Grain A in the Submodel-2 was driven by the neighbouring grains, which are supposed to apply relatively ‘soft’ boundary conditions on Grain A. When Submodelling, the initial grain orientations in both the Wholemodel and Submodel were kept the same.
The well-recognized kinematical scheme developed by Asaro [
8] and the widely adopted Bassani–Wu hardening model [
9,
10] were used in this study. The material parameters were identified by matching the predictions to the experimental results compression [
11]. Textures in different processes have been successfully captured by this CPFE model [
3,
12,
13], which proves the reliability and capability of this CPFE model. The crystal plasticity constitutive law, hardening model and material parameters, as well as the CPFE implement, have been given in Ref. [
3].
4. Results
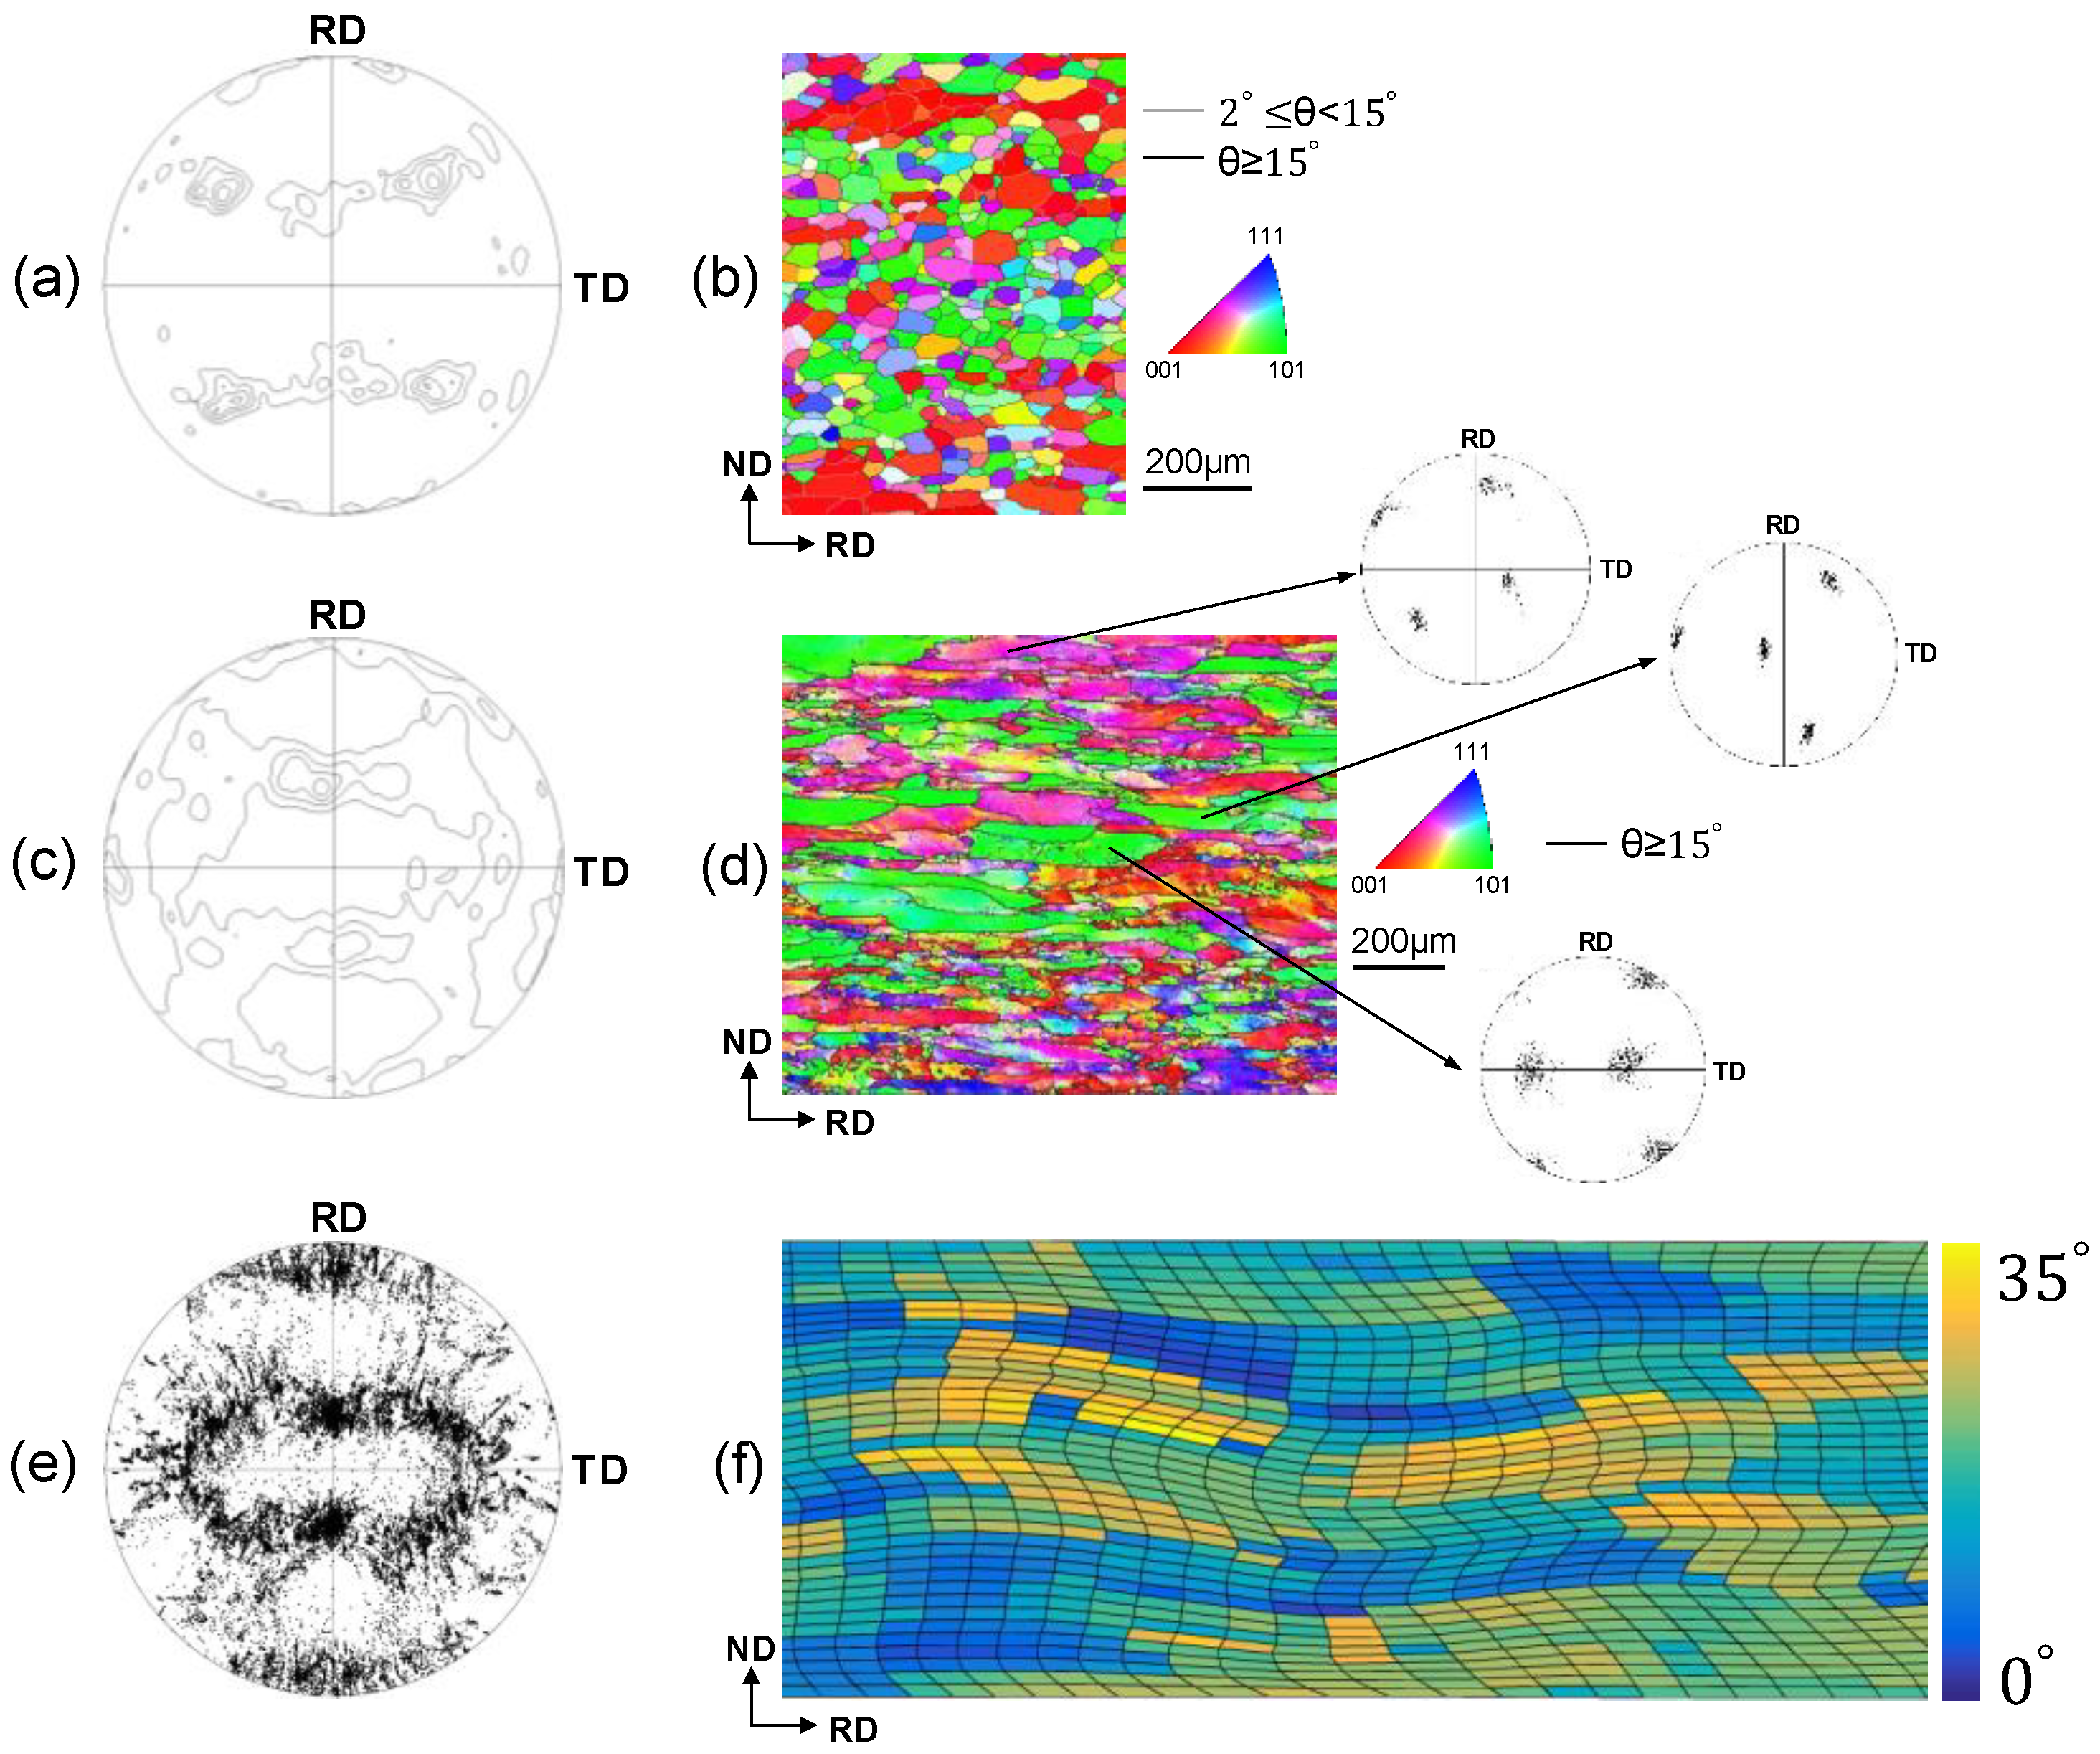
Figure 3a,b show a (1 1 1) pole figure and EBSD map of the starting material, respectively. The initial texture is a recrystallized texture, i.e., [
5] <0 0 1> Cube dominated (
Figure 3a), and only a small number of low-angle grain boundaries (LAGBs) (2°
<
) in grains can be seen (
Figure 3b). After rolling, the global texture evolved into a rolling texture (
Figure 3c), typically consisting of {1 1 2}<1 1 1>, {1 2 3}<6 3 4> and {1 1 0}<1 1 2>. The high-angle grain boundaries (HAGBs) in
Figure 3d are believed to be from the original ones but did not evolve during rolling, and the subgrain and LAGBs formed within the initially annealed grains. The pole figures of three representative grains are shown on the right of
Figure 3d, from which it can be seen that an in-grain subdivision occurred and initially uniform in-grain orientations became scattered.
The predicted global texture from the Wholemodel (
Figure 3e) reproduces the experimental observation in
Figure 3c. After rolling, texture gradients developed in the Wholemodel (
Figure 3f), which means an in-grain subdivision also occurred. However, compared to the step size in
Figure 3d, the mesh resolution in the Wholemodel (
Figure 3f) was exceedingly low. From
Figure 3, it can be concluded that an acceptable global texture can be captured by the coarse-mesh Wholemodel.
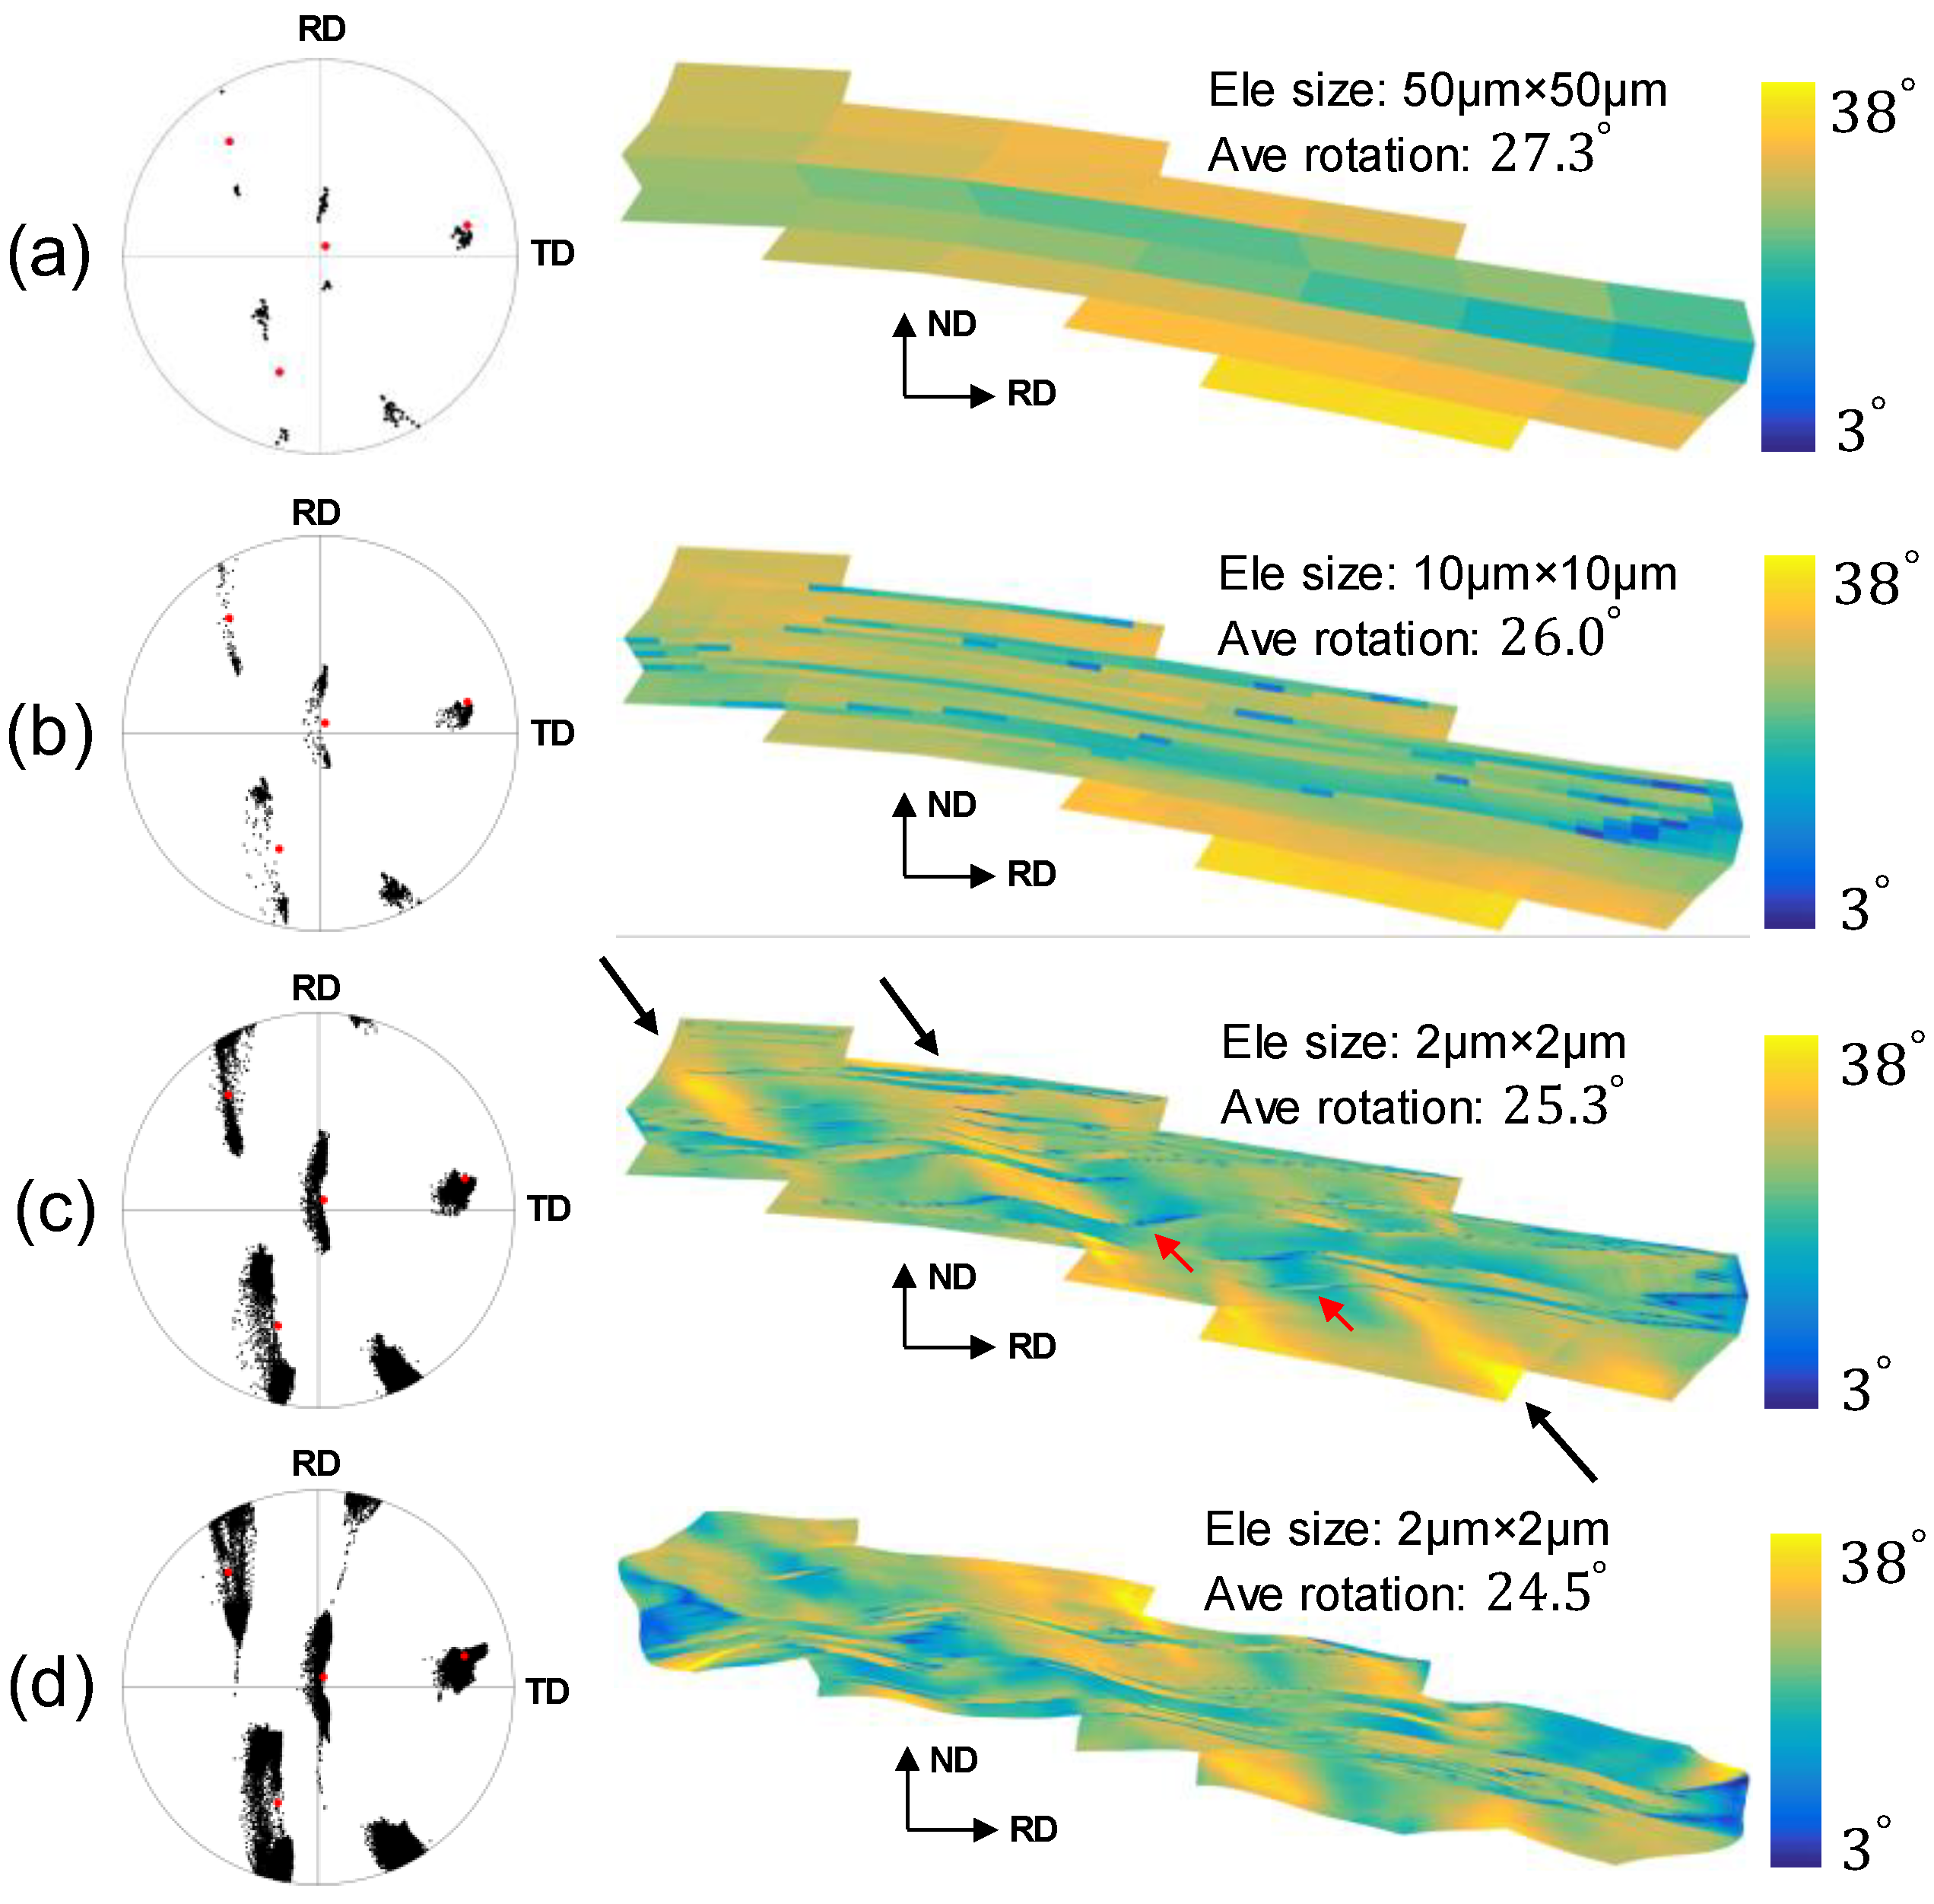
The texture evolution of Grain A in the Wholemodel is shown in
Figure 4a, and only a few elements were used to describe the in-grain texture; thus, the texture gradient is very high. As for the Submodel-1, a similar texture of Grain A was reproduced with the refinement ratio of 1:25 (
Figure 4b), where the intensities of major texture components were strengthened and subtle components were also captured. The texture prediction was further improved by increasing the refinement ratio to 1:625 (
Figure 4c), and macroscopic shear bands (marked by black arrows) and microscopic shear bands (red arrows) were also predicted. The predictions in the Submodel-2 1:625 (
Figure 4d) are similar to those in
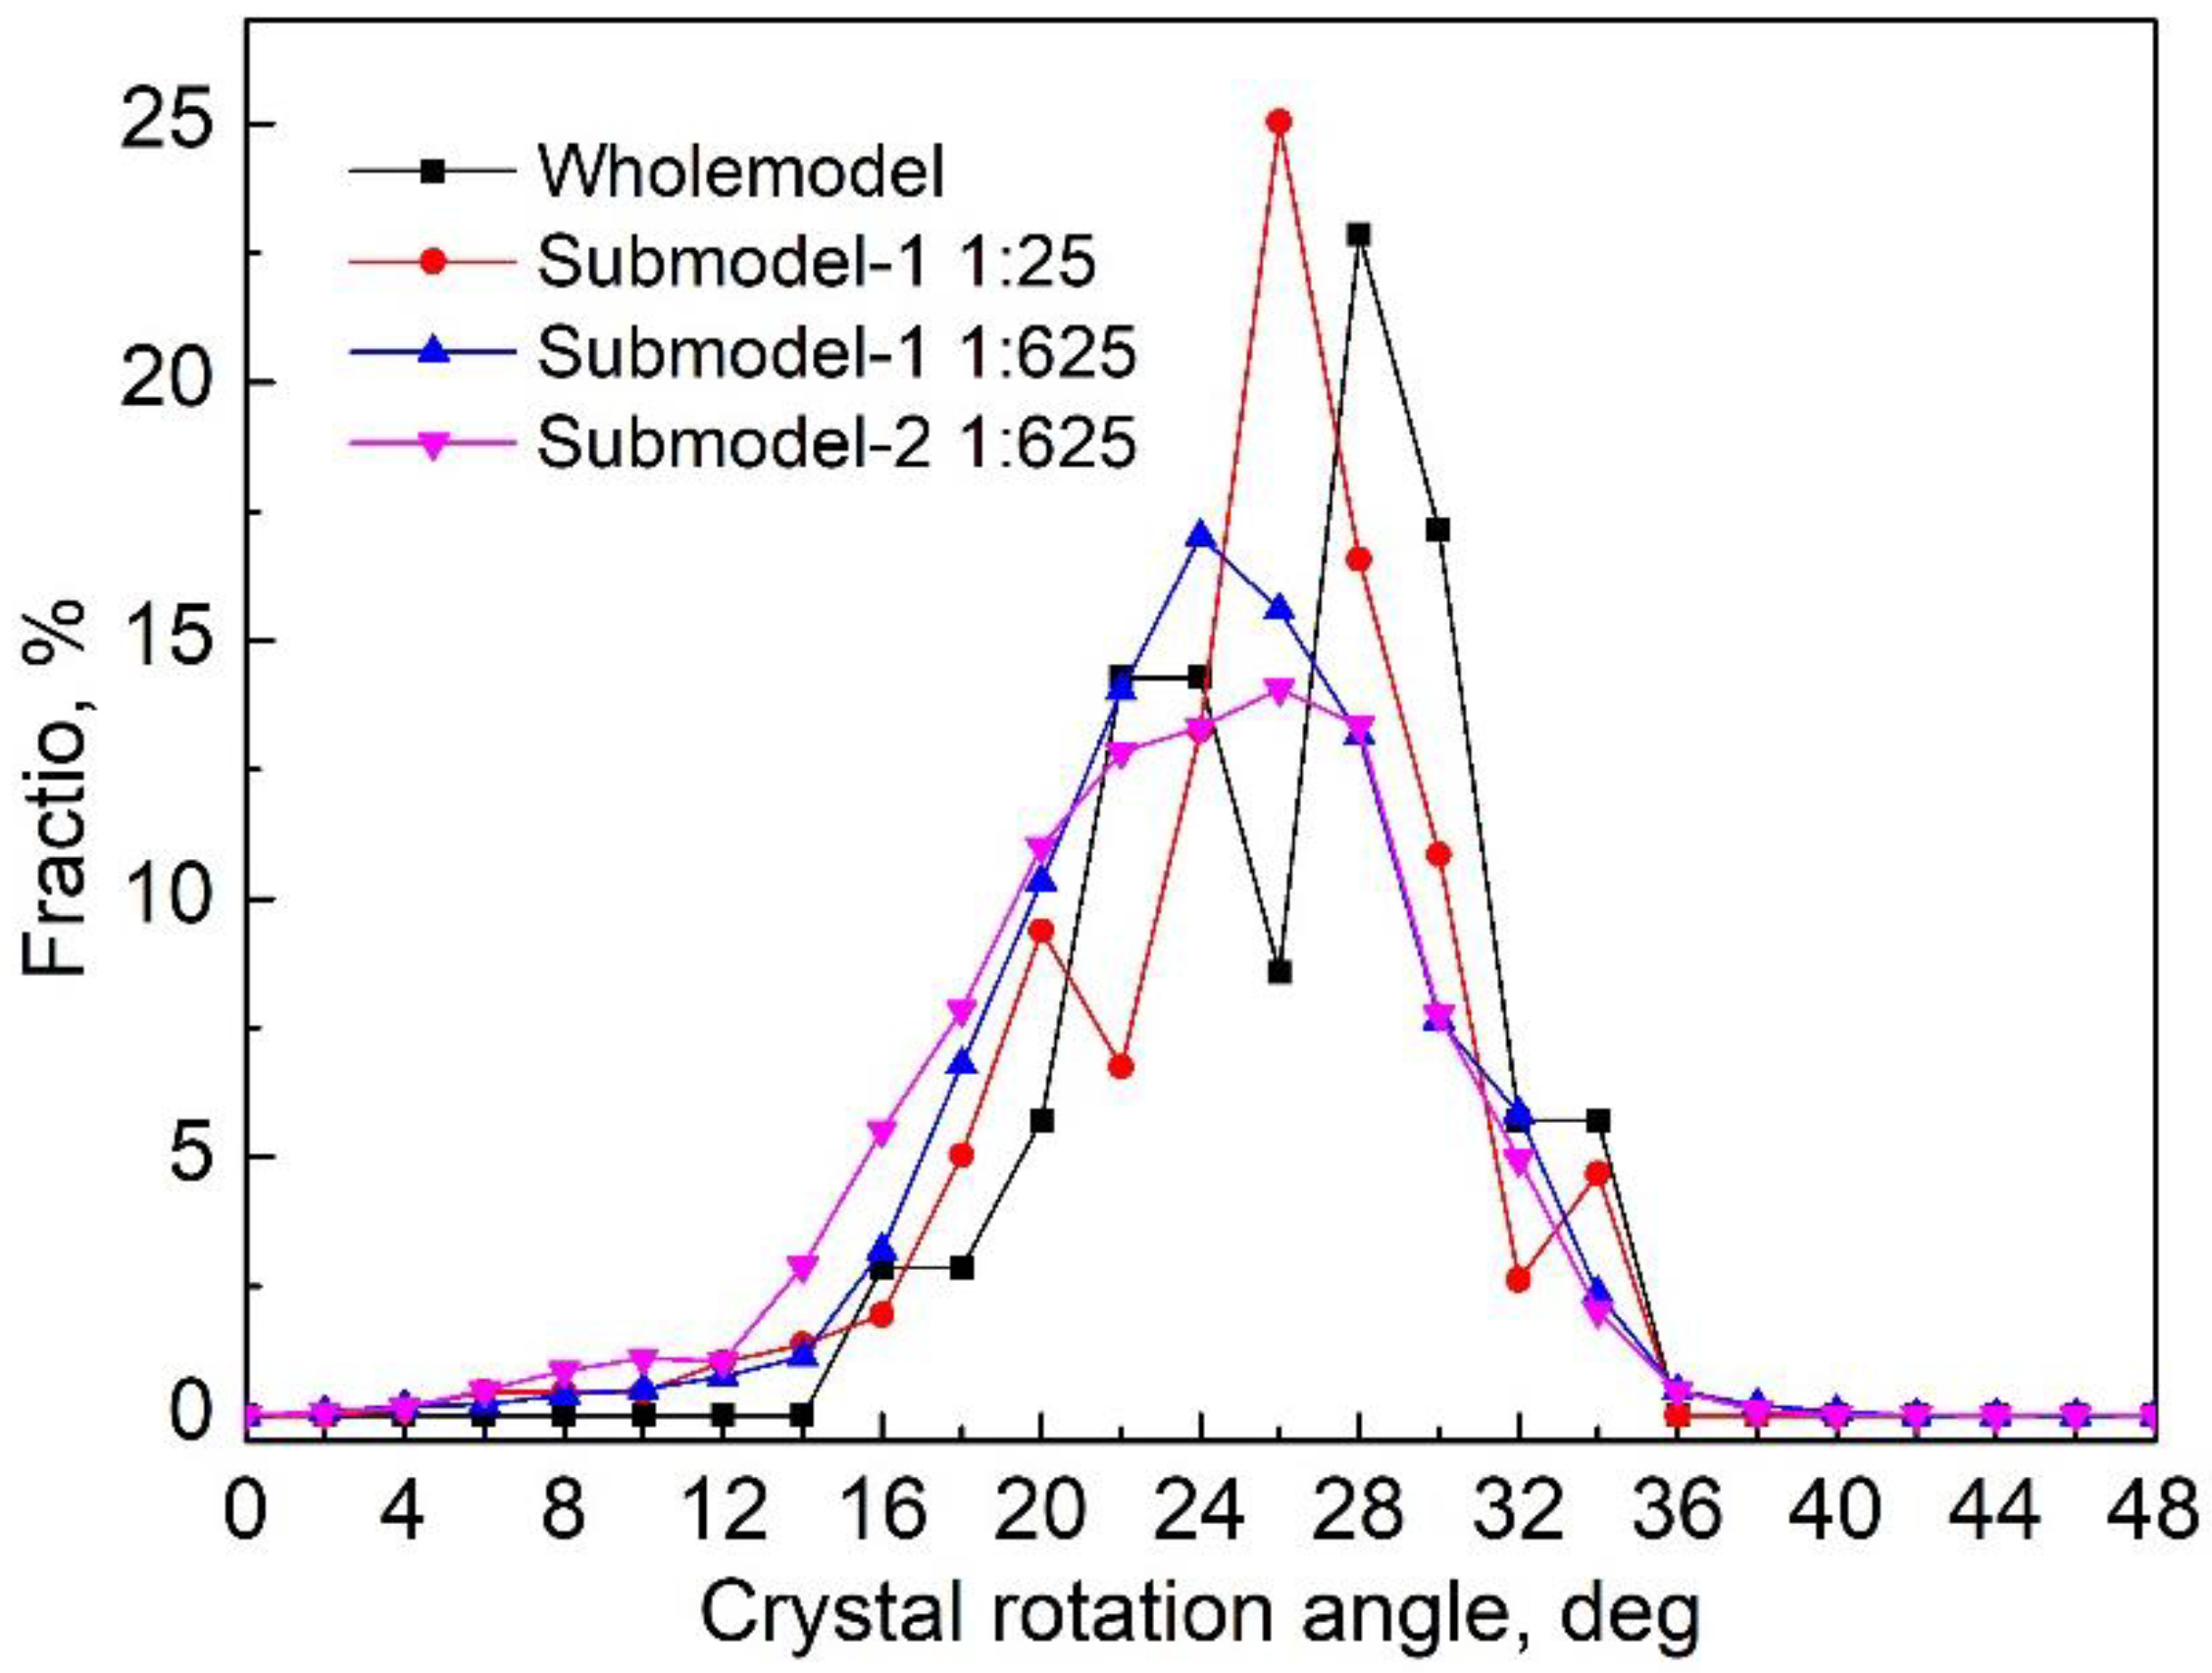
Figure 4c in terms of shear bands and strong and weak texture components, although the grain shape is slightly different, since Grain A in the Submodel-2 was driven by the neighbouring grains, but not directly by its deformation history in the Wholemodel. The crystal rotation angles in the four models (shown in
Figure 4) are similarly distributed in
Figure 5. Although the fraction of relatively large rotation angles decreases slightly as the mesh resolution increases, the distributions of all four models are generally consistent. This agrees with the slightly lowered average rotation angles of Grain A in the four models (
Figure 4).
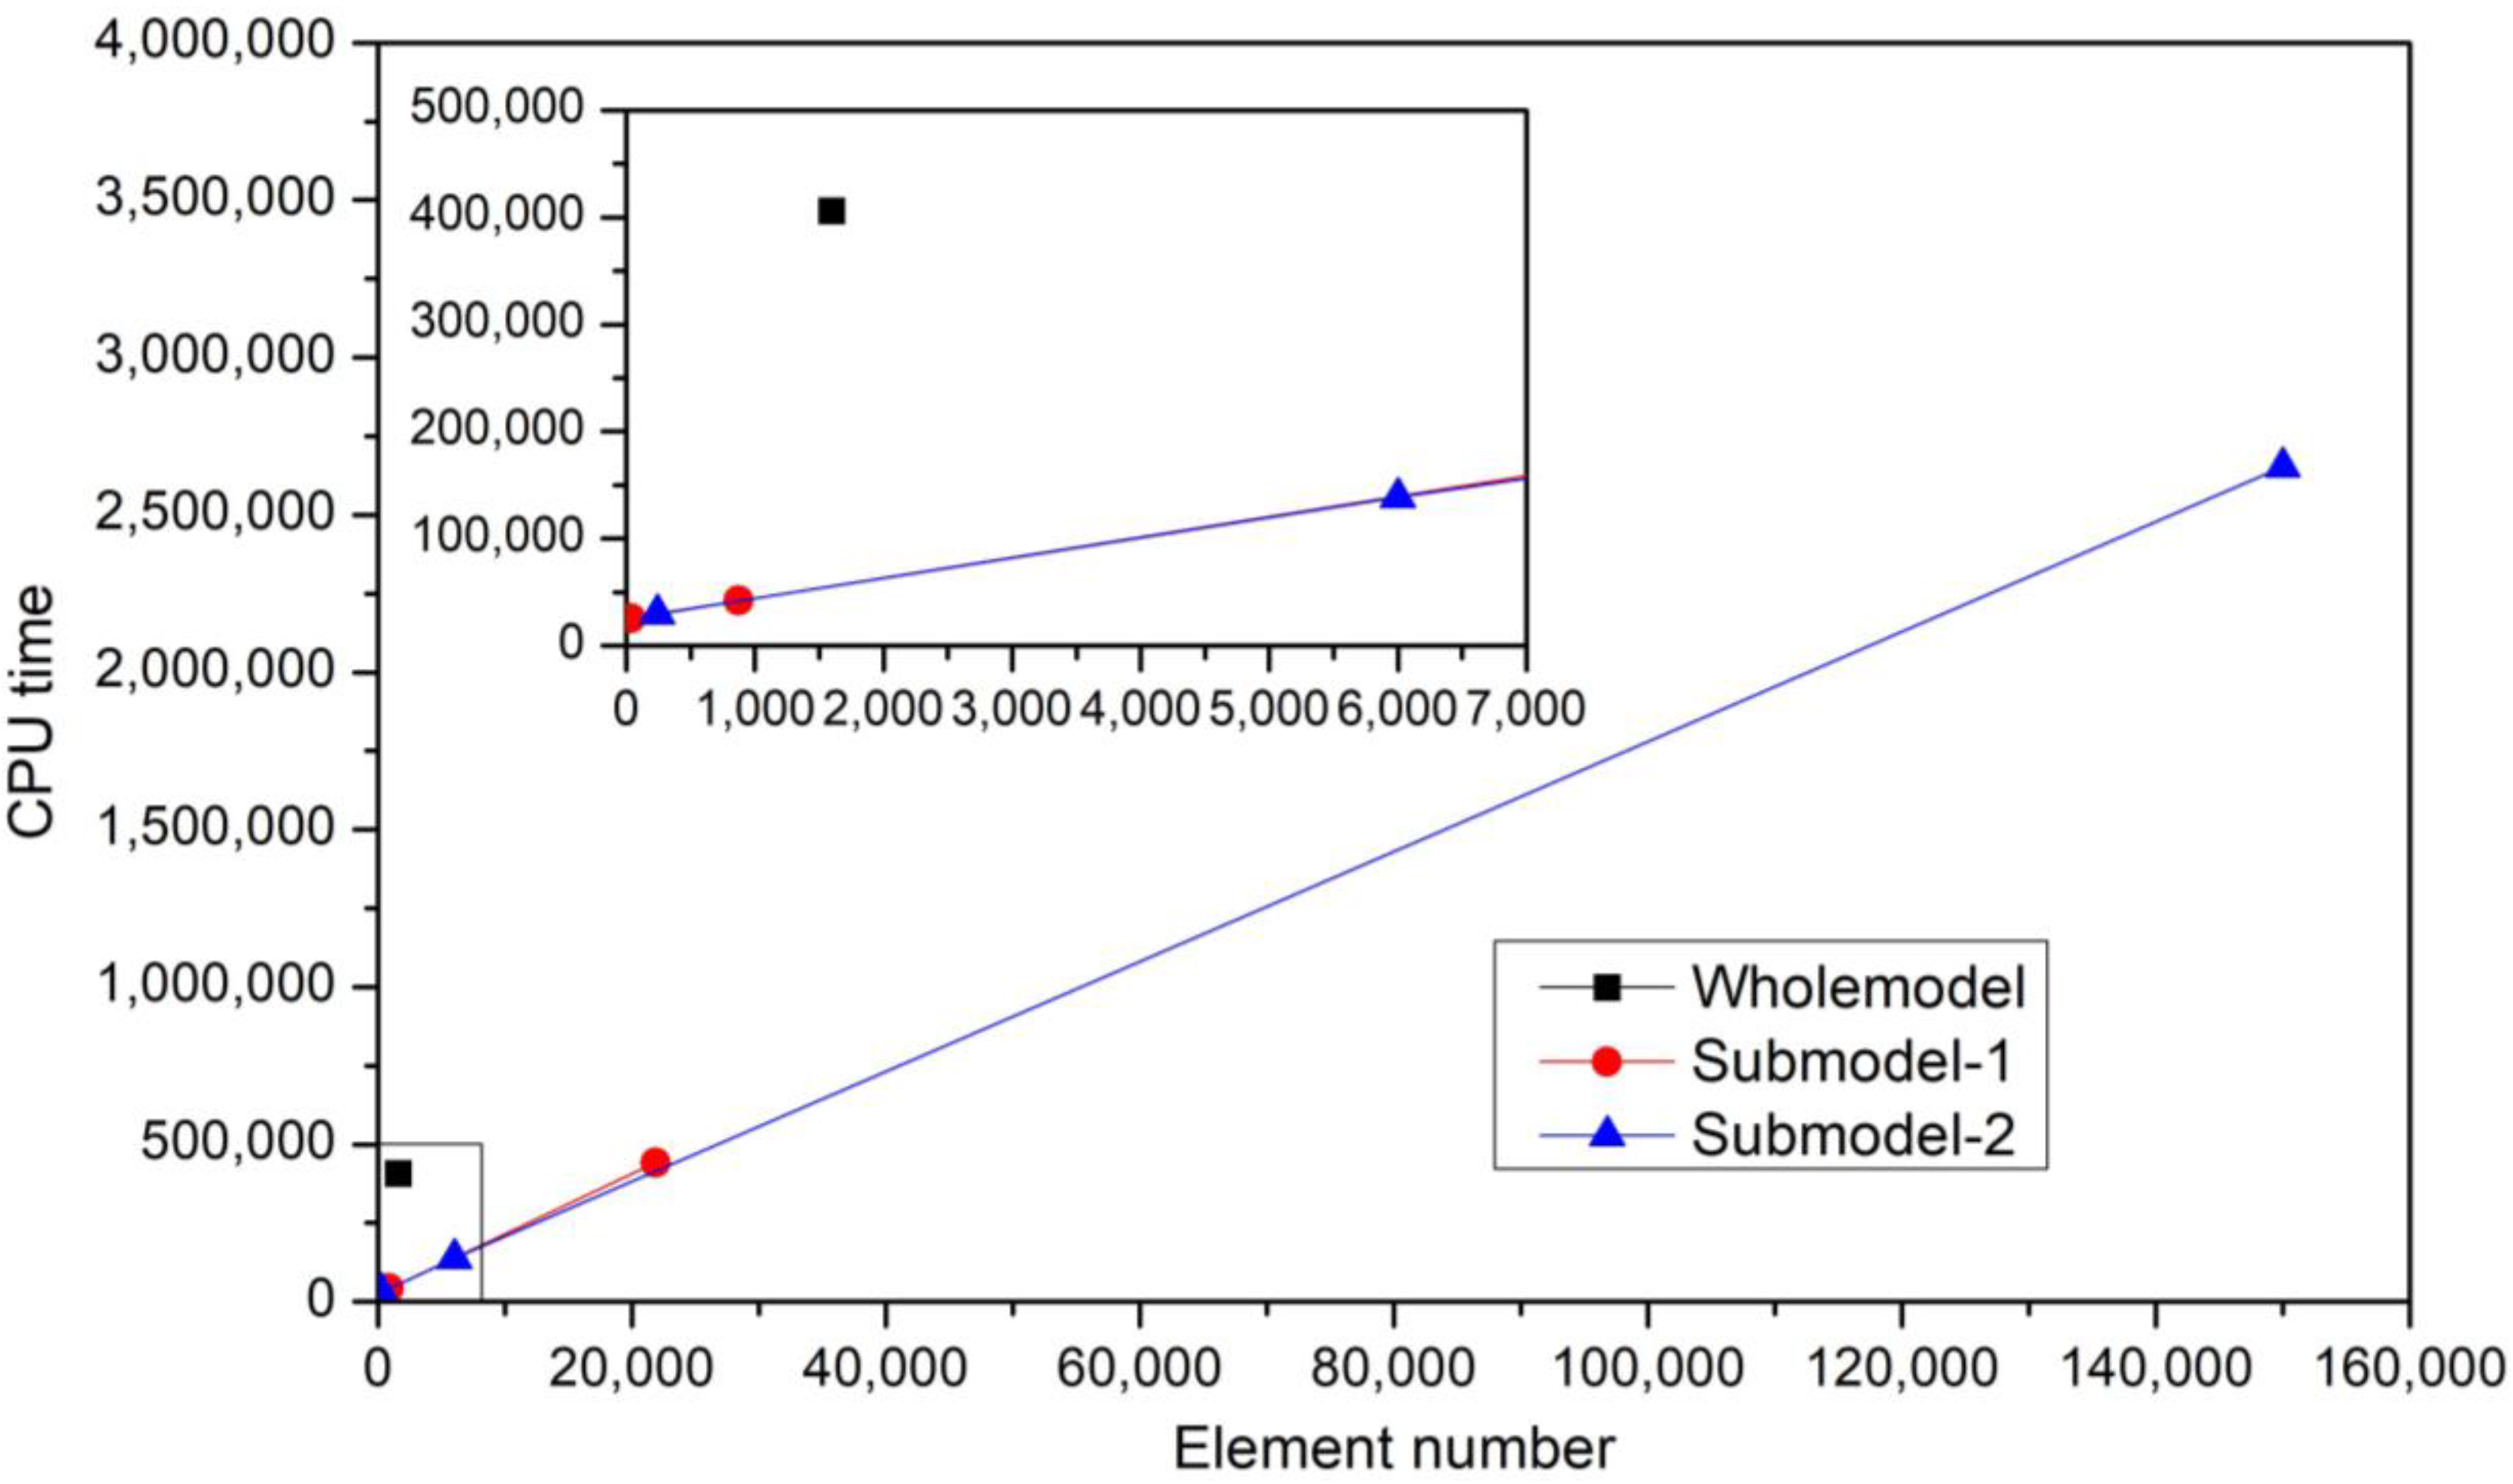
Figure 6 shows the CPU time at different refinement ratios. It can be seen that the computation time of the Wholemodel was reduced by about ~85% in the Submodel when the element number in them is the same. This is because complicated boundary conditions and interactions were considered when analysing the Wholemodel, and they cost expensive computation sources, while the boundary conditions for the Submodel are greatly simplified and thus the computation time is reduced. As for the Submodel with different mesh refinement ratios, it can be seen that the CPU time is almost linearly related to the element number. The CPU time increases ~17 times when the mesh refinement ratio is 625. When using the Submodel method, the computation time became affordable, especially for a relatively small region.
5. Discussion
No homogenization is theoretically assumed in the CPFE model, but intra-element subdivision is not accessible (saying element type is CPE4R). Though the element size in the Wholemodel was obviously larger than the EBSD step sizes, acceptable global textures have been predicted by the coarse mesh. In contrast, the texture prediction was greatly enhanced by reducing the element size in the Submodel in terms of major and minor texture components, as well as macro- and micro-scale shear bands. Increasing the mesh resolution means more elements are used to describe the textural gradients, so the subtle textures can be reasonably captured. Meanwhile, the material flow was enhanced, and this is why in-grain shear bands (
Figure 4c,d) were predicted. Inherent length scale is not assumed in the current CPFE model [
5,
6] and there is no assumed homogenization, which implies that similar textures to those in the Wholemodel [
5] can be reproduced in the Submodel. The boundary conditions of the Submodel were slightly altered (
Figure 4d), but the alteration is negligible, as can be seen from the comparison of grain shapes and averaged rotation angles between the four models (
Figure 4 and
Figure 5). Moreover, compared to external loading, the initial orientations of grains played a dominant role in the in-grain texture development [
12]. With the affordable computation time, the refinement ratio reached a high number due to the reduced size of the sample in the Submodel. The maximum mesh refinement ratio is 625 in this study, but it is only 16 [
5] and 30 [
6] when fine meshes were applied to the whole sample. As an alternative, Submodelling is capable of reproducing predictions at an exceedingly reduced computation time. This study proves that Submodelling can be applied to feature regions in various FE simulations.
6. Conclusions
1. The global texture produced by the coarse-mesh Wholemodel agrees well with the experimental observations.
2. Submodelling was adopted to access the texture in a grain with highly refined mesh. The Submodel successfully reproduced the predictions in the Wholemodel, and more experimentally observed phenomena such as subtle texture components and shear bands were revealed in the Submodel.
3. The computation time for the Submodel was reduced by ~85% compared with the Wholemodel, because the complicated boundary conditions and interactions in the Wholemodel, which need much computation sources, were not considered in the Submodel.
4. Compared to the Wholemodel, the computation time of the Submodel was greatly saved due to the reduced region, and thus high-mesh resolution can be used in the Submodel. This study proves that Submodelling can be applied to feature regions in various FE simulations.


