Article

Effects of Stress State, Crack—γ/γ′ Phase Interface Relative Locations and Orientations on the Deformation and Crack Propagation Behaviors of the Ni-Based Superalloy—A Molecular Dynamics Study

1
College of Materials Science and Metallurgical Engineering, Guizhou University, Guiyang 550025, China
2
School of Electronic and Information Engineering, Anshun University, Anshun 561000, China
3
Guizhou Key Laboratory for Mechanical Behavior and Microstructure of Materials, Guiyang 550025, China
4
National & Local Joint Engineering Laboratory for High-Performance Metal Structure Material and Advanced Manufacturing Technology, Guiyang 550025, China
*
Author to whom correspondence should be addressed.
Crystals 2023, 13(10), 1446; https://doi.org/10.3390/cryst13101446
Submission received: 30 August 2023 / Revised: 21 September 2023 / Accepted: 22 September 2023 / Published: 28 September 2023

Abstract

:
In this study, we systematically investigate the influence of stress states, relative locations, and orientations of crack—γ/γ′ phase interfaces on the deformation and crack propagation behaviors of the Ni-based superalloy through molecular dynamics simulations. The stress state with high stress triaxiality will impede the plastic deformation process of the system, thereby promoting brittle crack propagation within the system. But the stress state of low stress triaxiality results in obvious plastic deformation and plastic crack propagation behaviors of the system. The deformation system with cracks located in both the γ and γ′ phase exhibits the slowest growth rate, regardless of applied stress states. Additionally, the deformation process demonstrates prominent plastic behavior. For the deformation system with cracks perpendicular to the γ/γ′ phase interface, the γ/γ′ phase interface will hinder the crack propagation. Our research provides interesting observations on deformation and crack propagation behaviors at an atomic level and at a nano-scale which are important for understanding deformation and fracture behaviors at a macroscopic scale for the Ni-based superalloy.

1. Introduction

Due to its exceptional elevated-temperature strength, oxidation resistance, and corrosion resistance, the Ni-based superalloy has been extensively utilized as elevated-temperature components in aircraft engines [1,2,3,4], including turbine blades, turbine discs, and combustors. Moreover, it has also found application as high-strength fasteners in wind-driven generators [5]. These critical components inevitably experience damage and fracture during service. Component fracture is a crucial concern that directly impacts integrity and safety [6]. Therefore, understanding the fracture process of materials is essential for enhancing component safety and reliability. At the macroscopic scale, component fractures primarily occur due to corrosion, fatigue, and creep mechanisms, among others. However, at smaller scales, such as the atomic-level crack-scale, small crack growth up to meso-scale length crack growth of materials contributes to the overall fracture process of components. Henceforth, studying atomic-scale crack initiation and propagation in materials becomes imperative for comprehending the fundamental mechanism behind macroscopic scale.
The crack propagation and fracture behaviors of the material have been successfully observed at the atomic scale through the molecular dynamics simulation (MD) method [7,8,9,10]. The microstructure evolution of the crack growth and the fracture process is recorded by tracking the motion of the atoms. Wu et al. [11] investigated the influence of temperature on the microstructural evolution and stress distribution during crack propagation in single crystal nickel. They observed that, at elevated temperatures, crack growth was influenced by the formation of voids and slip bands ahead of the crack tip. Zhang et al. [12] and Chang et al. [13] employed molecular dynamics simulations to elucidate the interactions between cracks, dislocations, and microtwins for various lattice orientations. Their findings revealed that the lattice orientation significantly affects crack growth behavior. The influences of grain boundary on the crack growth process in Al and Ni bicrystals were investigated by Fang [14] and Zhang [15], respectively.
The Ni-based superalloy, such as Inconel 718, is primarily composed of the γ base (Ni), γ′ (Ni3Al), and γ″ (Ni3Nb) phase [16,17,18]. The MD method has also successfully investigated the impact of the γ/γ′ interface on crack propagation in the Ni-based superalloy. Ma and his colleagues [19] studied the influence of the γ/γ′ phase interface on fatigue crack propagation and discovered that it hinders crack growth. Furthermore, the influence of the γ/γ′ phase interface on the void growth and microstructure evolution has been analyzed, and the research results are as follows. Jing et al. [20] found that by creating minor diameter holes at the γ/γ′ phase interface, the yield strength of the materials can be improved. However, Liu et al. [21] demonstrated that the presence of holes at this interface reduces both yield strength, elastic modulus, and the plastic deformation capacity of materials. Cui′s study [22] shows that holes in the γ/γ′ interface promote dislocation slip from the γ phase to γ′ phase, thereby reducing mechanical strength. Nevertheless, there has not been any systematic work so far to reveal how stress states, crack locations, and crack orientations affect deformation and crack propagation behaviors as well as mechanisms for Ni-based superalloys.
In this study, we employed the MD simulation method to systematically investigate the influence of stress states, relative locations, and orientations of crack—γ/γ′ phase interfaces on deformation and crack growth behaviors in Ni-based superalloys. Our research provides valuable insights into the nano-scale, which are crucial for understanding macroscopic deformation and fracture behaviors in Ni-based superalloys. For example, after the ultrasonic surface rolling modification (USRM), Peng [23] found that the USRM led to the crack initiation position being transferred to about 800 μm from the specimen surface (the crack initiation position of the specimen without USRM is located on the specimen surface). This migration behavior significantly reduces the tension–tension fatigue limit in small-diameter specimens made of the Inconel 718 alloy. Our findings offer a microscopic description of internal fatigue crack propagation in Ni-based superalloys under realistic operating conditions.

2. Simulation Method and Details

2.1. Simulation Method and Model

In this work, the LAMMPS [24] (large-scale atomic/molecular massively parallel simulator) software was utilized to investigate the deformation and crack growth behaviors in a Ni-based superalloy. The simulation model consisted of two phases: the γ phase (Ni) and the γ′ phase (Ni3Al). The atomic arrangement of the two phases is shown in Figure 1f. The dimensions of the model were 51.4 nm, 25.7 nm, and 25.7 nm along the X ([100]), Y ([010]), and Z ([001]) directions, respectively. It included approximately three million atoms. To eliminate lattice mismatch stress between the γ phase and γ′ phase, their dimensions in the simulation model were chosen as naγ ≈ maγ′ (where n and m are positive integers). The lattice constant for γ (Ni) and γ′ (Ni3Al) are 3.524 Å and 3.573 Å, respectively, which indicates that n = 73 and m = 72. Consequently, the size of γ (Ni) was set as 73aγ × 73aγ × 73aγ while the size of γ′ (Ni3Al) was set as 72aγ′ × 72aγ′ × 72aγ′. The interface between these two phases occurred at plane (100). By selectively removing some atoms from specific regions within the simulated system, models with specified cracks were created. As depicted in Figure 1, four types of crack locations were considered: within the γ phase (Figure 1a); within γ′ phase (Figure 1b); at the interface between γ and γ′ phase (Figure 1c); and within both the γ phase and γ′ phase (Figure 1d). Additionally, to investigate the influence of crack orientations on the deformation and crack growth behaviors, two types of orientation relationships were taken into account: the long axis direction of crack was parallel to the interface between γ and γ′ phase (Figure 1c), while it was perpendicular to this interface (Figure 1e).
The three-dimensional periodic boundary conditions are used in the simulation model. Prior to deformation, a relaxation process of 10 ps is conducted at a temperature of 300 K and a pressure of 0 bar using an isothermal–isobaric ensemble (NPT) [25,26,27]. Subsequently, cyclic deformation is induced by applying strain. The NVE ensemble is employed for the cyclic deformation process with increasing strain amplitude. The strain rate in the X direction remains constant at 1 × 10⁻³ ps−1 for all models. The strain ratio ( R = ε m i n / ε m a x = 0.5 ) governs the cyclic deformation process, as depicted in Figure 2. Each cycle consists of loading and unloading stages lasting for 10 ps and 5 ps, respectively. The maximum cyclic numbers of all systems is set to N = 40. It should be noted that three calculations were performed independently for each model to ensure result repeatability. Four different stress states are obtained by applying distinct deformation conditions (Figure 3), which are detailed in Table 1 along with their specific parameters (NO.1, NO.2, NO.3, and NO.4).

2.2. The Interatomic Pairwise Interaction Potentials

In this study, the interatomic pairwise interaction potential of the γ(Ni)/γ′(Ni3Al) system was described with an EAM/alloy potential [28]. The EAM/alloy potential provided the total energy of system atoms as:
E i = F α j i ρ β r i j + 1 / 2 · j i α β r i j
where F is the embedding energy which is a function of the atomic electron density ρ (rho); (phi) is a pair potential interaction; a and b are the element types of atoms I and J. The relevant parameters of the EAM/alloy potential are listed in Table 2.

2.3. The Analysis Method of the Microstructure and the Stress Definition

To analyze the deformation and crack propagation behaviors of these systems, the microstructure evolution of the model are analyzed by common neighbor analysis (CNA) [29,30] and the dislocation extraction algorithm (DXA) of the OVITO [31,32] software (the open visualization tool).
The elements of the atomic-level stress tensor are calculated in this work, which includes the atomic stress (σαβ(i)), the hydrostatic stress (σm) of the entire system, the effective von Mises stress (σe) of the entire system, and the stress triaxiality (Tr) of the entire system [33,34]. The atomic stress (σαβ(i)) is calculated by:
σ α β i = 1 / Ω 0 · 1 / 2 · j F i j α r i j β + M i υ i α υ i β
where a and b are the Cartesian components; Ω 0 is the volume of the atoms; F i j is the force exerted by atom j on atom i; r i j is the vector component form of the relative position from atom j to atom i;  M i is the mass of atom i; and υ i is the velocity of atom i. The hydrostatic stress (σm) of the entire system is calculated by:
σ m = 1 / 3 · σ x + σ y + σ z
where σ x , σ y , and σ z are the stresses averaged over the entire system in the X, Y, and Z directions, respectively. The effective von Mises stress (σe) of the entire system is calculated by:
σ e = 1 / 2 · σ x σ y 2 + σ x σ z 2 + σ y σ z 2 + 6 σ x y 2 + σ y z 2 + σ x z 2 1 / 2
Then, the stress triaxiality of the entire system is given by:
T r = σ m / σ e

3. Results and Discussions

3.1. The Effect of Stress States on the Deformation and Crack Propagation Behaviors

3.1.1. The Deformation Behaviors

The initial stress triaxiality, stress-strain relationship, and characteristic strain of the deformation system under various stress states is illustrated in Figure 4. The characteristic strain of the deformation system encompasses the total strain ( ε t ), elastic strain ( ε e ), and accumulated plastic strain ( ε p = ε t ε e ). It is important to note that the definition of total strain ( ε t ) is divided into two scenarios: (i) when the system experiences complete fracture during cyclic deformation, it is defined as the strain at which fracture occurs; (ii) when the system does not undergo complete fracture, it is defined as the total strain value after 40 cycles.
In the cyclic deformation process, as the stress state of the deformation system changes from NO. 1 to NO. 4, there is an increase in the initial stress triaxiality of the system from 0.25 to 0.95. For low initial stress triaxiality (the stress state of NO. 1 and NO. 2), the cyclic tensile stress gradually decreases after reaching its maximum value, with plastic deformation dominating throughout the entire cyclic deformation process. However, for high initial stress triaxiality (the stress state of NO. 4), the cyclic tensile stress rapidly drops close to zero GPa after reaching its maximum value, and plastic deformation only occurs briefly before reaching this peak (Figure 4b; shaded area). We further calculated the total cyclic strain ( ε t ), elastic strain ( ε e ), and cumulative plastic strain ( ε p ), as shown in Figure 4c. It is evident that under different stress states (NO.1, NO. 2, NO. 3, and NO. 4), accumulated plastic strains are measured at approximately 19.34%, 18.13%, 10.14%, and 2.58%, respectively. With increasing initial stress triaxiality from NO. 1 to NO. 4, the initial stress triaxiality increases; thus, the deformation behavior transitions from typical plastic behavior to brittle behavior.
Under conditions of low stress triaxiality, the normal stress experienced by the atoms in the system is relatively small, while the shear stress is comparatively large. This enhances the likelihood of dislocation slip within the system, resulting in pronounced plastic deformation behavior. Conversely, under high stress triaxiality conditions, the normal stress exerted on the atoms becomes significant while the shear stress diminishes. Consequently, dislocations encounter greater difficulty in movement and ultimately exhibit conspicuous brittle behavior [35,36,37,38].

3.1.2. The Crack Length—Cyclic Numbers Relationship

According to the relationship between crack length and cyclic numbers shown in Figure 5, the crack growth can be divided into three stages: stage I—crack growth incubation stage (elliptic shadow region), stage II—crack rapid growth stage (inverted rectangular shadow region), and stage III—crack stable growth stage (square shadow region). It is evident that the cyclic numbers for each stage of crack growth in the deformation system vary significantly with stress states. The stress states have a remarkable influence on the crack propagation process. As the initial stress triaxiality of the system increases from 0.25 to 0.95, there is a reduction in the required cyclic numbers for each stage of crack growth, leading to an obvious acceleration in the rate of crack propagation.

3.1.3. The Microstructure Evolution and Dislocations Density Analysis

We employed slice processing to acquire the microstructure of the regime exhibiting the maximum crack length, as shown in Figure 6(a1,b1,c1,d1). For the system with stress state NO. 1, from Figure 6(a1–a6), it can be observed that numerous stacking faults (red atomic region—HCP structure) emerge during the cyclic deformation process, indicating that crack propagation is accompanied by continuous emission and slip of dislocations. The emission of dislocations from the crack tip and their subsequent slip on its slip plane facilitate bond breaking within the crack tip region, ultimately leading to continuous plastic propagation of cracks. The density of dislocations in the system monotonically increases with each cycle number, further confirming that plastic deformation dominates throughout most of the cyclic deformation process, as depicted in Figure 7. However, when subjected to high initial stress triaxiality, crack growth occurs in three stages: nanopore formation, nanopore growth, and merging of nanopores with main cracks (Figure 6d). This type of crack growth exhibits a significantly higher propagation rate. For stress states NO. 2, NO. 3, and NO. 4, the density of dislocations in the deformation system decreases after reaching its peak value due to complete fracture occurring in certain regions within this system. In addition, we also analyzed the fracture morphology after crack propagation (Figure 6(a7,b7,c7,d7)). It can be observed that under stress state NO. 1, after undergoing 40 cycles, the fracture morphology becomes rough and uneven for this deformation system. However, under stress state NO. 4, the entire system fractures completely after only 11 cycles, and exhibits a relatively flat fracture morphology.

3.2. The Effect of Crack Locations on the Deformation and Crack Propagation Behaviors

3.2.1. The Deformation Behaviors

Figure 8a shows the initial stress triaxiality of the deformation system under stress state of NO. 3 with different crack locations. It is found that the deformation system with the crack only located in the γ phase has the minimum initial stress triaxiality (Tr = 0.76). The stress triaxiality of the deformation system with other crack locations (such as only located in the γ′ phase, γ/γ′ phase interface, and both located in the γ and γ′ phases) is about 0.84, which indicates that the crack locations have a minor effect on the stress response of the deformation system.
As shown in Figure 8b, for the system with the crack only located at the γ phase, when the cyclic deformation strain exceeds about 2.5%, the system has entered the plastic deformation stage. Thereafter, plastic deformation continues until the system completely fractured. For the deformation system where the crack is only located in the γ′ phase, an extremely short plastic deformation process occurs before the cyclic tensile stress reaches its maximum value (blue curve in Figure 8b). When the crack is located at the γ/γ′ phase interface and the cracks are located symmetrically in the γ and γ′ phases, the cyclic tensile stress–strain curve of the system is obviously a zigzag shape, which indicates these two systems have a clear plastic deformation process.
From Figure 8c, it is evident that when the crack solely exists in the γ′ phase, the system exhibits pronounced brittle behavior during cyclic deformation. The accumulated plastic strain is approximately 1%, and plastic strain only occurs briefly before crack propagation. In contrast, for a system where the crack resides at the interface between the γ/γ′ phases, plastic deformation behavior becomes more apparent compared to a system with cracks solely located in the γ′ phase, resulting in a slightly larger accumulated plastic strain (2.55%). Both of these crack locations demonstrate obvious brittle behavior. However, when cracks are exclusively present in the γ phase or simultaneously exist in both the γ and γ′ phases, significant plastic behavior is observed with respective accumulated plastic strains of 8.48% and 9.67%. These findings indicate that relative locations of cracks with respect to the γ/γ′ phase interface have a notable influence on system deformation behavior; specifically, exhibiting brittle behavior when cracks are situated within the γ′ phase or at its interface while demonstrating plastic behaviors when cracks reside solely within the γ. Notably, symmetrically positioned cracks within both γ and γ′ phases result in optimal plastic deformation ability.

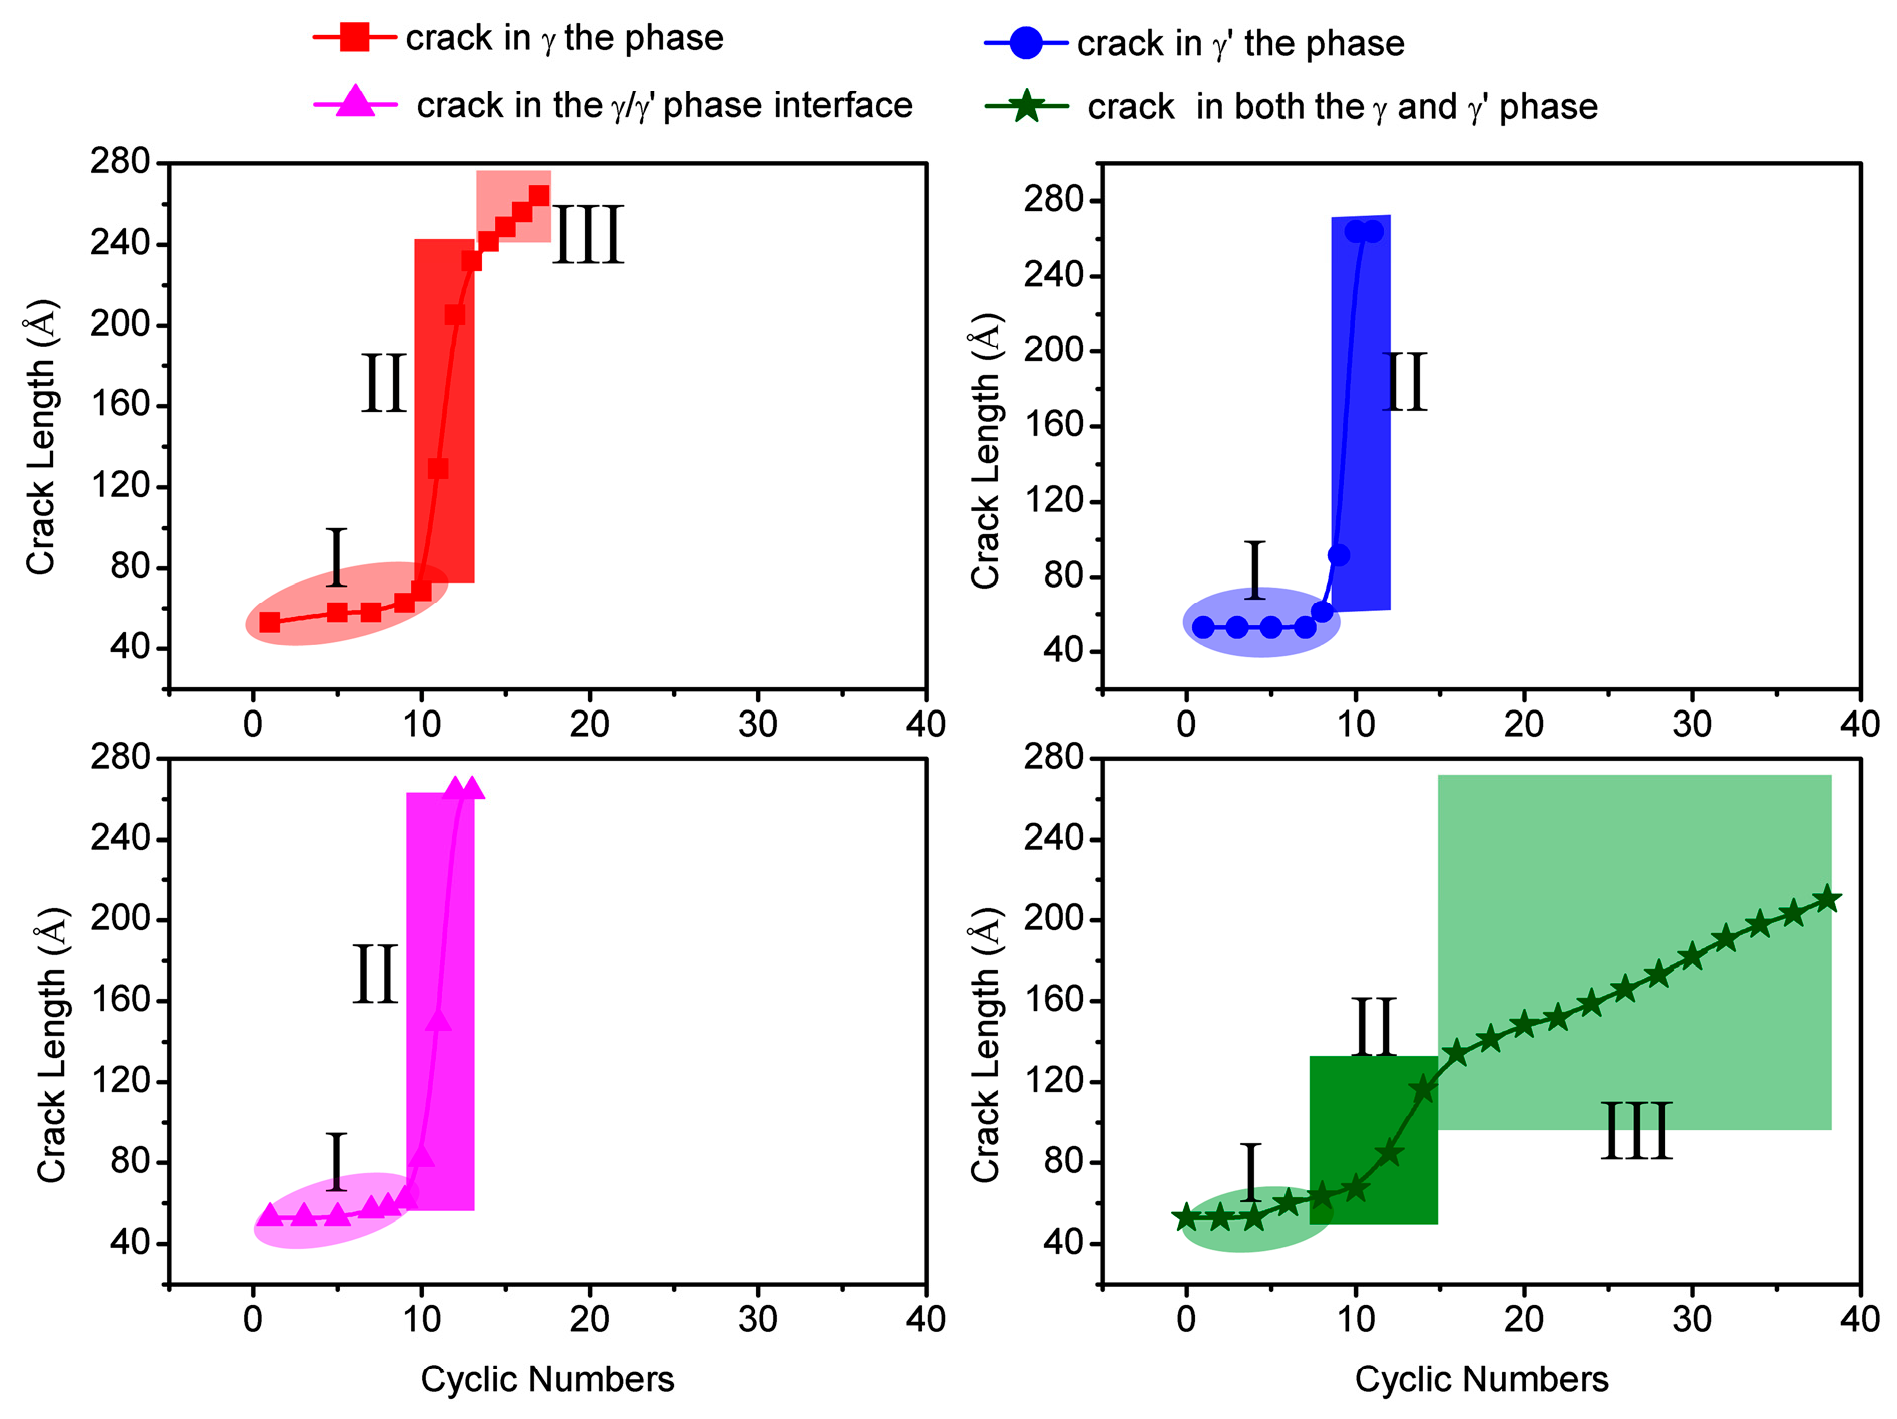
3.2.2. The Crack Length—Cyclic Numbers Relationship

The curves in Figure 9 illustrate the relationship between crack length and cyclic numbers for a deformation system with varying crack locations. For the systems where the crack is located only at the γ phase, the γ/γ′ phase interface, and cracks are located in both γ and γ′ phases, the crack growth incubation stage is 10 cyclic numbers. However, there are significant differences in the number of cyclic numbers required for rapid growth and stable growth stages. As we observe changes in crack locations from both in γ and γ′ phase, only in γ phase, γ/γ′ phase interface to γ′ phase, there is a gradual reduction in cyclic numbers necessary for crack growth and the crack growth rate increases. Notably, when two cracks are symmetrically distributed within the system, the slowest rate of crack propagation is exhibited.

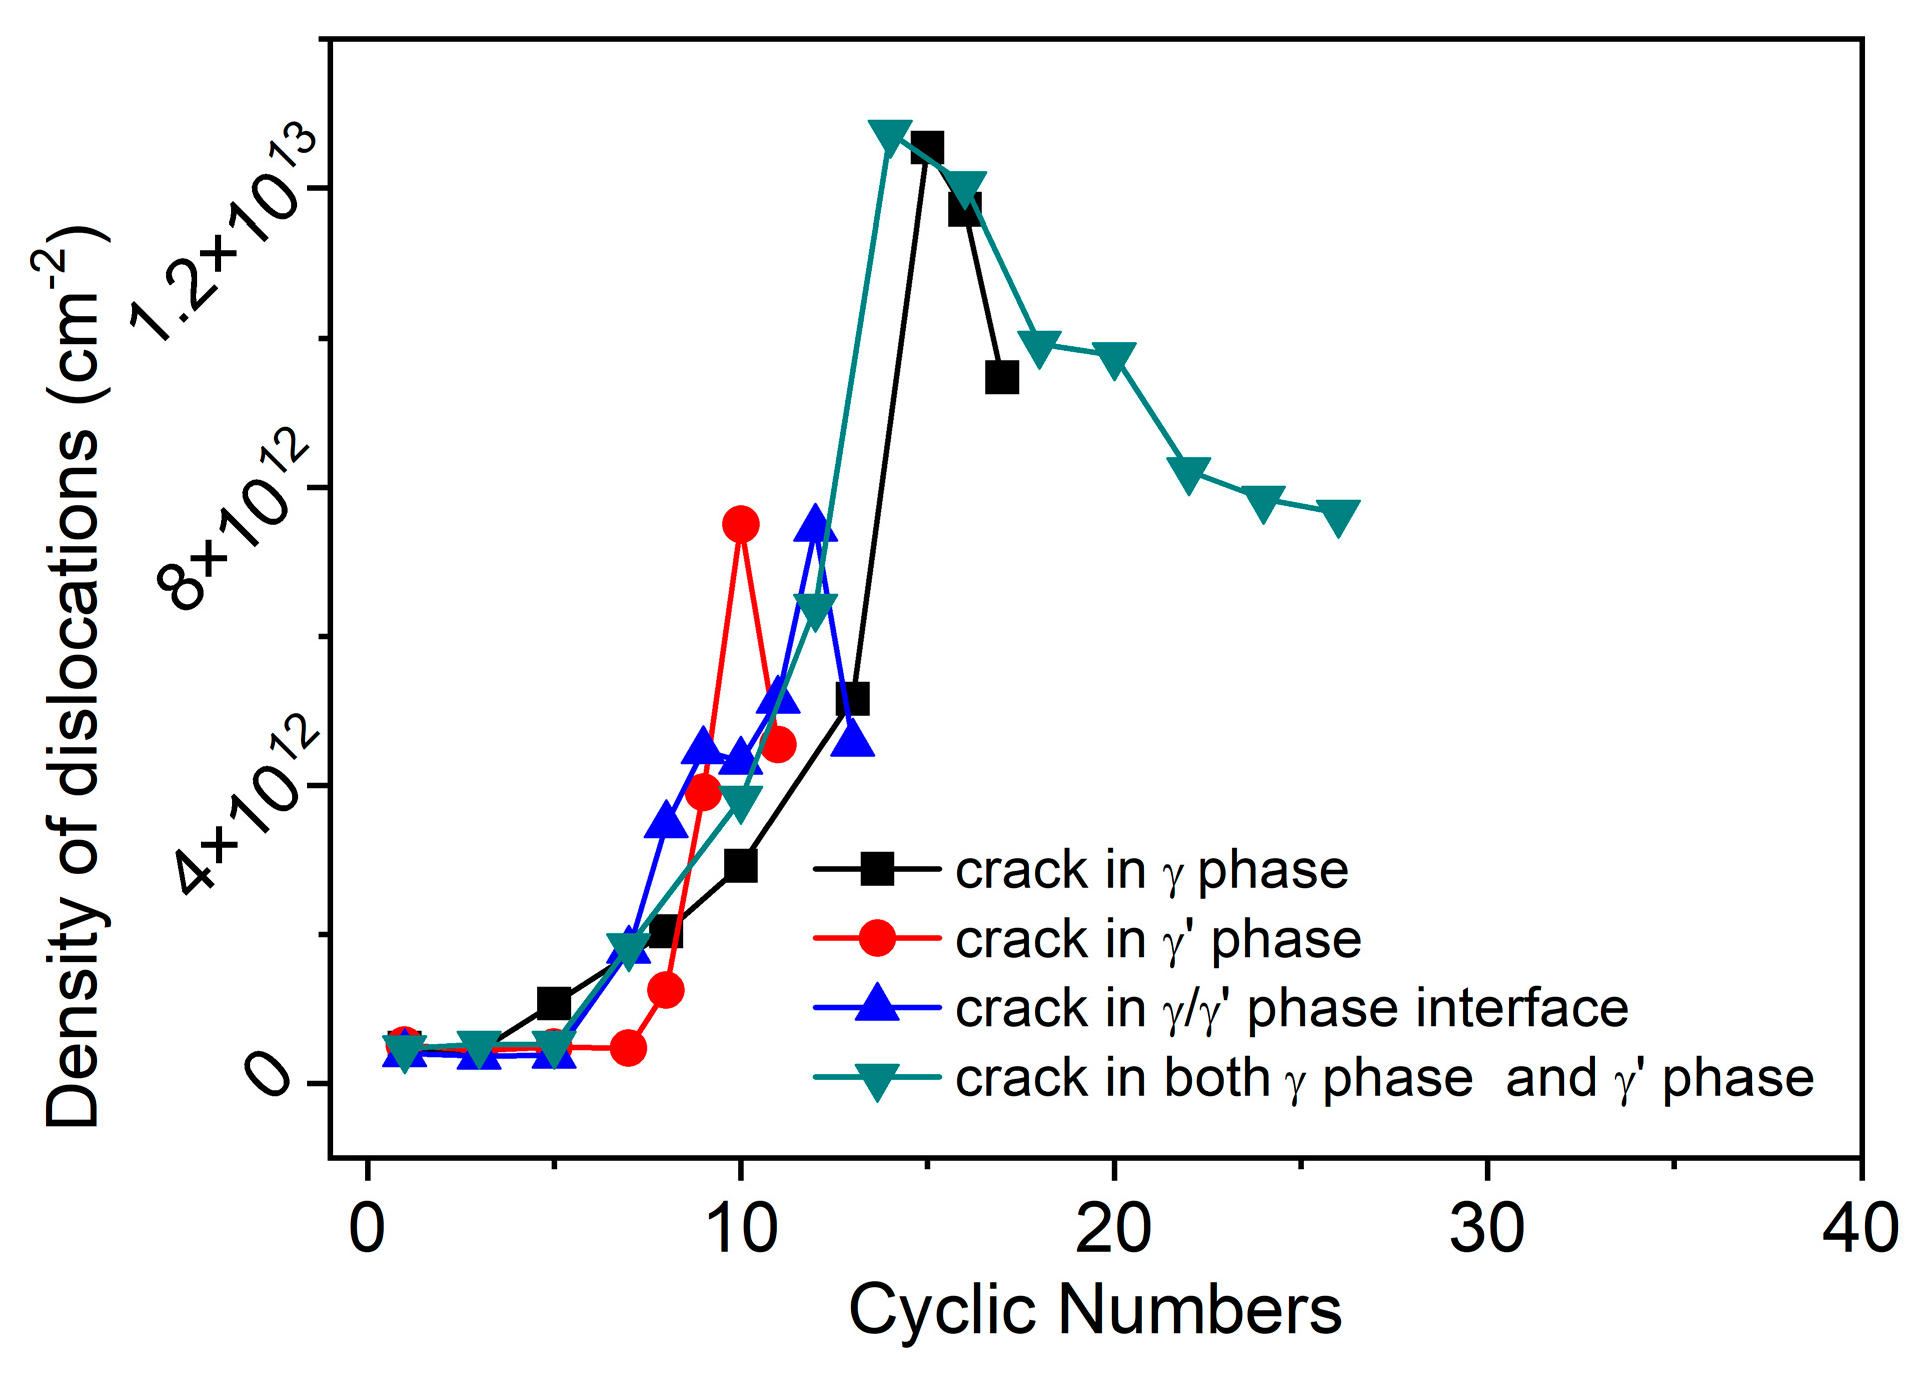
3.2.3. The Microstructure Evolution and Dislocation Density Analysis

The microstructure evolution of crack propagation in the deformation system, where cracks are present in both the γ and γ′ phases, is illustrated in Figure 10. It can be observed that the symmetric distribution of two cracks with respect to the γ/γ′ phase interface leads to their growth following a typical plastic behavior. As depicted in Figure 10(a3–a5), during the initial stage of crack propagation, dislocation emissions passivate the crack tip, resulting in slow crack propagation due to a continuous dislocation motion. With an increase in cyclic numbers, such as when N = 16, dislocations emitted by both cracks converge at the γ/γ′ phase interface and interact with each other (indicated by the red arrow in Figure 10(a6)), leading to coalescence of the two cracks into a wider crack along the X direction. Subsequently, this broader crack gradually propagates forward at a moderate rate.
The microstructure evolution and stress distribution of the deformation system with a crack solely located at the γ′ phase are depicted in Figure 11. At N = 8, the crack initiates propagation and continues for only two cycles before complete fracture of the system occurs. This can be attributed to the limited plastic deformation capability during deformation, leading to unrelieved stress concentrations at the crack tip. Consequently, rapid crack propagation takes place without significant plastic deformation behavior, resulting in swift and smooth fracture of the system within an extremely short number of cycles (Figure 11(a5)).
The dependence of the dislocation density on the cyclic number is illustrated in Figure 12. It can be observed that when the crack is solely located at the γ phase and when cracks are distributed in both the γ and γ′ phases, there is a relatively high maximum dislocation density during cyclic deformation. This can primarily be attributed to the fact that the γ phase serves as the main plastic phase within the system, possessing a accommodating plastic deformation. Conversely, when the crack is exclusively situated at either the γ′ phase or at the interface between γ and γ′, there exists a relatively low maximum dislocation density throughout cyclic deformation. The main reason is that the γ′ phase is a hard and brittle phase with weak plastic deformation capacity, this leads to the reduced production of dislocations emission and plastic deformation.

3.3. The Effect of Crack Orientations on the Deformation and Crack Propagation Behaviors

3.3.1. The Deformation Behaviors

Figure 13a demonstrates how relative orientation between crack and phase interface affects initial stress triaxiality. It can be observed that as stress state changes NO. 1 to NO. 4, there is a gradual increase in initial stress triaxiality within this system. Furthermore, regardless of stress state, systems with crack perpendicular to interface exhibit larger initial stress triaxiality compared to those with crack parallel to interface. These findings highlight that relative orientation of crack and interface significantly influences system′s stress response, particularly under large stress triaxiality.
Figure 13b depicts the cyclic tensile stress-strain behavior of the system with varying orientations between the crack and γ/γ′ phase interface under NO. 1 and NO. 4 stress states. It is observed that, under NO. 1 stress state, plastic deformation initiates at a strain of approximately 5% for systems with cracks perpendicular to the phase interface, while cyclic tensile stress remains constant throughout plastic deformation. Conversely, for systems with cracks parallel to the phase interface, plastic behavior occurs only at a strain of about 3%, after which cyclic tensile stress gradually decreases following its maximum value. The shaded regions in Figure 13b represent zones of plastic strain within the deformation system.
The accumulated plastic strain of the system with different orientations between the crack and γ/γ′ phase interface under stress states NO. 1 to NO. 4 is illustrated in Figure 13c. Minor effects on the accumulative plastic strain of the system during cyclic deformation are observed for stress states NO. 1 and NO. 2, regardless of the relative orientation between the crack and interface. However, significant influences on the accumulated plastic strain are observed at stress states NO. 3 and NO. 4, where systems with a crack perpendicular to the interface exhibit much larger values compared to those with a crack parallel to the interface. Therefore, it can be concluded that systems with a crack perpendicular to the interface demonstrate excellent capacity for plastic deformation.

3.3.2. The Crack Length—Cyclic Numbers Relationship

At the stress state of NO. 1, for systems with crack parallel to the interface, the crack propagation process consists of three typical stages (Figure 14), namely, the crack growth incubation stage (about 25 cyclic numbers), followed by a rapid growth stage (only 3 cyclic numbers), and finally reaching a stable growth stage (12 cyclic numbers). When subjected to stress state NO. 4, there are only two stages in the crack growth process: an incubation stage (around 9 cyclic numbers) and a rapid growth stage (only 2 cyclic numbers). In this particular orientation relationship, the system exhibits an exceptionally fast crack propagation rate, requiring only 11 cyclic numbers for complete fracture. However, during the entire cyclic deformation process of systems with cracks perpendicular to the interface, the crack propagates at a moderate rate from its initial length of 107 Å to reach a length of only 183 Å. Under stress state NO. 4, both the incubation and rapid growth stages for systems with this orientation relationship are very short (only lasting for approximately 7 and 4 cyclic numbers, respectively), while the stable growth stage is significantly prolonged spanning over 29 cyclic numbers.

3.3.3. The Microstructure Evolution and Dislocation Density Analysis

The microstructure evolution of the system with a crack perpendicular to the γ/γ′ phase interface under stress states NO. 1 and NO. 4 is depicted in Figure 15. Due to the low stress triaxiality observed in stress state NO. 1, the system exhibits excellent plastic deformation ability, allowing for passivation of the crack tip through continuous dislocation emission. The system experiences secondary strengthening effects as a result of the continuous dislocation slip and dislocation reaction. Interestingly, when the system is deformed under the stress state of NO. 4, the crack propagates only on one side of the γ′ phase until it fully traverses through the γ′ phase, subsequently meeting with the next γ/γ′ phase interface (Figure 15(b5)). Once this transition occurs and the crack growth reaches stability at this new interface, further propagation becomes hindered due to significant stress constraints impeding dislocation emission at the crack tip.
The dislocation density—cyclic numbers curve of the system with different orientations between the crack and γ/γ′ phase interface is illustrated in Figure 16. Under the stress state NO. 1, there is little difference in the dislocation density of the final deformation state between systems with different crack—phase interface orientations. This can be attributed to continuous dislocation emission, slip, dislocation interaction, and increment occurring during the deformation process of both systems under this stress state. However, for stress state NO. 4, when reaching the final deformation state, it is observed that the system with a crack perpendicular to the phase interface exhibits a significantly higher dislocation density compared to that with a crack parallel to the phase interface. This phenomenon is due to the fact that when the cyclic numbers are N = 15, crack propagation in the γ′ phase has been completed, and the crack tip meets with the next γ/γ′ phase interface (Figure 15(b5)), at which the dislocation density of the system reaches the maximum. In the subsequent deformation process, due to the hindering effect of the next γ/γ′ phase interface on crack propagation (Figure 15(b6)), the crack hardly continues to propagate, resulting in the dislocations density remaining almost constant during the process. This result is consistent with the research of Xiao et al. [19].

4. Conclusions

The deformation and crack propagation behaviors of the Ni-based superalloy were investigated using MD simulations, with a focus on the influence of stress states, crack—γ/γ′ phase interface relative locations, and orientation. The main conclusions were drawn, as follows:
  • With the change in stress state from low stress triaxiality to high stress triaxiality, there is a shift in deformation behavior and crack propagation mode from ductile behavior to brittle behavior.
  • The deformation system with cracks located in both the γ and γ′ phase exhibits the slowest growth rate under any applied stress states, while demonstrating obvious plastic behavior during the deformation.
  • For the deformation system with a crack perpendicular to the γ/γ′ phase interface, the γ/γ′ phase interface will hinder the crack propagation.
Our research provides interesting observations of the deformation and crack propagation behaviors on an atomic level and at nano-scale which are important for understanding deformation and fracture behaviors at a macroscopic scale for the Ni-based superalloy.

Author Contributions

X.Q.: Writing original manuscript; Y.L.: Review and editing manuscript; J.G.: Visualization and analysis. All authors have read and agreed to the published version of the manuscript.

Funding

This work was finally funded by the Engineering Technology Research Center (NO. [2019]5303), the central government guides local science and technology development (NO. [2019]4011) and the Project of the Education Department of Guizhou Province (NO. [2021]315).

Data Availability Statement

All relevant data are within the paper.

Acknowledgments

The authors are grateful for the research support of Yan Wanjun in massively parallel computing.

Conflicts of Interest

The authors declare no conflict of interest.

References

  1. Pollock, T.M.; Tin, S. Nickel-Based Superalloys for Advanced Turbine Engines: Chemistry, Microstructure and Properties. J. Propuls. Power 2006, 22, 361–374. [Google Scholar] [CrossRef]
  2. Miao, J.; Pollock, T.M.; Wayne Jones, J. Crystallographic fatigue crack initiation in nickel-based superalloy René 88DT at elevated temperature. Acta Mater. 2009, 57, 5964–5974. [Google Scholar] [CrossRef]
  3. Pineau, A.; Antolovich, S.D. High temperature fatigue of nickel-base superalloys—A review with special emphasis on deformation modes and oxidation. Eng. Fail. Anal. 2009, 16, 2668–2697. [Google Scholar] [CrossRef]
  4. Texier, D.; Stinville, J.-C.; Echlin, M.P.; Pierret, S.; Villechaise, P.; Pollock, T.M.; Cormier, J. Short crack propagation from cracked non-metallic inclusions in a Ni-based polycrystalline superalloy. Acta Mater. 2019, 165, 241–258. [Google Scholar] [CrossRef]
  5. Andrew, D.L.; Carlson, S.S.; Macha, J.H.; Pilarczyk, R.T. Investigating and interpreting failure analysis of high strength nuts made from nickel-base superalloy. Eng. Fail. Anal. 2017, 74, 35–53. [Google Scholar] [CrossRef]
  6. Qin, X.; Liang, Y.; Gu, J.; Peng, G. The Effect of Interatomic Potentials on the Nature of Nanohole Propagation in Single-Crystal Nickel: A Molecular Dynamics Simulation Study. Crystals 2023, 13, 585. [Google Scholar] [CrossRef]
  7. Guin, L.; Raphanel, J.L.; Kysar, J.W. Atomistically derived cohesive zone model of intergranular fracture in polycrystalline graphene. J. Appl. Phys. 2016, 119, 245107. [Google Scholar] [CrossRef]
  8. Zhang, Y.; Jiang, S.; Zhu, X.; Zhao, Y. Mechanisms of crack propagation in nanoscale single crystal, bicrystal and tricrystal nickels based on molecular dynamics simulation. Results Phys. 2017, 7, 1722–1733. [Google Scholar] [CrossRef]
  9. Elapolu, M.S.R.; Tabarraei, A. Atomistic Simulation-Based Cohesive Zone Law of Hydrogenated Grain Boundaries of Graphene. J. Phys. Chem. C 2020, 124, 17308–17319. [Google Scholar] [CrossRef]
  10. Elapolu, M.S.R.; Tabarraei, A. Mechanical and Fracture Properties of Polycrystalline Graphene with Hydrogenated Grain Boundaries. J. Phys. Chem. C 2021, 125, 11147–11158. [Google Scholar] [CrossRef]
  11. Wu, W.-P.; Yao, Z.-Z. Molecular dynamics simulation of stress distribution and microstructure evolution ahead of a growing crack in single crystal nickel. Theor. Appl. Fract. Mech. 2012, 62, 67–75. [Google Scholar] [CrossRef]
  12. Zhang, J.; Ghosh, S. Molecular dynamics based study and characterization of deformation mechanisms near a crack in a crystalline material. J. Mech. Phys. Solids 2013, 61, 1670–1690. [Google Scholar] [CrossRef]
  13. Chang, L.; Kitamura, T.; Zhou, C.-Y. Atomic simulation of the orientation effects on crack tip behavior in titanium single crystal. Theor. Appl. Fract. Mech. 2020, 110, 102791. [Google Scholar] [CrossRef]
  14. Fang, W.; Xie, H.; Yin, F.; Li, J.; Khan, D.F.; Fang, Q. Molecular dynamics simulation of grain boundary geometry on crack propagation of bi-crystal aluminum. Mater. Sci. Eng. A 2016, 666, 314–319. [Google Scholar] [CrossRef]
  15. Zhang, Y.; Jiang, S.; Zhu, X.; Zhao, Y. A molecular dynamics study of intercrystalline crack propagation in nano-nickel bicrystal films with (0 1 0) twist boundary. Eng. Fract. Mech. 2016, 168, 147–159. [Google Scholar] [CrossRef]
  16. Moverare, J.J.; Gustafsson, D. Hold-time effect on the thermo-mechanical fatigue crack growth behaviour of Inconel 718. Mater. Sci. Eng. A 2011, 528, 8660–8670. [Google Scholar] [CrossRef]
  17. Prasad, K.; Sarkar, R.; Ghosal, P.; Kumar, V. Simultaneous creep–fatigue damage accumulation of forged turbine disc of IN 718 superalloy. Mater. Sci. Eng. A 2013, 572, 1–7. [Google Scholar] [CrossRef]
  18. Mahobia, G.S.; Paulose, N.; Mannan, S.L.; Sudhakar, R.G.; Chattopadhyay, K.; Santhi Srinivas, N.C.; Singh, V. Effect of hot corrosion on low cycle fatigue behavior of superalloy IN718. Int. J. Fatigue 2014, 59, 272–281. [Google Scholar] [CrossRef]
  19. Ma, L.; Xiao, S.; Deng, H.; Hu, W. Tensile mechanical properties of Ni-based superalloy of nanophases using molecular dynamics simulation. Phys. Status Solidi 2016, 253, 726–732. [Google Scholar] [CrossRef]
  20. Shang, J.; Yang, F.; Li, C.; Wei, N.; Tan, X. Size effect on the plastic deformation of pre-void Ni/Ni3Al interface under uniaxial tension: A molecular dynamics simulation. Comput. Mater. Sci. 2018, 148, 200–206. [Google Scholar] [CrossRef]
  21. Liu, H.; Wang, X.M.; Liang, H.; Zhao, Z.N.; Li, L.; Yue, Z.F.; Deng, C.H. The effect of void defect on the evolution mechanisms of dislocations and mechanical properties in nickel-based superalloys by molecular dynamics simulation of real γ/γ′ structures. Int. J. Solids Struct. 2020, 191–192, 464–472. [Google Scholar] [CrossRef]
  22. Cui, C.; Gong, X.; Chen, L.; Xu, W.; Chen, L. Atomic-scale investigations on dislocation-precipitate interactions influenced by voids in Ni-based superalloys. Int. J. Mech. Sci. 2022, 216, 106945. [Google Scholar] [CrossRef]
  23. Peng, X.; Liang, Y.; Qin, X.; Gu, J. The effect of ultrasonic surface rolling process on tension-tension fatigue limit of small diameter specimens of Inconel 718 superalloy. Int. J. Fatigue 2022, 162, 106964. [Google Scholar] [CrossRef]
  24. Thompson, A.P.; Aktulga, H.M.; Berger, R.; Bolintineanu, D.S.; Brown, W.M.; Crozier, P.S.; in ′t Veld, P.J.; Kohlmeyer, A.; Moore, S.G.; Nguyen, T.D.; et al. LAMMPS—A flexible simulation tool for particle-based materials modeling at the atomic, meso, and continuum scales. Comput. Phys. Commun. 2022, 271, 108171. [Google Scholar] [CrossRef]
  25. Parrinello, M.; Rahman, A. Polymorphic transitions in single crystals: A new molecular dynamics method. J. Appl. Phys. 1981, 52, 7182–7190. [Google Scholar] [CrossRef]
  26. Martyna, G.J.; Tobias, D.J.; Klein, M.L. Constant pressure molecular dynamics algorithms. J. Chem. Phys. 1994, 101, 4177–4189. [Google Scholar] [CrossRef]
  27. Tuckerman, M.E.; Alejandre, J.; López-Rendón, R.; Jochim, A.L.; Martyna, G.J. A Liouville-operator derived measure-preserving integrator for molecular dynamics simulations in the isothermal–isobaric ensemble. J. Phys. A Math. Gen. 2006, 39, 5629. [Google Scholar] [CrossRef]
  28. Purja Pun, G.P.; Mishin, Y. Development of an interatomic potential for the Ni-Al system. Philos. Mag. 2009, 89, 3245–3267. [Google Scholar] [CrossRef]
  29. Honeycutt, J.D.; Andersen, H.C. Molecular dynamics study of melting and freezing of small Lennard-Jones clusters. J. Phys. Chem. 1987, 91, 4950–4963. [Google Scholar] [CrossRef]
  30. Faken, D.; Jónsson, H. Systematic analysis of local atomic structure combined with 3D computer graphics. Comput. Mater. Sci. 1994, 2, 279–286. [Google Scholar] [CrossRef]
  31. Stukowski, A. Visualization and analysis of atomistic simulation data with OVITO—The Open Visualization Tool. Model. Simul. Mater. Sci. Eng. 2010, 18, 015012. [Google Scholar] [CrossRef]
  32. Stukowski, A.; Bulatov, V.V.; Arsenlis, A. Automated identification and indexing of dislocations in crystal interfaces. Model. Simul. Mater. Sci. Eng. 2012, 20, 085007. [Google Scholar] [CrossRef]
  33. Xu, S.; Deng, X. Nanoscale void nucleation and growth and crack tip stress evolution ahead of a growing crack in a single crystal. Nanotechnology 2008, 19, 115705. [Google Scholar] [CrossRef] [PubMed]
  34. Zhou, X.W.; Johnson, R.A.; Wadley, H.N.G. Misfit-energy-increasing dislocations in vapor-deposited CoFe/NiFe multilayers. Phys. Rev. B 2004, 69, 144113. [Google Scholar] [CrossRef]
  35. Černý, M.; Pokluda, J. Ideal tensile strength of cubic crystals under superimposed transverse biaxial stresses from first principles. Phys. Rev. B 2010, 82, 174106. [Google Scholar] [CrossRef]
  36. Pei, L.; Lu, C.; Tieu, K.; Zhao, X.; Zhang, L.; Cheng, K. Ductile-to-brittle fracture transition in polycrystalline nickel under tensile hydrostatic stress. Comput. Mater. Sci. 2015, 109, 147–156. [Google Scholar] [CrossRef]
  37. Yang, Z.; Zhang, G.; Luo, G.; Sun, X.; Zhao, J. Mechanical properties of gold twinned nanocubes under different triaxial tensile rates. Phys. Lett. A 2016, 380, 2674–2677. [Google Scholar] [CrossRef]
  38. Yang, Y.; Wang, X.; Zhang, G.; Zhang, Y.; Yang, Z. Molecular dynamics simulations of single crystal copper nanocubes under triaxial tensile loading. Comput. Mater. Sci. 2017, 138, 377–383. [Google Scholar] [CrossRef]
Figure 1. The MD model of Ni-based superalloy with crack.
Crystals 13 01446 g001
Figure 2. The strain–time relationship in the cyclic deformation with increasing strain amplitude.
Crystals 13 01446 g002
Figure 3. The cyclic loading–unloading schematic diagram under different stress states: (a) NO. 1, (b) NO. 2, (c) NO. 3, and (d) NO. 4.
Crystals 13 01446 g003
Figure 4. The relationship of the stress and strain of the deformation system under various stress states, where (a) is the initial stress triaxiality variation, (b) is the stress–strain curve, and (c) is the characteristic strain variation.
Crystals 13 01446 g004
Figure 5. The crack length versus the cyclic numbers curve of the deformation system under various stress states. The symbols I, II, and III represent different stages of crack growth.
Crystals 13 01446 g005
Figure 6. The microstructure evolution of the deformation system under different stress states.
Crystals 13 01446 g006
Figure 7. The dislocations density versus the cyclic numbers curve of the deformation system under various stress states.
Crystals 13 01446 g007
Figure 8. The relationship of the stress and strain of the deformation system under various crack locations, where (a) is the initial stress triaxiality variation, (b) is the stress-strain curve, and (c) is the characteristic strain variation.
Crystals 13 01446 g008
Figure 9. The crack length versus the cyclic numbers curve of the deformation system under various crack locations. The symbols I, II, and III represent different stages of crack growth.
Crystals 13 01446 g009
Figure 10. The microstructure evolution of the deformation system with crack located in both the γ and γ′ phase. The red arrow on the subfigure (a6) indicates a dislocation slip band between the two cracks.
Crystals 13 01446 g010
Figure 11. The microstructure evolution and stress distribution of the deformation system with crack located at the γ′ phase.
Crystals 13 01446 g011
Figure 12. The dislocations density versus the cyclic numbers curve of the deformation system under various crack distributions.
Crystals 13 01446 g012
Figure 13. The relationship of the stress and strain of the deformation system under various crack orientations. And (a) is the initial stress triaxiality variation, (b) is the stress-strain curve, and (c) is the characteristic strain variation.
Crystals 13 01446 g013
Figure 14. The crack length versus the cyclic numbers curve of the deformation system under various crack orientations. The symbols I, II, and III represent different stages of crack growth.
Crystals 13 01446 g014
Figure 15. The microstructure evolution of deformation system of the crack ⊥ γ/γ′ phase interface under stress state of NO. 1 and NO. 4.
Crystals 13 01446 g015
Figure 16. The dislocations density versus the cyclic numbers curve of the deformation system under various crack orientations.
Crystals 13 01446 g016
Table 1. The specific parameters (strain rate) of four types of different stress states.
Stress StatesX DirectionY and Z Direction
NO. 1loading+1 × 10⁻³ ps−1−3 × 10⁻⁴ ps−1
unloading−1 × 10⁻³ ps−1+3 × 10⁻⁴ ps−1
NO. 2loading+1 × 10⁻³ ps−1−2 × 10⁻⁴ ps−1
unloading−1 × 10⁻³ ps−1+2 × 10⁻⁴ ps−1
NO. 3loading+1 × 10⁻³ ps−10
unloading−1 × 10⁻³ ps−10
NO. 4loading+1 × 10⁻³ ps−1+1 × 10⁻⁴ ps−1
unloading−1 × 10⁻³ ps−1−1 × 10⁻⁴ ps−1
Table 2. The relevant parameters of the Ni-Al interatomic EAM/alloy potential.
ParameterValue
N r h o 10,000
d r h o 0.5013228884 × 10⁻³
N r 10,000
d r 0.62872 × 10⁻³
cutoff6.28721
where N r h o and N r are the number of tabulated values in the subsequent arrays; d r h o and d r are the spacing in density and distance space for the values in those arrays.
Disclaimer/Publisher’s Note: The statements, opinions and data contained in all publications are solely those of the individual author(s) and contributor(s) and not of MDPI and/or the editor(s). MDPI and/or the editor(s) disclaim responsibility for any injury to people or property resulting from any ideas, methods, instructions or products referred to in the content.

