Article

A Numerical Study on the Performance of Liquid Crystal Biosensor Microdroplets

Department of Chemical Engineering, Toronto Metropolitan University, 350 Victoria Street, Toronto, ON M5B 2K3, Canada
*
Author to whom correspondence should be addressed.
Crystals 2023, 13(8), 1237; https://doi.org/10.3390/cryst13081237
Submission received: 30 June 2023 / Revised: 18 July 2023 / Accepted: 4 August 2023 / Published: 10 August 2023
(This article belongs to the Special Issue Liquid Crystals and New Applications in Sensing and Sensors)

Abstract

:
The numerical results from the modeling of liquid crystals dispersed in aqueous solutions in the form of axially symmetric droplets, with the aim of helping to facilitate the development of liquid crystal biosensors, were obtained. We developed a transient two-dimensional nonlinear model obtained via torque balance that incorporates Frank’s elastic free energy. In order to perform parametric studies, we defined the scaled parameters based on the surface viscosity and the homeotropic anchoring energy at the droplet interface. To evaluate the performance of the biosensor, the average angle and characteristic time were defined as performance criteria. Using these results, we studied the bulk reorientation of liquid crystal droplets in aqueous solutions caused by biomolecular interaction. Furthermore, we examined how surface viscosity affects the performance of a biosensor in the case of weak planar anchoring. The droplet interface ordering was modeled using the Euler–Lagrange equation. The droplets’ equilibrium was determined by minimizing their total distortion energy based on the interaction between their surface and bulk elastic energy. Two factors that contributed to the biosensor performance were homeotropic strength and surface viscosity. This highlights the importance of controlling the surface and physicochemical properties to achieve the desired liquid crystal orientation. In addition, our results provide insight into the role that surface viscosity plays in controlling radial configuration.

1. Introduction

Liquid crystal biosensors are optical sensors that detect biological and chemical species using liquid crystals as sensing substrates. Liquid crystals have specific properties like birefringence and high sensitivity of orientation when interacting with biomolecules in aqueous solutions [1,2]. Thermotropic liquid crystals have been demonstrated to detect a wide range of biomolecules and can be fabricated into thin films or microdroplet emulsions in water [3,4,5]. Liquid crystal biosensors work based on the orientation changes in response to the interface realignment. The orientation of liquid crystals in the bulk depends on the properties and geometry of the interfaces. In general, any changes at the liquid crystal surface could be propagated through the bulk up to 100 μm due to the long-range orientational order. Polarized light can be utilized to amplify and observe the small variation in liquid crystal interface alignment. This can be used as the basis to develop liquid crystal biosensors to detect biological or chemical agents. Studies show that the adsorption of phospholipids, surfactants, proteins, and bacteria at the interface triggers the ordering transmission by changing the anchoring and easy axis at the liquid crystal interface [6,7,8].
Liquid crystal films and droplets in aqueous solutions are examples of platforms that detect biological species due to their intermolecular interactions. There is a wide range of biological species that liquid crystal biosensors can detect, including bacteria, viruses, and proteins. Therefore, they could be used in areas such as medical, environmental, and food sectors [9,10,11].
Researchers have shown that liquid crystals in water emulsions can be used for the detection of target analytes. Changing the droplet orientation from bipolar to radial and changing the optical texture allows for the detection of chemical and biological species [12,13,14,15,16,17].
Emulsions of liquid crystals provide an additional advantage over liquid crystals formed at planar interfaces. Liquid crystal droplet biosensors do not require the preparation of a solid substrate. In addition, the droplet has a higher surface area to volume ratio and can adsorb a wide variety of targets on its surfaces, allowing a greater amount of target analytes to be absorbed [18,19].
A liquid crystal droplet’s orientation depends on the molecular alignment on its surface. The liquid crystal droplet forms a tangential orientation in pure water under the planar anchoring condition. In the absence of surfactants or any other external fields, a parallel alignment in which the director tends to be aligned tangentially to the droplet interface creates a bipolar configuration [3]. A bipolar orientation is characterized by two defects, which are located at the end of the axis of symmetry at opposite points and are caused by tangential or planar anchoring within the droplet surface, as illustrated in Figure 1a. Experimental studies have shown that thermotropic nematic liquid crystals dispersed in aqueous solutions respond to chemical analytes at the interface. By adsorbing surfactant or lipid at the interface, the planar preferred alignment of liquid crystal then changes to homotropic alignment. Adsorption of surfactants at the surface could cause anchoring transition or change in the easy axis [20]. The droplet’s orientation transitions from a bipolar to a radial within the droplet, which changes the optical appearance [7]. The radial configuration of the droplet exhibits the single-point defect at its center due to its perpendicular anchoring on the surface of the droplet, as illustrated in Figure 1b.
The design of liquid crystal droplet biosensors has been studied based on configuration transitions corresponding to changes in anisotropic optical properties such as birefringence [7,21]. The optical patterns are created by the deformed liquid crystal system when light propagates through it. It provides a way to identify this transition from a bipolar to radial orientation in the sample. The bipolar liquid crystal microdroplets appear brightly in aqueous solutions. In contrast, the radial orientation has a dark texture with a cross-like pattern. Thus, this creates a unique optical response, which is then used to identify and quantify the presence of the biological agent. Previous experimental studies investigated the optical texture to understand the liquid crystal orientation within the droplets dispersed in the aqueous phase [1,4,19]. Since the optical pattern of the liquid crystal biosensor can detect the presence and concentration of the biological analyte, the changes in the orientation can be used to study its performance [22].
Studies in the past have shown that liquid crystal emulsions can detect the presence of a variety of target analysts. Several experimental studies show that liquid crystal emulsion droplets dispersed in an aqueous solution can be used as a sensing platform. For example, the orientational changes in the liquid crystal droplets from a tangential to perpendicular alignment due to the adsorption of surfactants at the aqueous interface could be the base of the surface-induced droplet biosensors [22,23]. A droplet’s configuration is significantly affected by its diameter. It is also affected by the surface’s physicochemical properties and temperature, whereas the orientation depends on the interfacial energies [24]. Moreover, the configuration of liquid crystal droplets is greatly influenced by their size, and most preparation methods do not allow us to control the size of the droplets [8,25].
Although liquid crystal droplet systems can sense chemical and biological materials, this presents a different technical challenge, including inconsistency in the shape and size of the droplets as well as mobility through the aqueous medium that typically translates into a velocity of 1μm/s. Since dispersion droplets move freely within an aqueous solution, it is difficult to characterize the individual droplets using the optical method because it is difficult to obtain quantitative information about the liquid crystal orientation at the interface experimentally using the optical method. As one way to overcome this issue, researchers would immobilize liquid crystal droplets in an aqueous solution. For instance, adding glycerol to an aqueous phase increases the viscosity and decreases droplet motion. However, this affects the interfacial properties of the droplet, such as its surface viscosity [4,19,26].
In the past, Kingister et. al. attempted to address this issue by immobilizing the liquid crystal droplets on chemically-tailored solid surfaces. However, they observed that the immobilization of the droplets disturbs the order of the liquid crystal within the droplet. They suggested that the immobilization of liquid crystal droplets lead to changes in the ordering of the liquid crystal that depend on the physicochemical properties of the surface [18]. Miller et. al. also reported the challenge that increasing the viscosity of the aqueous phase will not only reduce droplet motion but also alter the surface properties of the liquid crystal droplet [4].
As part of our study, we analyzed the sensitivity of the liquid crystal droplet biosensors and surface interactions as a result of biomolecular adsorption. Firstly, two dimensionless surface parameters were introduced to characterize the interface. Then, we manipulated the parameter related to interfacial properties to optimize the liquid crystal droplet biosensor performance. To do this, it was assumed that the easy axis will have a sudden transition from planar to homeotropic in the presence of sufficient surfactant concentration [27]. Our second objective was to investigate the bulk orientational response to variations in surface viscosity without changing the easy axis, assuming weak planar anchoring energy at the surface of the droplet due to the presence of chemical analytes. Additionally, we examined how viscosity affects the droplet’s dynamics behavior and response time.
To investigate the effect of surface properties, we assumed that the obtainment of radial configurations of liquid crystal droplets was induced by perpendicular anchoring with the uniform microdroplet scale in addition to a constant temperature and uniform interface properties [25,28].
To our knowledge, the mathematical modeling and computer simulation of transient reorientation caused by interface interactions have not been extensively studied for emulsion liquid crystal biosensors. Numerical studies were found to be able to resolve some gaps relevant to surface viscosity, anchoring energy, and easy axis at the interfaces of the droplets during the biosensor application. In this study, a transient two-dimensional nonlinear model based on the Leslie–Ericksen theory on cylindrical coordinates is used to analyze the deformation of the liquid crystal droplets. Additionally, the Frank energy was incorporated into the governing equation to model the droplet and surface interaction. The model was then used to simulate the interaction between the droplet and the surface. The results of the simulation will help to understand the dynamics of the droplets and how the surface characteristics affect the droplet behavior during biosensor usage.

2. Formulation of the Model and Numerical Methods

2.1. Theory

This section describes the theoretical background of developing the governing equation and numerical method for solving our model. A liquid crystal droplet’s director reorientation is determined using torque balance, according to Leslie–Ericksen’s theory. The liquid crystal droplet was studied using the nonlinear continuum mechanical theory, and the director field (n) was defined as the preferred average orientations of rod-like molecules. The Frank free energy equation for describing the energy associated with liquid crystal strains in the system is as follows [29]:
F d = 1 2 K 11 · n 2 + 1 2 K 22 n · × n 2 + 1 2 K 33 n × × n 2
where K11, K22, and K33 are the Frank elastic constants associated with the three types of deformation for splay, twist, and bend, respectively. The elastic constants of the liquid crystals determine the restoring torques when a system is reoriented or disturbed from equilibrium. In liquid crystal systems, these constants measure the system’s resistance to distortion. Typically, these constants are around 10−11 N [30].
A Cartesian vector representation of director reorientation is given in the following torque balance:
Γ e + Γ v = 0
where Γv is the viscous torque and Γe is the elastic torque. The constitutive equations to determine the elastic and viscous torques can be calculated using the equations below:
Γ e = n × h
where h is defined as the molecular field, which can be found using the following constitutive equations:
h = h S + h T + h B
h S = K 11 · n
h T = K 22 a × n + × a n
h B = K 33 b × × n + × n × b
The constitutive equations for a and b are defined as follows:
a = n · × n
b = n × × n
The following Equation (4a) is used to calculate the viscous torque:
Γ v = n × γ 1 N + γ 2 A · n
where γ 1 and γ 2 are the rotational and irrotational torque coefficients. The kinematic constitutive equations are defined as follows:
A = 1 2 V T + V
Ω = 1 2 V T V
where A is the strain tensor and Ω is the angular velocity tensor. It was assumed that the liquid crystal has no bulk movement within the droplet, so the system is stationary with zero velocity. As a result, A and Ω are zero. Also, vector N represents the angular velocity of the director relative to that fluid, and it is defined below:
N = n ˙ Ω · n
where the superposed dot represents the material time derivative.

2.2. Mathematical Model

The cross section of a bipolar droplet is shown in Figure 2 in the cylindrical coordinate system (r, θ, z). The director field n is described as follows:
n ( r , z , t ) = sin ϕ ( r , z , t ) , 0 , cos ϕ ( r , z , t )
where ɸ is the polar angle measured from the z-axis, which is space- and time-dependent. In this system study, the droplets are axisymmetric, so it was considered to be two-dimensional.
The Frank energy is derived from combining Equation (6) into Equation (1), as expressed in the two-dimensional cylindrical coordinate system:
F d = 1 2 K 11 s i n 2 ϕ r + 1 2 K 11 r ϕ z 2 s i n 2 ϕ K 11 ϕ z s i n 2 ϕ + 1 2 K 11 ϕ r s i n ( 2 ϕ ) 1 2 K 11 r ϕ z ϕ r s i n ( 2 ϕ ) + 1 2 K 11 r ϕ r 2 c o s 2 ϕ + 1 2 K 33 r ϕ r 2 s i n 2 ϕ + 1 2 K 33 r ϕ z ϕ r s i n ( 2 ϕ ) + 1 2 K 33 r ϕ z 2 c o s 2 ϕ
In the absence of an external field, the director orientation within the droplet is determined using the balance between the bulk and surface energy as a result of minimizing the elastic free energy. The total free energy of the liquid crystals contained within a droplet is given by the following expression:
F = V F d d V + S F s d s
where Fd can be calculated from the Frank free energy (1), and Fs can be determined using the Rapini–Papoular expression as follows [31]:
F s = 1 2 W ϕ sin 2 ( ϕ s ϕ e )
where W ϕ is the anchoring coefficient that characterizes the strength of surface anchoring. The droplet anchoring angles ɸs and ɸe are the actual and preferred anchoring angles at the droplet surface, respectively. In the case of strong anchoring at the surface, the director aligns with the easy axis. In contrast, weak anchoring allows the system to evolve towards an intermediate equilibrium by balancing viscous and elastic torques depending on the strength of the anchoring.
The Euler–Lagrange equation describes the distortion of a liquid crystal droplet’s surface through the balance of generalized and frictional forces. The equation was derived via the calculus of variations by balancing elastic and viscous forces to study the interaction dynamics at the interface between a thermotropic liquid crystal droplet and an aqueous phase. There is only one generalized coordinate in the system, ɸ. For our system, the Rayleigh generalized dissipation function was simplified to drive the Euler–Lagrange equation as follows [32]:
R s ϕ ˙ + Φ = 0
where Rs is denoted as the Rayleigh dissipation function for the surfaces, Φ represents elastic forces. Then, the Euler–Lagrange equation is as follows:
R s ϕ ˙ = λ s ϕ t
where the surface viscosity governing the surface director orientation at the liquid crystal droplet aqueous interface is indicated by λs, and an overdot on the function indicates time differentiation.
System energy consists of bulk and surface components. The total free energy of the system can be found according to Equations (7), (9) and (10), as shown below:
F = V F d ϕ , 𝛻 ϕ d V + S F s ϕ d s
The variation of F is shown below:
δ F = V F d ϕ δ ϕ + F d 𝛻 ϕ δ 𝛻 ϕ d V + S F S ϕ δ ϕ d S
The below Equation (14) can be derived using the divergence theorem:
δ F = V F d ϕ δ ϕ 𝛻 F d 𝛻 ϕ δ 𝛻 ϕ d V + S F d ϕ δ ϕ · ν + F S ϕ δ ϕ d S
In this equation, ν is the outward unit normal vector to the enclosing surface S of volume V. The elastic forces at the surface are expressed below:
Φ ϕ = F d ϕ ν + F s ϕ

2.3. Governing Equation

The following scaling relations were used to nondimensionalize the governing equations and boundary conditions, as shown below:
K i i * = K i i K ,       ( f o r   i = 1 , 3 )
K = 1 2 K 11 + K 33
r * = r R
z * = z R
t * = t K γ 1 R 2
In these relations, superscript asterisks denote the dimensionless variables and R is the radius of the droplet.
The non-dimensional parameters of surface viscosity and anchoring energy are defined as follows:
W = 1 2 R W o K 22
λ s * = 2 λ s γ 1 R
By incorporating Equations (2)–(6) and applying scaling Equations (17)–(20), the governing equation was obtained to describe director orientation dynamics. Therefore, the nonlinear partial differential equation that is time-dependent is as follows:
ϕ t = κ 1 2 ϕ r 2 + κ 2 2 ϕ z 2 + κ 3 2 ϕ r z + κ 4 ϕ r 2 + κ 5 ϕ z 2 + κ 6 ϕ r ϕ z + κ 7 ϕ r + κ 8 ϕ z + κ 9
where the spatially and angle-dependent elastic functions {κi}, i = 1, 2, …9 are provided in Appendix A.
The following first-order time-dependent partial differential equations were obtained by combining Equations (7)–(15) and the scaling relations, Equations (17)–(22). Hence, the Euler–Lagrange equation describes liquid crystal motion at an interface as follows:
λ s * ϕ t * = κ 10 + κ 11 ϕ r * + κ 12 ϕ z * + W φ s i n [ 2 ϕ ϕ e ]
As shown in Figure 2, the two-dimensional droplet has symmetry about the z-axis, so the governing Equations (23) and (24) can be solved numerically for half of a circle, where r* > 0. Then, the initial and boundary conditions are defined as follows:
ϕ = ϕ i r , z , t             a t   t = 0 ,             r 0 ,             1 z 1
ϕ r * = 0             a t   t 0 ,             r = 0 ,             1 z 1
λ s * ϕ t * = κ 10 + κ 11 ϕ r * + κ 12 ϕ z * + W φ s i n [ 2 ϕ ϕ e ] a t   t 0 ,             r > 0 ,             z = 1 r 2 1 / 2

2.4. Numerical Method of Solution

For the numerical solution, the Galerkin finite element method [33] with a bilinear basis function was used. The Newton–Raphson iteration was used to solve a set of nonlinear ordinary unsteady differential equations after spatial discretization. Time was discretized using finite differences, and time was integrated using an implicit first-order Euler predictor-corrector. The convergence was achieved when the differences between the two sequence solution vectors reached less than 10−6. Our mathematical model consists of nonlinear time-dependent partial differential equations governed by transient boundary conditions. We developed our mathematical model using Mathematica software and derived all equations in this software. We generated the mesh using the rectangular elements that discretize the two-dimensional droplet geometry. In addition, the initial dimensionless time step considered was 10−5 [33,34,35,36].
We developed the finite element program in FORTRAN 95 language [37], and compiled it using the Intel compiler. The LAPACK solver routines from the Intel Math Kernel Library were used to solve the linear algebraic equations [38]. Analyzing and visualizing our results followed the same procedure as our previous work [39]. Our analysis was performed on the Digital Research Alliance of Canada’s Cedar and Graham clusters using high-performance computing resources.

3. Results and Discussions

In this study, we examined the liquid crystal director configurations within a droplet in relation to changes in surface viscosity and interface anchoring energy. The adsorption of the surfactant was considered the driving force that triggered the realignment of the liquid crystal at the droplet surface, influenced by the surface properties. Therefore, this study is based on the adsorbate-induced bipolar to radial transition, and we assumed that the change in the anchoring transition was caused by amphiphilic adsorption [40].
The anchoring energy of the liquid crystal at interfaces with aqueous solutions varies with the biomolecule concentration. The adsorption of biomolecules on the surface enhances homeotropic anchoring and causes the liquid crystal molecules to be rearranged to the radial configurations from the bipolar orientation within the droplet. Moreover, it was assumed in this study that the defect changes abruptly. Therefore, we did not consider other possible configurations of the liquid crystal droplets caused by defect migration. In addition, we assumed the sufficient surfactants at the liquid crystal aqueous interface caused the uniform transition from tangential to perpendicular anchoring [6].
Since topological defects are governed by both surface and bulk elastic energies [22,41], we did not investigate whether the defects could cause droplet reorientation as reported by Lin [18,20]. As part of this parametric study, we kept the droplet size constant while focusing on the surface properties. The droplet diameter, however, is considered when defining the parameters in Equations (22) and (23).
Our study investigated the role of interface properties in droplet reorientation by evaluating the droplet deformation under different parameter combinations. A droplet’s deviation from the preferred alignment at the surface is determined by the anchoring energy at its interface. When the director is aligned with an easy axis, energy is at its minimum. Generally, when the anchoring strength is high, the director aligns with the surface alignment. However, when the W is finite and reduced, the surface orientation is determined by minimizing the total energy, which is the balance between bulk and surface energy. With the help of this parametric study, we can investigate the interaction between the liquid crystals inside the droplets and the aqueous solution interface. In this discussion, we examined the effects of dimensionless surface viscosity and anchoring energy. A comparison was made between the numerical results and the experimental data that were available for validation [4].
Figure 3 illustrates the initial conditions of the liquid crystal confined within a circular geometry, which was obtained via a mathematical model with fixed tangential boundary conditions representing to the strong planar anchoring in an aqueous solution as a result of a tangential easy axis. We used this obtained initial condition for all cases studied for our parametric studies.
The experimental results of the emulsion liquid crystal configuration in an aqueous solution in the absence of a surfactant or external field were assumed as the initial condition. In addition, we assumed that the droplet size favors a bipolar structure.
Considering the discussion above, the bipolar configuration exists due to the strong tangential anchoring at the surface. The adsorption or interaction of the surfactant or chemical analytes on the surface changes the anchoring energy and easy axis, leading to a realignment of the liquid crystal bulk within its spherical geometry.
The effect of the intermolecular interaction and absorption of chemical analytes at the surface of the liquid crystal droplets in relation to the liquid crystal inside the droplet is modeled using the Euler–Lagrange equation, which is based on the dissipation interaction between the surface and the bulk of the liquid crystal. The initial configuration of the liquid crystal emulsion is determined using the physicochemical properties of the droplet surface. Additionally, molecular interactions can explain director reorientation within the droplet.
To study the dynamics of the orientation of liquid crystal droplet biosensors, we introduced mean magnitude angle and characteristic time to investigate the performance of liquid crystal biosensors. The mean magnitude of the orientation angle ϕ of the liquid crystal within the droplet is defined below:
ϕ = 1 π R 2 1 1 1 z * 2 1 / 2 1 z * 2 1 / 2 ϕ d r * d z *
The mean angle is the average of the angles within the two-dimensional droplet geometry.
In Figure 4, a semilogarithmic plot of the magnitude of the mean polar orientation angle <|| ϕ ss||> at steady state conditions relative to homeotropic anchoring strength at different surface viscosity parameters is shown. The data pattern shows a sigmoidal trend as W increases. As homeotropic anchoring increases, the result of a sigmoidal trend indicates a slow steady decline in the mean angle at steady state, which is consistent with the definition of homeotropic anchoring energy mentioned above. This suggests that the increase in homeotropic anchoring strength is correlated with the decrease in the mean angle at a steady state. Additionally, it shows that the mean angle within the range of 10−2 < W < 102 differs with surface viscosity. Thus, the results demonstrate that the surface viscosity parameter has a significant impact on the mean polar orientation angle. The results indicate the orientation of the liquid crystal is interrelated with both surface viscosity and homeotropic anchoring energy.
As shown in Figure 5, three case studies illustrate bulk reorientation at a steady state caused by adding surfactants at the liquid crystal droplet aqueous interface. Increasing anchoring energy tends to align the surface director with the surface perpendicular alignment. It has already been mentioned that surfactant concentration at the interface impacts homeotropic anchoring strength. Increasing the concentration of surfactants causes greater anchoring energy, causing the surface director to become even more aligned with the surface perpendicular alignment.
Furthermore, the mean angle transmitted to the radial configuration is not linear for W ≤ 10. However, the mean angle <|| ϕ ss||> at steady state is constant for W ≥ 10 and for the surface viscosity λs* ≤ 102. Furthermore, <|| ϕ ss||> is constant for higher viscosity with higher homeotropic anchoring in the range of 10 ≤ W ≤ 102 with a surface viscosity of 102 < λs* ≤ 103, as depicted in the plot. Thus, for the mentioned ranges, the mean angle transmitted to the radial configuration is linear. This suggests that to fully obtain the radial orientation of the surface viscosity, W should be kept within the recommended ranges for the best results during the biosensor performance. Thus, the distinctive optical textures corresponding to different liquid crystal orientations in this range can be observed under a polarized microscope.
Moreover, the mean angle decreases with the increasing homeotropic anchoring and the decreasing surface viscosity. Therefore, by examining the higher viscosity λs* > 103, the W = 102 is sufficient to obtain a complete dark appearance with a cross-like texture during the biosensor performance, which represents the radial configuration.
Since the mean angle gradually decreases, a relaxation characteristic time was defined as used in our past papers [39,42]. The time constant is defined as 36.78 percent of the declining process to investigate the temporal average orientation within the droplet. This process is used to measure how fast the droplet reorients towards the radial configuration.
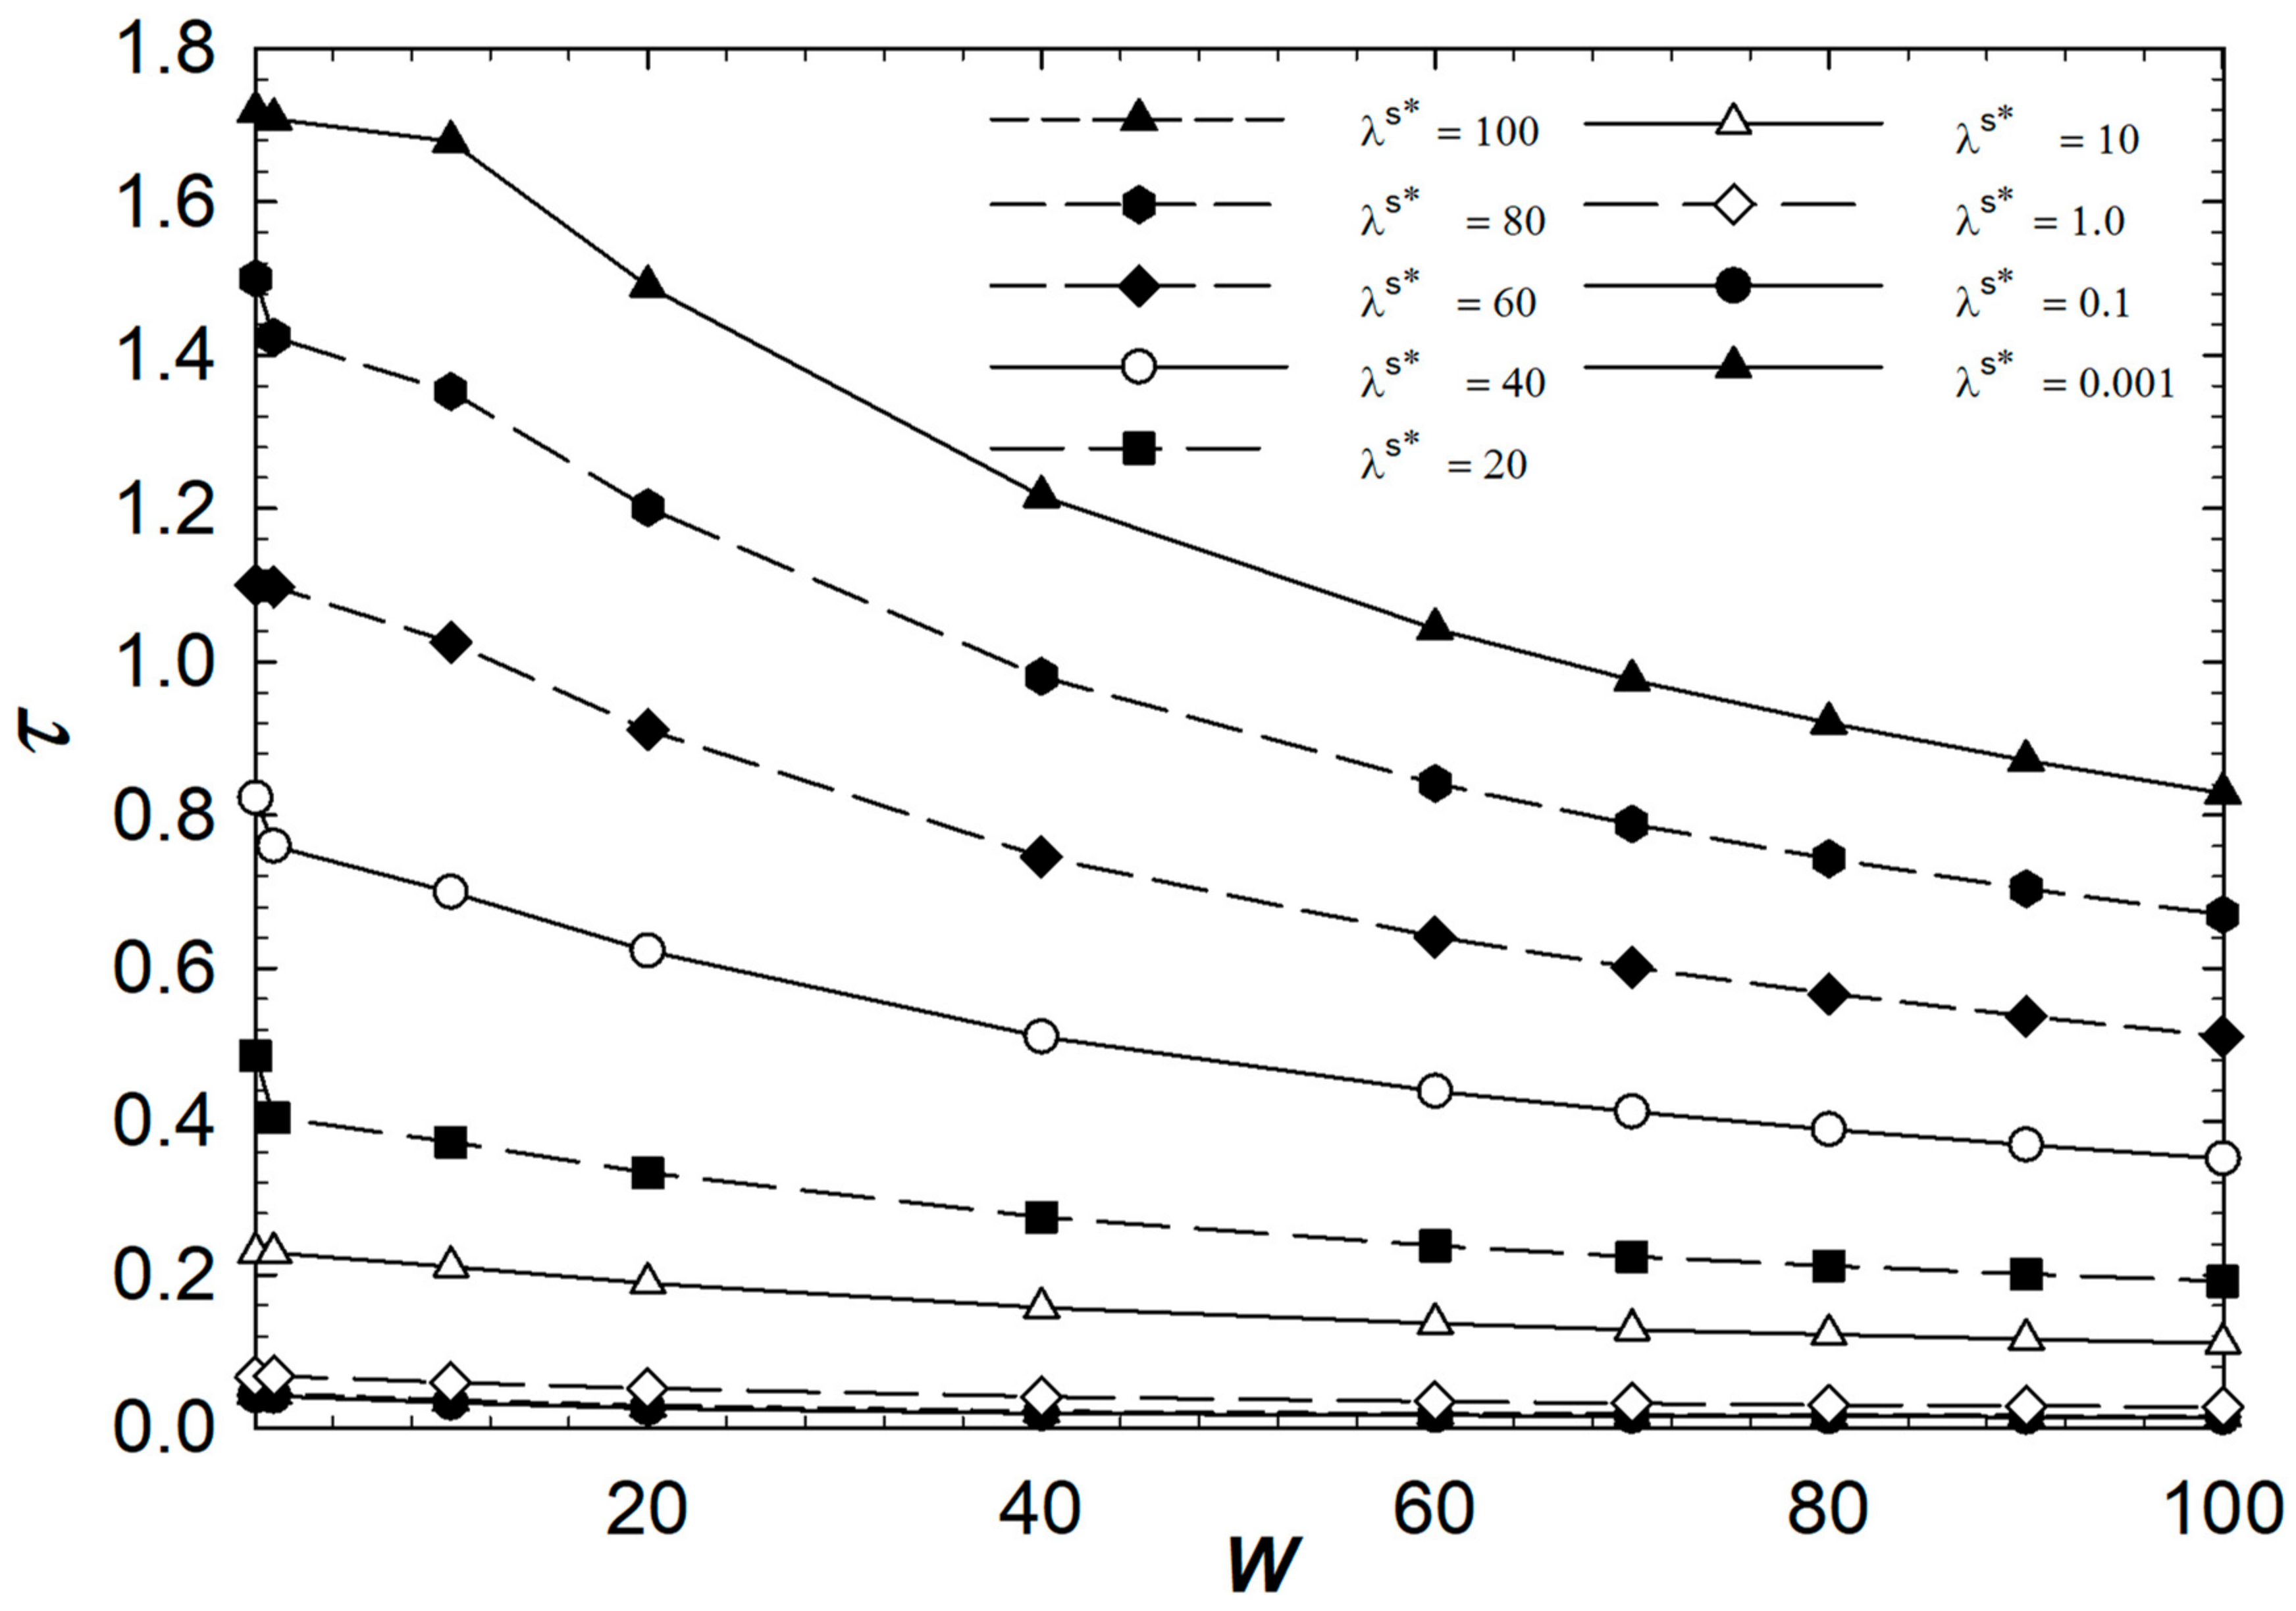
Figure 6 shows the relation between τ and W on a linear scale. The plot shows the downward trend of characteristic time versus W for different surface viscosity λs* values. The overall trend of τ follows the sigmoidal pattern as W increases. The plot depicted that τ gradually decreases as W increases with the sigmoidal trend in the range of 10−2 < λs* ≤ 102. The decrease in τ is steeper in the range of 50 < λs* ≤ 102 and τ is almost constant in the range of λs* ≤ 1. The minimum value of τ is obtained at λs* ≤ 1. Also, in this range, the relation of τ and W is linear. This suggests that the maximum efficiency of the system is achieved for higher values of W and lower values of λs*. This suggests that the system can be improved by adjusting these parameters according to the desired performance. Tuning these parameters can help in achieving the desired performance of the system. The results show that the radial configuration and anchoring energy are related and depend on the surface viscosity.
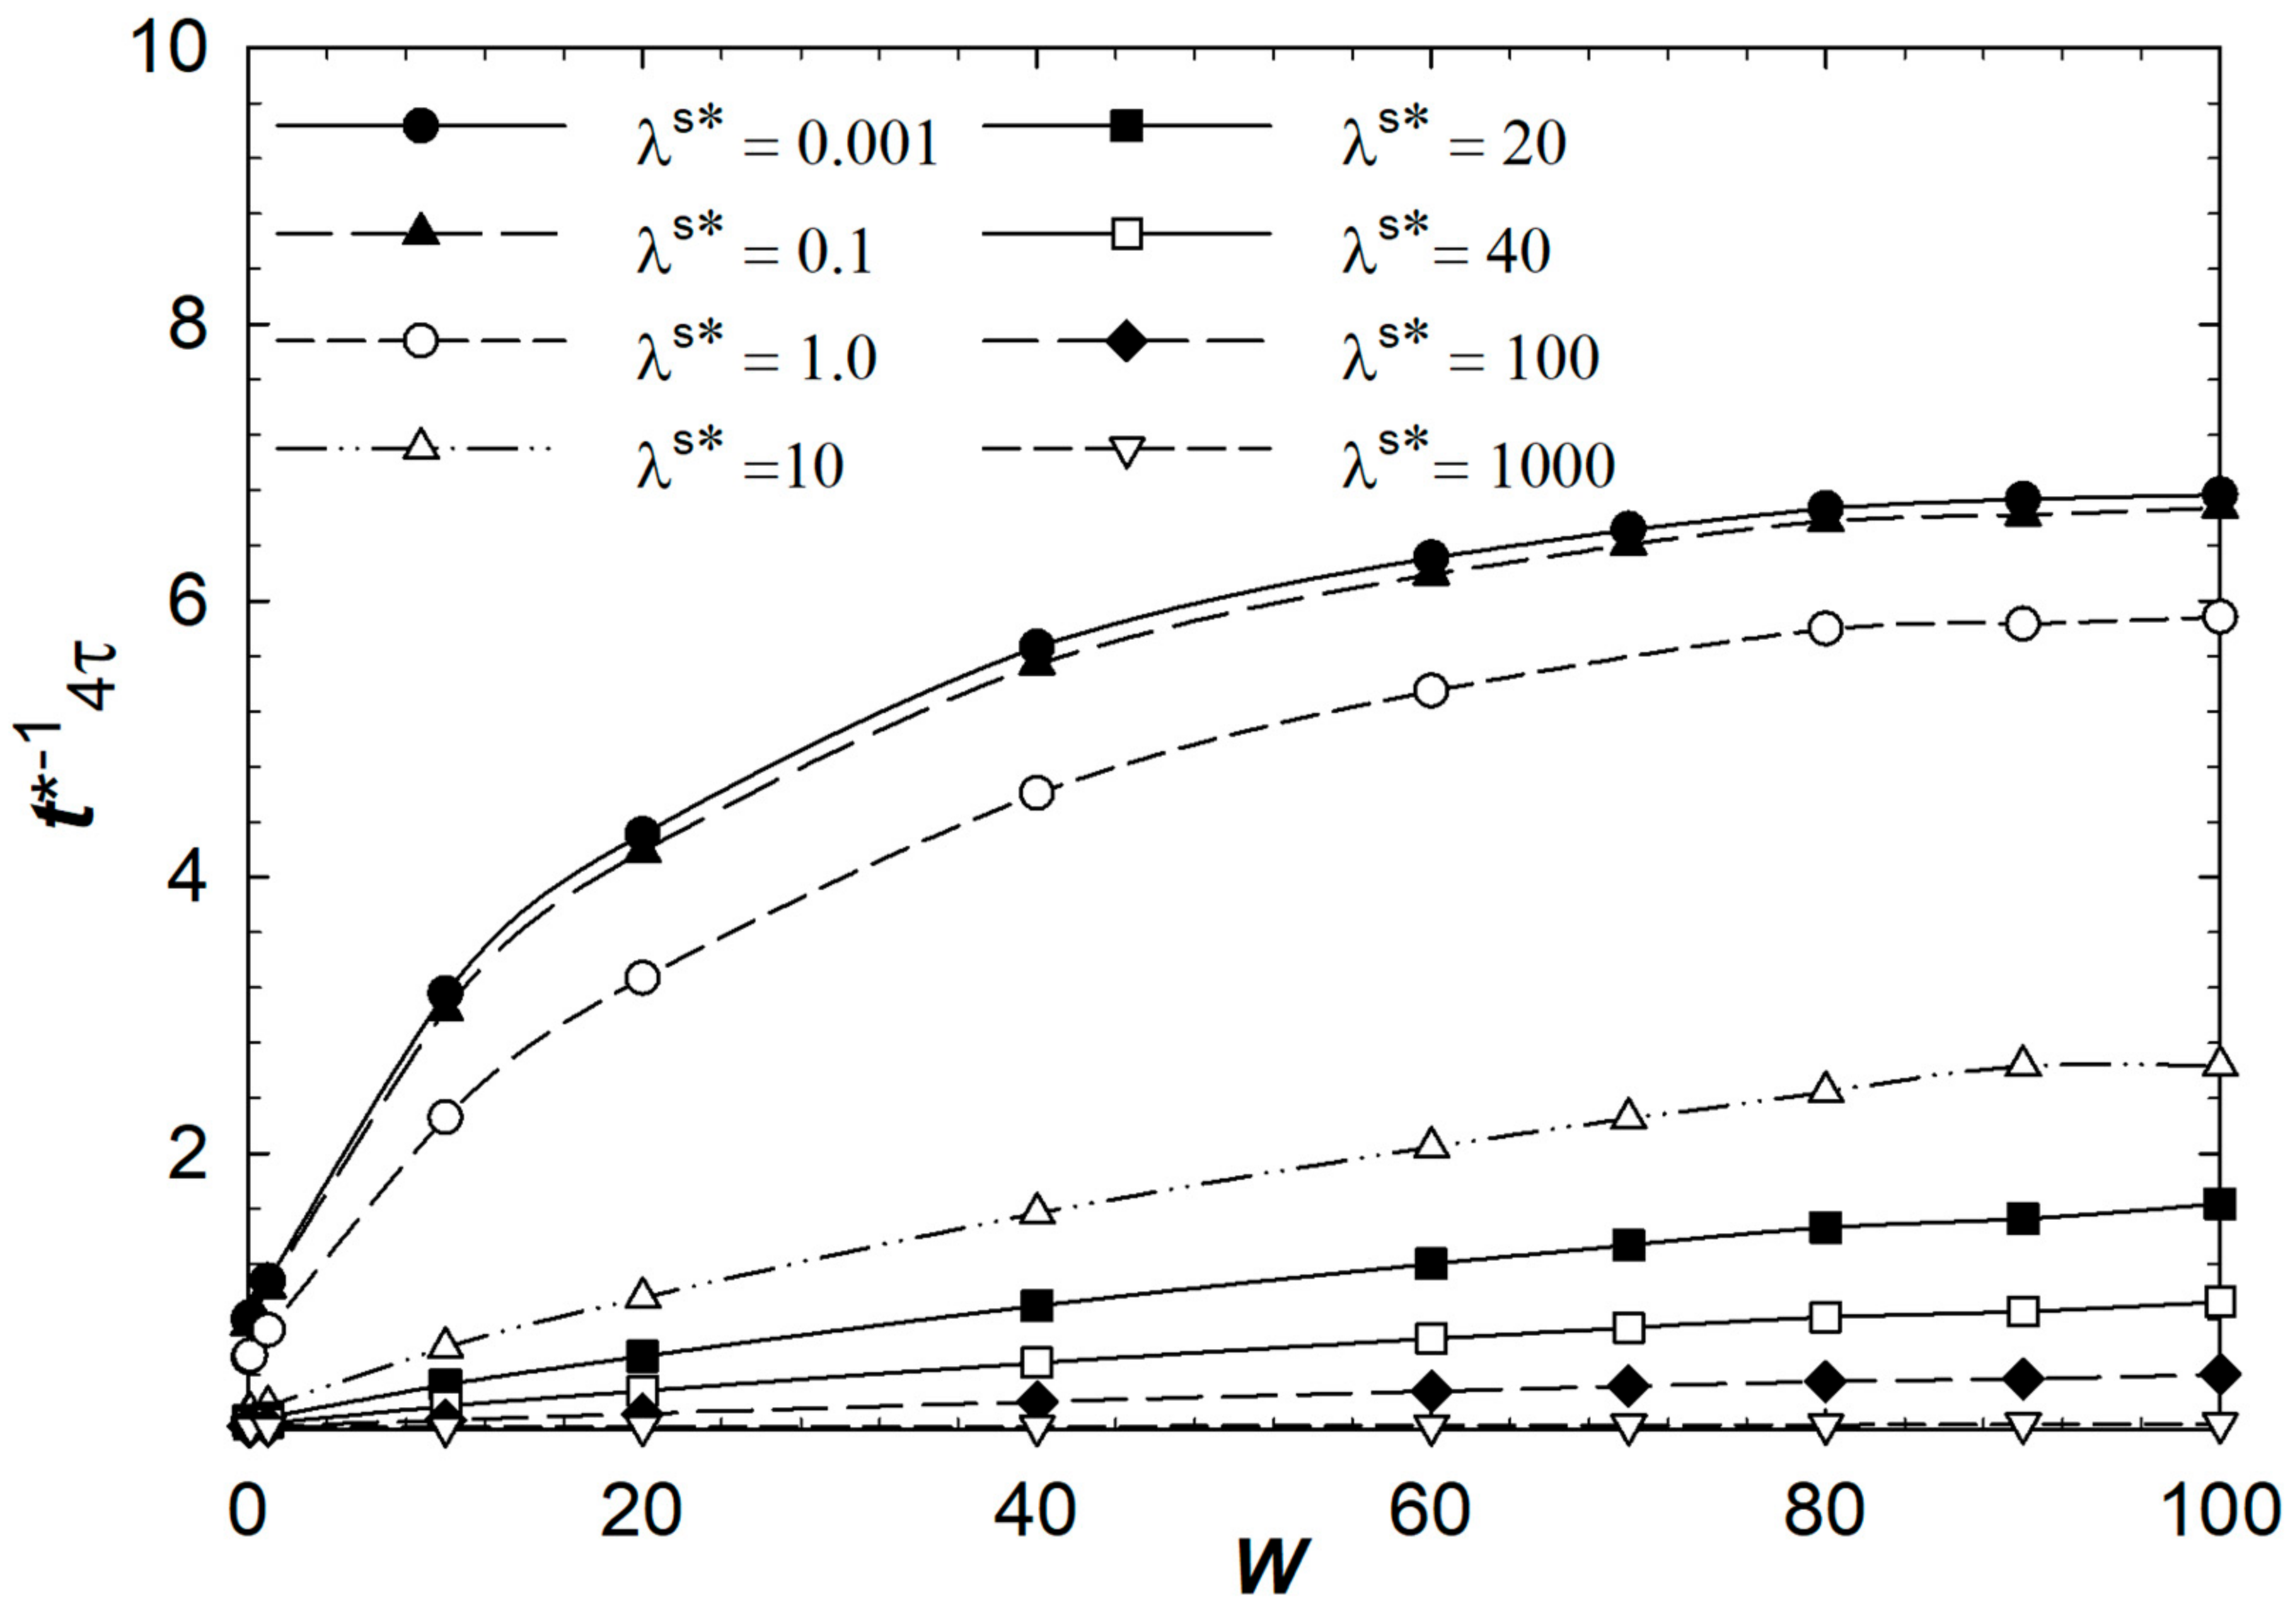
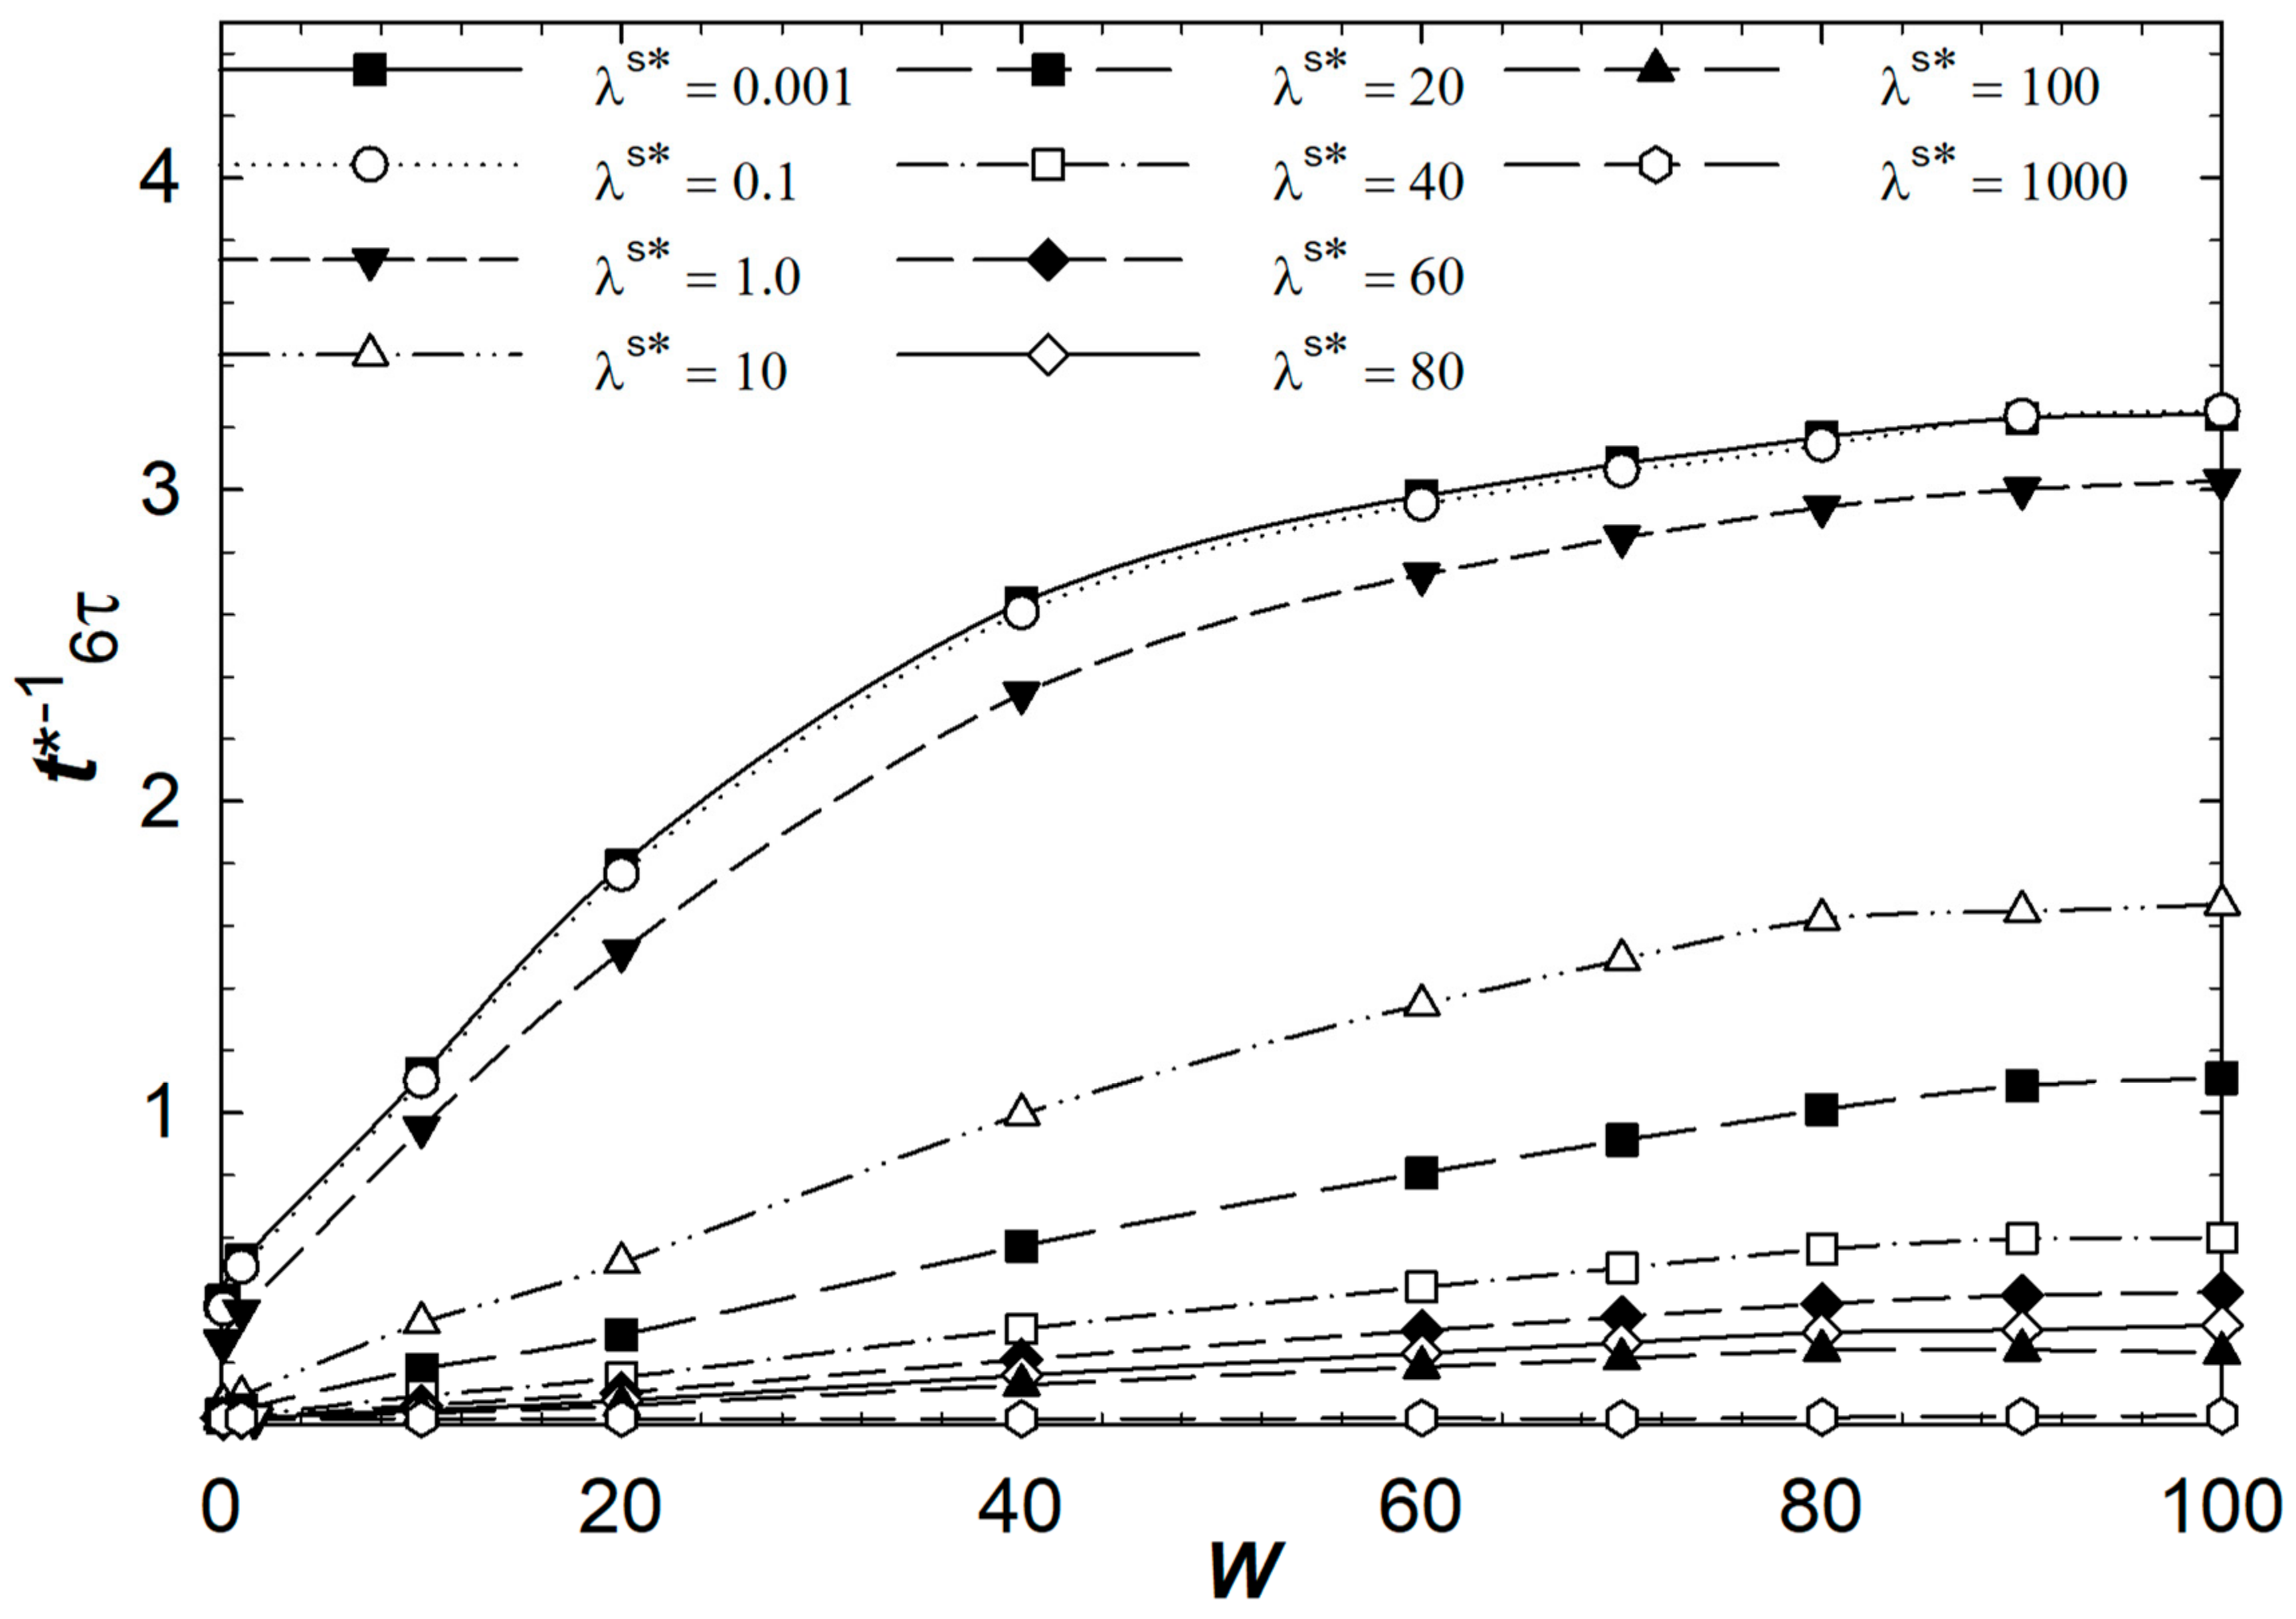
Figure 7, Figure 8, Figure 9, Figure 10 and Figure 11 illustrate the reciprocal time at 2τ to 6τ of the process in relation to the homeotropic anchoring. The plots indicate that the system responds differently at each characteristic time depending on the surface viscosity. The system reaches the steady state condition after seven characteristic times as per the simulation. Therefore, the reciprocal time curves indicate how fast the system responds to the changes in the droplet’s surface realignment. In addition, analyzing the relation between the radial configuration and anchoring energy helps us to understand how the system responds to the surface interaction. It shows the relationship between these two variables and how they affect the overall performance of the system.
According to Figure 7, Figure 8, Figure 9, Figure 10 and Figure 11, the low surface viscosity parameter in the range of 10−3λs* ≤ 10−1 has a reasonably similar and consistent gradual increase pattern through time. This suggests that the viscosity is already at its optimum level and no further decrease is required. However, λs* ≥ 10 has a reasonable linear relationship with W, where the trend switches to gradual changes over time as shown through these figures. For λs* ≥ 102, the relation with W stays linear until the steady state condition is reached. Additionally, it depicts that there is a wide range of changes between 1 < λs* < 10. Furthermore, it was predicted that the process with a range of 10−2 < λs* ≤ 100 exhibits a trend similar to the low surface viscosity through time.
By changing the surface viscosity at the surface, we investigated how changing the aqueous solution viscosity could affect the liquid crystal biosensor performance. In this study, we assume the easy axis is planar and manipulate the surface viscosity to study the system response.
Figure 12 shows a plot of the orientation angle at steady state conditions at weak planar anchoring to study the effect of changing the viscosity of the aqueous solution which could affect the liquid crystal surface and then the bulk orientation. It shows that the average angle orientation of the liquid crystal within the droplet has two exponential trends in the range of 10−4 < λs* ≤ 104. As depicted in the range of 10−4 < λs* ≤ 103, it shows gradual increases in the average angle versus the surface viscosity, and for λs* ≤ 6 × 10², the average angle stays linear in relation to the surface viscosity and is reasonably constant, and interference at the steady state does not vary with the surface viscosity within this range. The biosensor performance is affected by the droplet’s surface viscosity during the transient process. Consequently, a higher surface viscosity leads to brighter optical interference at steady state conditions. Figure 13 illustrates three case studies involving droplet bulk orientation that result in different dimensionless surface viscosities.
The graph in Figure 14 shows dimensionless total distortion energy versus λs*, which corresponds to the result in Figure 12. The equilibrium of a liquid crystal biosensor droplet is obtained by minimizing the total free energy density. The energy is minimized in the droplet system when the director aligns with the preferred direction and obtains the radial configuration. The results demonstrate the impact of surface viscosity compared to bulk rotational viscosity due to the surface interaction. The graph indicates that the system reaches the minimum energy when the surface viscosity parameter is low; however, when the surface viscosity increases, Frank’s energy level also increases at steady state conditions. Accordingly, the radial configuration can be predicted via minimizing the elastic energy associated with liquid crystal distortion within the droplet caused by chemical analyte interactions. Thus, the sensitivity of a biosensor or the order transition of a biosensor can be controlled by lowering the elastic energy of the system.
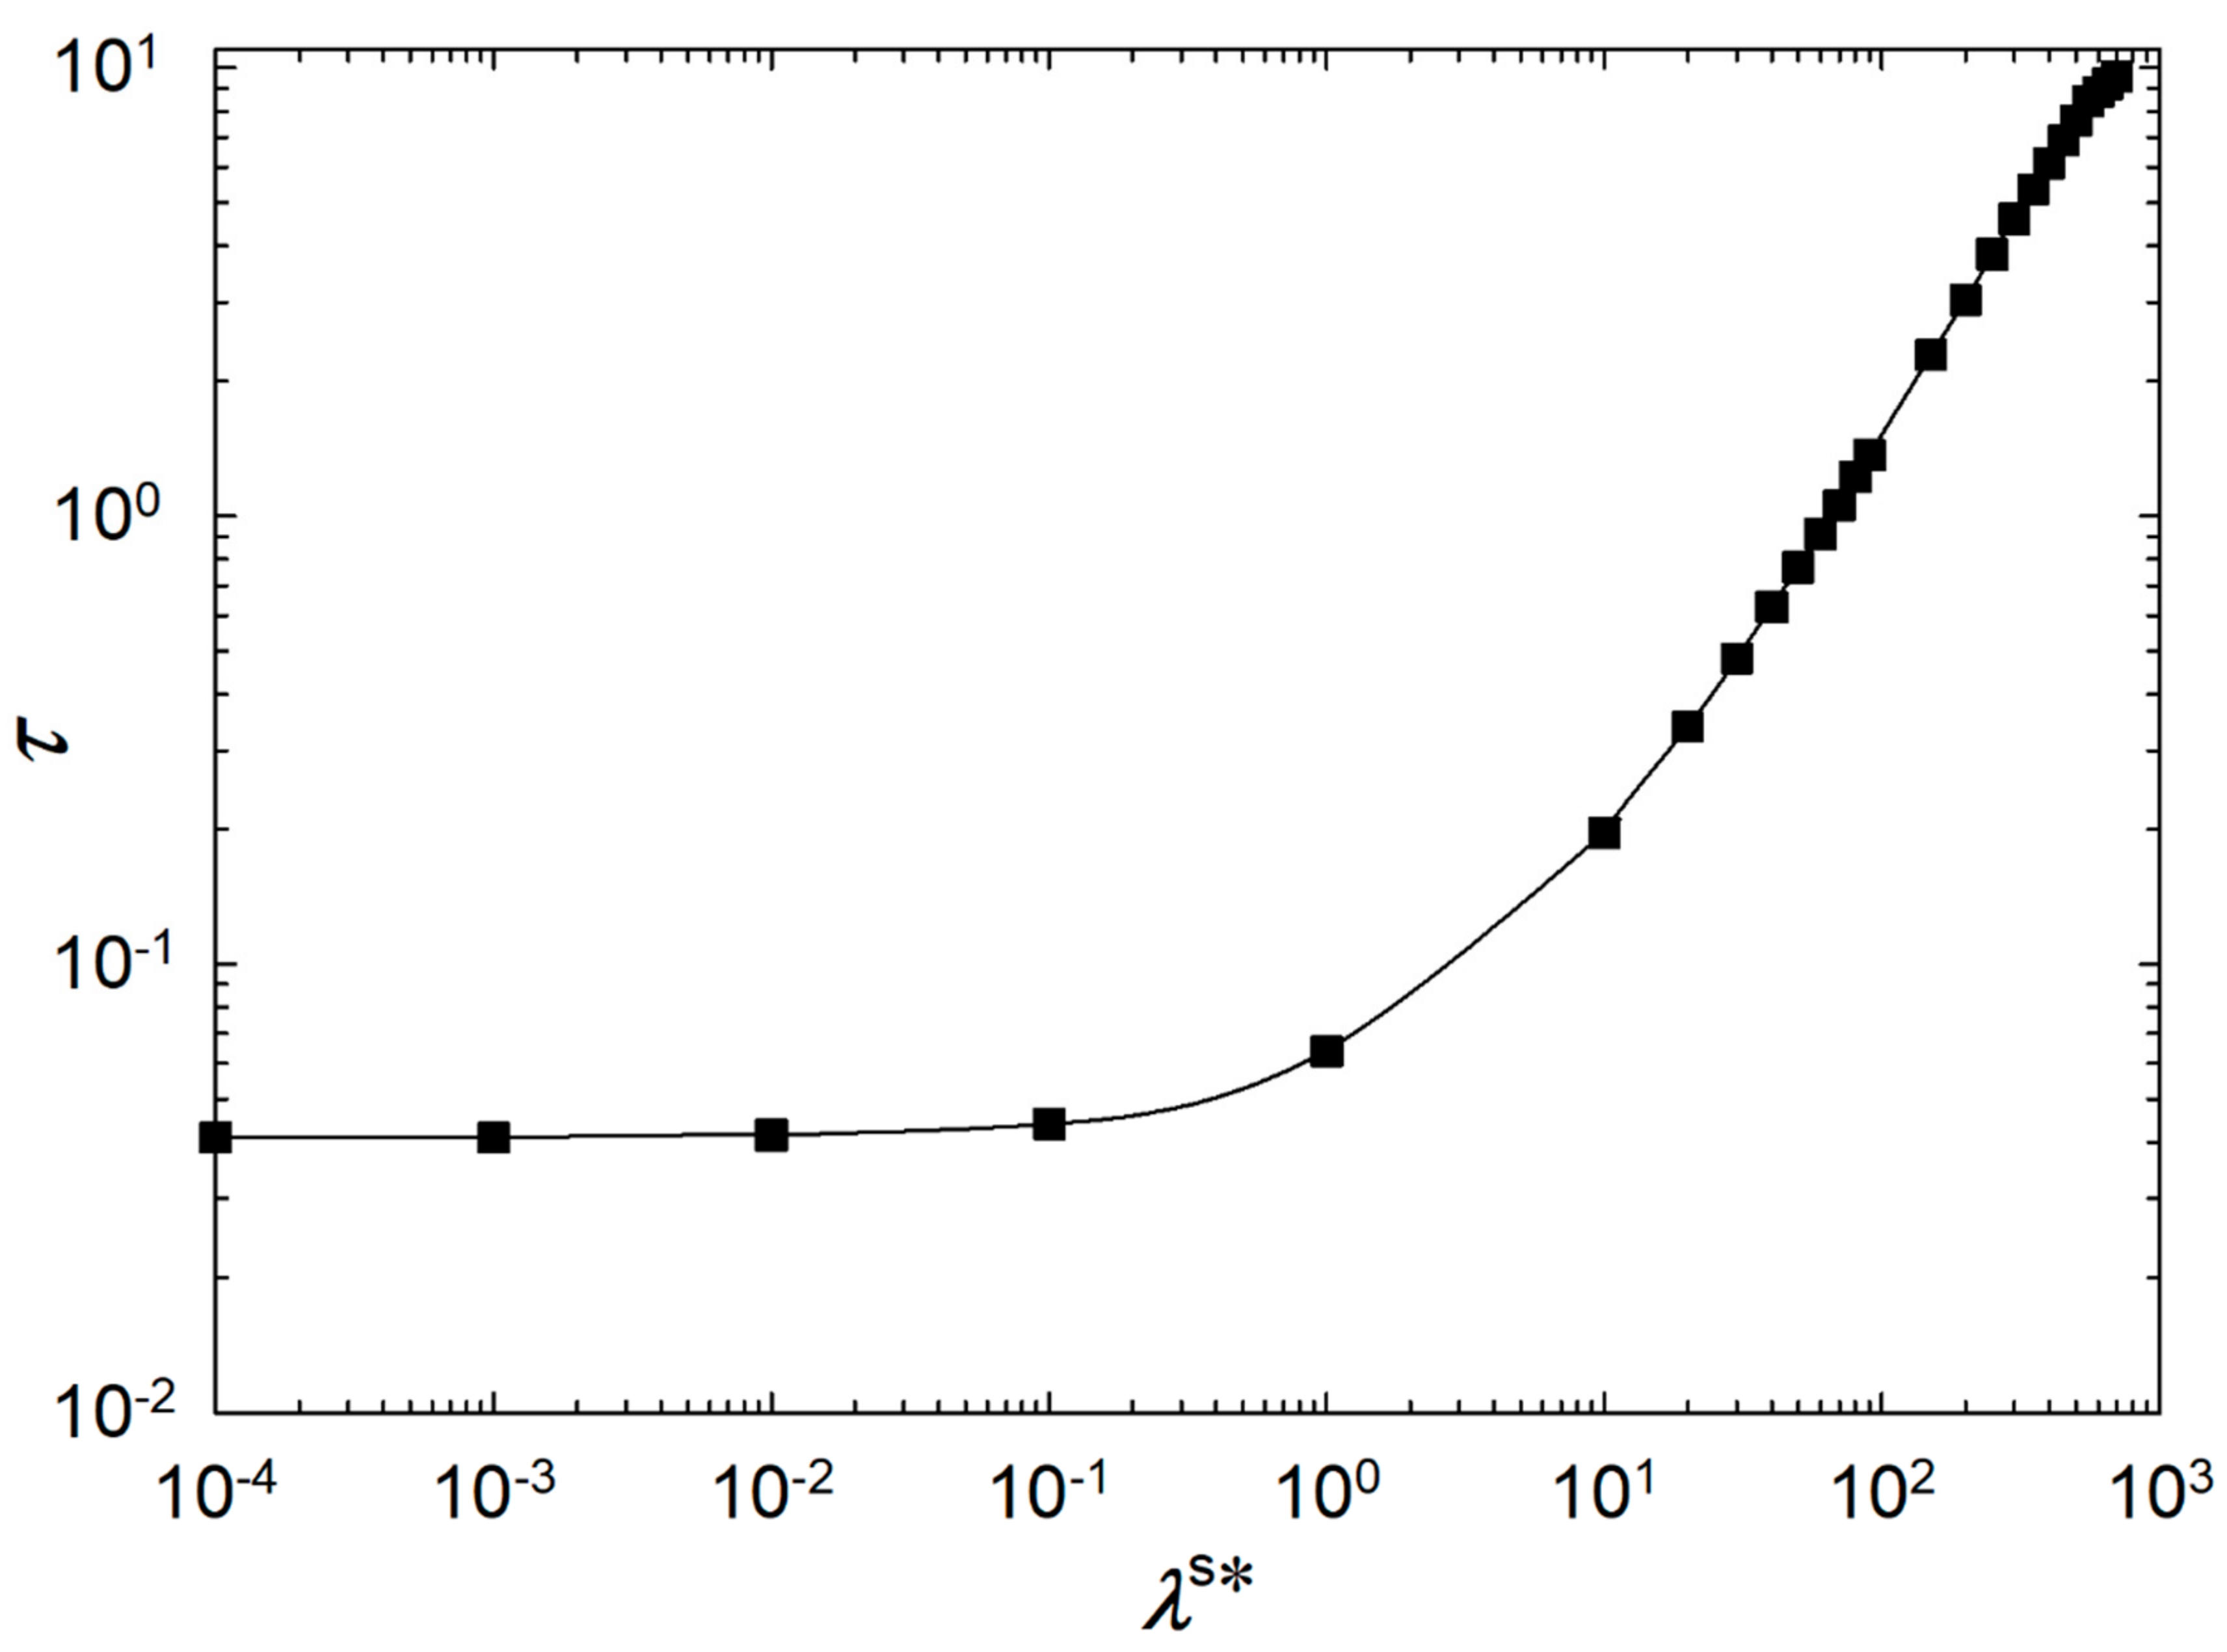
Figure 15 shows the relationship between τ and λs* on a logarithmic scale in the range of 10−4λs* ≤ 103. τ has a reasonably linear relationship with 10−3λs* ≤ 100. It shows in λs* ≤ 100 that τ is independent of the surface viscosity at a low surface viscosity in the case of weak planar anchoring. It shows in λs* ≥ 100 that τ increases gradually with an increasing λs*. Therefore, the higher the viscosity, the slower the response time of the biosensor droplet to the adsorption of biomolecules.

4. Summary and Conclusions

Tuning the parameters appropriately is essential to achieving an optimal biosensor performance. By conducting this research, the goal is to better understand how surface properties affect liquid crystal droplet-based biosensors. During the design and analysis of biosensors, surface viscosity should be taken into account. Based on the results of this study, surface viscosity has a significant impact on Frank energy, which emphasizes why surface viscosity should be studied. Our study provides insight into the behavior of the liquid crystal droplets and their interactions with surface properties, which can be used to guide the experiments and performance of liquid crystal biosensors by considering the recommended ranges for surface viscosity in relation to the biosensor response time. Furthermore, the orientation of the liquid crystal droplets is significantly affected by their surface viscosity, according to the simulation results. Thus, sensitivity of the liquid crystal biosensor performance to surface viscosity is related. This suggests that surface viscosity is an important factor in controlling the performance of the biosensor due to homeotropic anchoring caused by the adsorption of biomolecules. The results of our study can also be used to optimize the design of the biosensors by identifying the parameters that significantly affect response time and sensitivity. Understanding the biosensor limitations can also help researchers improve the performance of the biosensors. As a performance criterion during the design of the biosensors and droplet fabrication, low-surface viscosity is recommended to ensure fast bulk responses to molecular interactions at the droplet surfaces in the dimensionless range of 10−3λs* ≤ 100.
In summary, two approaches were used in this study: first, assuming an adsorption-driven liquid crystal biosensor and the relationship between surfactant concentration and perpendicular alignment at the interface, strong homeotropic anchoring is considered to study the effects of both W and λs*. Second, we investigated the effect of surface viscosity on the performance of the biosensors due to the immobilization of the droplets and the changes in the aqueous solution viscosity by considering weak planar anchoring.

Author Contributions

The authors who contributed in the preparation of the paper are as follows: Conceptualization, R.S. and P.K.C.; Methodology, R.S. and P.K.C.; Coding and software, R.S.; Validation, R.S.; Data analysis and visualization, R.S.; Investigation, R.S. and P.K.C.; Writing—draft preparation, R.S.; Writing—review, P.K.C.; Supervision, P.K.C.; Project administration, P.K.C.; Funding acquisition, P.K.C. All authors have read and agreed to the published version of the manuscript.

Funding

This project is funded by Natural Sciences and Engineering Research of Council of Canada (NSERC) with the funding number 5007574.

Data Availability Statement

Not applicable.

Acknowledgments

The authors acknowledge the financial support of the Natural Sciences and Engineering Research Council of Canada (NSERC), Toronto Metropolitan University, and access to high-performance computing resources from Compute Canada. R.S. acknowledges his postgraduate scholarships from Queen Elizabeth II—Graduate Scholarship in Science and Technology (QEII-GSST) and the Ontario Graduate scholarship (OGS).

Conflicts of Interest

The authors declare that there are no conflicts of interest.

Nomenclature

SymbolsDescription
Arate of strain tensor
Ftotal energy
Fssurface energy
FdFrank elastic free energy density per volume
hfilm thickness
hthe molecular filed
hssplay molecular field
hTtwist molecular field
hBbend molecular field
Ithe light intensity
Kelastic constant
K1splay elastic constant
K2twist elastic constant
K3bend elastic constant
ndirector
Nco-rotational time flux
RRayleigh dissipation function
ttime
Vvelocity
Vvolume
Wanchoring energy
Greek Symbols
Γtorque per unit volume
Γeelastic torque
Γvviscous torque
ϒ1rotational viscosity coefficient
ϒ2irrotational torque coefficient
ηiangle-dependent viscosity functions
ɸpolar angle—zenithal angle
κiangle-dependent elastic functions
λssurface viscosities
νunit normal vector
τtime constant
Ωangular velocity tensor

Appendix A

The elastic functions are defined as follows:
κ 1 = 1 2 ( ( K 11 K 33 ) cos ( 2 ϕ ) + K 11 + K 33 )
κ 2 = 1 2 ( ( K 33 K 11 ) cos ( 2 ϕ ) + K 11 + K 33 )
κ 3 = ( K 33 K 11 ) sin ( 2 ϕ )
κ 4 = 1 2 K 33 K 11 sin ( 2 ϕ )
κ 5 = 1 2 K 11 K 33 sin ( 2 ϕ )  
κ 6 = K 33 K 11 cos 2 ϕ
κ 7 = 1 2 1 r ( K 11 K 33 ) cos ( 2 ϕ ) + K 11 + K 33
κ 8 = 1 2 1 r K 33 K 11 sin ( 2 ϕ )
κ 9 = 1 2 1 r 2 K 11 sin ( 2 ϕ )
κ 10 = z r K 11 sin 2 ϕ 1 2 K 11 sin ( 2 ϕ )
κ 11 = 1 2 K 11 K 33 z sin ( 2 ϕ ) r K 11 cos 2 ϕ + K 33 sin 2 ϕ
κ 12 = 1 2 K 33 K 11 r sin ( 2 ϕ ) z K 11 sin 2 ϕ + K 33 cos 2 ϕ

References

  1. Niu, X.; Luo, D.; Chen, R.; Wang, F.; Sun, X.; Dai, H. Optical biosensor based on liquid crystal droplets for detection of cholic acid. Opt. Commun. 2016, 381, 286–291. [Google Scholar] [CrossRef]
  2. Popov, P.; Mann, E.K.; Jákli, A. Thermotropic liquid crystal films for biosensors and beyond. J. Mater. Chem. B 2017, 5, 5061–5078. [Google Scholar] [CrossRef] [PubMed]
  3. Miller, D.S.; Wang, X.; Abbott, N.L. Design of Functional Materials Based on Liquid Crystalline Droplets. Chem. Mater. 2013, 26, 496–506. [Google Scholar] [CrossRef] [Green Version]
  4. Miller, D.S.; Carlton, R.J.; Mushenheim, P.C.; Abbott, N.L. Introduction to Optical Methods for Characterizing Liquid Crystals at Interfaces. Langmuir 2013, 29, 3154–3169. [Google Scholar] [CrossRef] [Green Version]
  5. Chen, J.; Liu, Z.; Yang, R.; Liu, M.; Feng, H.; Li, N.; Jin, M.; Zhang, M.; Shui, L. A liquid crystal-based biosensor for detection of insulin driven by conformational change of an aptamer at aqueous-liquid crystal interface. J. Colloid Interface Sci. 2022, 628, 215–222. [Google Scholar] [CrossRef]
  6. Xiong, Z.; Zhang, H.; Lu, Y.; Zhang, L.; Sun, W.; Liu, Y. Fast Detection of Myricetin With the Use of Dedicated Microdroplets. IEEE Sens. J. 2020, 20, 617–622. [Google Scholar] [CrossRef]
  7. Lagerwall, J.P.F.; Scalia, G. A new era for liquid crystal research: Applications of liquid crystals in soft matter nano-, bio- and microtechnology. Curr. Appl. Phys. 2012, 12, 1387–1412. [Google Scholar] [CrossRef]
  8. Carlton, R.J.; Hunter, J.T.; Miller, D.S.; Abbasi, R.; Mushenheim, P.C.; Tan, L.N.; Abbott, N.L. Chemical and biological sensing using liquid crystals. Liq. Cryst. Rev. 2013, 1, 29–51. [Google Scholar] [CrossRef] [PubMed]
  9. Wang, Z.; Xu, T.; Noel, A.; Chen, Y.-C.; Liu, T. Applications of liquid crystals in biosensing. Soft Matter 2021, 17, 4675–4702. [Google Scholar] [CrossRef]
  10. Luan, C.; Luan, H.; Luo, D. Application and Technique of Liquid Crystal-Based Biosensors. Micromachines 2020, 11, 176. [Google Scholar] [CrossRef] [Green Version]
  11. Zhan, X.; Liu, Y.; Yang, K.-L.; Luo, D. State-of-the-Art Development in Liquid Crystal Biochemical Sensors. Biosensors 2022, 12, 577. [Google Scholar] [CrossRef] [PubMed]
  12. Nguyen, D.-K.; Jang, C.-H. Simple and Label-Free Detection of Carboxylesterase and Its Inhibitors Using a Liquid Crystal Droplet Sensing Platform. Micromachines 2022, 13, 490. [Google Scholar] [CrossRef]
  13. Aliño, V.J.; Pang, J.; Yang, K.-L. Liquid Crystal Droplets as a Hosting and Sensing Platform for Developing Immunoassays. Langmuir 2011, 27, 11784–11789. [Google Scholar] [CrossRef] [PubMed]
  14. Piñeres-Quiñones, O.H.; Lynn, D.M.; Acevedo-Vélez, C. Environmentally Responsive Emulsions of Thermotropic Liquid Crystals with Exceptional Long-Term Stability and Enhanced Sensitivity to Aqueous Amphiphiles. Langmuir 2022, 38, 957–967. [Google Scholar] [CrossRef] [PubMed]
  15. Concellón, A.; Fong, D.; Swager, T.M. Complex Liquid Crystal Emulsions for Biosensing. J. Am. Chem. Soc. 2021, 143, 9177–9182. [Google Scholar] [CrossRef]
  16. Dan, A.; Aery, S.; Zhang, S.; Baker, D.L.; Gleeson, H.F.; Sarkar, A. Protein Microgel-Stabilized Pickering Liquid Crystal Emulsions Undergo Analyte-Triggered Configurational Transition. Langmuir 2020, 36, 10091–10102. [Google Scholar] [CrossRef]
  17. Ortiz, B.J.; Boursier, M.E.; Barrett, K.L.; Manson, D.E.; Amador-Noguez, D.; Abbott, N.L.; Blackwell, H.E.; Lynn, D.M. Liquid Crystal Emulsions That Intercept and Report on Bacterial Quorum Sensing. ACS Appl. Mater. Interfaces 2020, 12, 29056–29065. [Google Scholar] [CrossRef]
  18. Lin, I.-H.; Miller, D.S.; Bertics, P.J.; Murphy, C.J.; de Pablo, J.J.; Abbott, N.L. Endotoxin-Induced Structural Transformations in Liquid Crystalline Droplets. Science 2011, 332, 1297–1300. [Google Scholar] [CrossRef] [Green Version]
  19. Tjipto, E.; Cadwell, K.D.; Quinn, J.F.; Johnston, A.P.R.; Abbott, N.L.; Caruso, F. Tailoring the Interfaces between Nematic Liquid Crystal Emulsions and Aqueous Phases via Layer-by-Layer Assembly. Nano Lett. 2006, 6, 2243–2248. [Google Scholar] [CrossRef] [PubMed]
  20. Miller, D.S.; Abbott, N.L. Influence of droplet size, pH and ionic strength on endotoxin-triggered ordering transitions in liquid crystalline droplets. Soft Matter 2013, 9, 374–382. [Google Scholar] [CrossRef] [Green Version]
  21. Zou, J.; Fang, J. Director Configuration of Liquid-Crystal Droplets Encapsulated by Polyelectrolytes. Langmuir 2010, 26, 7025–7028. [Google Scholar] [CrossRef]
  22. Sivakumar, S.; Wark, K.L.; Gupta, J.K.; Abbott, N.L.; Caruso, F. Liquid Crystal Emulsions as the Basis of Biological Sensors for the Optical Detection of Bacteria and Viruses. Adv. Funct. Mater. 2009, 19, 2260–2265. [Google Scholar] [CrossRef]
  23. Wang, X.; Zhou, Y.; Kim, Y.-K.; Miller, D.S.; Zhang, R.; Martinez-Gonzalez, J.A.; Bukusoglu, E.; Zhang, B.; Brown, T.M.; de Pablo, J.J.; et al. Patterned surface anchoring of nematic droplets at miscible liquid–liquid interfaces. Soft Matter 2017, 13, 5714–5723. [Google Scholar] [CrossRef]
  24. Gupta, J.K.; Zimmerman, J.S.; de Pablo, J.J.; Caruso, F.; Abbott, N.L. Characterization of Adsorbate-Induced Ordering Transitions of Liquid Crystals within Monodisperse Droplets. Langmuir 2009, 25, 9016–9024. [Google Scholar] [CrossRef]
  25. JGupta, J.K.; Sivakumar, S.; Caruso, F.; Abbott, N.L. Size-Dependent Ordering of Liquid Crystals Observed in Polymeric Capsules with Micrometer and Smaller Diameters. Angew. Chem. Int. Ed. 2009, 48, 1652–1655. [Google Scholar] [CrossRef]
  26. Kinsinger, M.I.; Buck, M.E.; Abbott, N.L.; Lynn, D.M. Immobilization of Polymer-Decorated Liquid Crystal Droplets on Chemically Tailored Surfaces. Langmuir 2010, 26, 10234–10242. [Google Scholar] [CrossRef] [PubMed] [Green Version]
  27. Gupta, J.K.; Abbott, N.L. Principles for Manipulation of the Lateral Organization of Aqueous-Soluble Surface-Active Molecules at the Liquid Crystal−Aqueous Interface. Langmuir 2009, 25, 2026–2033. [Google Scholar] [CrossRef] [Green Version]
  28. Prischepa, O.O.; Shabanov, A.V.; Zyryanov, V.Y. Transformation of director configuration upon changing boundary conditions in droplets of nematic liquid crystal. JETP Lett. 2004, 79, 257–261. [Google Scholar] [CrossRef]
  29. De Gennes, P.G.; Prost, J. The Physics of Liquid Crystals, 2nd ed.; Clarendon Press—Oxford University Press: New York, NY, USA, 1995; Volume 83. [Google Scholar]
  30. Chandrasekhar, S. Liquid Crystals, 2nd ed.; Cambridge University Press: New York, NY, USA, 1992. [Google Scholar]
  31. Pasechnik, S.V.; Chigrinov, V.G.; Shmeliova, D.V. Liquid Crystals: Viscous and Elastic Properties in Theory and Applications; John Wiley & Sons: Hoboken, NJ, USA, 2009. [Google Scholar]
  32. Vertogen, G. The Equations of Motion for Nematics. Z. Naturforschung A 1983, 38, 1273–1275. [Google Scholar] [CrossRef]
  33. Fletcher, C.A.J. Galerkin Finite-Element Methods. In Computational Galerkin Methods; Springer: Berlin/Heidelberg, Germany, 1984. [Google Scholar] [CrossRef]
  34. Lapidus, L.; Pinder, G.F. Numerical Solution of Partial Differential Equations in Science and Engineering; Wiley: New York, NY, USA, 1982. [Google Scholar]
  35. Reddy, J.N. An Introduction to Nonlinear Finite Element Analysis Second Edition: With Applications to Heat Transfer, Fluid Mechanics, and Solid Mechanics; OUP Oxford: New York, NY, USA, 2014. [Google Scholar]
  36. Finlayson, B.A. Nonlinear Analysis in Chemical Engineering; McGrawHill: New York, NY, USA, 1980. [Google Scholar]
  37. MMetcalf; Reid, J.K.; Cohen, M. Fortran 95/2003 Explained; Oxford University Press: New York, NY, USA, 2004. [Google Scholar]
  38. Anderson, E.; Bai, Z.; Bischof, C.; Blackford, S.; Demmel, J.; Dongarra, J.; Croz, J.D.; Greenbaum, A.; Hammerling, S.; McKenney, A.; et al. LAPACK Users’ Guide: Third Edition; SIAM: Philadelphia, PA, USA, 1999. [Google Scholar]
  39. Shadkami, R.; Chan, P.K. Computational Analysis to Optimize the Performance of Thin Film Liquid Crystal Biosensors. Crystals 2022, 12, 1463. [Google Scholar] [CrossRef]
  40. Yesil, F.; Suwa, M.; Tsukahara, S. Anchoring Energy Measurements at the Aqueous Phase/Liquid Crystal Interface with Cationic Surfactants Using Magnetic Fréedericksz Transition. Langmuir 2018, 34, 81–87. [Google Scholar] [CrossRef] [PubMed]
  41. Lavrentovich, O.D. Topological defects in dispersed liquid crystals, or words and worlds around liquid crystal drops. Liquid Crystals 1998, 24, 117–126. [Google Scholar] [CrossRef]
  42. Chan, P.K.; Rey, A.D. Simulation of reorientation dynamics in bipolar nematic droplets. Liq. Cryst. 1997, 23, 677–688. [Google Scholar] [CrossRef]
Figure 1. (a) Bipolar configuration of liquid crystal droplets that liquid crystal molecules are tangential and planar to the surface, and two opposed point defects appear diametrically. (b) The radial configuration of a liquid crystal droplet with a single defect point at the center of the droplet.
Crystals 13 01237 g001
Figure 2. This is a schematic representation of a two-dimensional bipolar droplet in the cylindrical coordinate system. The z-axis is along the symmetry axis. n is the director and ϕ is the polar angle measured from the z-axis.
Crystals 13 01237 g002
Figure 3. Bipolar steady state tangential configuration caused by the aqueous solution induced by water before introducing the surfactant at the droplet interface as the initial conditions.
Crystals 13 01237 g003
Figure 4. The mean magnitude of the polar angle <|| ϕ ss||> at steady state versus dimensionless anchoring energy for different ranges of dimensionless surface viscosity parameters λs*.
Crystals 13 01237 g004
Figure 5. Steady state configuration for the following dimensionless anchoring energy parameter at λs* = 103: (a) W = 100, (b) W = 101, and (c) W = 102.
Crystals 13 01237 g005
Figure 6. Characteristic time τ of the liquid crystal biosensor droplet in relation to dimensionless anchoring energy W at different dimensionless surface viscosities λs*.
Crystals 13 01237 g006
Figure 7. Reciprocal dimensionless time at two characteristic times τ of the liquid crystal biosensor process versus dimensionless anchoring energy W for the different ranges of dimensionless surface viscosity λs*.
Crystals 13 01237 g007
Figure 8. Reciprocal dimensionless time at three characteristic times τ of the liquid crystal biosensor process versus dimensionless anchoring energy W for the different ranges of dimensionless surface viscosity λs*.
Crystals 13 01237 g008
Figure 9. Reciprocal dimensionless time at four characteristic times τ of the liquid crystal biosensor process versus dimensionless anchoring energy W for the different ranges of dimensionless surface viscosity λs*.
Crystals 13 01237 g009
Figure 10. Reciprocal dimensionless time at five characteristic times τ of the liquid crystal biosensor process versus dimensionless anchoring energy W for the different ranges of dimensionless surface viscosity λs*.
Crystals 13 01237 g010
Figure 11. Reciprocal dimensionless time at six characteristic times τ of the liquid crystal biosensor process versus dimensionless anchoring energy W for the different ranges of dimensionless surface viscosity λs*.
Crystals 13 01237 g011
Figure 12. The mean magnitude of the orientation angle <|| ϕ ss||> at steady state versus the dimensionless surface viscosity parameter in the case of weak planar anchoring.
Crystals 13 01237 g012
Figure 13. Steady state configuration for the following dimensionless surface viscosity parameters at weak planar anchoring: (a) λs* = 10−3, (b) λs* = 5 × 10², and (c) λs* = 103.
Crystals 13 01237 g013
Figure 14. The dimensionless total distortion free energy versus the dimensionless surface viscosity parameter in the case of weak planar anchoring. In the absence of external torque, the droplet system achieves equilibrium by minimizing energy when the director aligns with the preferred alignment.
Crystals 13 01237 g014
Figure 15. Characteristic time τ of the liquid crystal biosensor droplet in relation to dimensionless surface viscosity energy in case of weak planar anchoring. It depicted the rate of changes as the characteristic time increases monotonically versus the dimensionless viscosity parameter.
Crystals 13 01237 g015
Disclaimer/Publisher’s Note: The statements, opinions and data contained in all publications are solely those of the individual author(s) and contributor(s) and not of MDPI and/or the editor(s). MDPI and/or the editor(s) disclaim responsibility for any injury to people or property resulting from any ideas, methods, instructions or products referred to in the content.

