
Chemical Characterization and Thermal Analysis of Recovered Liquid Crystals
 , , , , and
Abstract
:1. Introduction
2. Materials and Methods
2.1. Materials
2.2. Methods
2.2.1. Chemical Characterizations
2.2.2. Thermo-Optical and Thermal Characterizations
2.2.3. Structural Properties
3. Results and Discussions
3.1. Chemical Properties
3.1.1. FTIR Analysis
- -
- elongation vibrations of the aromatic C=C double bond (1600–1500 cm−1);
- -
- elongation vibrations of the C-F bond; fluorinated compounds (1400–1000 cm−1);
- -
- elongation vibrations of the C-N and C-O bonds; aromatic amines and esters (1340–1250 cm−1);
- -
- deformation vibrations of C=C double bonds; alkenes (cis, trans…) (1000–650 cm−1);
- -
- out-of-plane deformation vibrations of the =C-H bond of an adjacent hydrogen on an aromatic ring (910 cm−1);
- -
- out-of-plane deformation vibrations of the =C-H bond of two adjacent hydrogens on an aromatic ring (815 cm−1).
3.1.2. NMR Analysis
3.1.3. GC-MS and HRMS Analysis
3.1.4. ICP-AES Analysis
- their production process (even highly purified LCs possess ionic traces);
- the LCD manufacturing process (glue, alignment layers; filling could be a source of contamination);
- the aging process (chemical decomposition and degradation of LCs, charge transfer and electrochemical reactions in the electrodes);
- the dismantling of the LCD panels;
- the LC extraction process of the LCD panels on the industrial line (solubilization of the glue, polarizers, color filters, etc.).
3.2. Thermo-Optical and Thermal Properties
3.2.1. TGA Analysis
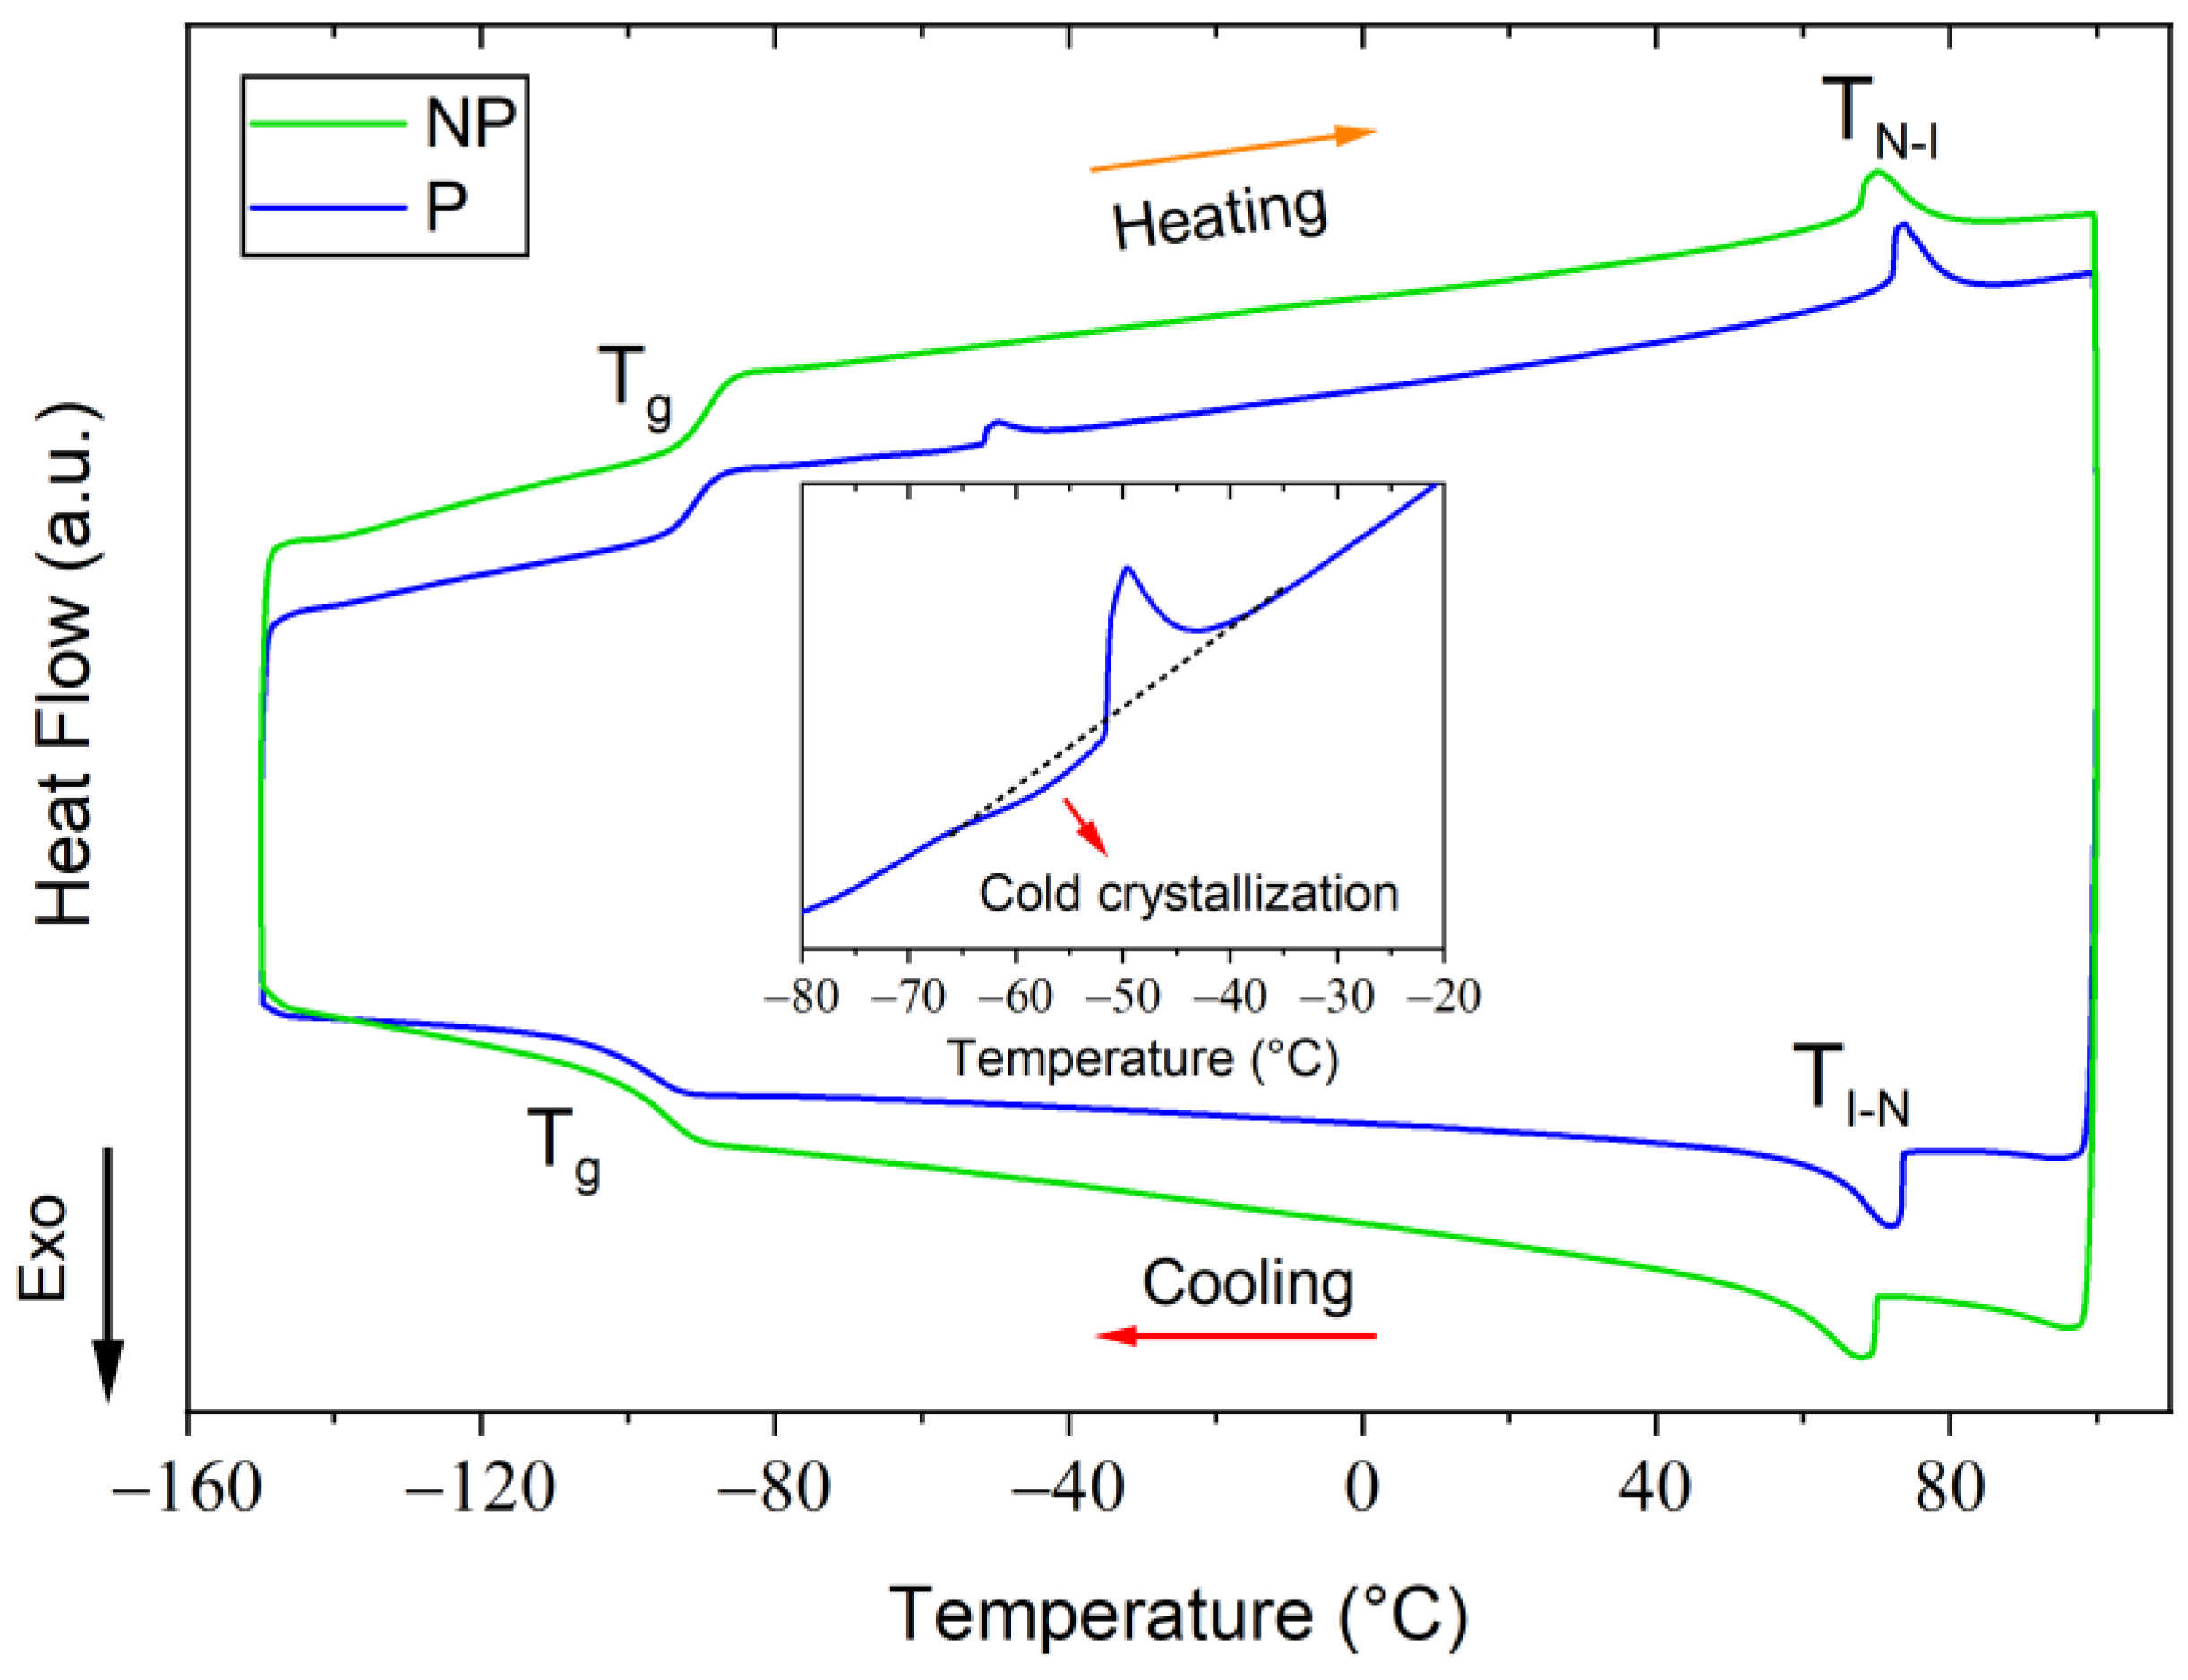
3.2.2. DSC Analysis
- -
- around −90 °C, a jump in the heat capacity of the samples was observed; this phenomenon can be assigned to a single glass transition (Tg) of the LC molecules;
- -
- the existence of a large homogeneous phase, between −90 °C and 70 °C, which can be identified as nematic region from POM observations (see the following Section 3.2.3). The presence of this large nematic phase region extends the perspectives for future reuse and valorization opportunities;
- -
- around 70 °C, an endothermic peak was detected, corresponding to a single nematic-isotropic transition (TN-I).
3.2.3. POM Analysis
3.3. Wide-Angle X-ray Scattering
4. Conclusions
Author Contributions
Funding
Data Availability Statement
Acknowledgments
Conflicts of Interest
References
- Bressanelli, G.; Saccani, N.; Pigosso, D.C.; Perona, M. Circular Economy in the WEEE industry: A systematic literature review and a research agenda. Sustain. Prod. Consum. 2020, 23, 174–188. [Google Scholar] [CrossRef]
- Rene, E.R.; Sethurajan, M.; Ponnusamy, V.K.; Kumar, G.; Dung, T.N.B.; Brindhadevi, K.; Pugazhendhi, A. Electronic waste generation, recycling and resource recovery: Technological perspectives and trends. J. Hazard. Mater. 2021, 416, 125664. [Google Scholar] [CrossRef] [PubMed]
- Azizi, D.D.S.; Hanafiah, M.M.; Woon, K.S. Material Flow Analysis in WEEE Management for Circular Economy: A Content Review on Applications, Limitations, and Future Outlook. Sustainability 2023, 15, 3505. [Google Scholar] [CrossRef]
- Shittu, O.S.; Williams, I.D.; Shaw, P.J. Global E-waste management: Can WEEE make a difference? A review of e-waste trends, legislation, contemporary issues and future challenges. Waste Manag. 2021, 120, 549–563. [Google Scholar] [CrossRef] [PubMed]
- Baldé, C.P.; D’Angelo, E.; Luda, V.; Deubzer, O.; Kuehr, R. Global Transboundary E-Waste Flows Monitor 2022; United Nations Institute for Training and Research: Bonn, Germany, 2022. [Google Scholar]
- Li, J.; Su, G.; Letcher, R.J.; Xu, W.; Yang, M.; Zhang, Y. Liquid Crystal Monomers (LCMs): A New Generation of Persistent Bioaccumulative and Toxic (PBT) Compounds? Environ. Sci. Technol. 2018, 52, 5005–5006. [Google Scholar] [CrossRef] [PubMed] [Green Version]
- Su, H.; Shi, S.; Zhu, M.; Crump, D.; Letcher, R.J.; Giesy, J.P.; Su, G. Persistent, bioaccumulative, and toxic properties of liquid crystal monomers and their detection in indoor residential dust. Proc. Natl. Acad. Sci. USA 2019, 116, 26450–26458. [Google Scholar] [CrossRef] [PubMed]
- Cheng, Z.; Shi, Q.; Wang, Y.; Zhao, L.; Li, X.; Sun, Z.; Lu, Y.; Liu, N.; Su, G.; Wang, L.; et al. Electronic-Waste-Driven Pollution of Liquid Crystal Monomers: Environmental Occurrence and Human Exposure in Recycling Industrial Parks. Environ. Sci. Technol. 2022, 56, 2248–2257. [Google Scholar] [CrossRef] [PubMed]
- Su, H.; Ren, K.; Li, R.; Li, J.; Gao, Z.; Hu, G.; Fu, P.; Su, G. Suspect Screening of Liquid Crystal Monomers (LCMs) in Sediment Using an Established Database Covering 1173 LCMs. Environ. Sci. Technol. 2022, 56, 8061–8070. [Google Scholar] [CrossRef] [PubMed]
- Moundoungou, I.; Bouberka, Z.; Tabieguia, G.-J.F.; Barrera, A.; Derouiche, Y.; Dubois, F.; Supiot, P.; Foissac, C.; Maschke, U. End-of-Life Liquid Crystal Displays Recycling: Physico-Chemical Properties of Recovered Liquid Crystals. Crystals 2022, 12, 1672. [Google Scholar] [CrossRef]
- Barrera, A.; Binet, C.; Dubois, F.; Hébert, P.-A.; Supiot, P.; Foissac, C.; Maschke, U. Dielectric Spectroscopy Analysis of Liquid Crystals Recovered from End-of-Life Liquid Crystal Displays. Molecules 2021, 26, 2873. [Google Scholar] [CrossRef] [PubMed]
- Barrera, A.; Binet, C.; Dubois, F.; Hébert, P.-A.; Supiot, P.; Foissac, C.; Maschke, U. Recycling of Liquid Crystals From e-Waste. Detritus 2022, 21, 55–61. [Google Scholar] [CrossRef]
- Barrera, A.; Binet, C.; Dubois, F.; Hébert, P.-A.; Supiot, P.; Foissac, C.; Maschke, U. Temperature and frequency dependence on dielectric permittivity and electrical conductivity of recycled Liquid Crystals. J. Mol. Liq. 2023, 378, 121572. [Google Scholar] [CrossRef]
- Collings, P.J.; Hird, M. Introduction to Liquid Crystals: Chemistry and Physics, 1st ed.; Taylor & Francis Ltd.: London, UK, 2017; ISBN 9781351989244. [Google Scholar]
- Neyts, K.; Beunis, F. Ion Transport in Liquid Crystals. In Handbook of Liquid Crystals; Goodby, J.W., Tschierske, C., Raynes, P., Gleeson, H., Kato, T., Collings, P.J., Eds.; Wiley-VCH Verlag GmbH & Co. KGaA.: Weinheim, Germany, 2014; pp. 1–26. [Google Scholar]
- Kawamoto, H. The History of Liquid-Crystal Display and Its Industry. In Proceedings of the 2012 Third IEEE HISTory of ELectro-technology CONference (HISTELCON), Pavia, Italy, 5–7 September 2012; IEEE: Piscataway, NJ, USA; pp. 1–6. [Google Scholar]
- Oswald, P.; Pieranski, P. Nematic and Cholesteric Liquid Crystals, 1st ed.; CRC Press: Boca Raton, FL, USA, 2005; ISBN 9780415321402. [Google Scholar]
- Pawel, P.; Godinho, H.M. Liquid Crystals: New Perspectives, 1st ed.; John Wiley & Sons, Inc.: Hoboken, NJ, USA, 2021; ISBN 2013206534. [Google Scholar]
- Lee, J.-H.; Liu, D.N.; Wu, S.T. Introduction to Flat Panel Displays, 1st ed.; John Wiley & Sons Ltd.: West Sussex, UK, 2008; ISBN 9780470516935. [Google Scholar]
- Maschke, U.; Moundoungou, I.; Fossi-Tabieguia, G.J. Method for Extracting the Liquid Crystals Contained in an Element That Comprises a First Support and a Second Support—Associated Device. French Patent No. FR3017808 (A1); Patent No. EP3111276 (A1); Patent No. WO2015128582 (A1), 4 January 2017. [Google Scholar]
- Kim, Y.; Lee, M.; Wang, H.S.; Ahn, S.; Kim, J.; Song, K. FTIR spectroscopic studies of polar nematic liquid crystals in various molecular arrangements. Vib. Spectrosc. 2017, 92, 182–187. [Google Scholar] [CrossRef]
- Naemura, S.; Sawada, A. Ionic Conduction in Nematic and Smectic A Liquid Crystals. Mol. Cryst. Liq. Cryst. 2003, 400, 79–96. [Google Scholar] [CrossRef]
- Liu, Y.; Mou, S. Ion chromatographic determination of some anions and alkaline cations in liquid crystal materials after ultraviolet irradiation. Talanta 2003, 60, 1205–1213. [Google Scholar] [CrossRef] [PubMed]
- Hung, H.-Y.; Lu, C.-W.; Lee, C.-Y.; Hsu, C.-S.; Hsieh, Y.-Z. Analysis of metal ion impurities in liquid crystals using high resolution inductively coupled plasma mass spectrometry. Anal. Methods 2012, 4, 3631–3637. [Google Scholar] [CrossRef]
- Jasiurkowska-Delaporte, M.; Rozwadowski, T.; Dmochowska, E.; Juszyńska-Gałązka, E.; Kula, P.; Massalska-Arodź, M. Interplay between Crystallization and Glass Transition in Nematic Liquid Crystal 2,7-Bis(4-pentylphenyl)-9,9-diethyl-9H-fluorene. J. Phys. Chem. B 2018, 122, 10627–10636. [Google Scholar] [CrossRef] [PubMed]
- Ramos, J.J.M.; Diogo, H.P. Phase behavior and slow molecular dynamics in the glassy state and in the glass transformation of a nematic liquid crystal: 4CFPB. Liq. Cryst. 2020, 47, 604–617. [Google Scholar] [CrossRef]
- Mansaré, T.; Decressain, R.; Gors, C.; Dolganov, V.K. Phase Transformations And Dynamics Of 4-Cyano-4′-Pentylbiphenyl (5cb) By Nuclear Magnetic Resonance, Analysis Differential Scanning Calorimetry, And Wideangle X-Ray Diffraction Analysis. Mol. Cryst. Liq. Cryst. 2002, 382, 97–111. [Google Scholar] [CrossRef]
- Davis, E.J.; Goodby, J.W. Classification of Liquid Crystals According to Symmetry. In Handbook of Liquid Crystals: 8 Volume Set; Goodby, J.W., Collings, J., Kato, T., Tschierske, C., Gleeson, H., Raynes, P., Vill, V., Eds.; Wiley-VCH Verlag GmbH & Co. KGaA.: Weinheim, Germany, 2014; pp. 27–56. ISBN 3527327738. [Google Scholar]
- Bukowczan, A.; Hebda, E.; Pielichowski, K. The influence of nanoparticles on phase formation and stability of liquid crystals and liquid crystalline polymers. J. Mol. Liq. 2021, 321, 114849. [Google Scholar] [CrossRef]
- Agra-Kooijman, D.M.; Kumar, S. X-Ray Scattering Investigations of Liquid Crystals. In Handbook of Liquid Crystals: 8 Volume Set; Goodby, J.W., Collings, J., Kato, T., Tschierske, C., Gleeson, H., Raynes, P., Vill, V., Eds.; Wiley-VCH Verlag GmbH & Co. KGaA.: Weinheim, Germany, 2014; pp. 301–338. ISBN 3527327738. [Google Scholar]
- Gray, G.W.; Goodby, J.W.C. Smectic Liquid Crystals: Textures and Structures, 1st ed.; Leonard Hill: Oakland, CA, USA, 1984; ISBN 0863440258. [Google Scholar]


| CAS RN | Molecular Structure and Name | GC-MS: Retention Time (min) | HRMS: Exact Masses (m/z) Obtained/ Calculated | Molecular Formula |
|---|---|---|---|---|
| 4973-24-4 |  2,6-di-tert-butyl-4-propylphenol | 27.69 | 248.2138/ 248.2138 | C17H28O |
| 82991-47-7 |  1-Ethyl-4-(4-propylcyclohexyl)benzene | 28.21 | 230.2033/ 230.2033 | C17H26 |
| 63221-88-5 |  1-(4-Ethylphenyl)-2-(4-methoxyphenyl)acetylene | 28.32 | 236.1201/ 236.1200 | C17H16O |
| 97398-80-6 |  4-Methoxy-4’-propyl-1,1’-bi(cyclohexyl) | 29.61 | 238.2296/ 238.2296 | C16H30O |
| 84952-30-7 |  1-Methoxy-4-(4-pentylcyclohexyl)benzene | 29.78 | 260.2139/ 260.2138 | C18H28O |
| 80944-44-1 |  4-(trans-4-Propylcyclohexyl)-1-ethoxy-benzene | 30.36 | 246.1982/ 246.1983 | C17H26O |
| 129738-34-7 |  4-Pentyl-4’-vinyl-1,1’-bi(cyclohexyl) | 30.45 | 262.2657/ 262.2658 | C19H34 |
| 82991-48-8 |  1-(4-Pentylcyclohexyl)-4-propylbenzene | 30.58 | 272.2501/ 272.2502 | C20H32 |
| 67589-39-3 |  4-ethoxyphenyl-4-propylcyclohexane-1-carboxylate | 30.56 | 290.1880/ 290.1880 | C18H26O3 |
| 87260-24-0 |  4-Fluoro-4’-(4-propylcyclohexyl)-1,1’-biphenyl | 30.96 | 296.1938/ 296.1939 | C21H25F |
| 118164-50-4 |  4-(4’-ethyl [1,1’-bicyclohexane]-4-yl)- 1,2-difluorobenzene- | 31.07 | 306.2156/ 306.2157 | C20H28F2 |
| 84656-75-7 |  Benzene, 1-methyl-4-(4’-propyl[1,1’-bicyclohexyl]-4-yl)- | 31.28 | 298.2658/ 298.2658 | C22H34 |
| 134412-18-3 |  4’-(4-Ethylcyclohexyl)-3,4-difluoro-1,1’-biphenyl | 31.46 | 300.1688/ 300.1688 | C20H22F2 |
| 82832-27-7 |  4-(4-Fluoro-phenyl)-4’-propyl-1,1’-bicyclohexyl | 31.62 | 302.2407/ 302.2408 | C21H31F |
| 82832-57-3 |  4-(3,4-Difluorophenyl)-4’-propyl-1,1’-bi(cyclohexyl) | 31.69 | 320.2315/ 320.2314 | C21H30F2 |
| 89203-80-5 |  3,4-difluorophenyl 4-pentylcyclohexane-1-carboxylate | 31.74 | 310.1744/ 310.1743 | C18H24F2O2 |
| 85312-59-0 |  1,1’-Biphenyl, 3,4-difluoro-4’-(4-propylcyclohexyl)- | 32.05 | 314.1843/ 314.1844 | C21H24F2 |
| 81793-59-1 |  4-Fluoro-4’-(4-pentylcyclohexyl)-1,1’-biphenyl | 32.23 | 324.2251/ 324.2251 | C23H29F |
| 93743-04-5 |  4-(4’-ethyl-[1,1’-bi(cyclohexan)]-4-yl)-2-fluorobenzonitrile | 32.52 | 327.2359/ 327.2360 | C22H30FN |
| 84656-77-9 |  4-propyl-4’-(4-propylphenyl)-1,1’-bi(cyclohexane) | 32.55 | 326.2973/ 326.2973 | C24H38 |
| 81701-13-5 |  4-fluorophenyl 4-(4-propylcyclohexyl)cyclohexanecarboxylate | 32.63 | 346.2309/ 346.2308 | C22H31FO2 |
| 118164-51-5 |  4-(3,4-Difluorophenyl)-4’-pentyl-1,1’-bi(cyclohexyl) | 32.68 | 348.2625/ 348.2626 | C23H34F2 |
| 134412-17-2 |  1,1’-Biphenyl, 3,4-difluoro-4’-(4-pentylcyclohexyl) | 32.82 | 342.2156/ 342.2157 | C23H28F2 |
| 135734-59-7 |  4-ethyl-4’-(4-(trifluoromethoxy)phenyl)-1,1’bi(cyclohexyl) | 32.89 | 354.21704/ 354.21705 | C21H29F3O |
| 133937-72-1 |  4-Propyl-4’-[4-(trifluoromethoxy)phenyl]-1,1’-bi(cyclohexyl) | 33.35 | 368.2326/ 368.2325 | C22H31F3O |
| 123560-48-5 |  4-(4-Ethoxy-2,3-difluorophenyl)-4’-propyl-1,1’-bi(cyclohexyl) | 33.47 | 364.2575/ 364.2575 | C23H34F2O |
| 97564-42-6 |  4-propylphenyl 4-(4-propylcyclohexyl)cyclohexanecarboxylate | 34.15 | 370.2870/ 370.2869 | C25H38O2 |
| 133914-49-5 |  4-pentyl-4’-[4-(trifluoromethoxy)phenyl]-1,1’-Bicyclohexyl | 35.33 | 396.2639/ 396.2640 | C24H35F3O |
| NP-M1 | NP-M2 | NP-M3 | Average | P-M1 | P-M2 | P-M3 | Average | |
|---|---|---|---|---|---|---|---|---|
| Element | (mg/L)-(ppm) | |||||||
| Al | 1.88 | 1.76 | 1.46 | 1.70 ± 0.11 | 2.06 | 1.43 | 1.40 | 1.63 ± 0.09 |
| B | 1.58 | 1.26 | 1.29 | 1.38 ± 0.05 | 0.32 | 0.46 | 0.36 | 0.38 ± 0.01 |
| Ba | 0.05 | 0.03 | 0.04 | 0.04 ± 0.01 | 0.019 | 0.012 | 0.011 | 0.013 ± 0.001 |
| Be | 0.20 | 0.18 | 0.19 | 0.19 ± 0.06 | n.d. | n.d. | n.d. | n.d. |
| Ca | 3.05 | 3.04 | 3.96 | 3.35 ± 0.24 | 3.42 | 3.89 | 3.57 | 3.63 ± 0.18 |
| Cu | 0.85 | 0.80 | 1.16 | 0.94 ± 0.05 | n.d. | n.d. | n.d. | n.d. |
| Fe | 1.34 | 1.09 | 1.35 | 1.26 ± 0.08 | 0.95 | 1.03 | 1.02 | 1.00 ± 0.06 |
| K | 28.73 | 23.38 | 29.57 | 27.23 ± 2.1 | 10.62 | 10.63 | 10.37 | 10.54 ± 0.55 |
| Mg | 2.05 | 1.01 | 2.57 | 1.88 ± 0.12 | 0.33 | 0.32 | 0.35 | 0.33 ± 0.01 |
| Na | 9.69 | 9.51 | 10.11 | 9.77 ± 0.60 | 4.63 | 4.58 | 3.82 | 4.34 ± 0.22 |
| Sn | 0.31 | 0.29 | 0.28 | 0.29 ± 0.01 | 0.210 | 0.290 | 0.250 | 0.25 ± 0.01 |
| Sr | 0.15 | 0.16 | 0.15 | 0.15 ± 0.01 | 0.05 | 0.04 | 0.05 | 0.050 ± 0.003 |
| Ti | 0.06 | 0.05 | 0.05 | 0.05 ± 0.01 | 0.038 | 0.020 | 0.020 | 0.026 ± 0.001 |
| Zn | 0.63 | 0.73 | 0.60 | 0.66 ± 0.03 | 0.21 | 0.29 | 0.25 | 0.25 ± 0.01 |
| Sample | Tg (°C) | TLCord-N/melting (°C) | ΔHLCord-N/melting * (J/g) | TN-I (°C) | ΔHN-I (J/g) |
|---|---|---|---|---|---|
| Non-purified | −90.0 | --- | --- | 71.2 | 2.1 |
| Purified | −91.1 | −50.1 | 0.59 | 73.6 | 2.5 |
| Non-Purified LC Mixture | |||
|---|---|---|---|
 |  |  |  |
 |  |  |  |
| Purified LC Mixture | |||
 |  |  |  |
 |  |  |  |
Disclaimer/Publisher’s Note: The statements, opinions and data contained in all publications are solely those of the individual author(s) and contributor(s) and not of MDPI and/or the editor(s). MDPI and/or the editor(s) disclaim responsibility for any injury to people or property resulting from any ideas, methods, instructions or products referred to in the content. |
© 2023 by the authors. Licensee MDPI, Basel, Switzerland. This article is an open access article distributed under the terms and conditions of the Creative Commons Attribution (CC BY) license (https://creativecommons.org/licenses/by/4.0/).
Share and Cite
Barrera, A.; Binet, C.; Danede, F.; Tahon, J.-F.; Ouddane, B.; Dubois, F.; Supiot, P.; Foissac, C.; Maschke, U. Chemical Characterization and Thermal Analysis of Recovered Liquid Crystals. Crystals 2023, 13, 1064. https://doi.org/10.3390/cryst13071064
Barrera A, Binet C, Danede F, Tahon J-F, Ouddane B, Dubois F, Supiot P, Foissac C, Maschke U. Chemical Characterization and Thermal Analysis of Recovered Liquid Crystals. Crystals. 2023; 13(7):1064. https://doi.org/10.3390/cryst13071064
Chicago/Turabian StyleBarrera, Ana, Corinne Binet, Florence Danede, Jean-François Tahon, Baghdad Ouddane, Frédéric Dubois, Philippe Supiot, Corinne Foissac, and Ulrich Maschke. 2023. "Chemical Characterization and Thermal Analysis of Recovered Liquid Crystals" Crystals 13, no. 7: 1064. https://doi.org/10.3390/cryst13071064