Article

Photoluminescence and Temperature Sensing Properties of Bi3+/Sm3+ Co-Doped La2MgSnO6 Phosphor for Optical Thermometer

1
College of Electronics Information, Hangzhou Dianzi University, Hangzhou 310018, China
2
Department of Physics, Garden Campus, Abdul Wali Khan University Mardan, Mardan 23200, Pakistan
*
Authors to whom correspondence should be addressed.
Crystals 2023, 13(7), 991; https://doi.org/10.3390/cryst13070991
Submission received: 31 May 2023 / Revised: 16 June 2023 / Accepted: 19 June 2023 / Published: 21 June 2023
(This article belongs to the Special Issue Microwave Dielectric Ceramics)

Abstract

:
The optical temperature sensor utilizing the fluorescence intensity ratio (FIR) has garnered significant attention in the past few years due to its rapid response, robust anti-interference capability, remote control feature, and other advantages. In this study, the high-temperature solid-phase approach was used to fabricate a variety of double perovskite-structured La2MgSnO6: Bi3+, Sm3+ (LMS: Bi3+, Sm3+) phosphors. The Rietveld refinement data of XRD and the Gaussian fitting of the emission peak of LMS: 0.02Bi3+ phosphor indicated Bi3+ occupies three lattice sites. The calculation and analysis of average lifetime and energy transfer efficiency substantiated the presence of energy transfer from Bi3+ to Sm3+, with a transfer efficiency of up to 59.07%. The emission intensity of LMS: 0.02Bi3+, 0.05Sm3+ at 403 K maintains 50.2% at the condition of room temperature. The FIR fitting and calculation demonstrated that LMS: 0.02Bi3+, 0.05Sm3+ phosphor possessed good optical temperature sensitivity, with a maximum absolute sensitivity Sa-max of 0.0055 K−1 and a maximum relative sensitivity Sr-max of 0.88% K−1, demonstrating its valuable potential applications for optical temperature sensors.

1. Introduction

The application of phosphors is no longer limited to the field of lighting, but also widely used in non-contact temperature sensors, fingerprint recognition, night vision detection, etc. [1,2,3] Compared to general contact temperature sensors, non-contact optical temperature sensors have the advantages of fast response, strong corrosion resistance, and remote control [4]. The optical temperature sensors utilize the linear discrepancy in the thermal stability of two luminescent ions in the matrix. Researchers have prepared a variety of phosphors for non-contact temperature sensors and obtained good experimental parameters in relative sensitivity and sensitivity [4,5]. For example, Sinha et al. [5] prepared the dual emission phosphors CaMoO4: Er3+, Yb3+ with a high sensitivity of 7.21 × 10⁻³ K−1 in the high-temperature range of 535–760 K. Wei [6] et al. synthesized the SrY2O4: Bi3+, Eu3+ phosphors, calculating a relative sensitivity of 0.86% K−1 at 433 K and an absolute sensitivity of 0.0433K−1 at 563 K by opposite temperature dependence and corresponding fluorescence ratios for the fluorescence intensity of Bi3+and Eu3+. A higher sensitivity is a key factor for non-contact fluorescent temperature sensors; therefore, a good matrix may be an intrinsic factor in improving its sensitivity when applied to temperature sensors. The energy transfer process that occurs in dual-emitting phosphors applied as temperature sensors is brought on by the sensitizer’s excitation energy being transmitted to the activator. For example, Pankratov [7] et al. synthesized the LaPO4: Ce3+, Tb3+ phosphor, proposing two novel models for the energy transfer from Ce3+ to Tb3+ in LaPO4. Van [8] et al. prepared the LiYF4: Pr3+, Yb3+ phosphor, proving that the dominant energy transfer is caused by cross-relaxation between Pr3+ and Yb3+. Over the past few years, lots of double-layer perovskite phosphors with an A2BB’O6 structure have been reported, for instance, La2MgTiO6: Sm3+, Eu3+, Gd2MgTiO6: Bi3+, Mn4+, Gd2ZnTiO6: Bi3+, Y2MgTiO6: Mn4+, and La2MgGeO6: Bi3+, Sm3+. [9,10,11,12,13] The stannate compound La2MgSnO6 with a double perovskite structure makes a good host due to the favorable lattice sites for Mn, Cr, and Bi ions, etc. For instance, Lu [14] et al. developed the La2CaSnO6/La2MgSnO6: Mn4+ phosphor with outstanding optical performance; Wu [15] et al. synthesized the LaMg0.5(SnGe)0.5O3: Cr3+ phosphor, by adding Ge4+, calculating its luminous intensity has increased by 1.6 times and the intensity at 150 °C is approximately 80% of the ambient temperature. The results mentioned above suggest the La2MgSnO6 is a fascinating host matrix.
This work prepared stannate phosphors La2MgSnO6: xBi3+ (x = 0.01, 0.02, 0.04, 0.06, 0.08, LMS: xBi3+), La2MgSnO6: ySm3+ (y = 0.01, 0.03, 0.05, 0.07, 0.09, LMS: ySm3+), and La2MgSnO6: 0.02Bi3+, ySm3+ (y = 0.01, 0.03, 0.05, 0.07, 0.09, 0.11, LMS: 0.02Bi3+, ySm3+) employing the conventional high-temperature solid-state strategy. The XRD diffraction pattern showed that the sample’s diffraction peaks closely matched those of the reference card. By refining the XRD of the sample, corresponding to unit cell parameters and bond length information were obtained, and the perovskite “tolerance factor” was calculated. The relationship between the “tolerance factor” and the fluorescence spectrum was further explored. According to the photoluminescence spectrum, the luminescence intensity of LMS: xBi3+ fluctuates as the Bi3+ concentration increases. By analyzing the emission spectra of LMS: 0.02Bi3+, ySm3+, the basis for energy transfer between Bi3+ and Sm3+ could be found. In addition, thermal quenching reasons and thermal activation energy calculations were conducted for the thermal stability under co-doping conditions.

2. Experimental

La2MgSnO6: xBi3+ (x = 0.01, 0.02, 0.04, 0.06, 0.08), La2MgSnO6: ySm3+ (y = 0.01, 0.03, 0.05, 0.07, 0.09), and La2MgSnO6: 0.02Bi3+, ySm3+ (y = 0.01, 0.03, 0.05, 0.07, 0.09) phosphors were synthesized through conventional high-temperature solid-state reaction. Using La2O3 (99.99%, Aladdin), MgO (99.99%, Aladdin), SnO2 (99.99%, Aladdin), Bi2O3 (99.9%, Aladdin), and Sm2O3 (99.99%, Aladdin) as raw materials, we weighed them stoichiometrically. The mixtures were thoroughly ground in the agate mortar. After that, the mixtures were put in an alumina crucible and fired for 10 h in a tube furnace to 1450 °C. The samples were ground into fine powders after reaching room temperature in preparation for a series of tests.
The X-ray diffractometer (Rigaku, Ultima IV, Tokyo, Japan) with Cu−Ka radiation was used to record the samples’ X-ray diffraction patterns. The scanning electron microscope (SEM) measurements were made on the samples’ micromorphology and elemental composition using a Hitachi SU8010 (Chiyoda City, Tokyo, Japan). The photoluminescence (PL) and photoluminescence excitation (PLE)spectra, fluorescence decay curve, and temperature-dependent emission spectra of samples were determined using the FLS980 (Edinburgh, UK) fluorescence spectrophotometer.

3. Results and Discussion

The LMS is the standard double perovskite structure of A2BB’O6 with a monoclinic system P21/n space group with sites A, B, and B’ filled by La, Mg, and Sn, respectively. Figure 1a shows the schematic diagram of its crystal structure, in which Mg and Sn form MgO6 and SnO6 octahedra with six oxygen atoms, respectively, and Mg has two sites: Mg1 and Mg2 in the crystal structure. Mg2 and Sn occupy the same site. In addition, the vertex O atoms of the octahedra of Mg1O6 and Mg2/SnO6 are shared, and the two ligands are arranged alternately to build a structure layer with long-range order. The La atoms and seven oxygen atoms form a LaO7 decahedron embedded in the middle of the structure layer, forming a double perovskite structure of the LMS. The Rietveld refinement result of LMS is shown in Figure 1b and Table 1.
Figure 2 gives the XRD patterns of LMS: xBi3+, 0.03Sm3+(x = 0–0.08). The standard card (No. PDF#01-075-8478) and all of the diffraction peaks match perfectly, which demonstrates that the LMS crystal structure is unaffected by the doped ions. The main peak at 2θ angles from 31.0 to 32.0° shifts to a low angle first and then to a high angle as a function of the Bi3+ doping concentration. According to Bragg’s diffraction Formula (1) [16,17]:
2 d sin θ = n λ
where d is the atomic plane spacing, λ is the wavelength of the incident ray, θ represents the half diffraction angle, and n is an integer. When Bi3+(r = 1.03 Å, CN = 6) with a larger ionic radius occupies Mg2+ (r = 0.72 Å, CN = 6) and Sn4+ (r = 0.69 Å, CN = 6) with smaller ionic radius, the lattice expands and the cell volume increases, resulting in the main diffraction peak move to a smaller angle. Although Bi3+ often exists in three coordination environments of five, six, and eight, the occupancy of seven-coordination of Bi3+ has also been reported [18]. Therefore, when Bi3+ is doped at a concentration of less than 0.02 mol, Bi3+ mainly occupies the sites of Mg2+ and Sn4+, but La is slightly replaced and forms the third luminescent center. When the concentration of Bi3+ is more than 0.2 mol, the smaller Bi3+ mainly replaces the larger La3+ site [14], Mg2+ and Sn4+ are slightly replaced by Bi3+, which leads to lattice shrinkage and volume reduction, and a small shift to a high angle occurs in the diffraction peak. The above results are all attributed to the abundant sites of the LMS environment. Figure 3 depicts the particle morphology and elemental mapping images, illustrating that La, Mg, Sn, O, Bi, and Sm are uniformly distributed in the LMS: 0.02Bi3+, 0.05Sm3+ sample and further demonstrating the successful incorporation of the doped ions. For perovskite-structured crystals, the lattice distortion can be characterized by the tolerance factor Tf. The closer Tf is to the value 1, the closer it is to the ideal cubic structure, indicating that the structure is the most stable and the distortion is the smallest [19,20,21,22], which is most conducive to the formation of effective and stable luminescent centers for activator ions. The following is the calculation Formula (2) [22]:
T f = R A + R O 2 R B + R B’ 2 + R O
where RA, RB, RB, and RO represent the ionic radius of each ion of the A2BB’O6 perovskite-type (RO = 1.4 Å, which is the ionic radius of O2−), respectively. The calculated Tf of the matrix is 0.8400, Tf < 1, indicating that LMS is a monoclinic phase structure. We also calculate Tf for samples doped with different concentrations of Bi3+, as shown in Table S4. When the concentration of Bi3+ increases, Tf values are all below 1, and the absolute value of the difference from 1 also increases, indicating that the massive doping of Bi3+ enhanced the lattice distortion of LMS, which gradually weakened of the stability of the matrix structure and could not provide a stable luminescence site. Thus, when the amount of Bi3+ is more than 0.02 mol, Bi3+ preferentially occupies the La3+ site, but the number of luminescent centers remains unchanged, which were Mg1O6, Mg2/SnO6, and LaO7, respectively.
Rietveld structure refinement is carried out on LMS: xBi3+ (x = 0.01–0.08) with the standard card. The crystallographic information can be seen in Figure S1 and Table S1 (see Supplementary Materials). All reliability factors are all less than 10%, indicating the high reliability of the refined data. From the bond length information in Tables S2 and S3, the average bond lengths in the matrix LMS are 2.750, 2.024, and 2.240 Å for LaO7 decahedron, MgO6 octahedra, and SnO6 octahedra, respectively. When Bi3+ is introduced, the average bond lengths of LaO7 decahedron, MgO6 octahedra, and SnO6 octahedra in the LMS: 0.02Bi3+ are 2.913, 2.120, and 2.111 Å, respectively. The bond length of other ligands all slightly increase except the MgO6 octahedron, leading to the deterioration of the stability of the crystal structure and the increase of lattice distortion.
To study the fluorescence characteristics of Bi3+ in LMS, Figure 4a exhibits the PLE and PL spectra of LMS: 0.02Bi3+. Under the monitor at 406 nm, the PLE spectrum of Bi3+ shows narrow-band excitation at 200–400 nm, and the strongest excitation wavelength is caused by the 1S03P1 transition of Bi3+ at 336 nm. Broadband emission waveband from 350 to 550 nm can be seen under excitation at 336 nm, with the peak value occurring at 406 nm, covering the near ultraviolet and blue regions, which is attributed to the 3P11S0 transition of Bi3+. The wavelength of this region tends to coincide with the excitation spectrum of other activator ions, which is why Bi3+ is often used as a sensitizer ion. Figure 4b exhibits the LMS: xBi3+ PL spectra, the strength of the emission peak does not always increase as the Bi3+ concentration rises. When the concentration of Bi3+ is 0.02 mol, concentration quenching occurs, and the luminescence gradually decreases.
The critical distance between ions during concentration quenching is evaluated by Formula (3) [23]:
R c = 2 3 V 4 π x c N 1 3
where Rc represents the critical distance, V is the unit cell’s volume, xc is the critical concentration, and N represent the number of cations in a unit cell. In the LMS: 0.02Bi3+ sample, V = 260.61 Å3, xc = 0.02, N = 8, the calculated Rc is 18.39 Å. The critical distance is greater than 5 Å, manifesting that the electric multipole interaction causes the concentration quenching of Bi3+. The Dexter Formula (4) can be used to determine the interaction type [24,25]:
I x = k 1 + β x θ 3
where x refers to the critical concentration of Bi3+, I is the luminous intensity, k and β are constants, and the θ value can define the type of interaction mechanism. Figure 4c depicts the function of log (I/x) versus log (x), and the slope value is −1.54. The θ equals 4.6, which approaches 6. Thus, dipole–dipole interaction is what causes the concentration quenching of Bi3+. As given in Figure 4b, when the concentration of Bi3+ increases from 0.01 to 0.02, the emission spectrum of Bi3+ shows a redshift, which is related to the strength of the crystal field in LMS.
The crystal field splitting describes the splitting between energy levels. The calculation of crystal field splitting is given by Formula (5) [26,27]:
D q = 1 6 Z e 2 r 4 R 5
where the crystal field splitting energy is represented by Dq, Z is the charge of anions, e is the electronic charge, the d wave function’s radius is represented by r, and R is the bond length following the substitution of Bi3+. When the concentration of Bi3+ is more than 0.02 mol, there is a red shift of 6 nm, indicating the Bi3+ (r = 1.03 Å, CN = 6) preferentially occupies La3+ (r = 1.1 Å, CN = 7) site. Due to the shorter bond distance of RBi-O compared to RLa-O, the crystal field splitting energy increases, leading to the spectral redshift. This is also evidence that the diffraction peak shift of LMS: xBi3+ exhibits abnormality. As shown in Figure 4d, Gaussian fitting is performed on the emission peak of LMS: 0.02Bi3+, and three emission peaks are obtained, indicating that there are three emission centers Bi1, Bi2, and Bi3 [28] during the doping process of Bi3+. When Bi3+ enters the matrix and occupies La3+, Mg2+, and Sn4+ sites, three different emission centers are formed. Three emission centers form together a photoluminescence spectrum, which indicates that the LMS matrix can provide an excellent crystal environment for luminescent centers.
The Formula (6) presented by Van Uitert [29] can be used to calculate the Gaussian peaks corresponding to each emission center:
E cm 1 = Q × 1 V 4 1 V × 10 n E a r 80
where E is the activator ion’s emission position, Q is the boundary of the free ionic state’s lower energy position, V represents the activator ion’s valence, the value n represents the coordination number of the activator ion’s occupied sites, Ea is the electronic affinity of the atom forming anion, and r is the substituted ion’s ionic radius. For LMS: 0.02Bi3+, the ionic radius and coordination number (r = 1.1 Å, CN = 7) of La3+ are larger than those of Mg2+ (r = 0.72 Å, CN = 6) and Sn4+ (r = 0.69 Å, CN = 6). Therefore, the Bi3 emission center generated at the 409nm emission peak (3.03 eV) is caused by Bi3+ occupying the La3+ site, the Bi1 emission center generated at the 431 nm emission peak (2.88 eV) is caused by Bi3+ occupying the Mg1 site, and the Bi2 emission center generated at the 454nm emission peak (2.73 eV) is caused by Bi3+ occupying the Mg/Sn site.
Figure 5a depicts the PL spectra of LMS: ySm3+ phosphors with different concentrations under excitation at 336 nm. The PL spectrum range covers the red region of 550–750 nm, with four distinct emission peaks located at 570, 607, 653, and 709 nm, respectively. These peaks are attributed to the electronic transitions of 4G5/26H5/2, 4G5/26H7/2, 4G5/26H9/2, 4G5/26H11/2 of Sm3+ [30], and the strongest excitation peak occurs at 605 nm. Concentration quenching happens at y = 0.05 as Sm3+ concentration rises. The PLE spectrum of LMS: 0.05 Sm3+ and the PL spectrum of LMS: 0.02 Bi3+ are shown in Figure 5b. It can be seen that many excitation peaks appear in the PLE spectrum range of Sm3+ is 300–500 nm, which is caused by the unique energy level structure of Sm3+. The strongest excitation peak is situated near 400 nm, which overlaps greatly with the emission peak of Bi3+. Therefore, it is possible that energy will be transferred from Bi3+ to Sm3+ in the co-doped sample, according to preliminary findings. To further explore the link between energy transfer from Bi3+ to Sm3+. Figure 5c exhibits the PL spectra of LMS: 0.02 Bi3+, ySm3+ (y = 0.01–0.11) at different concentrations. Two separate distinctive peaks are visible in the 350–700 nm region. The blue emission of 350–500 nm belongs to the characteristic peak of Bi3+, and the orange-red emission of 550–700 nm ascribes to the characteristic peak of Sm3+. The results after spectral integration and normalization of the two characteristic peaks are given in Figure 5d. It is evident that when Sm3+ concentration rises, the luminous intensity of Bi3+ drops linearly, while the luminous intensity of Sm3+ keeps rising until concentration quenching happens, indicating that under excitation at 336 nm, the energy of Bi3+ is transferred to Sm3+.
The luminescent decay curves of LMS: 0.02 Bi3+, ySm3+(y = 0–0.09) are measured under excitation at 336 nm in order to further study the energy transfer relationship from Bi3+ to Sm3+, as shown in Figure 6a–g. The fluorescence decay curves are fitted using the double exponential Formula (7) [31]:
I t = A 1 exp t τ 1 + A 2 exp t τ 2
where the luminescent intensity of LMS: 0.02 Bi3+, ySm3+ is represented by I(t) at time t, A1 and A2 are fitting constants, and the lifetimes for quick and slow decays are τ1 and τ2, respectively. Then, the average luminescent lifetime is determined by Formula (8) [32]:
τ = A 1 τ 1 2 + A 2 τ 2 2 A 1 τ 1 + A 2 τ 2
The luminescence center lifetime of Bi3+ decays from 140 to 61.41 ns with a minimum lifetime of 57.29 ns as the concentration of Sm3+ rises, indicating the indeed energy transfer from Bi3+ to Sm3+. As shown in Figure 6g, when the concentration of Sm3+ is higher than 0.03mol, the lifetime tends to be flat, which is related to the quenching of concentration. The presence of concentration quenching affects the energy transfer efficiency between sensitizer ions and activator ions. The energy transfer efficiency can be determined by Formula (9) [33]:
η T = 1 τ τ 0
where ηT represents the energy transfer efficiency between sensitizer ions and activator ions, and τ and τ0 are the lifetime of Bi3+ doped and without doped Sm3+, respectively. The calculated efficiency diagram is shown in Figure 6h, with the increase of Sm3+ doping concentration, the energy transfer efficiency gradually rises and stabilizes as Sm3+ doping concentration rises. These all verify the efficient energy transfer between Bi3+ and Sm3+.
Figure 7a displays the thermal stability of LMS: 0.02 Bi3+, 0.05 Sm3+ phosphor excited at 336 nm. All emission peaks decrease to varying degrees as the temperature increases from 303 to 503 K. The luminous intensity of Bi3+ at 406 nm decays to 41.5% at 403 K, while Sm3+ at 607 nm attenuates to only 59.6% of the initial temperature (303 K). The inset figure displays that Bi3+ has worse thermal stability Sm3+. The activation energy of phosphors can be determined using the Arrhenius Formula (10) [34,35]:
I T = I 0 1 + A e x p Δ E k T
where the luminous intensity at T temperature is characterized by IT, the initial luminescence intensity is represented by I0, A is a constant, and k is the Boltzmann constant, the activation energy is determined by ΔE. The relationship between ln (IT/I0 − 1) and 1/kT is plotted in Figure 7b, with the ΔE being represented by the negative slope. The ΔE of Sm3+ is 0.29 eV, while the ΔE of Bi3+ is 0.21 eV. Usually, the thermal stability and activation energy of phosphors are positively connected. Therefore, the luminous intensity of Sm3+ is less affected by temperature than Bi3+. The luminescence of Bi3+ is greatly affected by temperature, besides being related to its low activation energy, and the most essential reason is that Bi3+ luminescence is based on the transition of electron configurations of 6s2 and 6s16p1. This electron configuration has no outer barrier and electrons are exposed outside, and the transition is easily affected by the surrounding environment, such as coordination number, temperature, etc. However, the electronic configuration of Sm3+ belongs to 4fn, and the luminescence of this ion has unique characteristics, such as narrow emission peaks, long fluorescence lifetime, and difficult movement of emission peaks. These characteristics are mainly attributed to the stable transition environment created by the shielding of Sm3+ with 5 d and 6 s orbitals [13]. Figure 7c shows the variation of luminescence intensity of LMS: 0.02 Bi3+, 0.05 Sm3+ from 303 to 503 K. The total luminescence intensity decreases by 49.8% when the temperature is 403 K, indicating good thermal stability of the phosphor.
The difference of fluorescence thermal stabilities of Bi3+ and Sm3+ have a specific nonlinear relationship with temperature. Many literatures have reported to the realization of temperature sensors based on the thermal stability differences of these two ions [36,37], which makes it possible for LMS: 0.02 Bi3+, 0.05 Sm3+ phosphor to be used in optical temperature sensors. The ratio of the luminescent intensity of Bi3+ to Sm3+ is defined as FIR (fluorescence intensity ratio), which can be converted from the above Formula (10) to the following Formula (11) [38]:
F I R = I S m I B i = I 0 , S m I 0 , B i 1 + A B i exp Δ E B i k T 1 + A S m exp Δ E S m k T B + C e x p Δ E k T
where I(0, Sm) and I(0, Bi) represent the luminescent intensity of the initial temperature (303 K) of Sm3+ and Bi3+ at the T temperature. B, C, and ΔE are all fitted parameters. The fitting results are shown in Figure 8a, the fitting variance is 99.70%, indicating that the fitting parameters are highly credible. In addition, the FIR increases exponentially from 0.198 to 0.610 with the increase of temperature from 303 to 503 K. The performance of optical temperature sensors is characterized by absolute sensitivity Sa and relative sensitivity Sr, which can be characterized using the following formulas [39,40]:
S a = F I R T = C e x p Δ E k T × Δ E k T 2
S r = F I R T 1 F I R × 100 % = C e x p Δ E k T B + C e x p Δ E k T × Δ E k T 2
The above two formulas show that both Sa and Sr are related to FIR. As shown in Figure 8b, both sensitivities present an upward trend as the temperature rises. The maximum value of Sa and Sr are 0.0055 and 0.88% K−1 at 503 K, respectively.
Table 2 compares the sensitivity of phosphors used as optical temperature sensors with previous results. Obliviously, the LMS: 0.02Bi3+, 0.05Sm3+ phosphor have a slight advantage in absolute sensitivity and a more pronounced advantage in relative sensitivity. These all indicate that the potential application of LMS: 0.02Bi3+, 0.05Sm3+ phosphor in optical temperature sensors.

4. Conclusions

The conventional high-temperature solid-state approach was used to synthesize the LMS: xBi3+ (x = 0.01–0.08) and LMS: 0.02 Bi3+, ySm3+ (y = 0.01–0.11) phosphors. The refined data exhibits that the main peak of the XRD spectrum changes irregularly with a rise in Bi3+ concentration. The optimal emission concentration for Bi3+ is 0.02 mol. when the concentration of Bi3+ exceeds 0.2 mol, the emission spectrum is red-shifted. The three luminescence centers of Bi3+ were demonstrated using Gaussian fitting and Van Unitert’s formula. By analyzing fluorescent spectra and luminescent decay curves, the mechanism and efficiency of energy transfer from Bi3+ to Sm3+ were validated and computed. The maximum efficiency of energy transfer is 59.07%. In terms of thermal stability, the emission intensity remains 50.2% of the initial intensity at 403K. Finally, the optimal values for the relative and absolute sensitivity were obtained by fitting the FIR fluorescence index at 503 K, with 0.0055 K−1 and 0.88% K−1, respectively. These results demonstrate that LMS: Bi3+, Sm3+ phosphor is a promising candidate material for optical thermometry.

Supplementary Materials

The following supporting information can be downloaded at: https://www.mdpi.com/article/10.3390/cryst13070991/s1, Figure S1: (a)–(e) Refined maps of LMS: xBi3+(x = 0.01−0.08), respectively; (f) variation in cell volume; Table S1: Cell parameters and refinement data of LMS: xBi3+ (x = 0.01–0.08); Table S2: Cation bond length information in matrix LMS; Table S3: Cation bond length information in LMS: 0.02Bi3+; Table S4: “Tolerance factor” of LMS: xBi3+.

Author Contributions

Conceptualization, Q.X. and X.C.; methodology, Q.X.; software, X.C.; validation, W.Q.; formal analysis, Q.X.; investigation, K.S.; resources, Q.X.; data curation, Q.X.; writing—original draft preparation, Q.X.; writing—review and editing, K.S., X.Y. and R.M.; visualization, Q.X.; supervision, K.S.; project administration, K.S.; funding acquisition, K.S. All authors have read and agreed to the published version of the manuscript.

Funding

This research was funded by the National Natural Science Foundation of China under Grant No.: 51672063, 52161145401 and the Guangdong Key Platform & Programs of the Education Department of Guangdong Province for funding under Grant No. 2021ZDZX1003.

Institutional Review Board Statement

Not applicable.

Informed Consent Statement

Not applicable.

Data Availability Statement

Not applicable.

Conflicts of Interest

The authors declare no conflict of interest.

References

  1. Zhong, L.; Jiang, S.; Wang, X.; Li, Y.; Wang, Y.; Xie, J.; Ling, F.; Wang, Y.; Xiang, G.; Li, L.; et al. Dual-mode optical thermometry based on intervalence charge transfer excitations in Tb3+/Pr3+ co-doped CaNb2O6 phosphors. Ceram. Int. 2022, 48, 30005–30011. [Google Scholar] [CrossRef]
  2. Su, Y.; Yuan, L.; Liu, H.; Xiong, G.; Wu, H.; Hu, Y.; Cheng, X.; Jin, Y. Multi-site occupation of Cr3+ toward developing broadband near-infrared phosphors. Ceram. Int. 2021, 47, 23558–23563. [Google Scholar] [CrossRef]
  3. Guo, J.; Guo, J.; Gao, J.; Chen, J.; Yang, Y.; Yang, Y.; Zheng, L.; Li, Y.; Zhao, L.; Deng, B.; et al. A novel broadband-excited LaNb2VO9: Sm3+ orange-red-emitting phosphor with zero-thermal-quenching behavior for WLEDs and personal identification. Ceram. Int. 2022, 48, 26992–27002. [Google Scholar]
  4. Wang, C.; Jin, Y.; Yuan, L.; Wu, H.; Ju, G.; Li, Z.; Liu, D.; Lv, Y.; Chen, L.; Hu, Y. A spatial/temporal dual-mode optical thermometry platform based on synergetic luminescence of Ti4+-Eu3+ embedded flexible 3D micro-rod arrays: High-sensitive temperature sensing and multi-dimensional high-level secure anti-counterfeiting. Chem. Eng. J. 2019, 374, 992–1004. [Google Scholar] [CrossRef]
  5. Sinha, S.; Mahata, M.K.; Swart, H.C.; Kumar, A.; Kumar, K. Enhancement of upconversion, temperature sensing and cathodoluminescence in the K+/Na+ compensated CaMoO4: Er3+/Yb3+ nanophosphor. New J. Chem. 2017, 41, 5362–5372. [Google Scholar] [CrossRef]
  6. Wei, R.; Guo, J.; Li, K.; Yang, L.; Tian, X.; Li, X.; Hu, F.; Guo, H. Dual-emitting SrY2O4: Bi3+, Eu3+ phosphor for ratiometric temperature sensing. J. Lumin. 2019, 216, 116737. [Google Scholar] [CrossRef]
  7. Pankratov, V.; Popov, A.I.; Chernov, S.A.; Zharkouskaya, A.; Feldmann, C. Mechanism for energy transfer processes between Ce3+ and Tb3+ in LaPO4: Ce, Tb nanocrystals by time-resolved luminescence spectroscopy. Phys. Status Solidi B 2010, 247, 2252–2257. [Google Scholar] [CrossRef]
  8. Van Wijngaarden, J.; Scheidelaar, S.; Vlugt, T.; Reid, M.; Meijerink, A. Energy transfer mechanism for downconversion in the (Pr3+, Yb3+) couple. Phys. Rev. B 2010, 81, 155112. [Google Scholar] [CrossRef] [Green Version]
  9. Su, B.; Xie, H.; Tan, Y.; Zhao, Y.; Yang, Q.; Zhang, S. Luminescent properties, energy transfer, and thermal stability of double perovskites La2MgTiO6: Sm3+, Eu3+. J. Lumin. 2018, 204, 457–463. [Google Scholar] [CrossRef]
  10. Gao, P.; Dong, P.; Zhou, Z.; Li, Q.; Li, H.; Zhou, Z.; Xia, M.; Zhang, P. Enhanced luminescence and energy transfer performance of double perovskite structure Gd2MgTiO6: Bi3+, Mn4+ phosphor for indoor plant growth LED lighting. Ceram. Int. 2021, 47, 16588–16596. [Google Scholar] [CrossRef]
  11. Ji, C.; Huang, Z.; Wen, J.; Zhang, J.; Tian, X.; He, H.; Zhang, L.; Huang, T.-H.; Xie, W.; Peng, Y. Blue-emitting Bi-doped double perovskite Gd2ZnTiO6 phosphor with near-ultraviolet excitation for warm white light-emitting diodes. J. Alloys Compd. 2019, 788, 1127–1136. [Google Scholar] [CrossRef]
  12. Cai, P.; Qin, L.; Chen, C.; Wang, J.; Bi, S.; Kim, S.I.; Huang, Y.; Seo, H.J. Optical thermometry based on vibration sidebands in Y2MgTiO6: Mn4+ double perovskite. Inorg. Chem. 2018, 57, 3073–3081. [Google Scholar] [CrossRef] [PubMed]
  13. Wang, Q.; Mu, Z.; Zhang, S.; Du, Q.; Qian, Y.; Zhu, D.; Wu, F. Bi3+ and Sm3+ co-doped La2MgGeO6: A novel color-temperature indicator based on different heat quenching behavior from different luminescent centers. J. Lumin. 2019, 206, 462–468. [Google Scholar] [CrossRef]
  14. Lu, Z.; Sun, D.; Lyu, Z.; Shen, S.; Wang, J.; Zhao, H.; Wang, L.; You, H. Double Perovskite Mn4+-Doped La2CaSnO6/La2MgSnO6 Phosphor for Near-Ultraviolet Light Excited W-LEDs and Plant Growth. Molecules 2022, 27, 7697. [Google Scholar] [CrossRef]
  15. Wu, Q.; Li, P.; Ye, Z.; Huo, X.; Yang, H.; Wang, Y.; Wang, D.; Zhao, J.; Yang, Z.; Wang, Z. Near-infrared emitting phosphor LaMg0.5(SnGe)0.5O3: Cr3+ for plant growth applications: Crystal structure, luminescence, and thermal stability. Inorg. Chem. 2021, 60, 16593–16603. [Google Scholar] [CrossRef] [PubMed]
  16. Fu, A.; Guan, A.; Yu, D.; Xia, S.; Gao, F.; Zhang, X.; Zhou, L.; Li, Y.; Li, R. Synthesis, structure, and luminescence properties of a novel double-perovskite Sr2LaNbO6: Mn4+ phosphor. Mater. Res. Bull. 2017, 88, 258–265. [Google Scholar] [CrossRef]
  17. Bragg, W.H.; Bragg, W.L. The reflection of X-rays by crystals. Proc. R. Soc. Lond. Ser. A Contain. Pap. Math. Phys. Character 1913, 88, 428–438. [Google Scholar] [CrossRef]
  18. Jaffar, B.M.; Swart, H.C.; Seed Ahmed, H.A.A.; Yousif, A.; Kroon, R.E. Luminescence properties of Bi doped La2O3 powder phosphor. J. Lumin. 2019, 209, 217–224. [Google Scholar] [CrossRef]
  19. Maughan, A.E.; Ganose, A.M.; Almaker, M.A.; Scanlon, D.O.; Neilson, J.R. Tolerance factor and cooperative tilting effects in vacancy-ordered double perovskite halides. Chem. Mater. 2018, 30, 3909–3919. [Google Scholar] [CrossRef]
  20. Bartel, C.J.; Sutton, C.; Goldsmith, B.R.; Ouyang, R.; Musgrave, C.B.; Ghiringhelli, L.M.; Scheffler, M. New tolerance factor to predict the stability of perovskite oxides and halides. Sci. Adv. 2019, 5, eaav0693. [Google Scholar] [CrossRef] [Green Version]
  21. Hanif, A.; Aldaghfag, S.; Aziz, A.; Yaseen, M.; Murtaza, A. Theoretical investigation of physical properties of Sr2XNbO6 (X = La, Lu) double perovskite oxides for optoelectronic and thermoelectric applications. Int. J. Energy Res. 2022, 46, 10633–10643. [Google Scholar] [CrossRef]
  22. Shi, C.; Yu, C.H.; Zhang, W. Predicting and screening dielectric transitions in a series of hybrid organic–inorganic double perovskites via an extended tolerance factor approach. Angew. Chem. 2016, 128, 5892–5896. [Google Scholar] [CrossRef]
  23. Yun, X.; Zhou, J.; Zhu, Y.; Li, X.; Liu, S.; Xu, D. A Potentially Multifunctional Double-Perovskite Sr2ScTaO6: Mn4+, Eu3+ Phosphor for Optical Temperature Sensing and Indoor Plant Growth Lighting. J. Lumin. 2022, 244, 118724. [Google Scholar] [CrossRef]
  24. Dexter, D.L.; Schulman, J.H. Theory of concentration quenching in inorganic phosphors. J. Chem. Phys. 1954, 22, 1063–1070. [Google Scholar] [CrossRef]
  25. Tang, H.; Zhang, X.; Cheng, L.; Mi, X.; Liu, Q. Crystal Structure, Luminescence Properties and Thermal Stability of Lu3+ Ion-Substituted BaY2Si3O10: Dy3+ Phosphors. J. Alloys Compd. 2022, 898, 162758. [Google Scholar] [CrossRef]
  26. Sun, J.F.; Lian, Z.P.; Shen, G.Q.; Shen, D.Z. Blue–white–orange color-tunable luminescence of Ce3+/Mn2+-codoped NaCaBO3 via energy transfer: Potential single-phase white-light-emitting phosphors. RSC Adv. 2013, 3, 18395–18405. [Google Scholar] [CrossRef]
  27. Ding, X.; Zhu, G.; Geng, W.; Mikami, M.; Wang, Y. Novel blue and green phosphors obtained from K2ZrSi3O9: Eu2+ compounds with different charge compensation ions for LEDs under near-UV excitation. J. Mater. Chem. C 2015, 3, 6676–6685. [Google Scholar] [CrossRef]
  28. Zhou, H.; Wang, Q.; Jin, Y. Temperature dependence of energy transfer in tunable white light-emitting phosphor BaY2Si3O10: Bi3+, Eu3+ for near UV LEDs. J. Mater. Chem. C 2015, 3, 11151–11162. [Google Scholar] [CrossRef]
  29. Van Uitert, L.G. An empirical relation fitting the position in energy of the lower d-band edge for Eu2+ or Ce3+ in various compounds. J. Lumin. 1984, 29, 1–9. [Google Scholar] [CrossRef]
  30. Tang, T.P.; Lee, C.M.; Yen, F.C. The photoluminescence of SrAl2O4: Sm phosphors. Ceram. Int. 2006, 32, 665–671. [Google Scholar] [CrossRef]
  31. Walfort, B.; Gartmann, N.; Afshani, J.; Rosspeintner, A.; Hagemann, H. Effect of excitation wavelength (blue vs near UV) and dopant concentrations on afterglow and fast decay of persistent phosphor SrAl2O4: Eu2+, Dy3+. J. Rare Earths 2022, 40, 1022–1028. [Google Scholar] [CrossRef]
  32. Adachi, S. Temperature Dependence of Luminescence Intensity and Decay Time in Mn4+-Activated Oxide Phosphors. ECS J. Solid State Sci. Technol. 2022, 11, 056003. [Google Scholar] [CrossRef]
  33. Chen, H.; Wang, Y. Sr2LiScB4O10: Ce3+/Tb3+: A green-emitting phosphor with high energy transfer efficiency and stability for LEDs and FEDs. Inorg. Chem. 2019, 58, 7440–7452. [Google Scholar] [CrossRef] [PubMed]
  34. Fartode, S.A.; Fartode, A.P.; Dhoble, S.J. A review: Thermoluminescence dosimeteric application for phosphor. AIP Conf. Proc. 2019, 2104, 020043. [Google Scholar]
  35. Souadi, G.; Kaynar, U.H.; Oglakci, M.; Sonsuz, M.; Ayvacikli, M.; Topaksu, M.; Canimoglu, A.; Can, N. Thermoluminescence characteristics of a novel Li2MoO4 phosphor: Heating rate, dose response and kinetic parameters. Radiat. Phys. Chem. 2022, 194, 110025. [Google Scholar] [CrossRef]
  36. Fu, J.; Zhou, L.; Chen, Y.; Lin, j.; Ye, R.; Deng, D.; Chen, L.; Xu, S. Dual-mode optical thermometry based on Bi3+/Sm3+ co-activated BaGd2O4 phosphor with tunable sensitivity. J. Alloys Compd. 2022, 897, 163034. [Google Scholar] [CrossRef]
  37. Tian, X.; Dou, H.; Wu, L. Non-contact thermometry with dual-activator luminescence of Bi3+/Sm3+: YNbO4 phosphor. Ceram. Int. 2020, 46, 10641–10646. [Google Scholar] [CrossRef]
  38. Ran, W.; Sun, G.; Ma, X.; Zhang, L.; Yu, J.S.; Noh, H.M.; Choi, B.C.; Jeong, J.H.; Yan, T. Bifunctional application of La3BWO9: Bi3+, Sm3+ phosphors with strong orange-red emission and sensitive temperature sensing properties. Dalton Trans. 2021, 50, 15187–15197. [Google Scholar] [CrossRef]
  39. Song, M.; Zhao, W.; Xue, J.; Wang, L.; Wang, J. Color-tunable luminescence and temperature sensing properties of a single-phase dual-emitting La2LiSbO6: Bi3+, Sm3+ phosphor. J. Lumin. 2021, 235, 118014. [Google Scholar] [CrossRef]
  40. Song, Y.; Guo, N.; Li, J.; Ouyang, R.; Miao, Y.; Shao, B. Photoluminescence and temperature sensing of lanthanide Eu3+ and transition metal Mn4+ dual-doped antimoniate phosphor through site-beneficial occupation. Ceram. Int. 2020, 46, 22164–22170. [Google Scholar] [CrossRef]
  41. Swart, H.C.; Kumar, A.; Nair, G.B. BaY2F8: Yb3+, Ho3+/Tm3+ Upconversion Phosphor for Optical Thermometer. In Proceedings of the 5th International Conference on Sensors and Electronic Instrumentation Advances SEIA’ 2019, Tenerife (Canary Islands), Spain, 25–27 September 2019. [Google Scholar]
  42. Peng, L.; Meng, Q.; Sun, W. Size dependent optical temperature sensing properties of Y2O3: Tb3+, Eu3+ nanophosphors. RSC Adv. 2019, 9, 2581–2590. [Google Scholar] [CrossRef] [Green Version]
  43. Li, J.-Y.; Hou, D.; Zhang, Y.; Li, H.; Lin, H.; Lin, Z.; Zhou, W.; Huang, R. Luminescence, energy transfer and temperature sensing property of Ce3+, Dy3+ doped LiY9(SiO4)6O2 phosphors. J. Lumin. 2019, 213, 184–190. [Google Scholar] [CrossRef]
  44. Wang, J.; Lei, R.; Zhao, S.; Huang, F.; Deng, D.; Xu, S.; Wang, H. Color tunable Bi3+/Eu3+ co-doped La2ZnTiO6 double perovskite phosphor for dual-mode ratiometric optical thermometry. J. Alloys Compd. 2021, 881, 160601. [Google Scholar] [CrossRef]
  45. Wang, Y.; Zuo, C.; Ma, C.; Ye, W.; Zhao, C.; Feng, Z.; Li, Y.; Wen, Z.; Wang, C.; Shen, X.; et al. Effects of Sc3+ ions on local crystal structure and up-conversion luminescence of layered perovskite NaYTiO4: Yb3+/Er3+. J. Alloys Compd. 2021, 876, 160166. [Google Scholar] [CrossRef]
  46. Jiang, Y.; Tong, Y.; Chen, S.; Zhang, W.; Hu, F.; Wei, R.; Guo, H. A three-mode self-referenced optical thermometry based on up-conversion luminescence of Ca2MgWO6: Er3+, Yb3+ phosphors. Chem. Eng. J. 2021, 413, 127470. [Google Scholar] [CrossRef]
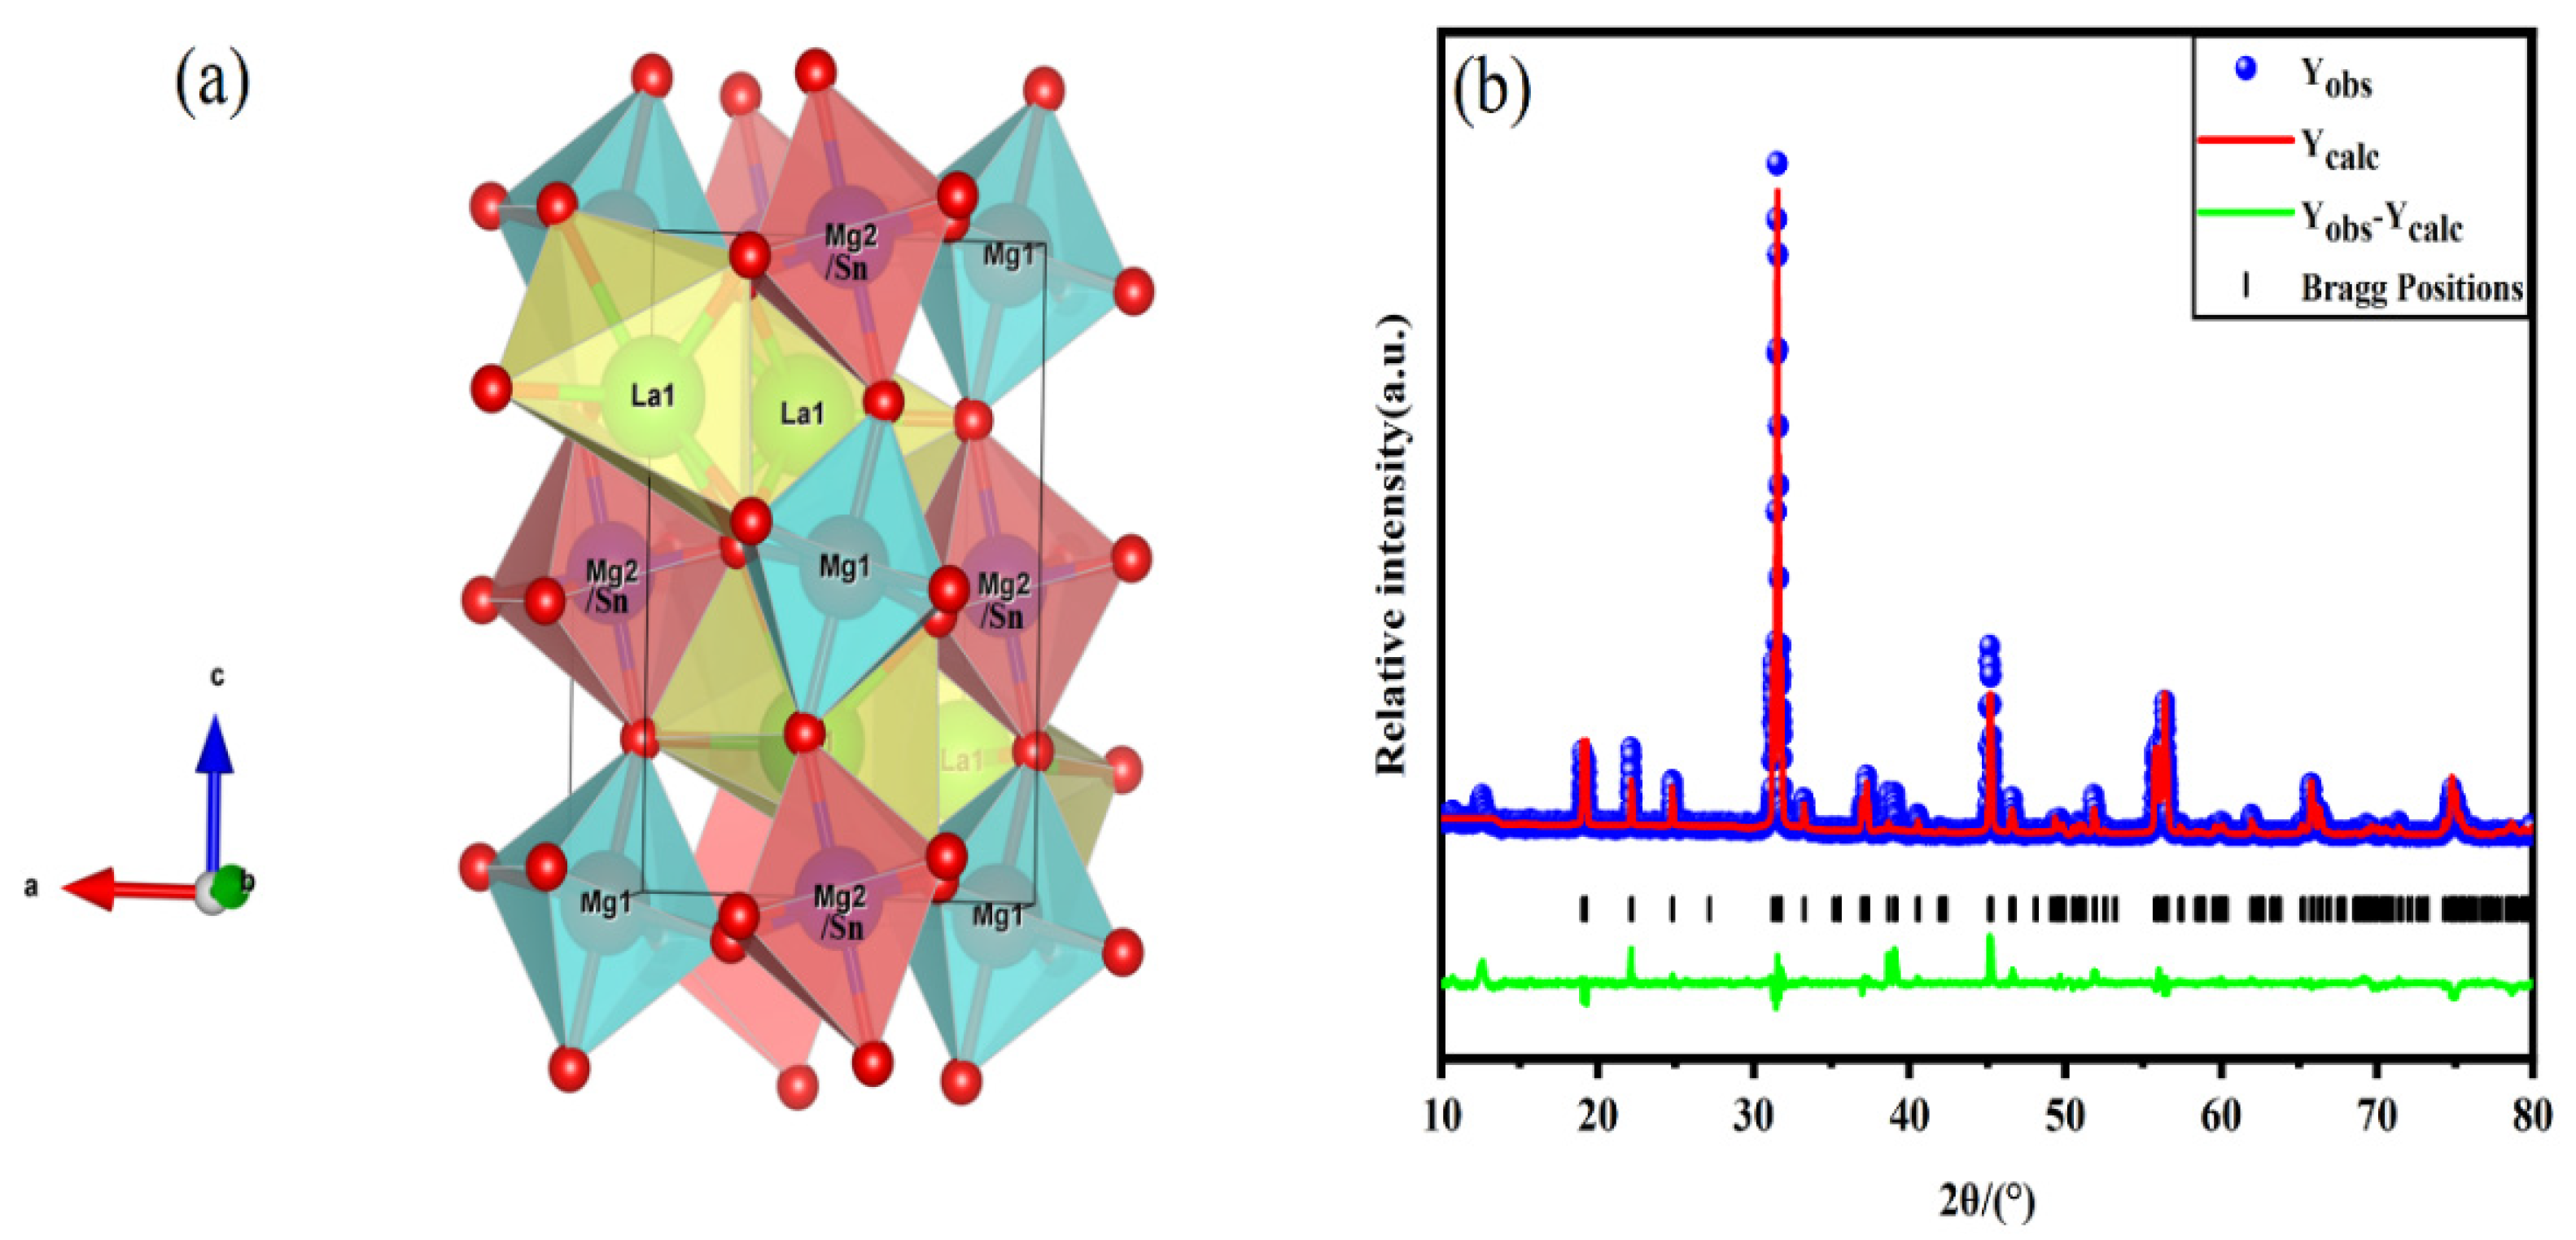
Figure 1. (a) Schematic diagram of LMS crystal structure; (b) refinement result of LMS.
Crystals 13 00991 g001
Figure 2. XRD pattern of LMS, LMS: xBi3+(x = 0.01–0.08), LMS: 0.02 Bi3+, 0.03 Sm3+.
Crystals 13 00991 g002
Figure 3. (ah) the micromorphology and elemental mapping images of LMS: 0.02 Bi3+, 0.05 Sm3+.
Crystals 13 00991 g003
Figure 4. (a) PLE and PL spectra of LMS: 0.02 Bi3+; (b) PL spectra of LMS: xBi3+(x = 0.01–0.08) with excitation wavelength of 336 nm; (c) concentration quenching fitting diagram of sample LMS: 0.02 Bi3+ at 336 nm excitation; (d) Gaussian fitting diagram of LMS: 0.02 Bi3+.
Crystals 13 00991 g004
Figure 5. (a) LMS: ySm3+(y = 0.01–0.09) PL spectrum; (b) PL spectra of LMS: 0.02 Bi3+ and PLE spectra of LMS: 0.05 Sm3+; (c) LMS: 0.02Bi3+, ySm3+ (y = 0.01–0.11) PL spectrum of phosphors at 336 nm; (d) intensity variations of Bi3+ and Sm3+ characteristic peaks.
Crystals 13 00991 g005
Figure 6. (af) Decay curve of LMS: 0.02 Bi3+, ySm3+ (y = 0–0.09) phosphors (λex = 336 nm); (g) the average fluorescence lifetime diagram corresponding to Sm3+ concentration; (h) energy transfer efficiency diagram corresponding to Sm3+ concentration.
Crystals 13 00991 g006
Figure 7. (a) Thermal stability diagram LMS: 0.02 Bi3+, 0.05 Sm3+ phosphor and the change of normalized intensity of Bi3+ and Sm3+ (inset); (b) fitting diagram of activation energy of LMS: 0.02 Bi3+, 0.05 Sm3+ phosphor; (c) luminous intensity variation of LMS: 0.02 Bi3+, 0.05 Sm3+ phosphor with different temperature.
Crystals 13 00991 g007
Figure 8. (a) FIR fitting diagram of LMS: 0.02 Bi3+, 0.05 Sm3+ phosphor; (b) absolute sensitivity Sa and relative sensitivity Sr diagram of LMS: 0.02 Bi3+, 0.05 Sm3+ phosphor as optical temperature sensors.
Crystals 13 00991 g008
Table 1. Cell parameters and refined data of LMS phosphor.
FormulaLMS
Space groupP21/n
Cell parameter (Å)a = 5.6362, b = 5.7228, c = 8.01927
Volume (Å3)258.66
Structure typeDouble perovskite
Rwp (%)9.67
Rp (%)6.02
χ2 (%)2.48
Table 2. Comparison of sensitivity between LMS: 0.02Bi3+, 0.05Sm3+ phosphor, and other phosphors as optical temperature sensors.
CompoundsTemperature Range (K)Sa-max
(K−1)
Sr-max
(%K−1)
Ref
BaY2F8:Yb3+/Ho3+330–4250.00570.6051[41]
Y2O3: Tb3+/Eu3+313–5130.02610.683[42]
LiY9(SiO4)6O2: Ce3+/Dy3+300–4000.43[43]
La2ZnTiO6: Bi3+/Eu3+293–5730.00321.23[44]
NaYTiO4: Yb3+/Er3+308–6180.0045[45]
Ca2MgWO6: Er3+/Yb3+303–5730.1260.11[46]
La2MgSnO6: Bi3+/Sm3+303–5030.00550.88This work
Disclaimer/Publisher’s Note: The statements, opinions and data contained in all publications are solely those of the individual author(s) and contributor(s) and not of MDPI and/or the editor(s). MDPI and/or the editor(s) disclaim responsibility for any injury to people or property resulting from any ideas, methods, instructions or products referred to in the content.

