Article

The Effect of Transition Metals Co-Doped ZnO Nanotubes Based-Diluted Magnetic Semiconductor for Spintronic Applications

by
Muhammad Adil Mahmood
1,
Rajwali Khan
1,2,*,
Sattam Al Otaibi
3,
Khaled Althubeiti
4,
Sherzod Shukhratovich Abdullaev
5,6,
Nasir Rahman
1,
Mohammad Sohail
1 and
Shahid Iqbal
7
1
Department of Physics, University of Lakki Marwat, Lakki Marwat 28420, KP, Pakistan
2
Department of Physics, Zhejiang University, Hangzhou 310000, China
3
Department of Electrical Engineering, College of Engineering Taif University, P.O. Box 11099, Taif 21944, Saudi Arabia
4
Department of Chemistry, College of Science, Taif University, P.O. Box 11099, Taif 21944, Saudi Arabia
5
Faculty of Chemical Engineering, New Uzbekistan University, Tashkent 10000, Uzbekistan
6
Scientific Department, Tashkent State Pedagogical University Named after Nizami, Tashkent 100183, Uzbekistan
7
Department of Physics, University of Wisconsin-La Crosse, La Crosse, WI 54601, USA
*
Author to whom correspondence should be addressed.
Crystals 2023, 13(7), 984; https://doi.org/10.3390/cryst13070984
Submission received: 9 May 2023 / Revised: 6 June 2023 / Accepted: 17 June 2023 / Published: 21 June 2023

Abstract

:
The Impact of Co and Gd on the structural, magnetic and dielectric properties of ZnO nanotubes synthesized by co-precipitation is reported. The results demonstrate that incorporating Co and Gd into ZnO diminished crystallinity while retaining the optimum orientation. The outcomes of transmission electron microscopy and scanning electron microscopy examined that the Co and Gd dopants had no effect on the morphology of the produced nanotubes. It was also discovered that as the frequency and concentration of Gd co-dopant decreased, the dielectric constant and loss values increased. When doping was present, the dielectric constant and ac electrical conductivity response was found to be inversely related. Ultimately, at 300K, Co and Gd co-doped ZnO nanotubes exhibited ferromagnetic properties. When Gd doping was increased to 3%, the ferromagnetic response increased. Since then, increasing the Gd co-doping, the ferromagnetic response decreased. For the same sample (Zn0.96−xCo0.04Gd0.03O nanotubes), the electrical conductivity exhibited also superior to pure and low Gd doped ZnO. Its high ferromagnetism is usually caused by magnetic impurities replaced on the ZnO side. Therefore, considering the behaviour of these nanotubes, it can be sued spin-based electronics.

1. Introduction

Diluted magnetic semiconductor (DMS) obtained by doping a dilute amount of transition metals [1,2,3,4,5,6,7,8] with semiconductors, has fascinated enormous interest among researchers and is being intensively studied for spintronics-related applications. Significant improvements in DMS for spintronic electrical devices, including the single electronic charge, quantum hall effect, semiconductor laser, and resistive switching, have been made as a result of the discovery of Ga1−xMnxAs ferromagnet (FM) material [9,10]. These devices are intriguing due to the potential for obtaining DMS Curie temperatures (TC) above room temperature ferromagnetism (RTFM). A number of earlier studies [11,12,13,14] showed that by doping of TMs doped to host II–VI and III–V semiconductors created an FM. Many practical applications favor this characteristic, however, it raised some debate regarding FM origin. A recent study for spin-based electronics has the potential to learn more about the RTFM of these structures because many materials containing nonmagnetic ions have displayed unexpected FM behavior. [14,15,16,17,18,19,20].
The insertion of 3d electron TMs into the lattice of II–VI semiconductor materials results in the creation of the DMS [12]. Zinc oxide (ZnO) is a typical substance used as a host for the introduction of TM ions. It has a wurtzite lattice, a huge direct band gap, and a high exciton binding energy, and it is an optically transparent II–VI semiconductor. Furthermore, room temperature ferromagnetism (RTFM) is observed in doped ZnO as a result of the free charge carriers produced by the doping of specific transition metal ions [21]. Fe, Mn, Ni and Co doping elements are discovered to be of considerable attention among the transition metal ions due to the capacity to introduce ferromagnetic behavior by replacing out the non-magnetic element Zn ion within the ZnO crystal lattice with a 3d transition metal ion. The choice of co-dopant ions depends on their valence states, coordination number, ionic radius and distinctive magnetic contribution. When contrasted with other three-dimensional metals, Co is preferred specifically because of its similar ionic radius (0.58 Ǻ) to that of Zn (0.60 Ǻ), as well as its large magnetic moment (μCo = 1.8 μB) (d7 low spin configuration). Recently, Hao et al. published their findings on the discovery of the fundamental RTFM in Mn-doped ZnO nanoparticles. [22]. Later, using this material, Oshio et al. [23] investigated the ZnO epitaxial film’s leakage current. The performance of Co-ZnO nanoparticles RTFM and semiconductor quantum dots was recently examined in order to demonstrate that Co doping produced defects and oxygen vacancies [24]. These results indicate that samples of (Co, Zn) co-doped SnO2 have tunable RTFM and that O2 annealing vacancies may be major method to improve the RTFM. Optoelectronic and electronic devices, ceramic industries, optical components, sensors, catalysis, biomedical, lighting, etc. are only a few of the technological applications that the ZnO material demonstrates due to its many defect-related features. According to Liu, Changzhen, et al., the optical band gap of Fe-doped ZnO nanoparticles increased with increasing Fe concentration, and they concluded that the observed RTFM is not caused by secondary phase ZnFe2O4 or the metallic Fe clusters. [25]. According to Saleh et al., A ferromagnetic secondary phase known as γ-Fe2O3 is responsible for RTFM in Fe-doped nanocrystalline ZnO particles, and the energy gap reduced with boosting Fe concentration [26]. The cause of ferromagnetism in ZnO-based DMSs is still up for debate despite several experimental and theoretical publications on ZnO. High-frequency electronic devices also require the superior dielectric, magnetic, and electrical conductivity of TMs-ZnO. [27,28,29].
The co-precipitation method was used in this study to synthesis ZnO, Zn0.96Co0.04O and Zn0.96−xCo0.04GdxO (x = 0, 0.01, 0.03, 0.04) nanotubes (NTs) with varying Gd contents while keeping a fixed Co content. The results suggest that the crystallinity was affected by the changing Co concentration, and this revealed a decrease in the rate at which photoinduced electron-hole pairs in ZnO recombined. Zinc NTs’ magnetic and dielectric responses were improved as a result of this phenomena. The outcomes were evaluated in relation to magnetic and optical properties in respect to structure and microstructure.

2. Materials and Methods
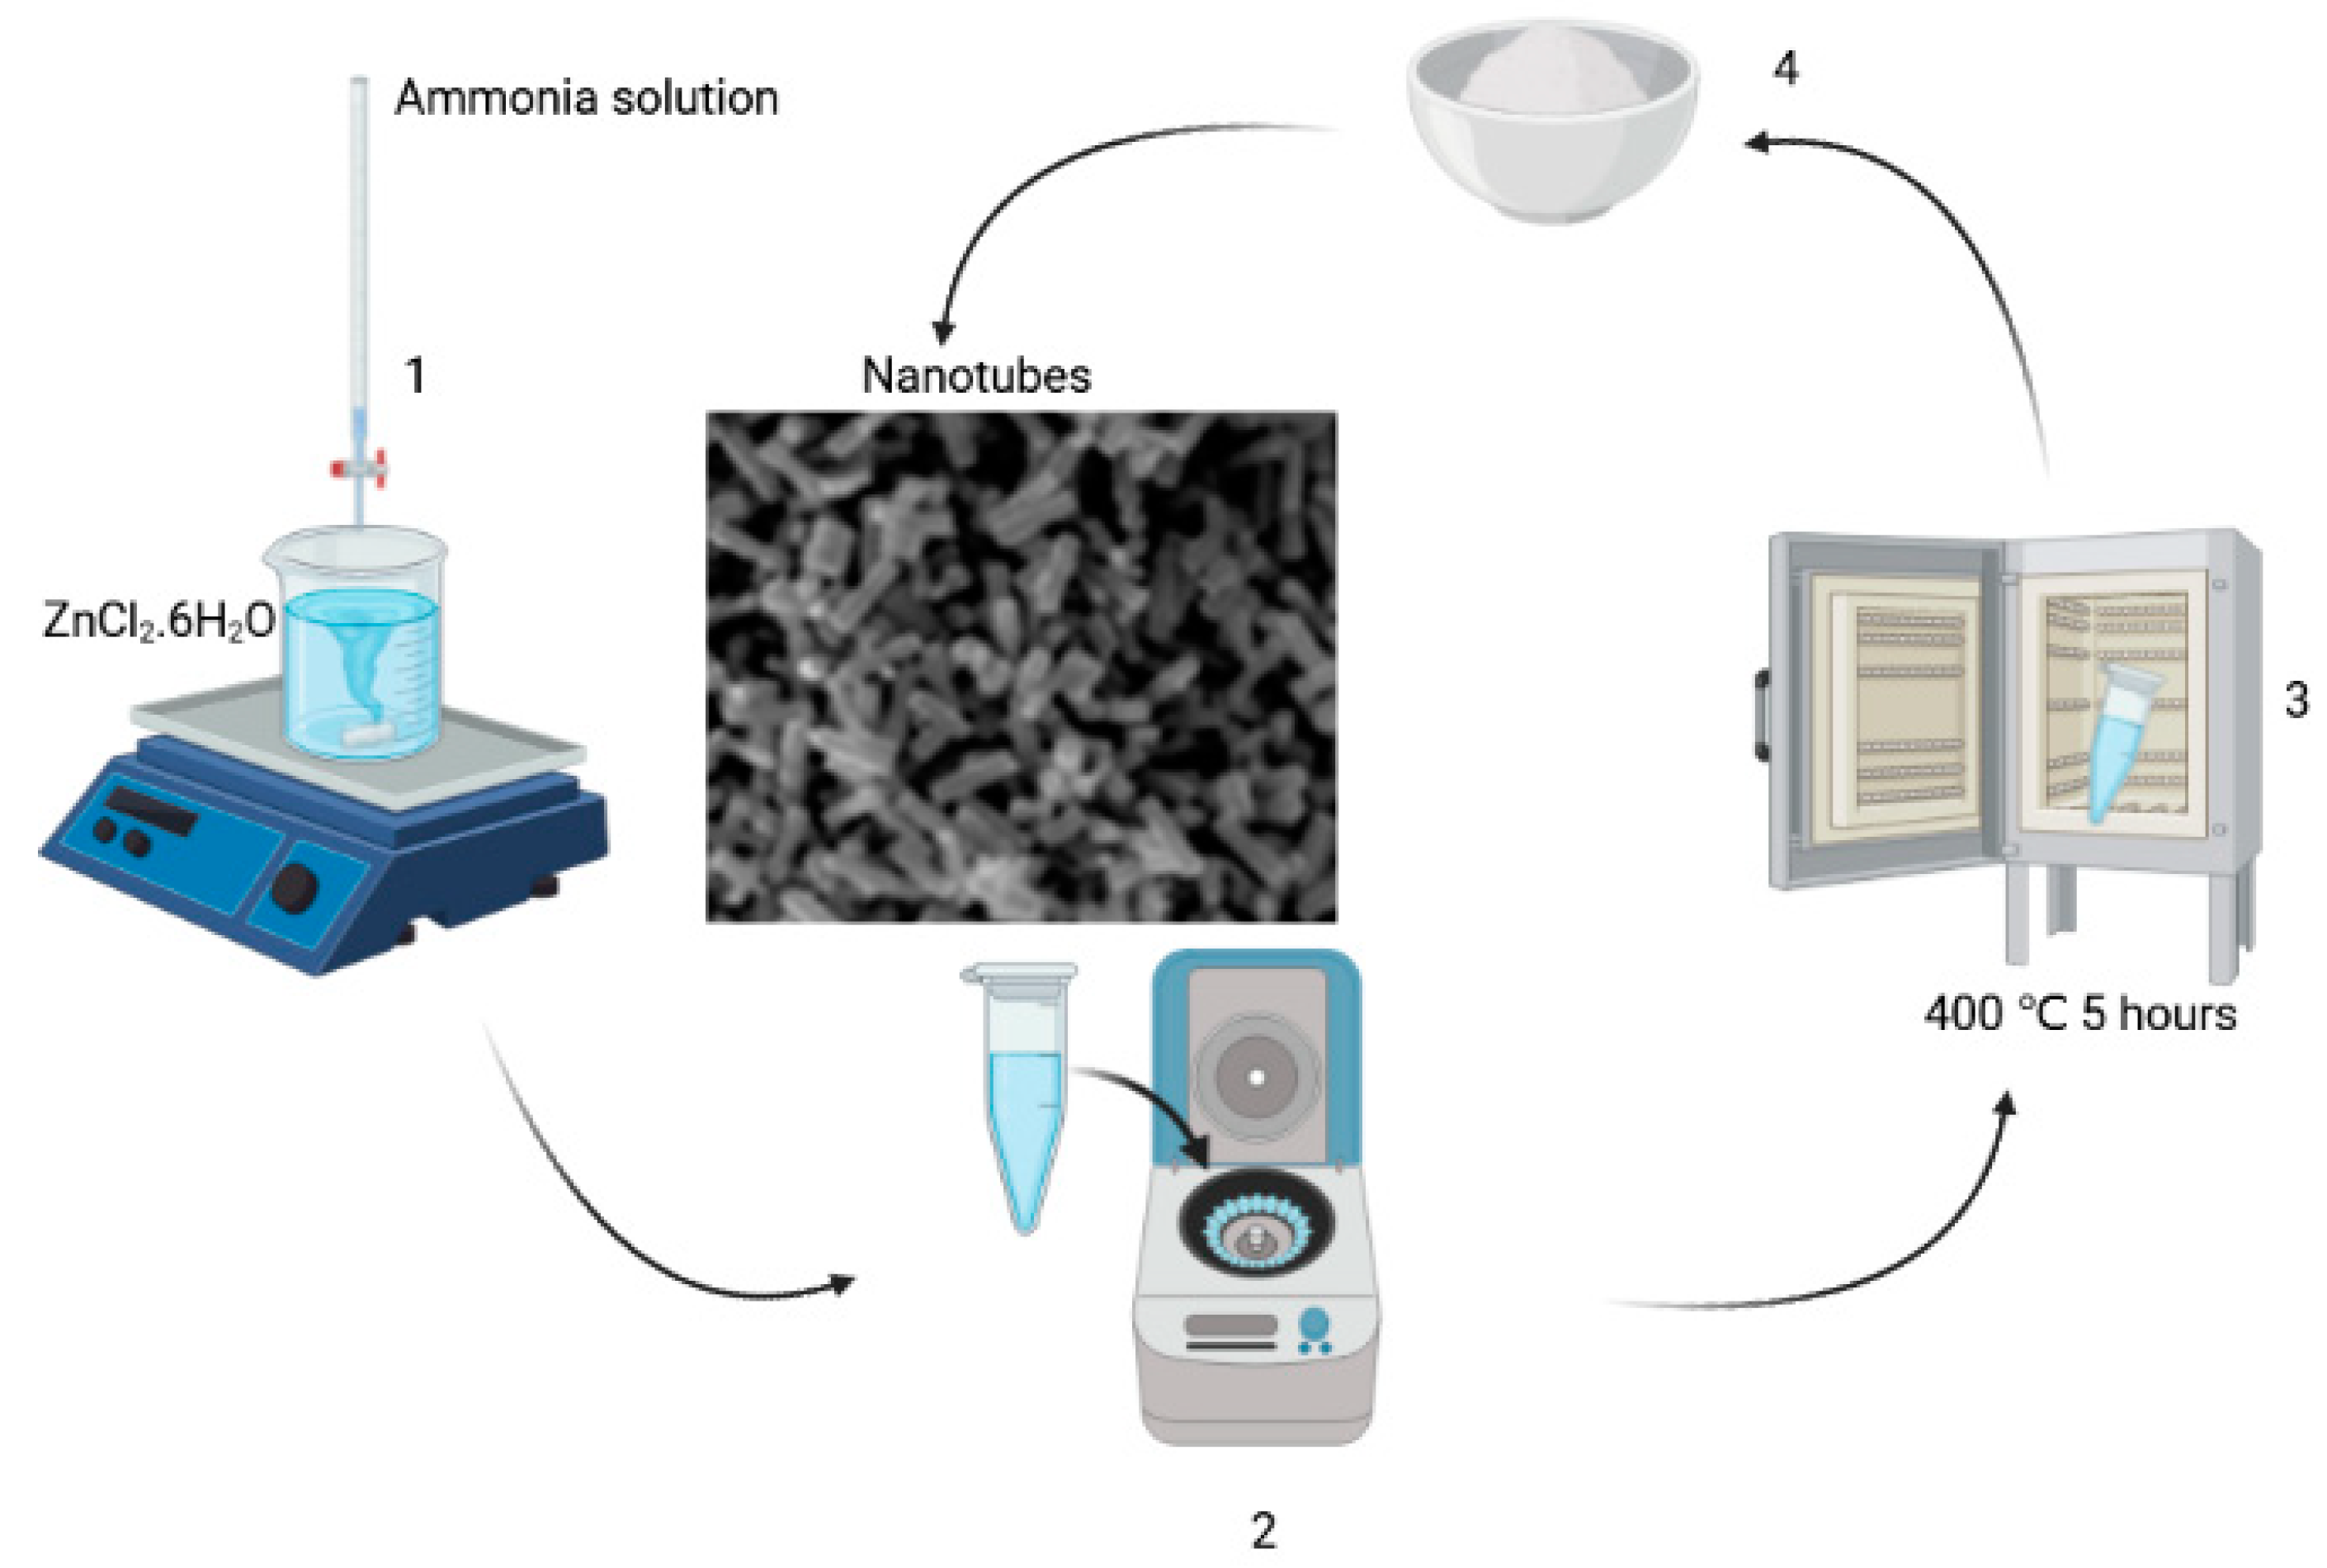
2.1. Synthesis

The compound, Cobalt chloride [CoCl2.4H2O], Zinc chloride [ZnCl2.6H2O] and Gadolinium cloride [GdCl3.6H2O], were collected from Alfa-Aesar. The ZnO, Zn0.96Co0.04O and Zn0.96−xCo0.04GdxO (x = 0, 0.01, 0.03, 0.04) nanotubes (NTs) were created by adopting the co-precipitation method. The process involved dissolving zinc chloride (ZnCl2.6H2O) in 50 milliliter of pure water (aqua), adding 20 milliliter of aqueous ammonia solution (1.5 M) dropwise, and stirring vigorously while the pH was maintained between 1.0 and 10.2 [30,31]. After the reaction, washing and centrifugation were used to get brownish-type powder. Afterwards, they were dried at 60 °C for 24 h before being annealed in a furnace for 5 h at 400 °C. Before annealing, the powder was washed 6 times to remove the chlorine from the samples. Zinc, Co, and Gd acetate were gently added while stirring, then the precipitates were separated for the Co and Gd co-doped specimens, as shown in Figure 1.

2.2. Instruments

Cu Kα radiation (λ = 1.5406 Å) was utilized from XRD in order to perform structural characterization. The sample’s lattice parameters and volumes were calculated via Rietveld refinements using the High Score Plus application. A field emission scanning electron microscope, also known as a FE-SEM, was utilized so that the particle shapes could be analyzed. The particles’ nature was determined using transmission electron microscopy. An impedance analyzer was used to determine the dielectric properties as well as the electrical conductivity from a frequency range of 40 Hz to 7 MHz and a frequency range of 50 Hz to 7 MHz. For the purpose of calculating the parameters of diluted magnetic semiconductors, a Quantum Design superconducting Quantum interface Device was utilized.

3. Results and Discussions

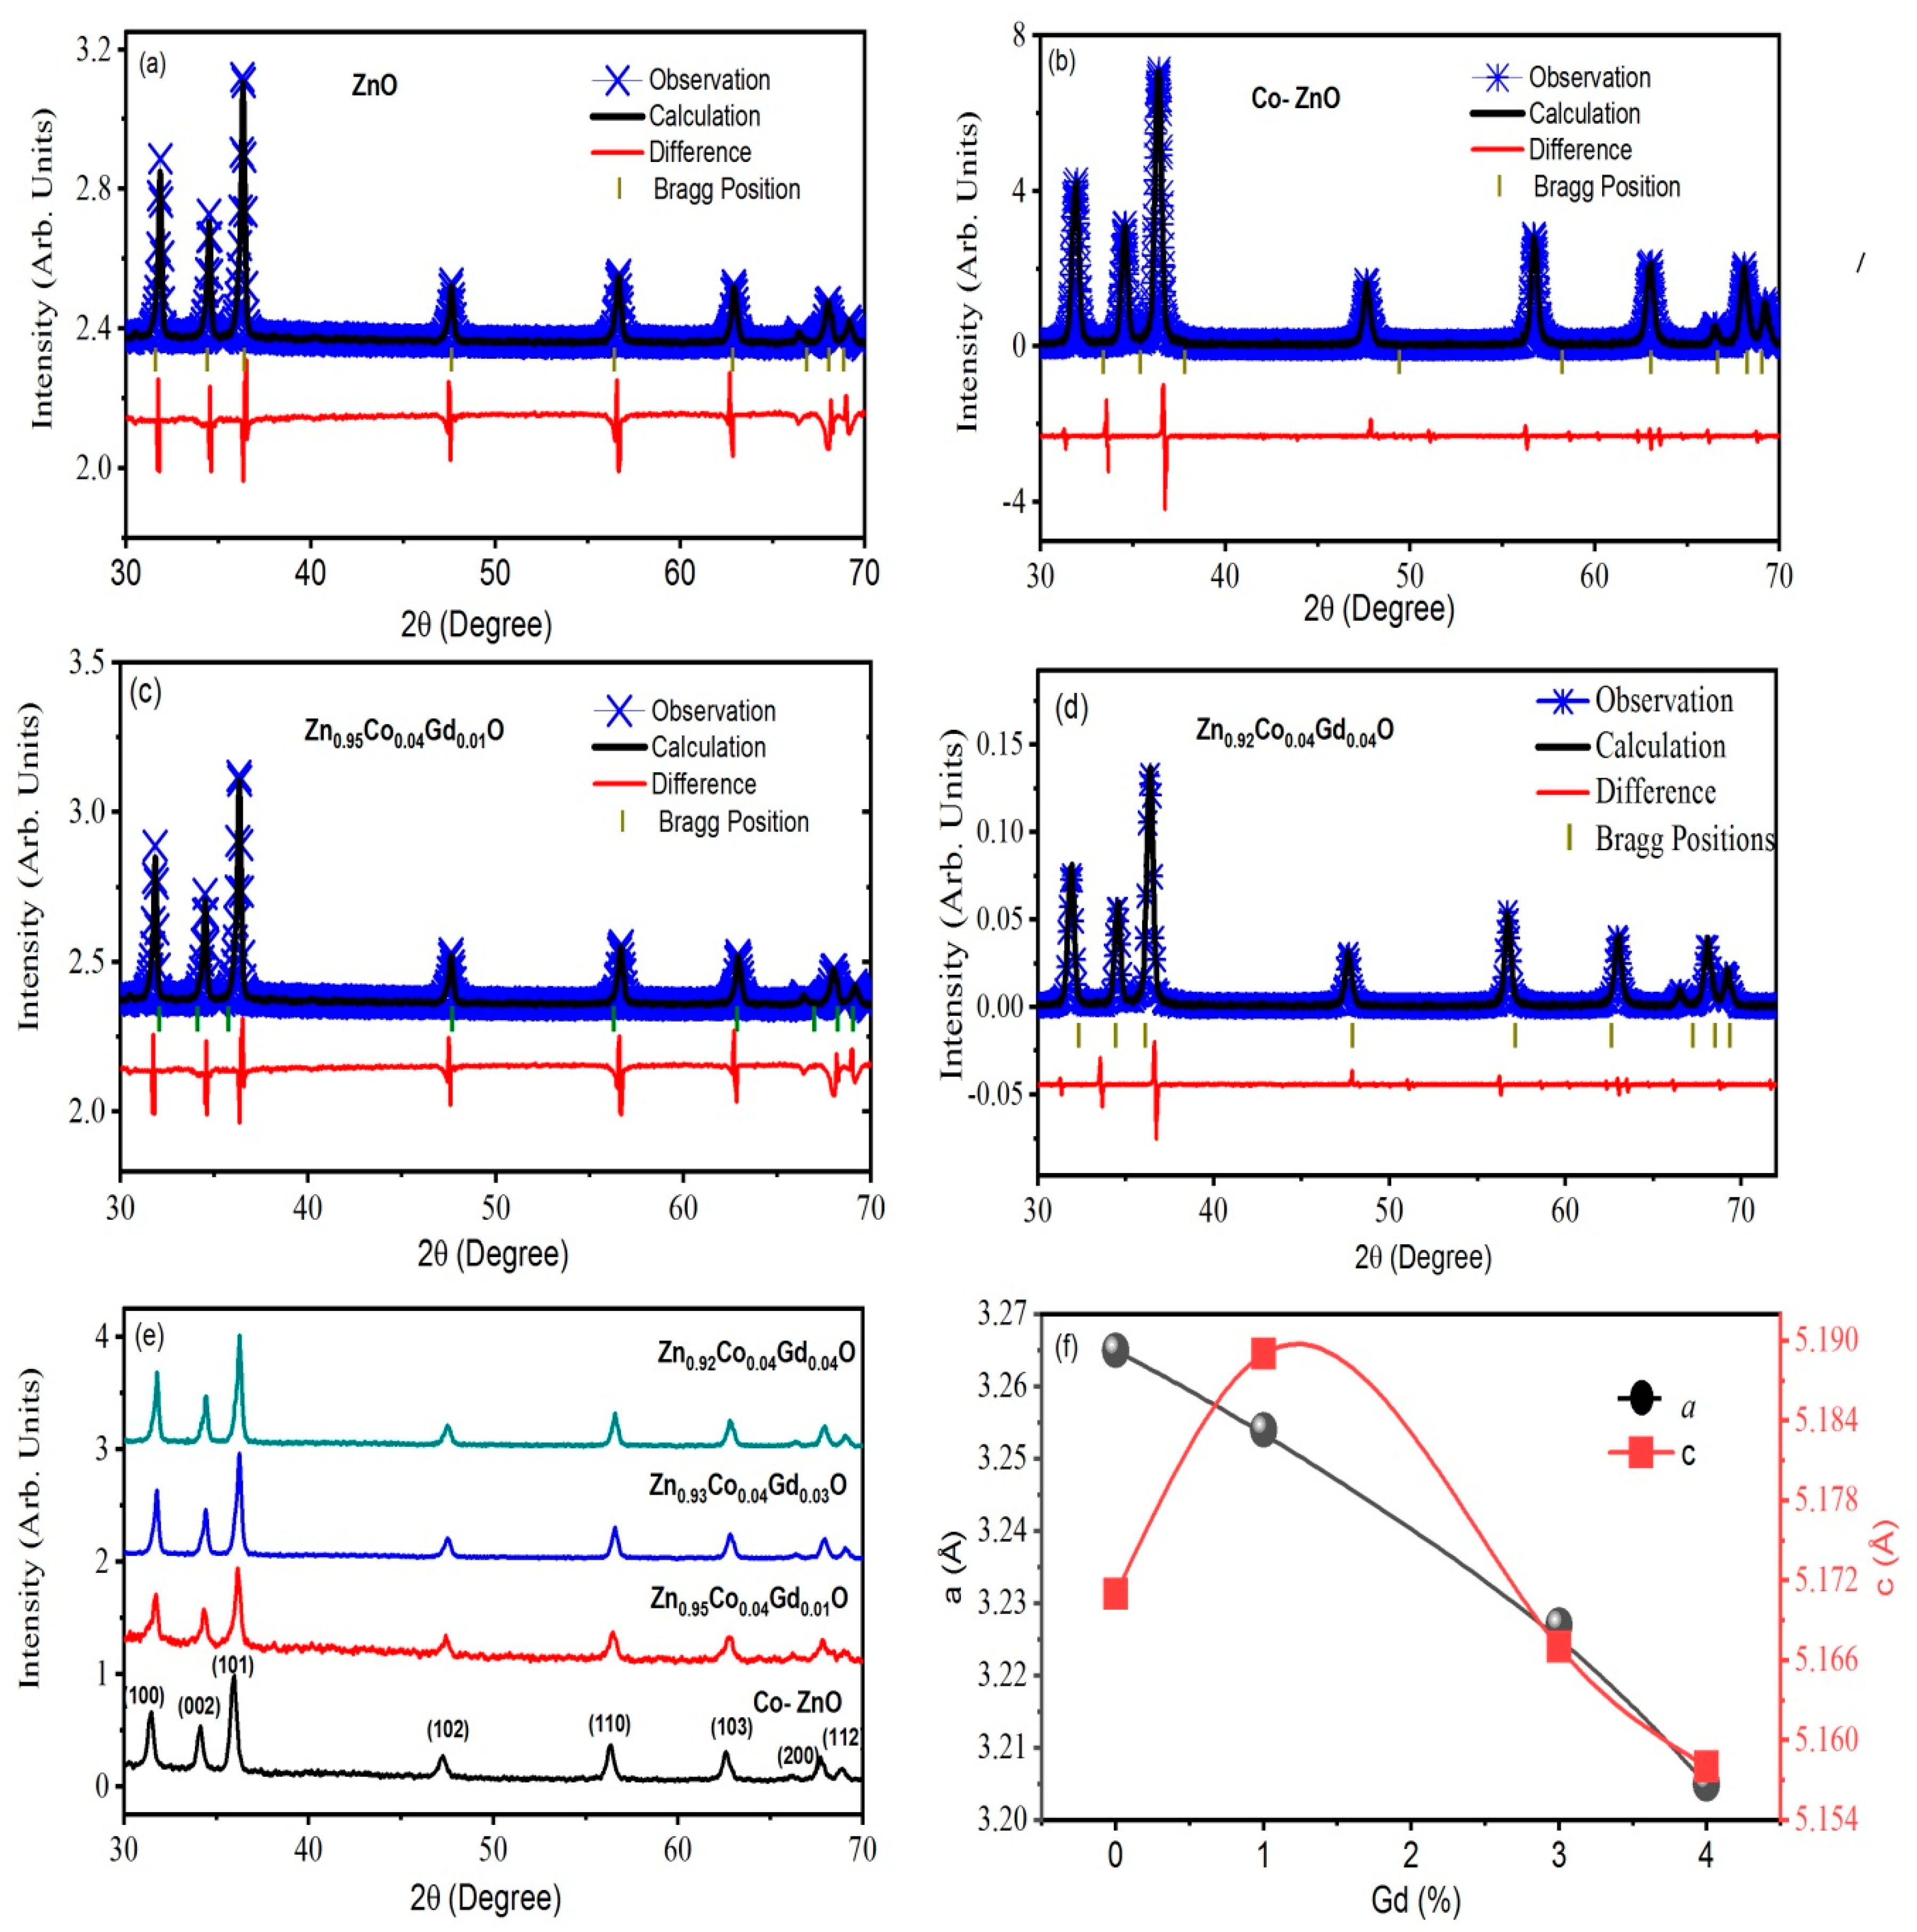
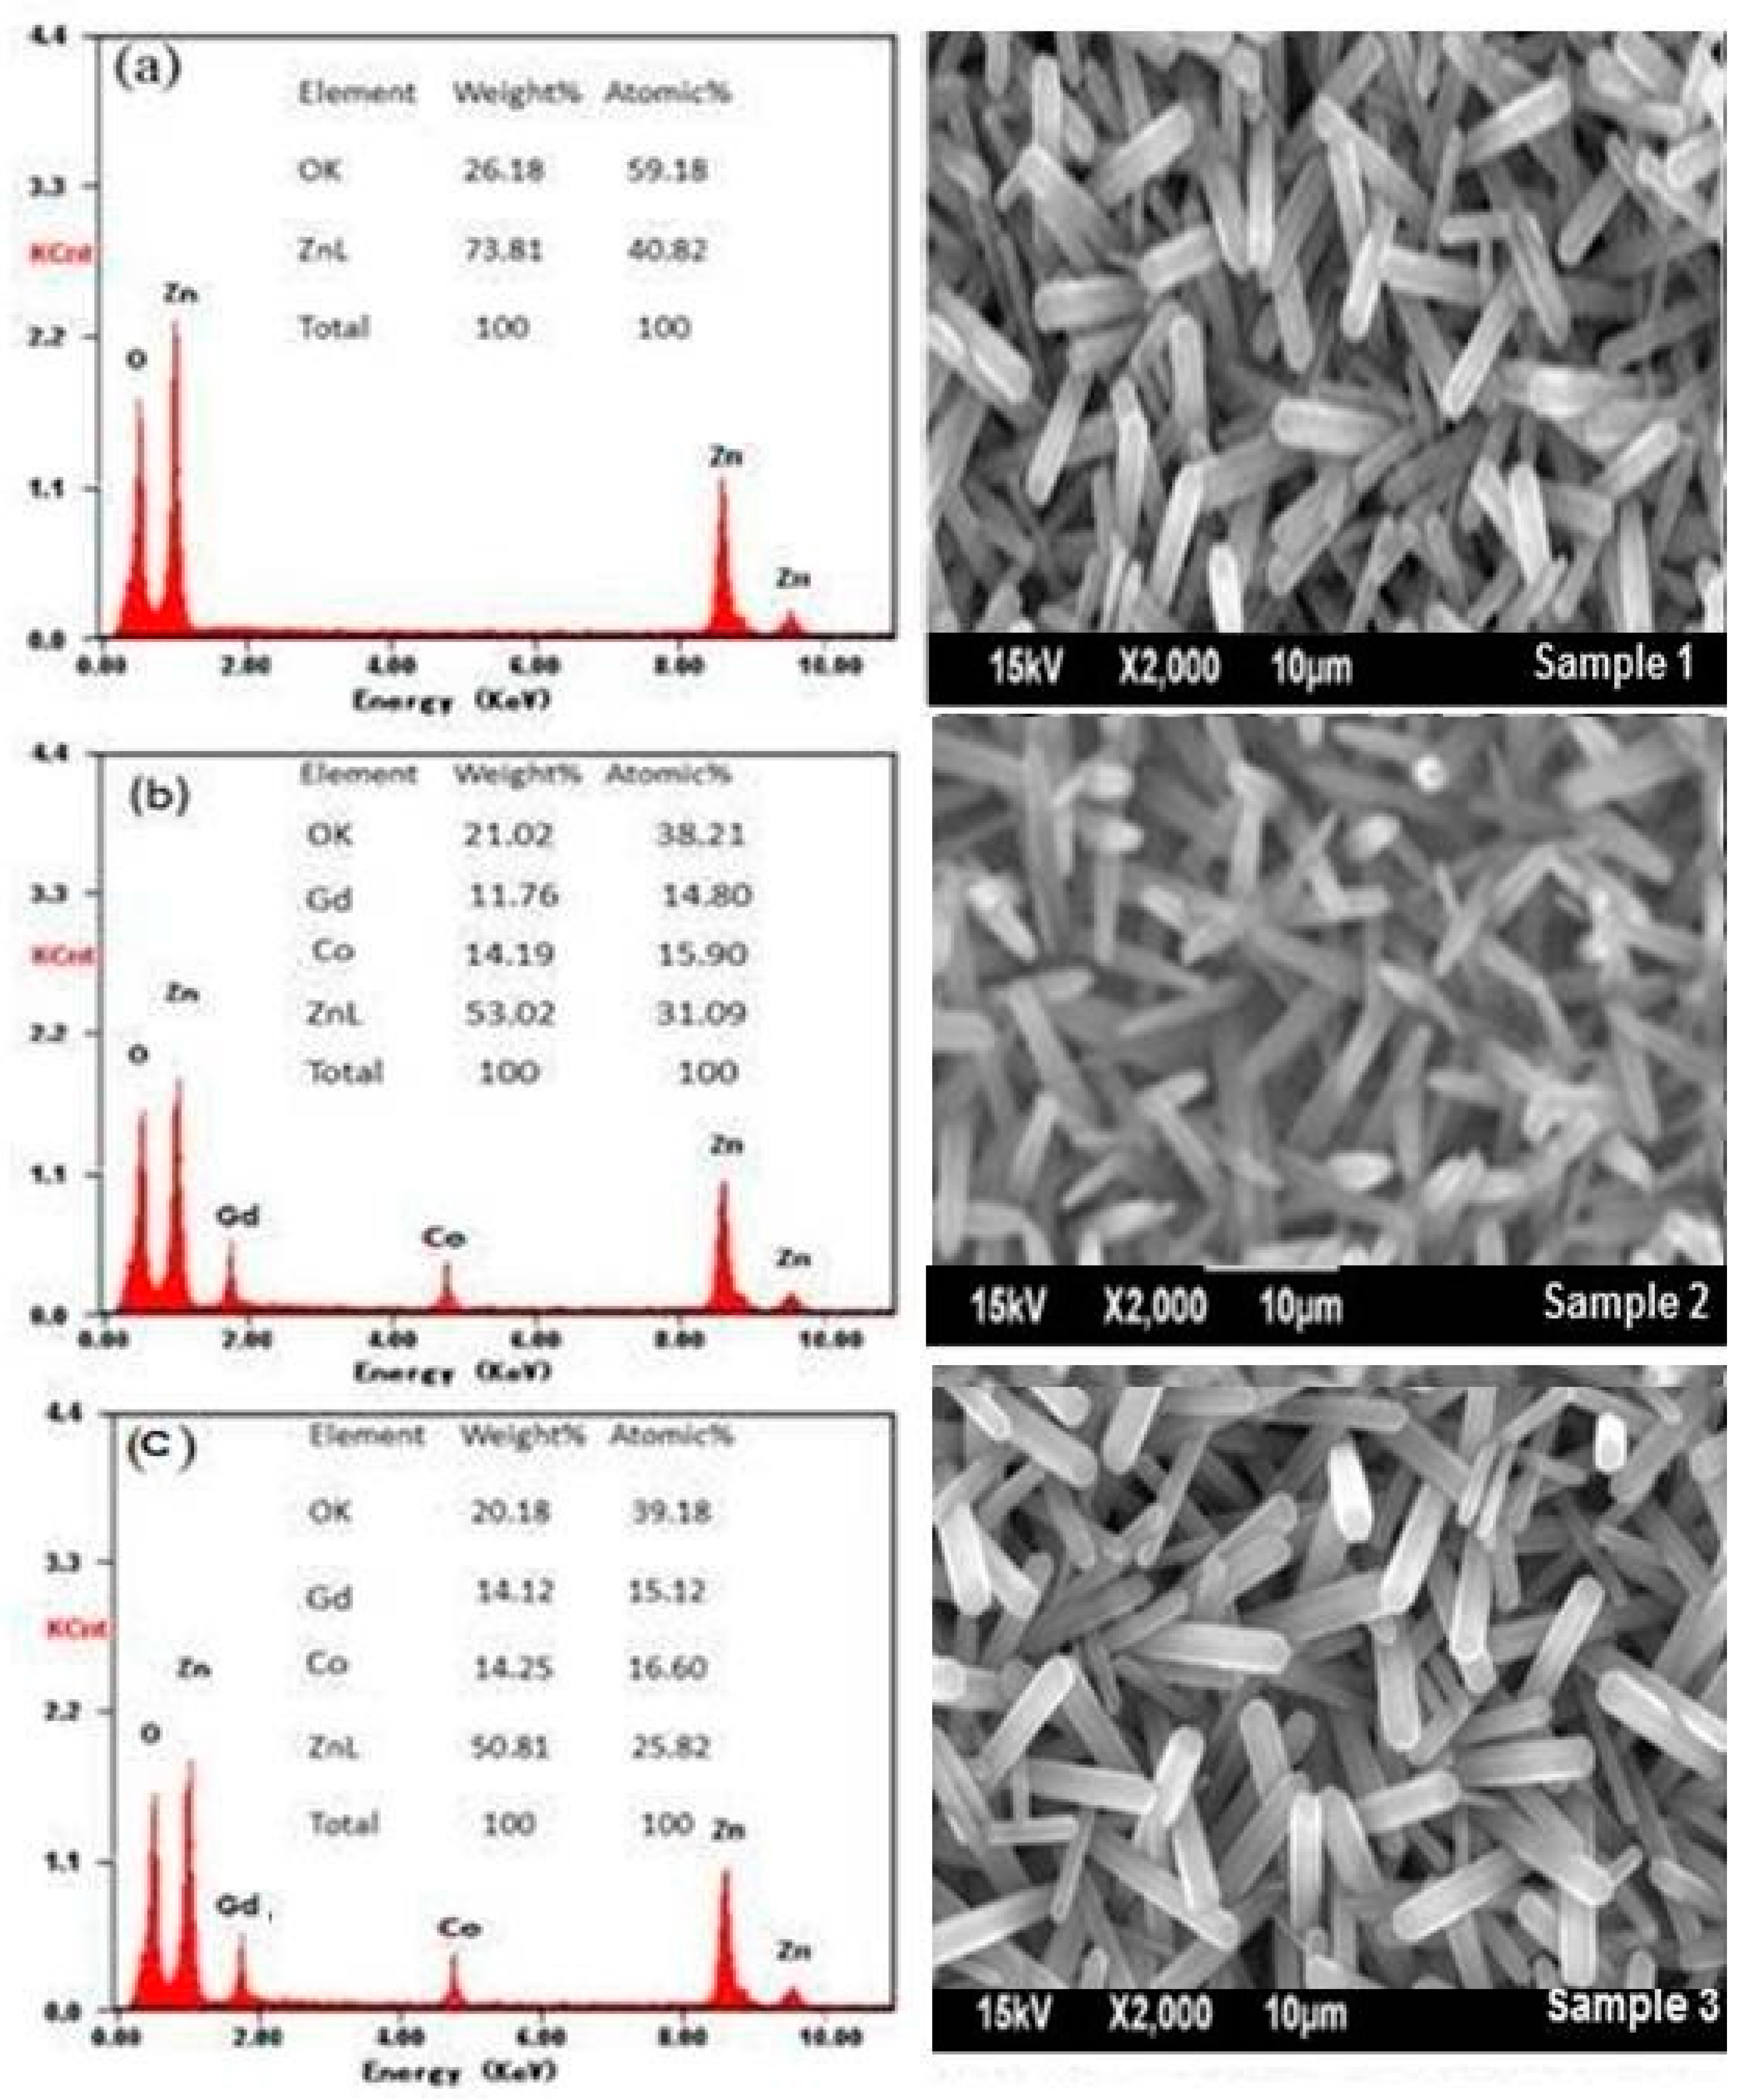
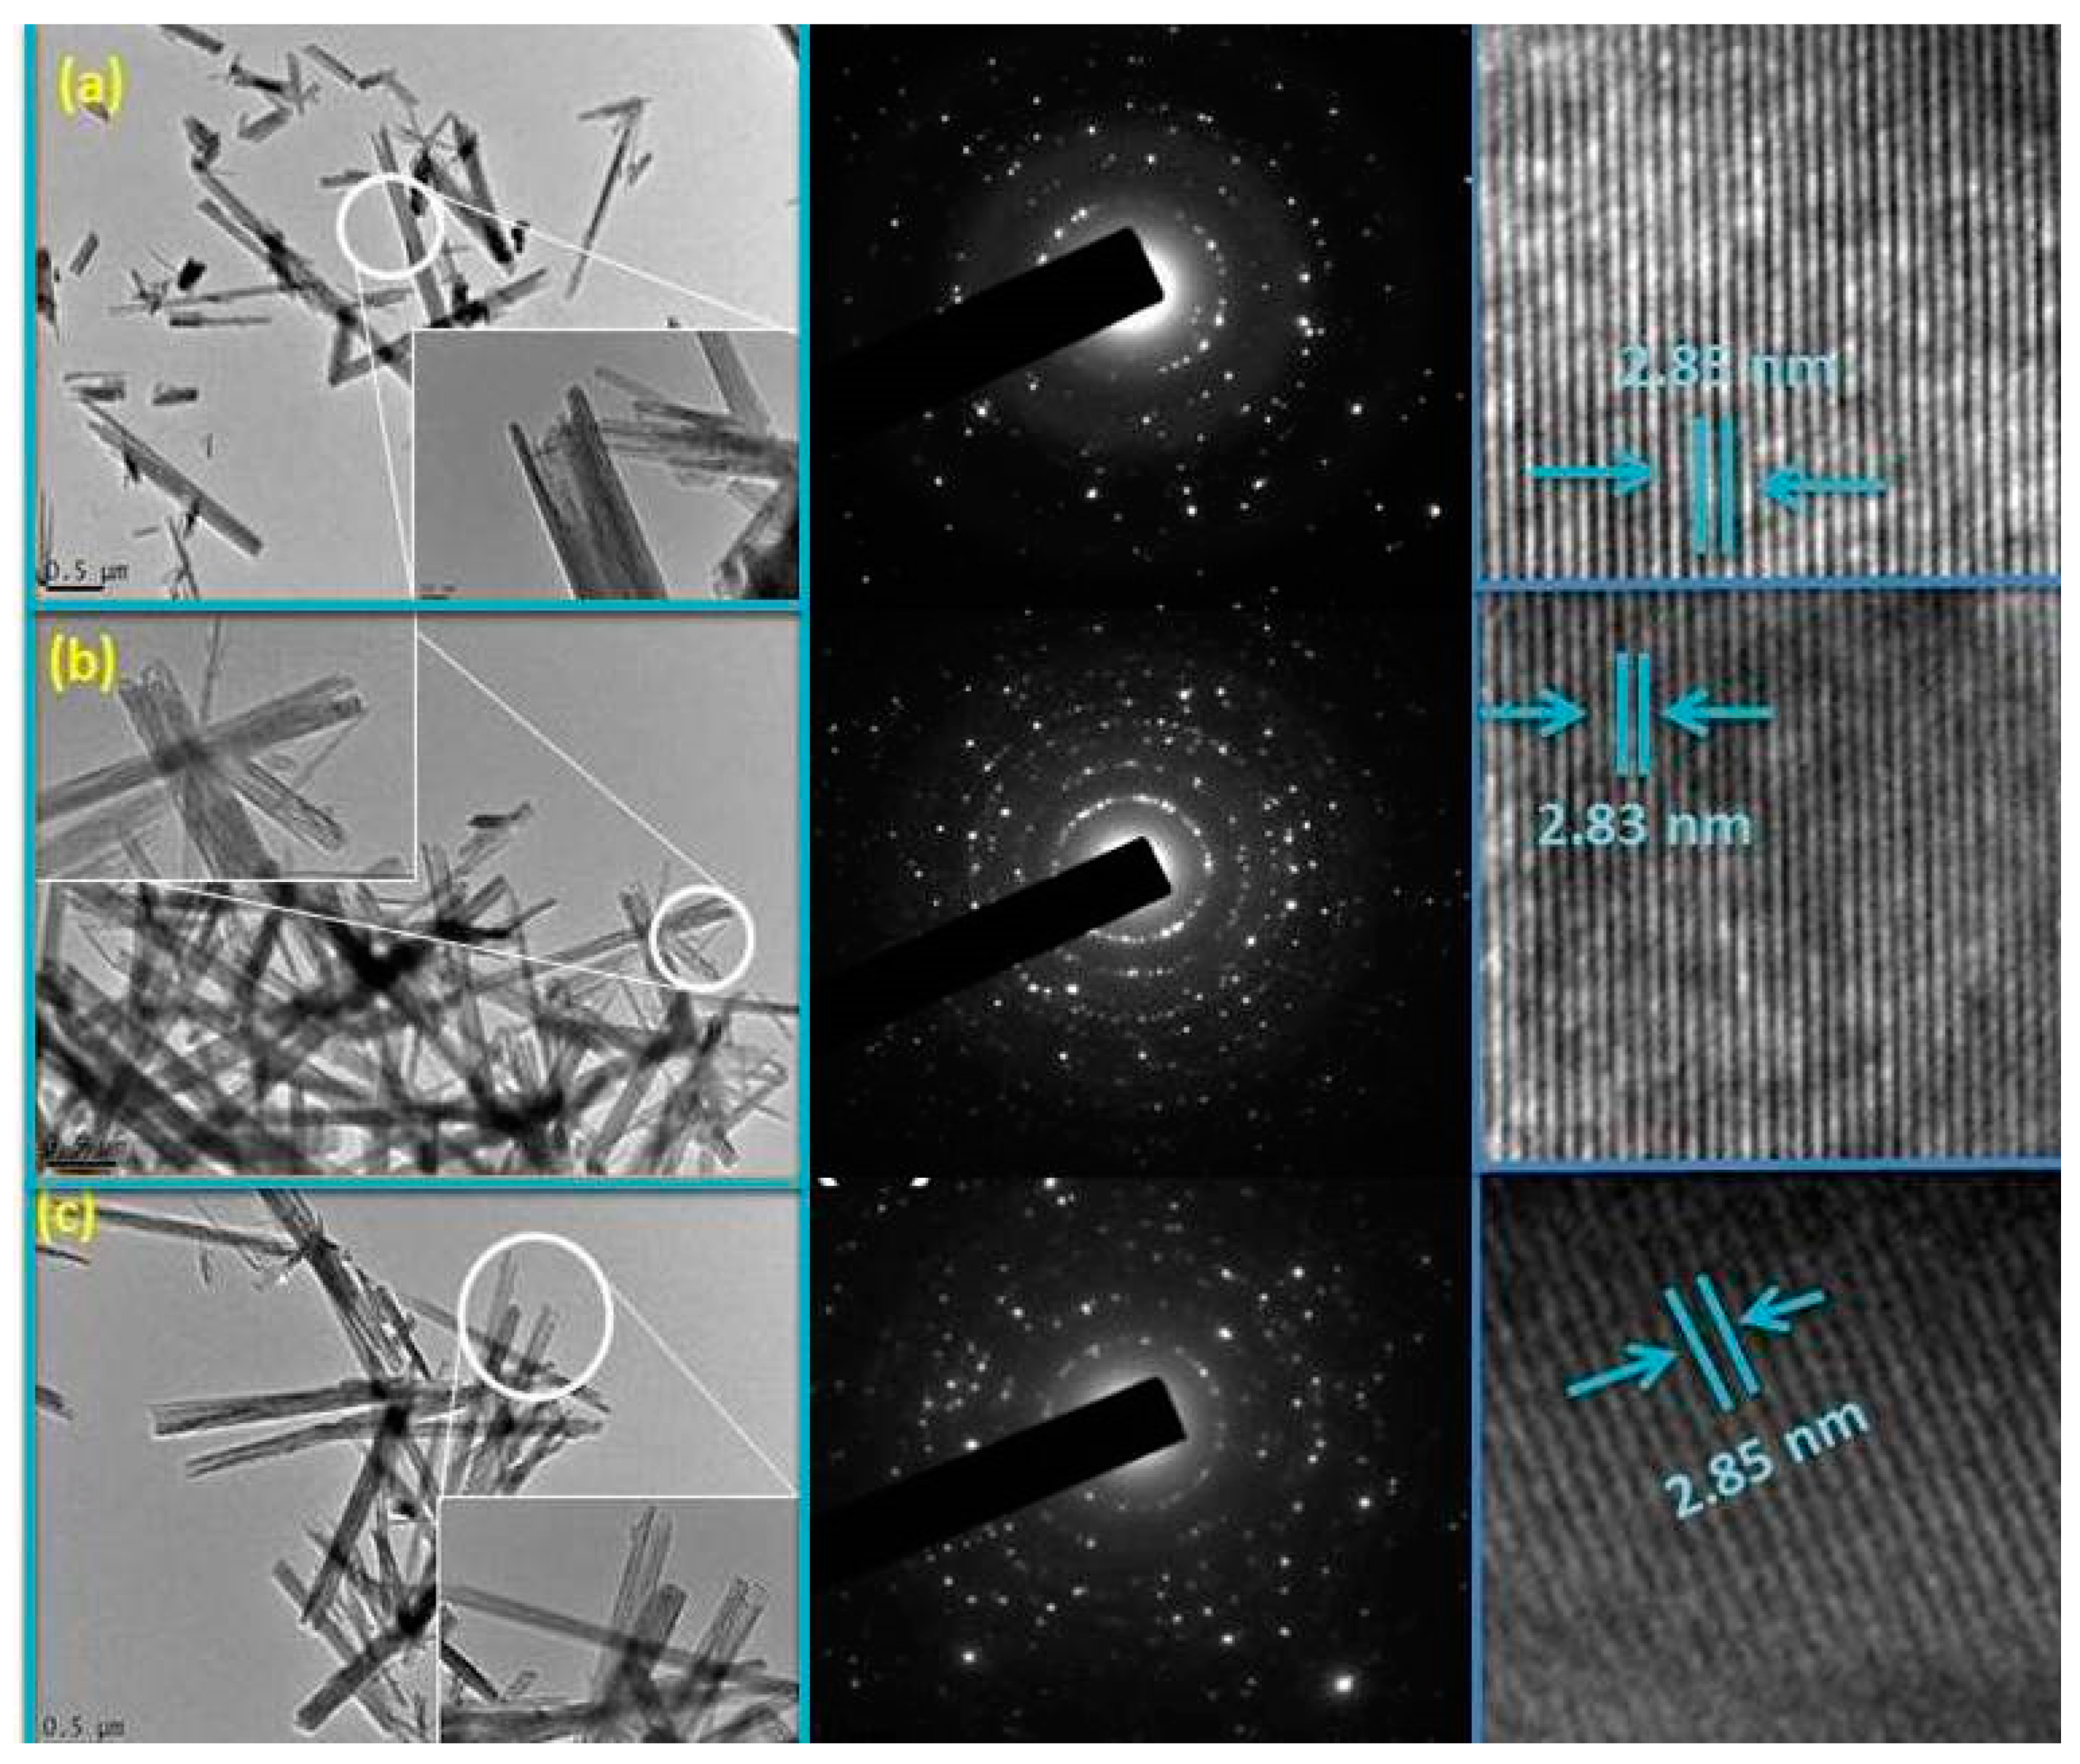
3.1. Structural Properties

Figure 2 shows the XRD results for ZnO, Zn0.96Co0.04O and Zn0.96−xCo0.04GdxO (x = 0, 0.01, 0.03, 0.04) nanotubes (NTs). All of the specimens crystallized with the hexagonal structure (wurtzite-type P63mc space group) and exhibited no evidence of impurities. All the Lattice constants of a = 3.244 Å, c = 5.186 for pure ZnO, Å, a = 3.243 Å, c = 5.190 Å for only Co doped ZnO sample, a = 3.241 Å, c = 5.189 for 1% Gd doped sample, a = 3.237 Å, c = 5.187 for 3% Gd doped sample and a = 3.235 Å, c = 5.178 Rietveld refinement software was used to obtain a weighted profile factor RWP= 9.34% for a 4% Gd doped sample, 9.27 and the goodness-of-fit χ2 = 2.571, 2.581) for the all as shown in Figure 2a,d. The unit cell volume (V) for pure ZnO is 47.19 Å3 and it is increased to V = 47.35 Å3 for Zn0.96Co0.04Gd0.04O specimen. For Zn0.93Co0.04Gd0.03O, the unit cell volume raised to V = 47.35Å3, which is more significant than pure and Zn0.96Gd0.04O. It is predicted since the ionic radius of Co2+ (0.65Å) and Gd3+ (94Å) are larger than that of Zn2+ (0.60 Å). The replacement of Zn2+ ions by Co2+ and Gd3+ ions in the structure of wurtzite explains this phenomenon. This is due to the fact that zinc ions are less electronegative and have smaller ionic radii than Co and Gd ions [1,24,26]. Also, the XRD findings are consistent with the theory that Co2+ and Gd3+ ions were added to the wurtzite structure, most likely in place of Zn ions. The geometry of the wurtzite unit cell changed as a result. According to the XRD patterns, Co (fixed) and Gd co-dopants in ZnO enhances in concentration, causing the peaks to shift at a smaller angle, as shown in schematic 2(b). Due to Gd and Co doping, it is advised that samples be changed to a disordered state.
For the purpose of using the Scherrer formula to evaluate the crystalline size of the samples, the XRD peaks broadening was used [29,32], and it was discovered that as the Co content rose from 0% to 4%, size shrank. This decline is explained by the limitation of grain expansion brought on by the appearance of Co and Gd in ZnO. This demonstrates that the high levels of Co both prevent grain formation and do not generate O2 vacancies to enable densification. Particle size is reduced in strongly doped specimens due to grain boundary segregation, though. The smaller ionic radius of Co (70 pm) ions contrasted to Zn (74 pm) ions is the source of the drop in lattice parameter with a greater Co concentration. The lattice parameters, X-ray density, unit cell volume and grain size calculations are summarized in Table 1.
The obtained compositions of Zn, O, Co, and Gd (in weight percent) are shown by the EDX spectra in Figure 3a–c. As was to be expected, the majority of the chemical elements in pure ZnO are composed of zinc and oxygen, however, specimens that have been co-doped with Co and Gd also show Co and Gd peaks. As illustrated in the Figure 3a–c, the amount required to produce the sample was found to be very near to the percent by weight of the doped TMs. Figure 3a–c exhibits the morphological and elemental examination of pure, 3 and 4 weight percent Gd and Co co-doped ZnO that was subjected to scanning electron microscopy examination. These findings suggest that the hexagonal wurtzite structure of the NTs has the same morphology [33]. The samples have a tube-like structure and become more aggregated as the Co and Gd concentration rises.
The transmission electron microscopy (TEM) images of ZnO, Zn0.93Co0.04Gd0.03O, and Zn0.92Co0.04Gd0.04O Nanotubes are demonstrated in Figure 4a–c. The transmission electron microscopy pictures of ZnO, Zn0.93Co0.04Gd0.03O, and Zn0.92Co0.04Gd0.04O Nanotubes showed a tube-like structure with a homogeneous dissemination. According to the transmission electron microscopy investigation, the mean tube size for pure ZnO is approximately 15 nm, 17 nm for Zn0.93Co0.04Gd0.03O, and 19 nm for Zn0.92Co0.04Gd0.04O. Co and Gd co-doping increases tube size, which is reliable with the X-rays Diffraction observations. The middle panels of Figure 3a–c show selected area electron diffraction (SEAD) pictures of the generated Nanotubes. The selected area electron diffraction image of the ZnO sample’s fringes reveals that ZnO formed into its polycrystalline tetragonal structure. Furthermore, it is significant to observe that the broad X-rays Diffraction peak of Co and Gd-doped ZnO indicates microscopic crystallite size and, thus, a substantial surface area. The transmission electron microscopy micrograph makes it clear that Co-Gd co-doped ZnO has a larger size than pure ZnO, which suggests that it has a larger surface area. For improved photo degradation efficiency, the sample needs to have a bigger surface area.

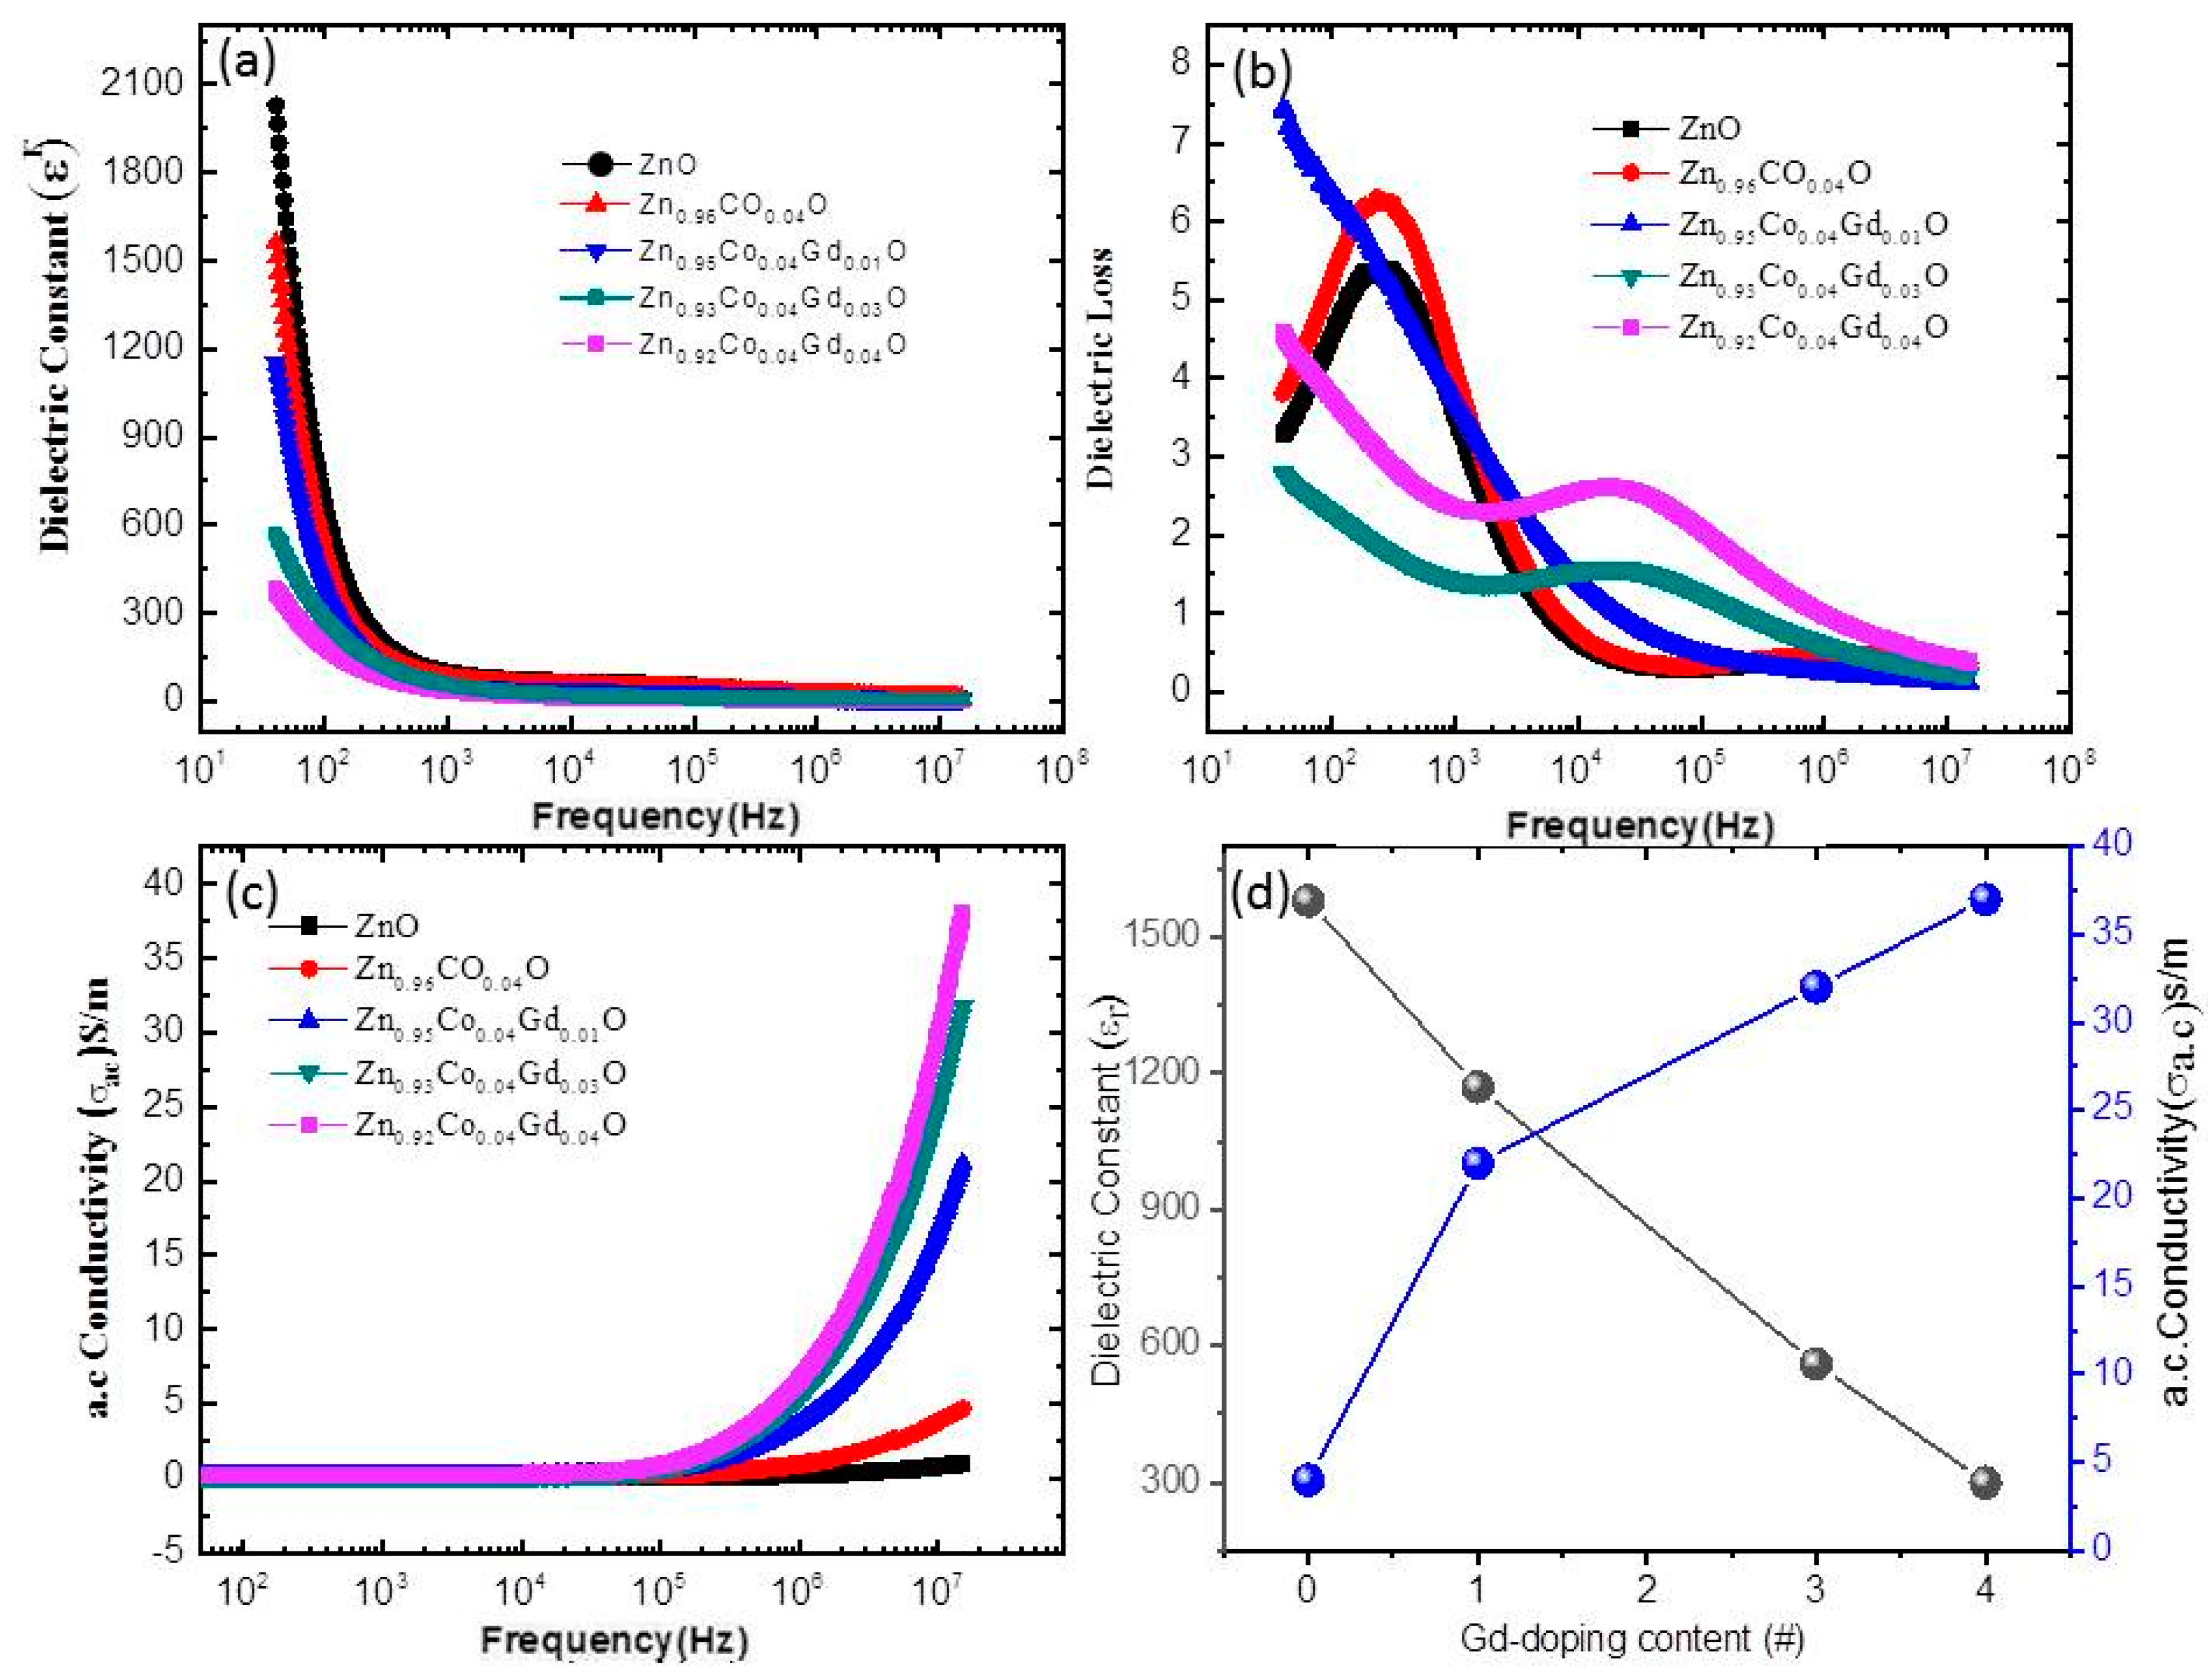
3.2. Dielectric Properties

3.2.1. Dielectric Constant

For all of the samples that were annealed at 400 °C, Figure 5a displays the frequency (f) dependency of the dielectric constant (εr). The samples were created by using a presser to form them into round pellets with an 8mm diameter, and then their dielectric loss, capacitance and a.c conductivity was calculated. The capacitance was calculated using gold glue electrodes in accordance with the methodology described in Refs. [3,34]. The following relationship (1) was utilized to evaluate the εr
ε r = C d ε 0 A  
where C denotes capacitance, d denotes cylinder height, and A denotes pellet cross-sectional area. At frequencies over 1.5 × 10⁴ Hz, all samples εr values decline equally with rising f and remain constant. Large values of reported dielectric constants are often induced by either space charge polarization (SCP) or rotation dielectric polarization. These two types of polarization can be distinguished by their respective abbreviations: SCP and RDP. The interfacial area contains oxygen vacancies (OVS), which can be ionized to generate single or double ionized vacancies, vacancy clusters, dangling bonds, and other defects [31,32].
Because of the existence of positive and negative vacancies, a significant quantity of dipole moments (which are randomly oriented) will be produced, and only polarization may be caused by an external magnetic field in these dipole moments to cause RDP. Furthermore, space charge moving in the alternative direction of the electric fields will be entangled by interfacial defects in these nanocrystalline materials [35,36] As a result, SCP and dielectric constant are increased. As a result, grain boundaries become electrically active. The observed decrease in εr as (f) increases can be attributed to the fact that any species that helps to increase polarizability will always be behind the applied field. When particles get smaller, the interfacial area increases, which rises RDP and SCP, but Co co-doping improves the OVS, which raises RDP and SCP. As a result, both crystalline size and doping concentration have an effect on dielectric properties. As the concentration of Gd co-doping increases, the εr increases, as illustrated in Figure 5a,d, due to lattice distortion caused by small-sized Co2+ ions replacing Zn2+ ions, as originally observed [28].

3.2.2. Dielectric Loss

The variations in dielectric loss (ε″) with the (f) of doped and co-doped ZnO nanoparticles are shown in schematic 5(b). It is shown here that increasing the frequency causes ε″ to drop. All of the specimens behaved similarly, with dispersal at low(f) and independent at high (f). Ionic migration is responsible for the drop in ε″ noticed at higher frequencies. Ionic hopping and charge transfer conduction losses also contribute to the (ε″) at low and intermediate frequencies (fs). Ionic polarization losses can play a part to these phenomena. Ion vibrations, however, might be the only cause at high (fs).

3.2.3. Electrical Conductivity

Figure 5c illustrates the (f) AC conductivity (αa.c), AC, of (Co, Gd) co-doped ZnO samples. The σac rises with (f) for each voltage, and these results are consistent from earlier observations [37]. Hence, at low frequencies, σac grows gradually as f increases, whereas conductivity rises dramatically at higher frequencies. The hopping idea is responsible for this behavior; for f-dependent σac, charge carriers must hop while being transported, yet at low frequency, the σac remains constant despite traveling over infinite paths. σac follows the relationship shown below for all specimens.
                                                                    α a c = ε 0 ε ω                                                                                                                                                                              
where αa.c is the alternating current electrical conductivity, ε″ is the imaginary, εr is the dielectric constant of free space, which is a component of the dielectric constant, and ω = 2πf is the frequency. f is the frequency. Equation (2) shows that αa.c is only affected by the ε″. As a result, as f increases, the ε″ lowers but αa.c increases. This conclusion is reliable with prior discoveries, It demonstrated that αa.c increases as (f) increases because of the series resistance effect [38]. To explain this phenomenon, two theories have been proposed: (1) electric energy associated to the high (f) area encouraging charge carrier hopping, and (2) higher dielectric relaxation of ZnO Nanotubes polarization in the high (f) zone. Co-doped ZnO nanopowder is thus an excellent material for high-energy storage devices. Furthermore, the enhanced σac discovered may be beneficial for industrial gas sensing applications because to higher electron transmission [39,40]. The phase diagram of the dielectric constant and conductivity vs doping was shown in Figure 5d. It demonstrated that doping promotes dielectric behavior and conductivity (as seen in Figure 4c,d) because the inclusion of impurity ions increases the quantity of free electrons, which aids in conduction.

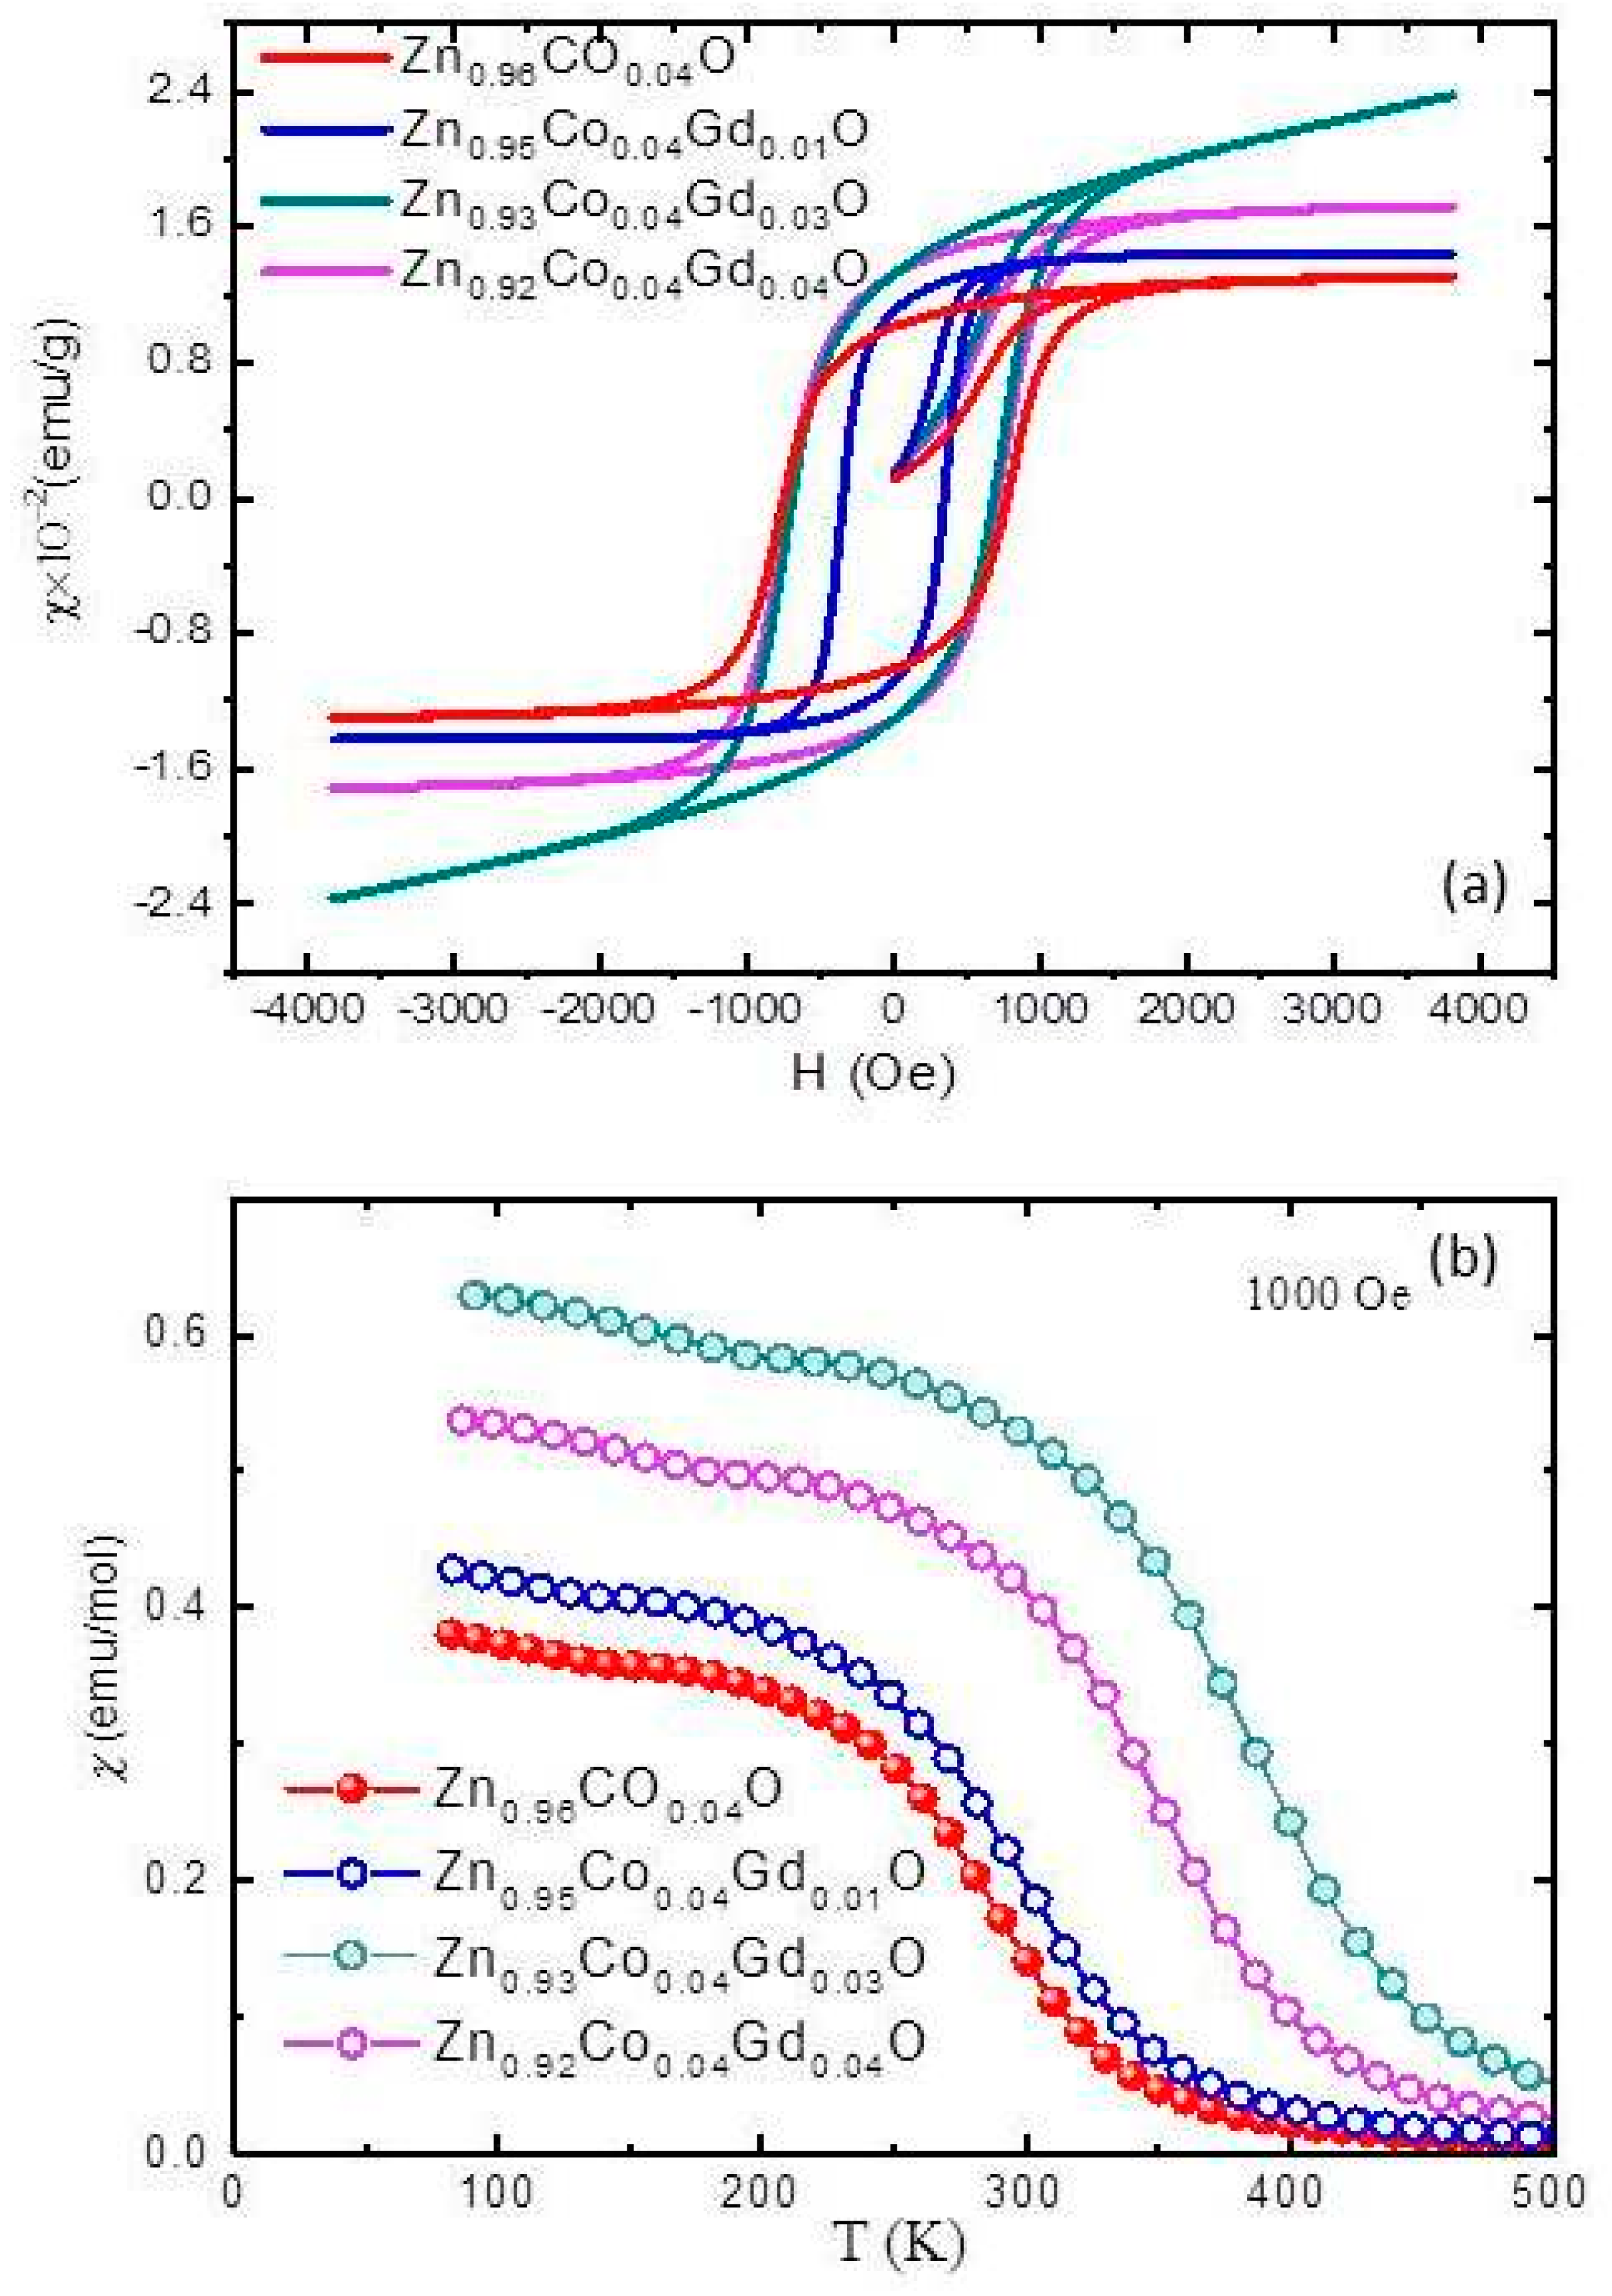
3.3. Magnetic Properties

Figure 6a displays the magnetic hysteresis (M-H) loops of (Co, Gd) co-doped ZnO NTs observed at ambient temperature (a). At 300 K, the M-H loop in pure ZnO exhibits diamagnetism, whereas samples of Zn0.96Co0.04O and Zn0.96−xCo0.04GdxO (Co = 0, 0.01, 0.03, 0.04) show a ferromagnetic (FM) reaction that is clearly visible. Remanent magnetization (Mr) values are 0.0093 emu/g, 0.014 emu/g, 0.0165 emu/g, and 0.0163 emu/g for Zn0.96−xCo0.04GdxO (Co = 0, 0.01, 0.03, and 0.04) samples, respectively, according to Figure 6a,b. Table 2 contains the saturation magnetization values, which are 1.02, 1.23, 2.47, and 1.64 (10−2 emu/g). The Table displays that the Zn0.92Co0.04Gd0.04O sample’s Mr value is higher than that of the literature [24]. Figure 6a shows the change from the paramagnetic to the FM states. Ms readings for specimens of Zn0.96−xCo0.04GdxO (Co = 0.03) are higher than those for pure ZnO. When O2 annealing raises the quantity of Co and Gd ions doped into the host lattice, the number of defects increases. The room temperature ferromagnetism in the specimen with 1% Co co-doped might be attributed to both intrinsic and external magnetic sources. In contrast to extrinsic sources, intrinsic sources require the creation of groups of transition elements or secondary phases.
The schematic 6(b) shows magnetization vs temperature charts in a 103 Oe magnetic field to further clarify the magnetic behavior. According to these findings, FM behavior is enhanced in samples of Zn0.96−xCo0.04GdxO (Co = 0.03) compared to pure Gd or specimens with higher Co co-doping. It was discovered [39,40] that the earliest stages of FM in TM-ZnO were generated by the interaction of TM ions and bound polarons, which resulted in the creation of bound magnetic polarons. Experiments on defect-bound transporters for point defect hybridization are helpful in the process of developing RTFM in doped ZnO through the use of TM-doping. We demonstrate how O2 annealing can make the process of replacing Gd and Co in the ZnO lattice more successful. The production of O2 vacancies during annealing to maintain charge balance is what causes room temperature ferromagnetism in Zn0.96−xCo0.04GdxO Nanotubes. This is accomplished by doping Gd3+ and Co2+ for Zn2+ and O2. The method of preparing the specimens introduced these intriguing new phenomena.
The lower 350 K Tc is discernible in the χ(T) Co = 0.03 as shown in Figure 6c. It is possible that the structural features of the Co co-doped ZnO samples are attributable to the observed reduction in the magnetic moment for Co with higher dependency on the ZnO sample. The alterations in cell characteristics demonstrate that as cobalt content rises, lattice constants rise as well, leading to an increase in unit cell volume. Because of the increased volume of the unit cell, the cobalt ions that are closest to one another in the ZnO matrix are now further apart. This causes antiferromagnetic super-exchange interactions between the neighboring Co ions, which raises the magnetic moment. Between 2 and 300 K, temperature has an impact on the inverse magnetic susceptibility of nanoparticles. The inverse susceptibility is found to decrease linearly until 380 K, at which point it deviates from the Curie-Weiss line. As shown in Equation (3) below, the modified Curie-Weiss equation provides a close approximation of the susceptibility of the nanoparticles that were utilized in the course of our research.
χ T = χ 0 + 1 8 μ e f f 2   x T θ c  
where χ0 demonstrates the temperature-independent susceptibility, C the Curie constant and θC is the Curie–Weiss temperature, x is the concentration of Co ions and μeff is the effective moment. The calculated Curie–Weiss law parameters i.e., effective moment μeff = 2.45 μB and θ = −25 K. The effective moment values, which range from 2.46 to 2.49 μB., provide insight into the substitute integral j, an evaluation of the degree to which the magnetic ions interact with one another, but the results for the substituted Zn0.96−xCo0.04GdxO samples (x = 0.0, 0.1, 0.3, and 0.4) drop as the concentration of Co co-doped increases in the sample. The fact that has negative values suggests that the magnetic dopants only have a weak antiferromagnetic interaction with one another [41,42]. The values for most other oxide compounds range from 24 to 27 K, which is nearly as low as the value for Co-doped ZnO. Magnetic characteristics discovered at low temperatures may be the outcome of manufacturing defects or the presence of impurity phases. Further research is needed to clarify this point.

4. Conclusions

This work effectively produced ZnO and ferromagnetic (Co, Gd) co-doped ZnO NTs. All of the (Co, Gd) co-doped samples had a tetragonal structure, according to XRD observations. The dielectric loss, dielectric constant and electrical conductivity rise when the concentration of either (f) or Gd dopant increases. Electrical conductivity was noticed to be increased in annealed Co and Gd-doped ZnO samples. This happened when Zn ions were substituted for Co and Gd ions, which boosted the number of charge carriers available. When ZnO was co-doped with (Co, Gd), the switch from diamagnetic to ferromagnetic caused a significant modification in the hysteresis loop. The increased O2 vacancies and zinc interstitials are substantially related to the improved magnetic and dielectric responses of the samples. According to our research, ferromagnetism in ZnO Nanotubes can be generated via adding Co fixed and limiting Gd and annealing the material at 400 °C. The magnetic analysis has showed that the magnetic behavior of the as prepared ZnO:Co, Gd samples is dominated by a paramagnetic component over ferromagnetic component, which is an indicative of dominant uncoupled Co spins. As a result, it is thought that raising the ion concentrations to improve direct ion coupling may destabilise the polarons structure, weakening the irreversible magnetic behaviour.

Author Contributions

This paper was written collaboratively by M.A.M., R.K., S.A.O., K.A., S.S.A., N.R., M.S., S.I. and R.K., created the idea and submitted the paper. All authors have read and agreed to the published version of the manuscript.

Funding

The authors acknowledge the financial support from Taif University for sponsorship and support. We also acknowledge the support and guidance provided by Taif University.

Data Availability Statement

The datasets generated during and/or analyzed during the current study are available from the corresponding author on reasonable request. Also, the manuscript experimental work and wording is original. No part of the was manuscript found plagiarized. If the reviewer further needs the proof, then we will send the plagiarized proof.

Conflicts of Interest

The authors declare that they have no known competing financial interest or personal relationship that could have influenced the work reported in this paper.

References

  1. Hao, Y.; Lou, S.; Zhou, S.; Wang, Y.; Chen, X.; Zhu, G.; Yuan, R.; Li, N. Novel magnetic behavior of Mn-doped ZnO hierarchical hollow spheres. J. Nanoparticle Res. 2012, 14, 659. [Google Scholar] [CrossRef]
  2. Prinz, G.A. Magnetoelectronics. Science 1998, 282, 1660–1663. [Google Scholar] [CrossRef] [PubMed]
  3. Khan, R.; Althubeiti, K.; Zulfiqar Afzal, A.M.; Rahman, N.; Fashu, S.; Zhang, W.; Khan, A.; Zheng, R. Structure and magnetic properties of (Co, Ce) co-doped ZnO-based diluted magnetic semiconductor nanoparticles. J. Mater. Sci. Mater. Electron. 2021, 32, 24394–24400. [Google Scholar] [CrossRef]
  4. Li, P.; Wang, S.; Li, J.; Wei, Y. Structural and optical properties of Co-doped ZnO nanocrystallites prepared by a one-step solution route. J. Lumin. 2012, 132, 220–225. [Google Scholar] [CrossRef]
  5. Khan, R.; Tirth, V.; Ali, A.; Irshad, K.; Rahman, N.; Algahtani, A.; Sohail, M.; Isalm, S. Effect of Sn-doping on the structural, optical, dielectric and magnetic properties of ZnO nanoparticles for spintronics applications. J. Mater. Sci. Mater. Electron. 2021, 32, 21631–21642. [Google Scholar] [CrossRef]
  6. Wang, X.; Zhu, L.; Zhang, L.; Jiang, J.; Yang, Z.; Ye, Z.; He, B. Properties of Ni doped and Ni–Ga co-doped ZnO thin films prepared by pulsed laser deposition. J. Alloy. Compd. 2011, 509, 3282–3285. [Google Scholar] [CrossRef]
  7. Hao, Y.-M.; Lou, S.-Y.; Zhou, S.-M.; Yuan, R.-J.; Zhu, G.-Y.; Li, N. Structural, optical, and magnetic studies of manganese-doped zinc oxide hierarchical microspheres by self-assembly of nanoparticles. Nanoscale Res. Lett. 2012, 7, 100. [Google Scholar] [CrossRef] [Green Version]
  8. Stroppa, A.; Duan, X.; Peressi, M. Structural and magnetic properties of Mn-doped GaAs (1 1 0) surface. Mater. Sci. Eng. B 2006, 126, 217–221. [Google Scholar] [CrossRef] [Green Version]
  9. Das, T.K.; Poater, A. Review on the use of heavy metal deposits from water treatment waste towards catalytic chemical syntheses. Int. J. Mol. Sci. 2021, 22, 13383. [Google Scholar] [CrossRef]
  10. Das, T.K.; Das, N.C. Preparation of 1D, 2D, and 3D nanomaterials for water treatment. In Nano-Enabled Technologies for Water Remediation; Elsevier: Amsterdam, The Netherlands, 2022; pp. 1–22. [Google Scholar]
  11. Fu, J.; Ren, X.; Yan, S.; Gong, Y.; Tan, Y.; Liang, K.; Du, R.; Xing, X.; Mo, G.; Chen, Z.; et al. Synthesis and structural characterization of ZnO doped with Co. J. Alloys Compd. 2013, 558, 212–221. [Google Scholar] [CrossRef]
  12. Xu, X.; Cao, C. Structure and ferromagnetic properties of Co-doped ZnO powders. J. Magn. Magn. Mater. 2009, 321, 2216–2219. [Google Scholar] [CrossRef]
  13. Szwacki, N.G.; Majewski, J.; Dietl, T. Aggregation and magnetism of Cr, Mn, and Fe cations in GaN. Phys. Rev. B 2011, 83, 184417. [Google Scholar]
  14. Lu, Z.; Hsu, H.-S.; Tzeng, Y.; Huang, J.-C. Carrier-mediated ferromagnetism in single crystalline (Co, Ga)-codoped ZnO films. Appl. Phys. Lett. 2009, 94, 152507. [Google Scholar] [CrossRef]
  15. Sun, L.; Yan, F.; Zhang, H.; Wang, J.; Wang, G.; Zeng, Y.; Li, J. Room-temperature ferromagnetism and in-plane magnetic anisotropy characteristics of nonpolar GaN: Mn films. Appl. Surf. Sci. 2009, 255, 7451–7454. [Google Scholar] [CrossRef]
  16. Husnain, G.; Tao, F.; Yao, S.-D. Structural and magnetic properties of Co+ implanted n-GaN dilute magnetic semiconductors. Phys. B Condens. Matter 2010, 405, 2340–2343. [Google Scholar] [CrossRef]
  17. Cui, Z.; Wu, H.; Bai, K.; Chen, X.; Li, E.; Shen, Y.; Wang, M. Fabrication of a g-C3N4/MoS2 photocatalyst for enhanced RhB degradation. Phys. E Low-Dimens. Syst. Nanostructures 2022, 144, 115361. [Google Scholar] [CrossRef]
  18. Cui, Z.; Yang, K.; Ren, K.; Zhang, S.; Wang, L. Adsorption of metal atoms on MoSi2N4 monolayer: A first principles study. Mater. Sci. Semicond. Process. 2022, 152, 107072. [Google Scholar] [CrossRef]
  19. Cui, Z.; Zhang, S.; Wang, L.; Yang, K. Optoelectronic and magnetic properties of transition metals adsorbed Pd2Se3 monolayer. Micro Nanostructures 2022, 167, 207260. [Google Scholar] [CrossRef]
  20. Zhang, L.; Cui, Z. Electronic, Magnetic, and Optical Performances of Non-Metals Doped Silicon Carbide. Front. Chem. 2022, 10, 898174. [Google Scholar] [CrossRef]
  21. Fabbiyola, S.; Kennedy, L.J.; Aruldoss, U.; Bououdina, M.; Dakhel, A.; JudithVijaya, J. Synthesis of Co-doped ZnO nanoparticles via co-precipitation: Structural, optical and magnetic properties. Powder Technol. 2015, 286, 757–765. [Google Scholar] [CrossRef]
  22. Hao, H.; Qin, M.; Li, P. Structural, optical, and magnetic properties of Co-doped ZnO nanorods fabricated by a facile solution route. J. Alloys Compd. 2012, 515, 143–148. [Google Scholar] [CrossRef]
  23. Oshio, T.; Masuko, K.; Ashida, A.; Yoshimura, T.; Fujimura, N. Effect of Mn doping on the electric and dielectric properties of ZnO epitaxial films. J. Appl. Phys. 2008, 103, 093717. [Google Scholar] [CrossRef]
  24. Khan, R.; Rahman, M.-U.; Fashu, S. Effect of annealing temperature on the dielectric and magnetic response of (Co, Zn) co-doped SnO2 nanoparticles. J. Mater. Sci. Mater. Electron. 2017, 28, 2673–2679. [Google Scholar] [CrossRef]
  25. Liu, C.; Meng, D.; Pang, H.; Wu, X.; Xie, J.; Yu, X.; Chen, L.; Liu, X. Influence of Fe-doping on the structural, optical and magnetic properties of ZnO nanoparticles. J. Magn. Magn. Mater. 2012, 324, 3356–3360. [Google Scholar] [CrossRef]
  26. Saleh, R.; Prakoso, S.P.; Fishli, A. The influence of Fe doping on the structural, magnetic and optical properties of nanocrystalline ZnO particles. J. Magn. Magn. Mater. 2012, 324, 665–670. [Google Scholar] [CrossRef]
  27. Khan, R.; Zaman, Y. Effect of annealing on structural, dielectric, transport and magnetic properties of (Zn, Co) co-doped SnO2 nanoparticles. J. Mater. Sci. Mater. Electron. 2016, 27, 4003–4010. [Google Scholar] [CrossRef]
  28. Khan, R.; Fashu, S.; Rahman, M.-U. Effects of Ni co-doping concentrations on dielectric and magnetic properties of (Co, Ni) co-doped SnO2 nanoparticles. J. Mater. Sci. Mater. Electron. 2016, 27, 7725–7730. [Google Scholar] [CrossRef]
  29. Khan, R.; Fashu, S. Effect of annealing on Ni-doped ZnO nanoparticles synthesized by the co-precipitation method. J. Mater. Sci. Mater. Electron. 2017, 28, 10122–10130. [Google Scholar] [CrossRef]
  30. Cong, C.; Liao, L.; Liu, Q.Y.; Li, J.C.; Zhang, K.L. Effects of temperature on the ferromagnetism of Mn-doped ZnO nanoparticles and Mn-related Raman vibration. Nanotechnology 2006, 17, 1520. [Google Scholar] [CrossRef]
  31. Khan, R.; Fashu, S.; Zaman, Y. Magnetic and dielectric properties of (Co, Zn) co-doped SnO2 diluted magnetic semiconducting nanoparticles. J. Mater. Sci. Mater. Electron. 2016, 27, 5960–5966. [Google Scholar] [CrossRef]
  32. Khan, R.; Zulfiqar; Fashu, S.; Rehman, Z.U.; Khan, A.; Rahman, M.U. Structure and magnetic properties of (Co, Mn) co-doped ZnO diluted magnetic semiconductor nanoparticles. J. Mater. Sci. Mater. Electron. 2018, 29, 32–37. [Google Scholar]
  33. Lv, X.; Zhang, N.; Ma, Y.; Zhang, X.-X.; Wu, J. Coupling effects of the A-site ions on high-performance potassium sodium niobate ceramics. J. Mater. Sci. Technol. 2022, 130, 198–207. [Google Scholar] [CrossRef]
  34. Khan, R.; Zulfiqar; Rahman, M.-U.; Rehman, Z.-U.; Fashu, S. Effect of air annealing on the structure, dielectric and magnetic properties of (Co, Ni) co-doped SnO2 nanoparticles. J. Mater. Sci. Mater. Electron. 2016, 27, 10532–10540. [Google Scholar] [CrossRef]
  35. Szu, S.-P.; Lin, C.-Y. AC impedance studies of copper doped silica glass. Mater. Chem. Phys. 2003, 82, 295–300. [Google Scholar] [CrossRef]
  36. Gu, F.; Wang, S.F.; Lv, M.K.; Zhou, G.J.; Xu, D.; Yuan, D.R. Photoluminescence properties of SnO2 nanoparticles synthesized by sol−gel method. J. Phys. Chem. B 2004, 108, 8119–8123. [Google Scholar] [CrossRef]
  37. Pakma, O.; Serin, N.; Serin, T.; Altındal, Ş. Influence of frequency and bias voltage on dielectric properties and electrical conductivity of Al/TiO2/p-Si/p+ (MOS) structures. J. Phys. D Appl. Phys. 2008, 41, 215103. [Google Scholar] [CrossRef]
  38. Elilarassi, R.; Chandrasekaran, G. Synthesis and characterization of ball milled Fe-doped ZnO diluted magnetic semiconductor. Optoelectron. Lett. 2012, 8, 109–112. [Google Scholar] [CrossRef]
  39. Lin, Y.; Jiang, D.; Lin, F.; Shi, W.; Ma, X. Fe-doped ZnO magnetic semiconductor by mechanical alloying. J. Alloys Compd. 2007, 436, 30–33. [Google Scholar] [CrossRef]
  40. Yin, S.; Xu, M.X.; Yang, L.; Liu, J.F.; Rösner, H.; Hahn, H.; Gleiter, H.; Schild, D.; Doyle, S.; Liu, T.; et al. Absence of ferromagnetism in bulk polycrystalline Zn0.9Co0.1O. Phys. Rev. B 2006, 73, 224408. [Google Scholar] [CrossRef] [Green Version]
  41. Fukumura, T.; Jin, Z.; Kawasaki, M.; Shono, T.; Hasegawa, T.; Koshihara, S.; Koinuma, H. Magnetic properties of Mn-doped ZnO. Appl. Phys. Lett. 2001, 78, 958–960. [Google Scholar] [CrossRef]
  42. Yang, L.; Wu, X.L.; Huang, G.S.; Qiu, T.; Yang, Y.M. In situ synthesis of Mn-doped ZnO multileg nanostructures and Mn-related Raman vibration. J. Appl. Phys. 2005, 97, 014308. [Google Scholar] [CrossRef]
Figure 1. Co-precipitation method used in this work.
Crystals 13 00984 g001
Figure 2. (ad) The ZnO Rietveld refinement and Zn0.96Co0.04O and Zn0.96−xCo0.04GdxO (Gd = 0, 0.01, 0.03). (e) XRD for all the samples, (f) Lattice parameters versus Gd doping determined from single doped XRDs & Zn0.96−xCo0.04GdxO (Co = 0, 0.01, 0.03, 0.04) specimens.
Crystals 13 00984 g002
Figure 3. EDX pictures of (a) ZnO, (b) Zn0.93Co0.04Gd0.03O, (c) Zn0.92Co0.04Gd0.04O along with the associated SEM pictures.
Crystals 13 00984 g003
Figure 4. TEM images of (a) ZnO, (b) Zn0.93Co0.04Gd0.03O, (c) Zn0.92Co0.04Gd0.04O, their corresponding SEAD images (med panels) and HRTEM micrographs.
Crystals 13 00984 g004
Figure 5. (a) Variation of εr versus (f) (b) the f dependence of ε″ curves, (c) the variation of αa.c. with f curves and (d) Phase diagram of dielectric constant and conductivity of pure and Gd doped ZnO and (Co (fixed), Gd)-ZnO co-doped with 4% Gd and Co = 1, 3 and 4%.
Crystals 13 00984 g005
Figure 6. (a) The (Gd, Co) co-doped ZnO NTs’ magnetic hysteresis (M-H) loops and (b) The related temperature-dependent magnetization.
Crystals 13 00984 g006
Table 1. The fluctuation of structural values was estimated using ZnO, Zn0.96Co0.04O and Zn0.96−xCo0.04GdxO (x = 0, 0.01, 0.03, 0.04) nanotubes (NTs).
Samplehkl
(◦)
d-Spacing (Å)Grain Size
(nm)
Lattice ConstantUnite Cell Volume (Å3)
a (Å)c (Å)
ZnO10031.5222.777318.343.2445.18647.19
00234.4422.597216.11---
10136.3522.470417.45---
Gd (0%)10031.8472.807916.543.2435.19047.20
00234.6452.597315.61---
10136.4652.471519.34---
Gd (1%)10031.9022.808219.323.2415.18947.27
00234.6702.597615.35---
10136.4902.471919.01---
Gd (3%)10036.4982.808519.753.2375.18747.30
00234.6892.598019.54---
10136.5122.472119.4---
Gd (4%)10036.4592.808820.253.2355.17847.35
00234.6922.598419.54
10136.5342.472720.46
Table 2. The (Gd, Co) co-doped ZnO magnetic NPs’ magnetic parameters.
SampleRemanent
Magnetization (Mr)
(emu/g)
Coercive Field
(Oe)
Saturation
Magnetization (Ms)
(emu/g)
Zn0.96Co0.04O0.93 × 10−2881.02 × 10−2
Zn0.95Co0.04Gd0.01O1.41 × 10−2501.23 × 10−2
Zn0.93Co0.04Gd0.03O1.65 × 10−2832.47 × 10−2
Zn0.92Co0.04Gd0.04O1.63 × 10−2801.64 × 10−2
Disclaimer/Publisher’s Note: The statements, opinions and data contained in all publications are solely those of the individual author(s) and contributor(s) and not of MDPI and/or the editor(s). MDPI and/or the editor(s) disclaim responsibility for any injury to people or property resulting from any ideas, methods, instructions or products referred to in the content.

