Article

Preparation of N, Cl Co-Doped Lignin Carbon Quantum Dots and Detection of Microplastics in Water

Key Laboratory of Bio-Based Material Science and Technology of Ministry of Education, Northeast Forestry University, Harbin 150040, China
*
Author to whom correspondence should be addressed.
Crystals 2023, 13(6), 983; https://doi.org/10.3390/cryst13060983
Submission received: 1 June 2023 / Revised: 9 June 2023 / Accepted: 12 June 2023 / Published: 20 June 2023
(This article belongs to the Special Issue Emerging Low-Dimensional Materials II)

Abstract

:
The research on rapid and efficient detection of microplastics in water is still in its early stages. Fluorescence feature recognition represents an important and innovative approach to microplastic detection. While carbon quantum dots have been widely used in various environmental detection methods, their use for detecting microplastics in water environments has been rarely reported. In this study, N and Cl co-doped carbon quantum dots were synthesized via a hydrothermal method. The heteroatom doping process endowed them with blue luminescence properties, and their adsorption for microplastics was improved through the introduction of positive and negative charges and intermolecular forces. By utilizing a combined mechanism of fluorescence and Rayleigh scattering, the detection of polystyrene microplastics with three different particle sizes was achieved. In the detection process, it exhibits excellent light stability. Notably, the nano-polystyrene exhibited a good nonlinear relationship within the range of 0.01 g/L to 0.001 g/L, with R2 values of 0.923 and 0.980 and a detection limit of 0.4 mg/L. These findings provide a novel approach for the detection of nano microplastics.

1. Introduction

Plastics have played a pivotal role in the advancement of human society by offering several benefits, including their light weight, low cost, and durability. However, their non-biodegradable nature has also presented significant environmental challenges, and microplastics are one of the consequences [1]. Microplastics, defined as plastics with a particle size less than 5 mm [2], are ubiquitous in the global environment [3,4,5] and can be found in various organisms, causing detrimental effects on their growth and development [6,7,8]. Moreover, microplastics can adsorb heavy metals, dyes, antibiotics, and other pollutants, serving as a carrier of these harmful substances in the environment, further promoting their accumulation in the food chain [9,10]. Hence, the detection and tracing of microplastics are of utmost importance for ecological conservation. Visual methods, infrared spectroscopy, and Raman spectroscopy are commonly used techniques for the detection of microplastics, while thermal analysis and chromatography are also emerging as promising methods [11,12,13]. The application of dyes to microplastics and the fluorescent analysis of dyed microplastics have also gained considerable attention. Nile red, a fat-soluble dye, was initially used to detect microplastics, while Bengal red, with good water solubility, is now a commonly used fluorescent dye [14,15]. However, both dyes have limitations, with Nile red being unsuitable for the detection of microplastics in water environments, and Bengal red exhibiting poor light and acid resistance [16]. The search for convenient and stable fluorescent materials for detecting microplastics is still an ongoing process with much progress yet to be made.
Carbon quantum dots (CQDs) represent an emerging fluorescent material with significant advantages over traditional fluorescent materials, including a wide range of materials and synthesis methods, low toxicity, easy preparation, adjustable fluorescence, and stability [17]. Since their discovery in 2004, they have found widespread applications in chemical sensing [18,19], bioimaging [20,21], drug delivery [22], and other fields [23,24]. However, the process of preparing CQDs often involves aromatization, which makes the preparation process complicated and costly [25]. Lignin, an aromatic biomass material found in various trees, has the ability to emit fluorescence without requiring aromatization, which simplifies the preparation process and reduces energy consumption [26,27]. Furthermore, lignin as a carbon source for CQDs offers numerous advantages, including a rich source, low cost, good biocompatibility, and reduced environmental impact [28,29]. Currently, lignin CQDs are widely used to detect and identify heavy metal ions, antibiotics, and residual pesticides in water [26,30,31]. Lignin CQDs are increasingly being utilized in environmental detection and have a promising future for applications [32,33]. By using lignin CQDs instead of traditional fluorescent dyes to detect microplastics, the detection process can be simplified, and good tolerance to light and acid-base environments can be demonstrated.
In this study, dealkalized lignin was utilized as the carbon source, and polyethyleneimine was employed to dope nitrogen and enhance the luminescence properties of CQDs. Additionally, the surface functional groups of CQDs were modified to impart a positive charge and improve their ability to bind to PS microplastics with carboxyl groups. Sodium hypochlorite was added for chlorine doping, similar to the dyeing of polystyrene with Bengal red, to strengthen the weak interaction between CQDs and PS microplastics through the aromatic halogen bond between chlorine and benzene rings. The detection of PS microplastics was achieved via the combined action of CQDs fluorescence and Rayleigh resonance scattering. The fluorescence detection and analysis of PS microplastics were conducted to provide simplified and stable means for microplastic detection and a method to quantify microplastics.

2. Materials and Methods

2.1. Materials

Dealkalized lignin and sodium hypochlorite solution (6–14% active chlorine basis) were purchased from Shanghai Macklin Biochemical Co., Ltd.(Shanghai, China); polyethyleneimine (M.W.600, 99%), styrene, polyvinylpyrrolidone, potassium persulfate and sodium hydroxide were supplied by Shanghai Aladdin Biochemical Technology Co., Ltd. (Shanghai, China); sulfuric acid (98%) was purchased from Kunshan Xincheng Reagent Co., Ltd. (Shanghai, China); all reagents were of analytical purity and used without further purification.

2.2. Fabrication of CQDs

Firstly, 0.03 g of lignin was added to 9 mL of deionized water. Then, 0.4 mL of 1 g/L polyethyleneimine and 0.6 mL sodium hypochlorite were added into the lignin solution and stirred for 5 min to achieve even dispersion. Next, the mixture was subjected to thermal treatment at 180 °C for 10 h in 100 mL hydrothermal reactor, followed by dialysis with distilled water in 1000 Da dialysis bags for 24 h, and finally freeze-dried for 72 h to obtain the CQDs powder to configure a solution of a specific concentration.

2.3. Synthesis of PS Microspheres

Firstly, polystyrene (PS) microspheres were synthesized via the suspension method. 45 mL styrene and 1.5 g Polyvinylpyrrolidone were added into 300 mL water while stirring. The temperature was heated to 75 °C and 0.6 g K2S2O8 was added. The particle size was regulated by controlling the stirring speed for 24 h at 75 °C. Then, the PS microspheres were washed with ethanol and adjusted to a suspension of 0.01 g/L for the subsequent experiments.

2.4. CQDs for PS Detection

CQD solutions with varying concentrations (0.5, 1, 2, 3, 4, 5 g/L) were blended with the PS suspension at a concentration of 0.005 g/L. The resulting mixed solution was then subjected to ultrasonic dispersion. Next, the CQDs solution with a concentration of 2 g/L was utilized to detect PS microplastics with three different particle sizes: nano-, micron-, and millimeter-scale. The same amount of 2 g/L CQDs solution and 0.01 g/L PS solution were blended with 14 parts, and then the pH of the solution was adjusted by sulfuric acid and sodium hydroxide from pH = 1 to pH = 14, respectively. The PS-CQDs solution was irradiated continuously (2, 4, 6, 8 h) under 365 nm ultraviolet light, in which the concentration of PS was 0.005 g/L and the concentration of CQDs was 2g/L.

2.5. Characterization

The morphology of CQDs was observed using transmission electron microscopy (TEM), JEM-2100 transmission electron microscope, Nippon Electronics; the crystal form of CQDs was analyzed using X-ray diffraction (XRD), XRD-6100 X-ray diffractometer, Shimadzu, Japan; the characteristic absorption peaks of CQDs were analyzed using ultraviolet-visible spectroscopy (UV-Vis), TU-1901, Beijing Purkinje General Instrument Co., Ltd. (Beijing, China); the functional groups of CQDs were analyzed using Fourier-transform infrared spectroscopy (FTIR), Spectrometer Frontier, PerkinElmer (Shanghai, China); and the excitation and emission wavelengths of CQDs were tested using fluorescence spectroscopy (FL), LS-55 Fluorescence Spectrometer, PerkinElmer (Shanghai, China).

3. Result and Discussion

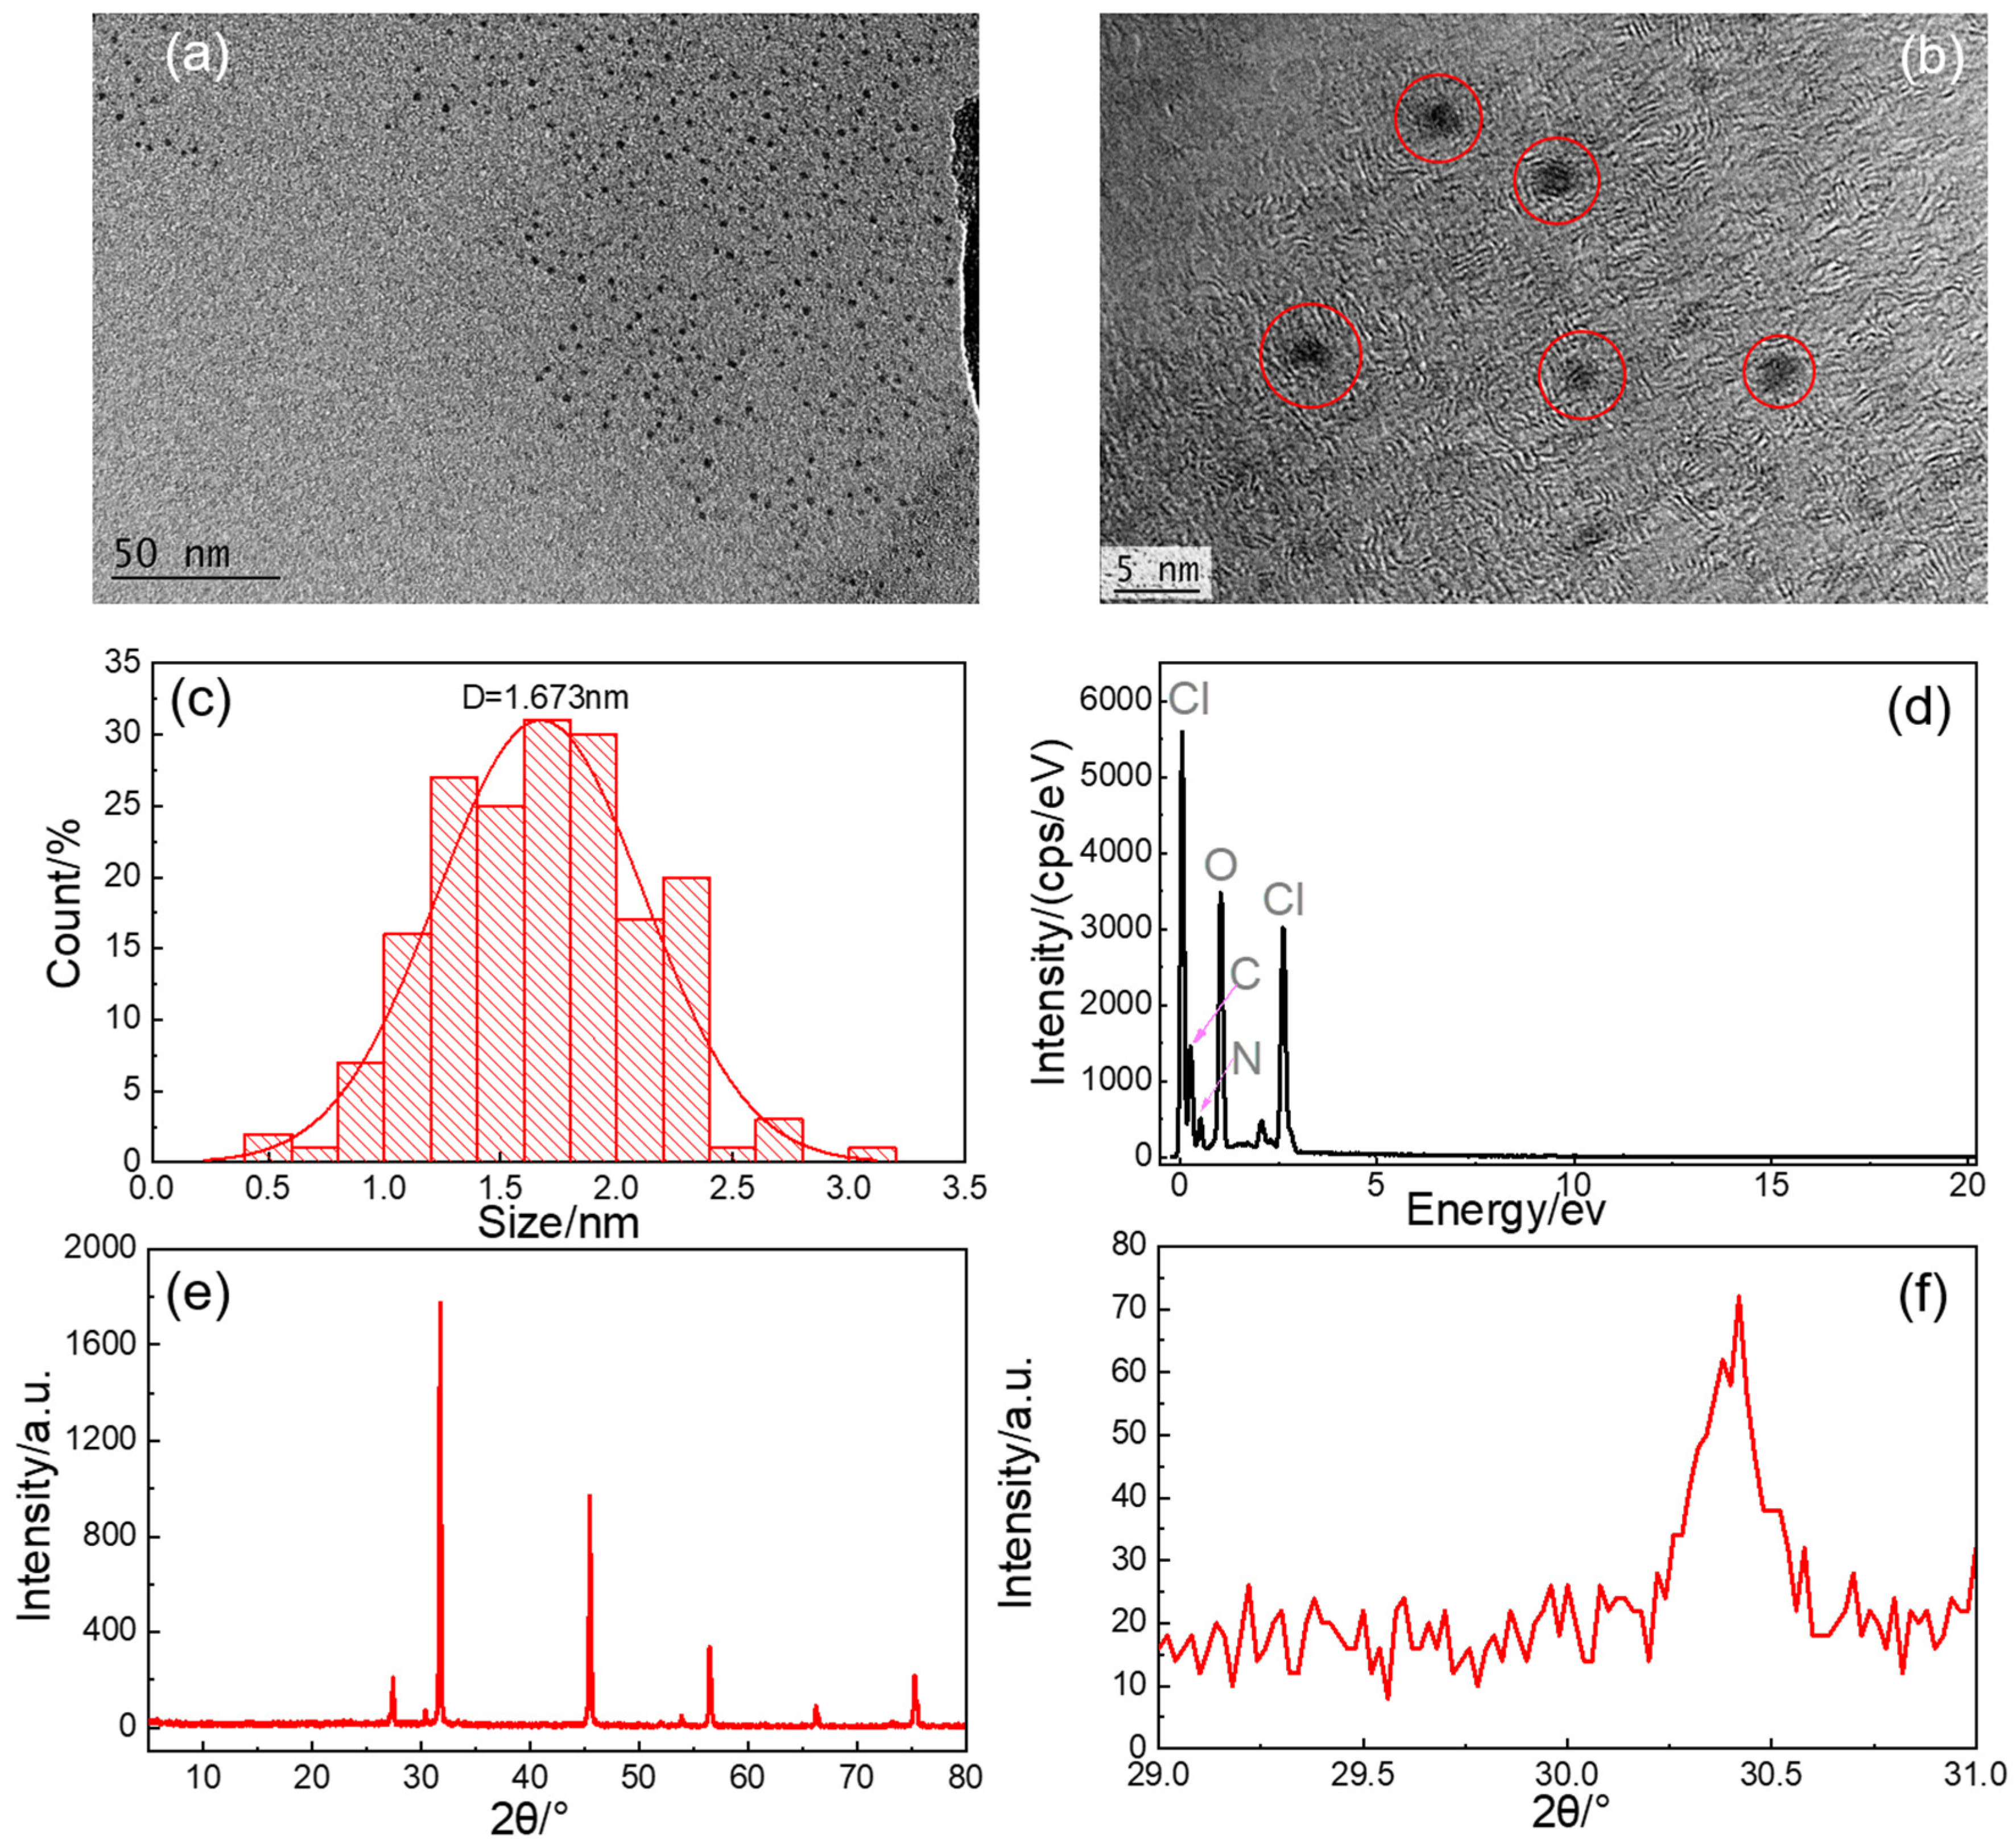
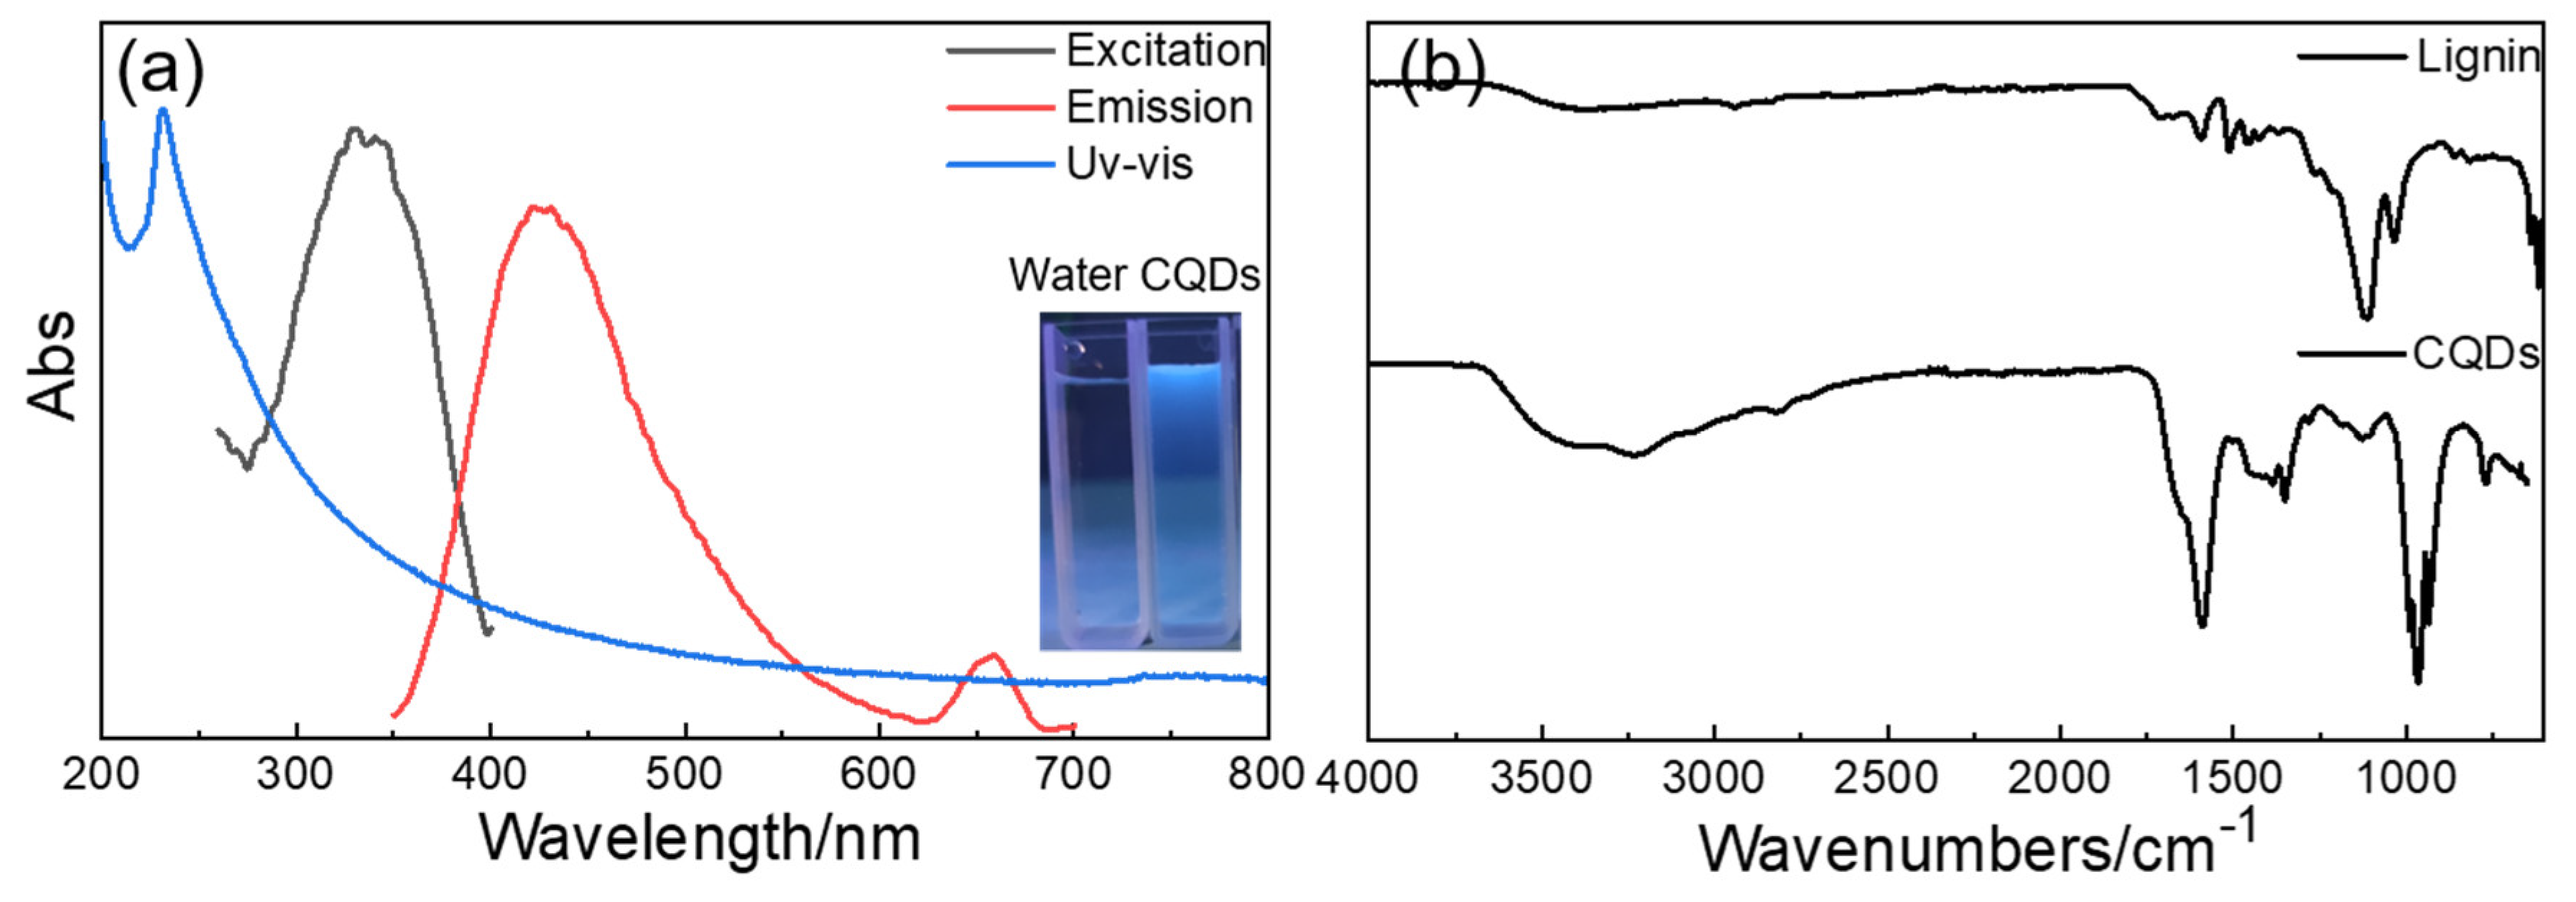
3.1. Characterization of CQDs

As shown in Figure 1a,b, CQDs display a good dispersibility, suggesting that they possess good hydrophilicity. Furthermore, the morphology of CQDs is nearly circular with particle sizes ranging from 0.5 nm to 6 nm in red circle. The particle size distribution of CQDs is shown in Figure 1c, which was analyzed using ImageJ software. The particle size is normally distributed between 0.5 nm and 3 nm, with an average particle size of 1.673 nm. The small particle size of CQDs offers a larger contact area with PS microplastics, which can occupy more adsorption sites on PS, thereby promoting the adsorption of PS microplastics. In Figure 1d, the elemental composition of the prepared CQDs is demonstrated, revealing the presence of C, O, N, and Cl elements. This result suggests that polyethyleneimine and sodium hypochlorite were successfully employed in the synthesis process, leading to the successful doping of N and Cl into the lignin CQDs. The introduction of positively charged amino groups and Cl atoms enhances the adsorption of negatively charged PS microplastics. Figure 1f is the XRD peak of CQDs, 2θ = 30.4 °. From the Bragg Equation 2dsinθ = nλ, it can be concluded that the lattice spacing of CQDs is 0.294 nm, and the doping of Cl reduces the lattice spacing, corresponding to the similar crystal plane (002), which is consistent with previous studies, although the lattice spacing is smaller than previous studies [34]. The reduction in lattice spacing increases the internal molecular force of CQDs and improves the stability of the CQDs in the detection process.
Figure 2a is the UV absorption spectrum and fluorescence spectrum of the CQDs. Under the irradiation of 312 nm ultraviolet light, the aqueous solution of CQDs emits blue fluorescence. It shows that the prepared CQDs have the characteristics of fluorescence emission, proving that the prepared materials are fluorescent carbon quantum dots, as reported in previous studies [35]. The UV absorption spectra of the CQDs were tested and the results are shown in Figure 2a. The CQDs have an obvious characteristic absorption peak at 231 nm, which is attributed to the π–π absorption band in the aromatic sp2 structure region of the CQDs. It shows that there is a π–π conjugated structure in the CQDs [36,37]. At the same time, the excitation spectrum and emission spectrum of the CQDs were tested by fluorescence spectrometer. Under the excitation wavelength of 320 nm ultraviolet light, the optimal emission wavelength of lignin CQDs is 426 nm. Figure 2b shows that compared with lignin, the characteristic peak of the CQDs at 935 cm−1 is attributed to the vibration of C-Cl. Since lignin does not contain a C-Cl bond, this indicates that Cl is derived from the reactant sodium hypochlorite. The doping of Cl atoms can improve the fluorescence characteristics of CQDs and improve the selective adsorption of PS microplastics. The characteristic peak of C-N appeared at 965 cm−1, and because no C-N absorption peak appeared in lignin, indicated that polyethyleneimine was the only way to introduce N atoms. The corresponding peak at 1390 cm−1 is the characteristic peak of C-O. The bending vibration peak of C-H appeared at 1351 cm−1, and the vibration peak of C=C appeared at 1591 cm−1. The stretching vibration peak of C-H is at 2821 cm−1, and the stretching vibration peak of-OH, −N-H is at 3700–3000 cm−1, indicating that the prepared lignin CQDs contain −COOH, which is the reason that the CQDs have good water solubility [38].

3.2. Detection of PS Microplastics by CQDs

In the fluorescence spectroscopy characterization, Rayleigh scattering occurs due to the excitation wavelength of 320 nm, resulting in the appearance of a frequency doubling peak at around 640 nm [39]. This study found that the intensity of the frequency doubling peak varies with the concentration of PS, which can have an impact on the use of CQDs for PS identification. To ensure consistency in the test conditions, no filter was utilized to filter out the frequency doubling peak during the test.
As depicted in Figure 3, the adsorption mechanism of PS microplastics on CQDs in water is based on three effects: attraction of positive and negative charges, the action of aromatic halogen bonds, and the action of intermolecular π bonds. These three effects alter the conjugated state of CQDs, resulting in increased fluorescence intensity. Additionally, the adsorption of CQDs by PS weakens the Rayleigh scattering effect of PS, resulting in a regular shift, which enables the use of CQDs for the detection of PS microplastics.
Figure 4a illustrates that the fluorescence intensity of CQDs reaches a peak at a concentration of 4 g/L and then declines significantly at 5 g/L. This phenomenon occurs because, as the concentration increases, the color of CQDs gradually deepens, and the internal filter effect becomes stronger, leading to fluorescence quenching of CQDs [40]. Additionally, the position of the fluorescence peak of CQDs is red-shifted with the increase in concentration, indicating that the intramolecular or intermolecular hydrogen bonds of CQDs were affected [41,42]. Figure 4b displays the fluorescence intensity of the CQDs solution after blending with the PS solution, with the concentration of PS microplastics set at 0.005 g/L. These findings demonstrate the potential of CQDs as a promising material for the detection of PS microplastics, providing important insights into the development of efficient and effective methods for microplastic detection. The fluorescence intensity increased gradually from 0.5 g/L to 2 g/L, but decreased from 2 g/L to 5 g/L. This phenomenon occurs because after the addition of PS microplastics, the CQDs in the solution are adsorbed onto the surface of the PS microplastics. The surface of PS microplastics contains carboxyl groups, which can electrostatically interact with the surface functional group amino of CQDs in the solution. Furthermore, weak interactions such as intermolecular hydrogen bonds and chlorine and benzene rings contribute to the increased conjugation of CQDs and enhance the fluorescence intensity of the solution. However, with the increase in the concentration of CQDs, the number of CQDs accumulated on PS microplastics increases, and the internal filtration effect and aggregation-induced quenching behavior occur [43]. Therefore, the comprehensive result is a decrease in fluorescence intensity. Figure 4b displays a frequency doubling peak at 659 nm caused by resonance Rayleigh scattering. The intensity of the frequency doubling peak gradually decreases with the increase in the concentration of CQDs, indicating that the addition of CQDs inhibits the frequency doubling peak [44]. This phenomenon occurs because the adsorption of CQDs on PS reduces the light scattering of PS, including positive and negative charge adsorption, the aromatic halogen bond between the chlorine and the benzene ring on the CQDs, and the π-π and van der Waals forces between the benzene rings, resulting in a continuous decrease in the intensity of the peak. Figure 4c analyzes the influencing factors in the water environment by comparing the fluorescence intensity changes of CQDs and PS-CQDs at the same concentration. These results demonstrate that CQDs can selectively adsorb and detect PS microplastics in water and provide important insights into the development of efficient and effective methods for microplastic detection. At a concentration of 1 g/L, the interaction between intermolecular forces and hydrogen bonds was the main factor affecting the fluorescence intensity of CQDs. The presence of PS microplastics changed the surface state of CQDs under the same conditions. As the concentration increased from 2 g/L to 5 g/L, the color of the CQDs solution deepened, and the internal filtration effect and aggregation-induced quenching on the fluorescence intensity gradually emerged, causing a continuous decrease in the fluorescence intensity of PS-CQDs. The internal intensity of pure CQDs was higher than that of PS-CQDs. At 5 g/L, the internal filtration effect was the main factor affecting the fluorescence intensity. In Figure 4d, the scattering of excitation light in the solution containing CQDs was weak, and there was no significant difference with the change of concentration. In PS-CQDs, the intensity of the frequency doubling peak gradually decreased with the increase in the concentration of CQDs, and finally approached the fluorescence intensity of only CQDs. This phenomenon occurred because the adsorption of CQDs by PS microplastics gradually increased with the increase in the concentration of CQDs, and the CQDs adsorbed on the surface of PS affected the scattering of excitation light by PS microplastics. When the concentration of CQDs was large enough, the surface of the PS microplastics was completely wrapped, thereby losing the scattering effect on excitation light. Thus, the fluorescence peak intensity continuously decreased and finally approached the peak intensity of CQDs.
By summarizing the figures in Figure 4, a concentration of 1 g/L of CQDs was selected as the detection concentration of PS microplastics in the subsequent experiment. This concentration exhibited strong fluorescence intensity and was less affected by the internal filtering effect. Furthermore, PS microplastics had a certain amount of adsorption on CQDs, which allowed for distinguishing them from the fluorescence intensity of a pure CQDs aqueous solution. There was also an obvious frequency doubling peak at 659 nm. These findings provide a better understanding of the relationship between the concentration of CQDs, PS microplastics, and fluorescence intensity, which is critical for improving the detection sensitivity and accuracy of microplastics in water environments.
As shown in Figure 5a, the detection law of PS microplastics by CQDs solution was investigated by changing the concentration of PS microplastics. Figure 5b shows that the fluorescence emission peak of CQDs at 426 nm is generated by the irradiation of excitation light. At the same time, as the concentration of PS microplastics gradually increases, the fluorescence intensity decreases continuously. The reason is that the adsorption of CQDs by PS microplastics reduces the concentration of CQDs in the solution. With the increase in the concentration of PS microplastics, the adsorption amount of CQDs by PS microplastics in the system becomes larger, so that the concentration of CQDs in the system decreases, and finally the fluorescence intensity decreases. Figure 5a shows that the peak intensity also increases with the increase in PS microplastics concentration at 659 nm. The reason is that the increase in PS microplastics concentration enhances the scattering of excitation light. For nano-scale PS microplastics, the fluorescence intensity of CQDs decreases with the increase in the concentration of PS microplastics. The peaks of 426 nm and 659 nm are fitted, and the fitting curve satisfies the nonlinear relationship. In the range of 0.01 g/L to 0.001 g/L, the model conforms to the exponential decay equation Expdec1 equation.
y = y 0 +   A 1 e x t
where y is the reciprocal of the fluorescence intensity of PS-CQDs, x represents the concentration of PS microplastics, e is the natural number, and y0, A1, and t are the corresponding constants at this particle size. The peak value of 426 nm was fitted, and the fitting curve was shown in Figure 5c, where y0 = 0.00209, A1 = 0.00000737, t = −0.00388, R2 = 0.923. The fitting of the 659 nm peak is shown in Figure 5d, where a = 0.0517, b = −0.0313, t = −0.0239, R2 = 0.980. Additionally, the detection limit of CQDs for nano PS microplastics could reach 0.4 mg/L, which broadened the detection of nano-microplastics [45]. Figure 5e shows that the fluorescence intensity is constant with the increase in concentration, indicating that the concentration of PS microplastics is the main factor affecting Rayleigh scattering. The peak at 659 nm was taken for data fitting, and the fitting result was shown as Figure 5f. The curve
y = ax + b
described the linear relationship between the concentration and fluorescence intensity of PS microplastics. Where y is the reciprocal of the fluorescence intensity of PS at 659 nm, x represents the concentration of PS microplastics. The parameters of the formula are a = 52,745.6, b = 36.6, R2 = 0.992. Through the ratio fluorescence relationship between the CQDs and PS, it is possible to develop a kind of fluorescent sensor to detect microplastics and achieve quantitative detection. However, the detection was only discussed in the laboratory environment to explain the detecting mechanism. More exploration needs to be conducted for its future applications.
At the same time, PS microplastics with particle size of micron and millimeter were tested. The fluorescence curve was similar to that of nano PS microplastics. The fitting results are shown in Table 1 and Table 2.
By comparing the scattering behaviors of three PS microplastics with different particle sizes, it is clear that PS microplastics have different scattering abilities for excitation light in water environment. It is observed that micron-sized PS microplastics have a stronger scattering ability for excitation light than nano-sized PS microplastics, and millimeter-sized PS microplastics have the weakest scattering ability for excitation light at the same concentration. This can be attributed to the fact that the number and particle size of PS microplastics in the water environment affect the scattering. Using mass fraction as the measurement unit is still a simple and direct method. However, it should be noted that the number of PS microplastics per unit volume will decrease with the increase in particle size; hence, the number of millimeter-scale microplastics per unit volume is the smallest, and the fluorescence intensity collected after scattering is also the smallest. Therefore, particle size is a greater influencing factor than concentration. Furthermore, the recognition effect of CQDs on PS microplastics with different particle sizes is not the same. It has a good recognition effect on low-concentration PS microplastics at the nanometer and micron levels, while the recognition effect on millimeter-scale PS microplastics is poor and the fitting correlation is weak. This experiment also reveals a problem with the simple use of mass fraction or the number of particles per unit volume for the quantitative use of microplastics. The small number of particles does not necessarily indicate that the quality of microplastics in the water environment is small, as low quality microplastics with small particle sizes can also exist.
In Figure 6a,b, the effect of pH on the fluorescence peak intensity of CQDs and the frequency doubling peak intensity were studied. As pH increases from 1 to 7, the fluorescence peak intensity of CQDs decreases gradually, while the intensity of the frequency doubling peak increases. This can be explained by the fact that under acidic conditions, −COOH groups on the surface of PS microplastics are difficult to ionize, and thus the electrostatic adsorption between PS and CQDs is greatly inhibited. Moreover, the hydrogen bonding between PS and CQDs is affected by the presence of hydrogen ions in the solution. The anion SO42− in the acidic environment competes with the −COO− ionized on the surface of PS and the -NH3 on the surface of CQDs, which reduces the adsorption of CQDs by PS microplastics. This in turn increases the specific surface area of PS microplastics exposed to the excitation light source, resulting in stronger light scattering and, consequently, an increase in the intensity of the frequency doubling peak. Under alkaline conditions, the fluorescence peak of CQDs increases as pH increases from 7 to 12, and the intensity of the frequency doubling peak also increases. This can be explained by the deprotonation reaction of CQDs due to the low concentration of OH. This results in an enhancement of the fluorescence intensity. At the same time, cations such as sodium ions bind to −COO− on the surface of PS microplastics, reducing the binding sites between PS and CQDs. As pH increases from 12 to 14, the deprotonation effect of CQDs occurs, resulting in a decrease in the fluorescence peak intensity and an increase in the intensity of the frequency doubling peak. Sodium ions dissolved in water as cations are attracted by positive and negative charges and combine with −COO− on the surface of PS, thereby reducing the binding sites between PS and CQDs.
The results presented in Figure 6c,d demonstrate that the fluorescence intensity of PS-CQDs remains relatively stable during light irradiation, indicating that the detection process using CQDs has excellent light stability, and the fluorescence intensity does not decrease significantly due to long-term light exposure. Additionally, the fluorescence remains after a week in daylight. Compared with photobleaching of Bengal red in a short time [46], CQDs has excellent light stability. This suggests that the use of CQDs is a more stable method that can effectively prevent photobleaching and ensure reliable detection results.
Table 3 is a comparison of three fluorescent reagents. The use of Nile red requires organic solvents, while the other two can be used in the water environment. Rose Bengal has poor light stability. Among the three, CQDS is the most sensitive to PS and also has the ability to ordinarily dye PS. Considered comprehensively, CQDs are more suitable for the detection of PS microplastics in water environment. Carbon quantum dots are suitable for the detection of nano polystyrene microplastics, while the first two have not been reported. Although carbon quantum dots have a good performance on detecting PS, this work only discusses the detection of PS in a laboratory environment; real water samples need to be tested and the detection of other microplastics remains to be studied.

4. Conclusions

In summary, N and Cl co-doped lignin CQDs with good water solubility and stability were synthesized from dealkalized lignin, polyethyleneimine, and sodium hypochlorite. The average particle size of the CQDs was 1.673 nm, and they emitted blue fluorescence under 320 nm ultraviolet light with an emission wavelength of 426 nm. By combining fluorescence and Rayleigh scattering, CQDs were used as fluorescent reagents to detect microplastics and achieved good performance for the first time. CQDs with 1 g/L lignin were used to successfully detect polystyrene microplastics with different particle sizes in water. The nano PS microplastics exhibited a good nonlinear relationship at a concentration of 0.001 g/L to 0.01 g/L, with a detection limit of 0.4 mg/L. In acidic conditions ranging from pH = 7 to pH = 1, the fluorescence peak intensity of CQDs gradually decreased, while the intensity of the frequency doubling peak gradually increased. Under alkaline conditions, the fluorescence peak of CQDs increased from pH = 7 to pH = 12, with the fluorescence intensity of the second harmonic peak becoming stronger. However, from pH = 12 to pH = 14, the fluorescence peak intensity decreased with increasing alkalinity, while the fluorescence intensity of the second harmonic peak became stronger. The light stability remained good under 8 h of ultraviolet light irradiation, indicating that the detection of PS microplastics using CQDs could be maintained for a long time. CQDs are particularly suited for the detection of micro-nano particle-sized PS microplastics, as their ability to adsorb and scatter light is influenced by the size of the microplastic particles. Finally, compared with the fluorescent dyes in previous studies, CQDs are more convenient and stable, the sensitivity is also higher and has the ability to detect nano size of PS. At the same time, CQDs were used for the first time to quantitatively analyze PS microplastics, which is of great significance for the quantitative detection of microplastics in the future.

Author Contributions

Conceptualization, H.Z. and Z.J.; Investigation, H.Z.; Resources, Y.L. and C.W.; Data curation, H.Z. and Z.J.; Writing—original draft, H.Z.; Writing—review and editing, Y.L.; Supervision, C.W. and Y.L.; Funding acquisition, C.W. and Y.L. All authors have read and agreed to the published version of the manuscript.

Funding

This research was funded by the Fundamental Research Funds for the Central Universities (2572021CG02).

Institutional Review Board Statement

Not applicable.

Informed Consent Statement

Not applicable.

Data Availability Statement

Not applicable.

Conflicts of Interest

The authors declare no conflict of interest.

References

  1. Geyer, R.; Jambeck, J.R.; Law, K.L. Production, Use, and Fate of all Plastics Ever Made. Sci. Adv. 2017, 3, e1700782. [Google Scholar] [CrossRef] [Green Version]
  2. Thompson, R.C.; Olsen, Y.; Mitchell, R.P.; Davis, A.; Rowland, S.J.; John, A.W.G.; McGonigle, D.; Russell, A.E. Lost at Sea: Where is All the Plastic? Science 2004, 304, 838. [Google Scholar] [CrossRef] [PubMed]
  3. Reed, S.; Clark, M.; Thompson, R.; Hughes, K.A. Microplastics in Marine Sediments near Rothera Research Station, Antarctica. Mar. Pollut. Bull. 2018, 133, 460–463. [Google Scholar] [CrossRef] [PubMed]
  4. Ross, P.S.; Chastain, S.; Vassilenko, E.; Etemadifar, A.; Zimmermann, S.; Quesnel, S.-A.; Eert, J.; Solomon, E.; Patankar, S.; Posacka, A.M.; et al. Pervasive Distribution of Polyester Fibres in the Arctic Ocean is Driven by Atlantic Inputs. Nat. Commun. 2021, 12, 106. [Google Scholar] [CrossRef]
  5. Silvestrova, K.; Stepanova, N. The Distribution of Microplastics in the Surface Layer of the Atlantic Ocean from the Subtropics to the Equator According to Visual Analysis. Mar. Pollut. Bull. 2021, 162, 111836. [Google Scholar] [CrossRef] [PubMed]
  6. Huang, D.; Wang, X.; Yin, L.; Chen, S.; Tao, J.; Zhou, W.; Chen, H.; Zhang, G.; Xiao, R. Research Progress of Microplastics in Soil-Plant System: Ecological Effects and Potential Risks. Sci. Total Environ. 2022, 812, 151487. [Google Scholar] [CrossRef] [PubMed]
  7. Karbalaei, S.; Hanachi, P.; Walker, T.R.; Cole, M. Occurrence, Sources, Human Health Impacts and Mitigation of Microplastic Pollution. Environ. Sci. Pollut. Res. 2018, 25, 36046–36063. [Google Scholar] [CrossRef]
  8. Yong, C.Q.Y.; Valiyaveettil, S.; Tang, B.L. Toxicity of Microplastics and Nanoplastics in Mammalian Systems. Int. J. Environ. Res. Public Health 2020, 17, 1509. [Google Scholar] [CrossRef] [Green Version]
  9. Brennecke, D.; Duarte, B.; Paiva, F.; Cacador, I.; Canning-Clode, J. Microplastics as Vector for Heavy Metal Contamination from the Marine Environment. Estuar. Coast. Shelf Sci. 2016, 178, 189–195. [Google Scholar] [CrossRef]
  10. Wang, F.; Zhang, M.; Sha, W.; Wang, Y.; Hao, H.; Dou, Y.; Li, Y. Sorption Behavior and Mechanisms of Organic Contaminants to Nano and Microplastics. Molecules 2020, 25, 1827. [Google Scholar] [CrossRef] [Green Version]
  11. Kaeppler, A.; Fischer, D.; Oberbeckmann, S.; Schernewski, G.; Labrenz, M.; Eichhorn, K.-J.; Voit, B. Analysis of Environmental Microplastics by Vibrational Microspectroscopy: FTIR, Raman or Both? Anal. Bioanal. Chem. 2016, 408, 8377–8391. [Google Scholar] [CrossRef]
  12. Fischer, M.; Scholz-Boettcher, B.M. Simultaneous Trace Identification and Quantification of Common Types of Microplastics in Environmental Samples by Pyrolysis-Gas Chromatography-Mass Spectrometry. Environ. Sci. Technol. 2017, 51, 5052–5060. [Google Scholar] [CrossRef]
  13. Duemichen, E.; Eisentraut, P.; Bannick, C.G.; Barthel, A.-K.; Senz, R.; Braun, U. Fast Identification of Microplastics in Complex Environmental Samples by a Thermal Degradation Method. Chemosphere 2017, 174, 572–584. [Google Scholar] [CrossRef]
  14. Shim, W.J.; Song, Y.K.; Hong, S.H.; Jang, M. Identification and Quantification of Microplastics Using Nile Red Staining. Mar. Pollut. Bull. 2016, 113, 469–476. [Google Scholar] [CrossRef] [PubMed]
  15. Gbogbo, F.; Takyi, J.B.; Billah, M.K.; Ewool, J. Analysis of Microplastics in Wetland Samples from Coastal Ghana Using the Rose Bengal Stain. Environ. Monit. Assess. 2020, 192, 208. [Google Scholar] [CrossRef] [PubMed]
  16. Parker, B.; Andreou, D.; Green, I.D.; Britton, J.R. Microplastics in Freshwater Fishes: Occurrence, Impacts and Future Perspectives. Fish Fish. 2021, 22, 467–488. [Google Scholar] [CrossRef]
  17. Lim, S.Y.; Shen, W.; Gao, Z. Carbon Quantum Dots and their Applications. Chem. Soc. Rev. 2015, 44, 362–381. [Google Scholar] [CrossRef]
  18. Magesh, V.; Sundramoorthy, A.K.; Ganapathy, D. Recent Advances on Synthesis and Potential Applications of Carbon Quantum Dots. Front. Mater. 2022, 9, 906838. [Google Scholar] [CrossRef]
  19. Nazri, N.A.A.; Azeman, N.H.; Luo, Y.; Bakar, A.A.A. Carbon quantum dots for optical sensor applications: A review. Opt. Laser Technol. 2021, 139, 106928. [Google Scholar] [CrossRef]
  20. Atchudan, R.; Edison, T.N.J.I.; Shanmugam, M.; Perumal, S.; Somanathan, T.; Lee, Y.R. Sustainable Synthesis of Carbon Quantum Dots from Banana Peel Waste using Hydrothermal Process for in Vivo Bioimaging. Phys. E-Low-Dimens. Syst. Nanostruct. 2021, 126, 114417. [Google Scholar] [CrossRef]
  21. Choppadandi, M.; Guduru, A.T.; Gondaliya, P.; Arya, N.; Kalia, K.; Kumar, H.; Kapusetti, G. Structural Features Regulated Photoluminescence Intensity and Cell Internalization of Carbon and Graphene Quantum Dots for Bioimaging. Mater. Sci. Eng. C-Mater. Biol. Appl. 2021, 129, 112366. [Google Scholar] [CrossRef] [PubMed]
  22. Molaei, M.J. Carbon Quantum Dots and their Biomedical and Therapeutic Applications: A Review. R. Soc Adv. 2019, 9, 6460–6481. [Google Scholar] [CrossRef] [PubMed]
  23. Shi, Z.-J.; Ma, M.-G. Synthesis, Structure, and Applications of Lignin-Based Carbon Materials: A Review. Sci. Adv. Mater. 2019, 11, 18–32. [Google Scholar] [CrossRef]
  24. Bressi, V.; Chiarotto, I.; Ferlazzo, A.; Celesti, C.; Michenzi, C.; Len, T.; Iannazzo, D.; Neri, G.; Espro, C. Voltammetric Sensor Based on Waste-Derived Carbon Nanodots for Enhanced Detection of Nitrobenzene. ChemElectroChem 2023, e202300004. [Google Scholar] [CrossRef]
  25. Iravani, S.; Varma, R.S. Greener Synthesis of Lignin Nanoparticles and their Applications. Green Chem. 2020, 22, 612–636. [Google Scholar] [CrossRef]
  26. Hao, L.; Yu, Y.; Liang, Z.; Hou, H.; Liu, X.; Chen, C.; Min, D. Deciphering Photocatalytic Degradation of Methylene Blue by Surface-Tailored Nitrogen-Doped Carbon Quantum Dots Derived from Kraft lignin. Int. J. Biol. Macromol. 2023, 242 Pt 2, 124958. [Google Scholar] [CrossRef]
  27. Ferlazzo, A.; Bressi, V.; Espro, C.; Iannazzo, D.; Piperopoulos, E.; Neri, G. Electrochemical Determination of Nitrites and Sulfites by Using Waste-Derived Nanobiochar. J. Electroanal. Chem. 2023, 928, 117071. [Google Scholar] [CrossRef]
  28. Zhang, B.; Liu, Y.; Ren, M.; Li, W.; Zhang, X.; Vajtai, R.; Ajayan, P.M.; Tour, J.M.; Wang, L. Sustainable Synthesis of Bright Green Fluorescent Nitrogen-Doped Carbon Quantum Dots from Alkali Lignin. Chemsuschem 2019, 12, 4202–4210. [Google Scholar] [CrossRef]
  29. Yang, X.; Hou, S.; Chu, T.; Han, J.; Li, R.; Guo, Y.; Gong, Y.; Li, H.; Wan, Z. Preparation of Magnesium, Nitrogen-Codoped Carbon Quantum Dots from Lignin with Bright Green Fluorescence and Sensitive pH Response. Ind. Crops Prod. 2021, 167, 113507. [Google Scholar] [CrossRef]
  30. Devi, P.; Rajput, P.; Thakur, A.; Kim, K.-H.; Kumar, P. Recent Advances in Carbon Quantum Dot-Based Sensing of Heavy Metals in Water. Trac-Trends Anal. Chem. 2019, 114, 171–195. [Google Scholar] [CrossRef]
  31. Wareing, T.C.; Gentile, P.; Phan, A.N. Biomass-Based Carbon Dots: Current Development and Future Perspectives. ACS Nano 2021, 15, 15471–15501. [Google Scholar] [CrossRef] [PubMed]
  32. Long, C.; Jiang, Z.; Shangguan, J.; Qing, T.; Zhang, P.; Feng, B. Applications of Carbon Dots in Environmental Pollution Control: A Review. Chem. Eng. J. 2021, 406, 126848. [Google Scholar] [CrossRef]
  33. Zhu, L.; Shen, D.; Luo, K.H. Triple-Emission Nitrogen and Boron Co-Doped Carbon Quantum Dots from Lignin: Highly Fluorescent Sensing Platform for Detection of Hexavalent Chromium Ions. J. Colloid Interface Sci. 2022, 617, 557–567. [Google Scholar] [CrossRef] [PubMed]
  34. Zhao, J.; Tang, L.; Xiang, J.; Ji, R.; Yuan, J.; Zhao, J.; Yu, R.; Tai, Y.; Song, L. Chlorine Doped Graphene Quantum Dots: Preparation, Properties, and Photovoltaic Detectors. Appl. Phys. Lett. 2014, 105, 111–116. [Google Scholar] [CrossRef]
  35. Janus, L.; Radwan-Praglowska, J.; Piatkowski, M.; Bogdal, D. Coumarin-Modified CQDs for Biomedical Applications-Two-Step Synthesis and Characterization. Int. J. Mol. Sci. 2020, 21, 8073. [Google Scholar] [CrossRef]
  36. Liu, Y.; Yang, H.; Ma, C.; Luo, S.; Xu, M.; Wu, Z.; Li, W.; Liu, S. Luminescent Transparent Wood Based on Lignin-Derived Carbon Dots as a Building Material for Dual-Channel, Real-Time, and Visual Detection of Formaldehyde Gas. ACS Appl. Mater. Interfaces 2020, 12, 36628–36638. [Google Scholar] [CrossRef]
  37. Yang, X.; Guo, Y.; Liang, S.; Hou, S.; Chu, T.; Ma, J.; Chen, X.; Zhou, J.; Sun, R. Preparation of Sulfur-Doped Carbon Quantum Dots from Lignin as a Sensor to Detect Sudan I in an Acidic Environment. J. Mater. Chem. B 2020, 8, 10788–10796. [Google Scholar] [CrossRef]
  38. Yang, Y.; Xing, X.; Zou, T.; Wang, Z.; Zhao, R.; Hong, P.; Peng, S.; Zhang, X.; Wang, Y. A Novel and Sensitive Ratiometric Fluorescence Assay for Carbendazim Based on N-Doped Carbon Quantum Dots and Gold Nanocluster Nanohybrid. J. Hazard. Mater. 2020, 386, 121958. [Google Scholar] [CrossRef]
  39. Adsetts, J.R.; Hoesterey, S.; Gao, C.; Love, D.A.; Ding, Z. Electrochemiluminescence and Photoluminescence of Carbon Quantum Dots Controlled by Aggregation-Induced Emission, Aggregation-Caused Quenching, and Interfacial Reactions. Langmuir 2020, 36, 14432–14442. [Google Scholar] [CrossRef]
  40. Erni-Cassola, G.; Gibson, M.I.; Thompson, R.C.; Christie-Oleza, J.A. Lost, but Found with Nile Red: A Novel Method for Detecting and Quantifying Small Microplastics (1 mm to 20 μm) in Environmental Samples. Environ. Sci. Technol. 2017, 51, 13641–13648. [Google Scholar] [CrossRef] [Green Version]
  41. Zhu, T.; Cao, L.; Kou, X.; Liu, Y.; Dong, W.-F.; Ge, M.; Li, L. Nitrogen-Doped Cyan-Emissive Carbon Quantum Dots for Fluorescence Tetracycline Detection and Lysosome Imaging. R. Soc. Adv. 2022, 12, 33761–33771. [Google Scholar] [CrossRef] [PubMed]
  42. Liu, M.L.; Chen, B.B.; Yang, T.; Wang, J.; Liu, X.D.; Huang, C.Z. One-Pot Carbonization Synthesis of Europium-Doped Carbon Quantum Dots for Highly Selective Detection of Tetracycline. Methods Appl. Fluoresc. 2017, 5, 015003. [Google Scholar] [CrossRef] [PubMed]
  43. Chai, S.Q.; He, J.H.; Zhan, L.; Li, Y.F.; Li, C.M.; Huang, C.Z. Dy(III)-Induced Aggregation Emission Quenching Effect of Single-Layered Graphene Quantum Dots for Selective Detection of Phosphate in the Artificial Wetlands. Talanta 2019, 196, 100–108. [Google Scholar] [CrossRef]
  44. Lv, L.L.; Qu, J.H.; Yu, Z.H.; Chen, D.H.; Zhou, C.X.; Hong, P.Z.; Sun, S.L.; Li, C.Y. A simple method for detecting and quantifying microplastics utilizing fluorescent dyes—Safranine T, fluorescein isophosphate, Nile red based on thermal expansion and contraction property. Environ. Pollut. 2019, 255, 113283. [Google Scholar] [CrossRef] [PubMed]
  45. Cai, H.; Xu, E.G.; Du, F.; Li, R.; Liu, J.; Shi, H. Analysis of Environmental Nanoplastics: Progress and Challenges. Chem. Eng. J. 2021, 410, 128208. [Google Scholar] [CrossRef]
  46. Khan, H.M.; Khan, A.A. Characterization of Aqueous Rose Bengal Dye Solution for the Measurement of Low Doses of Gamma Radiation. J. Radioanal. Nucl. Chem. 2010, 284, 37–42. [Google Scholar] [CrossRef]
Figure 1. (a,b) the TEM of the CQDs; (c) the particle size distribution map; (d) the EDS of the CQDs; (e,f) the XRD of the CQDs.
Crystals 13 00983 g001
Figure 2. (a) The UV-Vis and FL of CQDs; (b) the FTIR of CQDs.
Crystals 13 00983 g002
Figure 3. Adsorption mechanism of CQDs for PS microplastics.
Crystals 13 00983 g003
Figure 4. (a) Emission spectra of CQDs with different concentrations; (b) emission spectra of CQDS with different concentrations added to PS; (c) changes in fluorescence intensity of CQDs and PS-CQDs at 426 nm; (d) changes in fluorescence intensity of CQDS and PS-CQDs at 659 nm.
Crystals 13 00983 g004
Figure 5. (a) Fluorescence spectra of PS-CQDs; (b) fluorescence spectra of PS-CQDs at 426 nm; (c) fitting curve of PS-CQDS at 426 nm; (d) fitting curve of PS-CQDs at 659 nm; (e) fluorescence spectra of different concentrations of PS; (f) fitting curve of PS at 659 nm.
Crystals 13 00983 g005
Figure 6. (a) Fluorescence spectra of PS-CQDs under different pH conditions; (b) fluorescence intensity of PS-CQDs at 659 nm with pH; (c) fluorescence spectra at different illumination times; (d) 426 nm and 659 nm fluorescence intensities over time.
Crystals 13 00983 g006
Table 1. Fitting equation parameters of microplastics of different particle sizes after adding CQDs.
Nano PSMicro PSMm PS
426 nm659 nm426 nm659 nm426 nm659 nm
y00.002090.05170.002050.002220.002010.0231
A17.374 × 10−6−0.03131.342 × 10−50.02737.862 × 10−50.0695
t−0.00388−0.0239−0.004990.00299−0.004680.00269
R20.9230.9800.7920.9940.5790.985
Table 2. Fitting equation parameters for microplastics with different particle sizes at 659 nm.
Nano PSMicro PSMm PS
a52,745.613206,260.43615,256.532
b36.640−74.56927.695
R20.9920.9390.963
Table 3. Comparison of three fluorescent reagents.
Nile Red [14,39]Rose Bengal [15,46]CQDs
applicable environmentorganic solventwaterwater
light stabilitygoodpoorgood
sensitivitypoorordinarygood
pre-processingneedneedneed
Detecting of particle sizemm, μmmm, μmmm, μm, nm
Dyeing ability to PSgoodpoorordinary
Disclaimer/Publisher’s Note: The statements, opinions and data contained in all publications are solely those of the individual author(s) and contributor(s) and not of MDPI and/or the editor(s). MDPI and/or the editor(s) disclaim responsibility for any injury to people or property resulting from any ideas, methods, instructions or products referred to in the content.

