

Crystallization Kinetics: Relationship between Crystal Morphology and the Cooling Rate—Applications for Different Geological Materials
 , , and
Abstract
:1. Introduction
2. Materials and Methods
2.1. Materials
2.2. Methods
3. Results
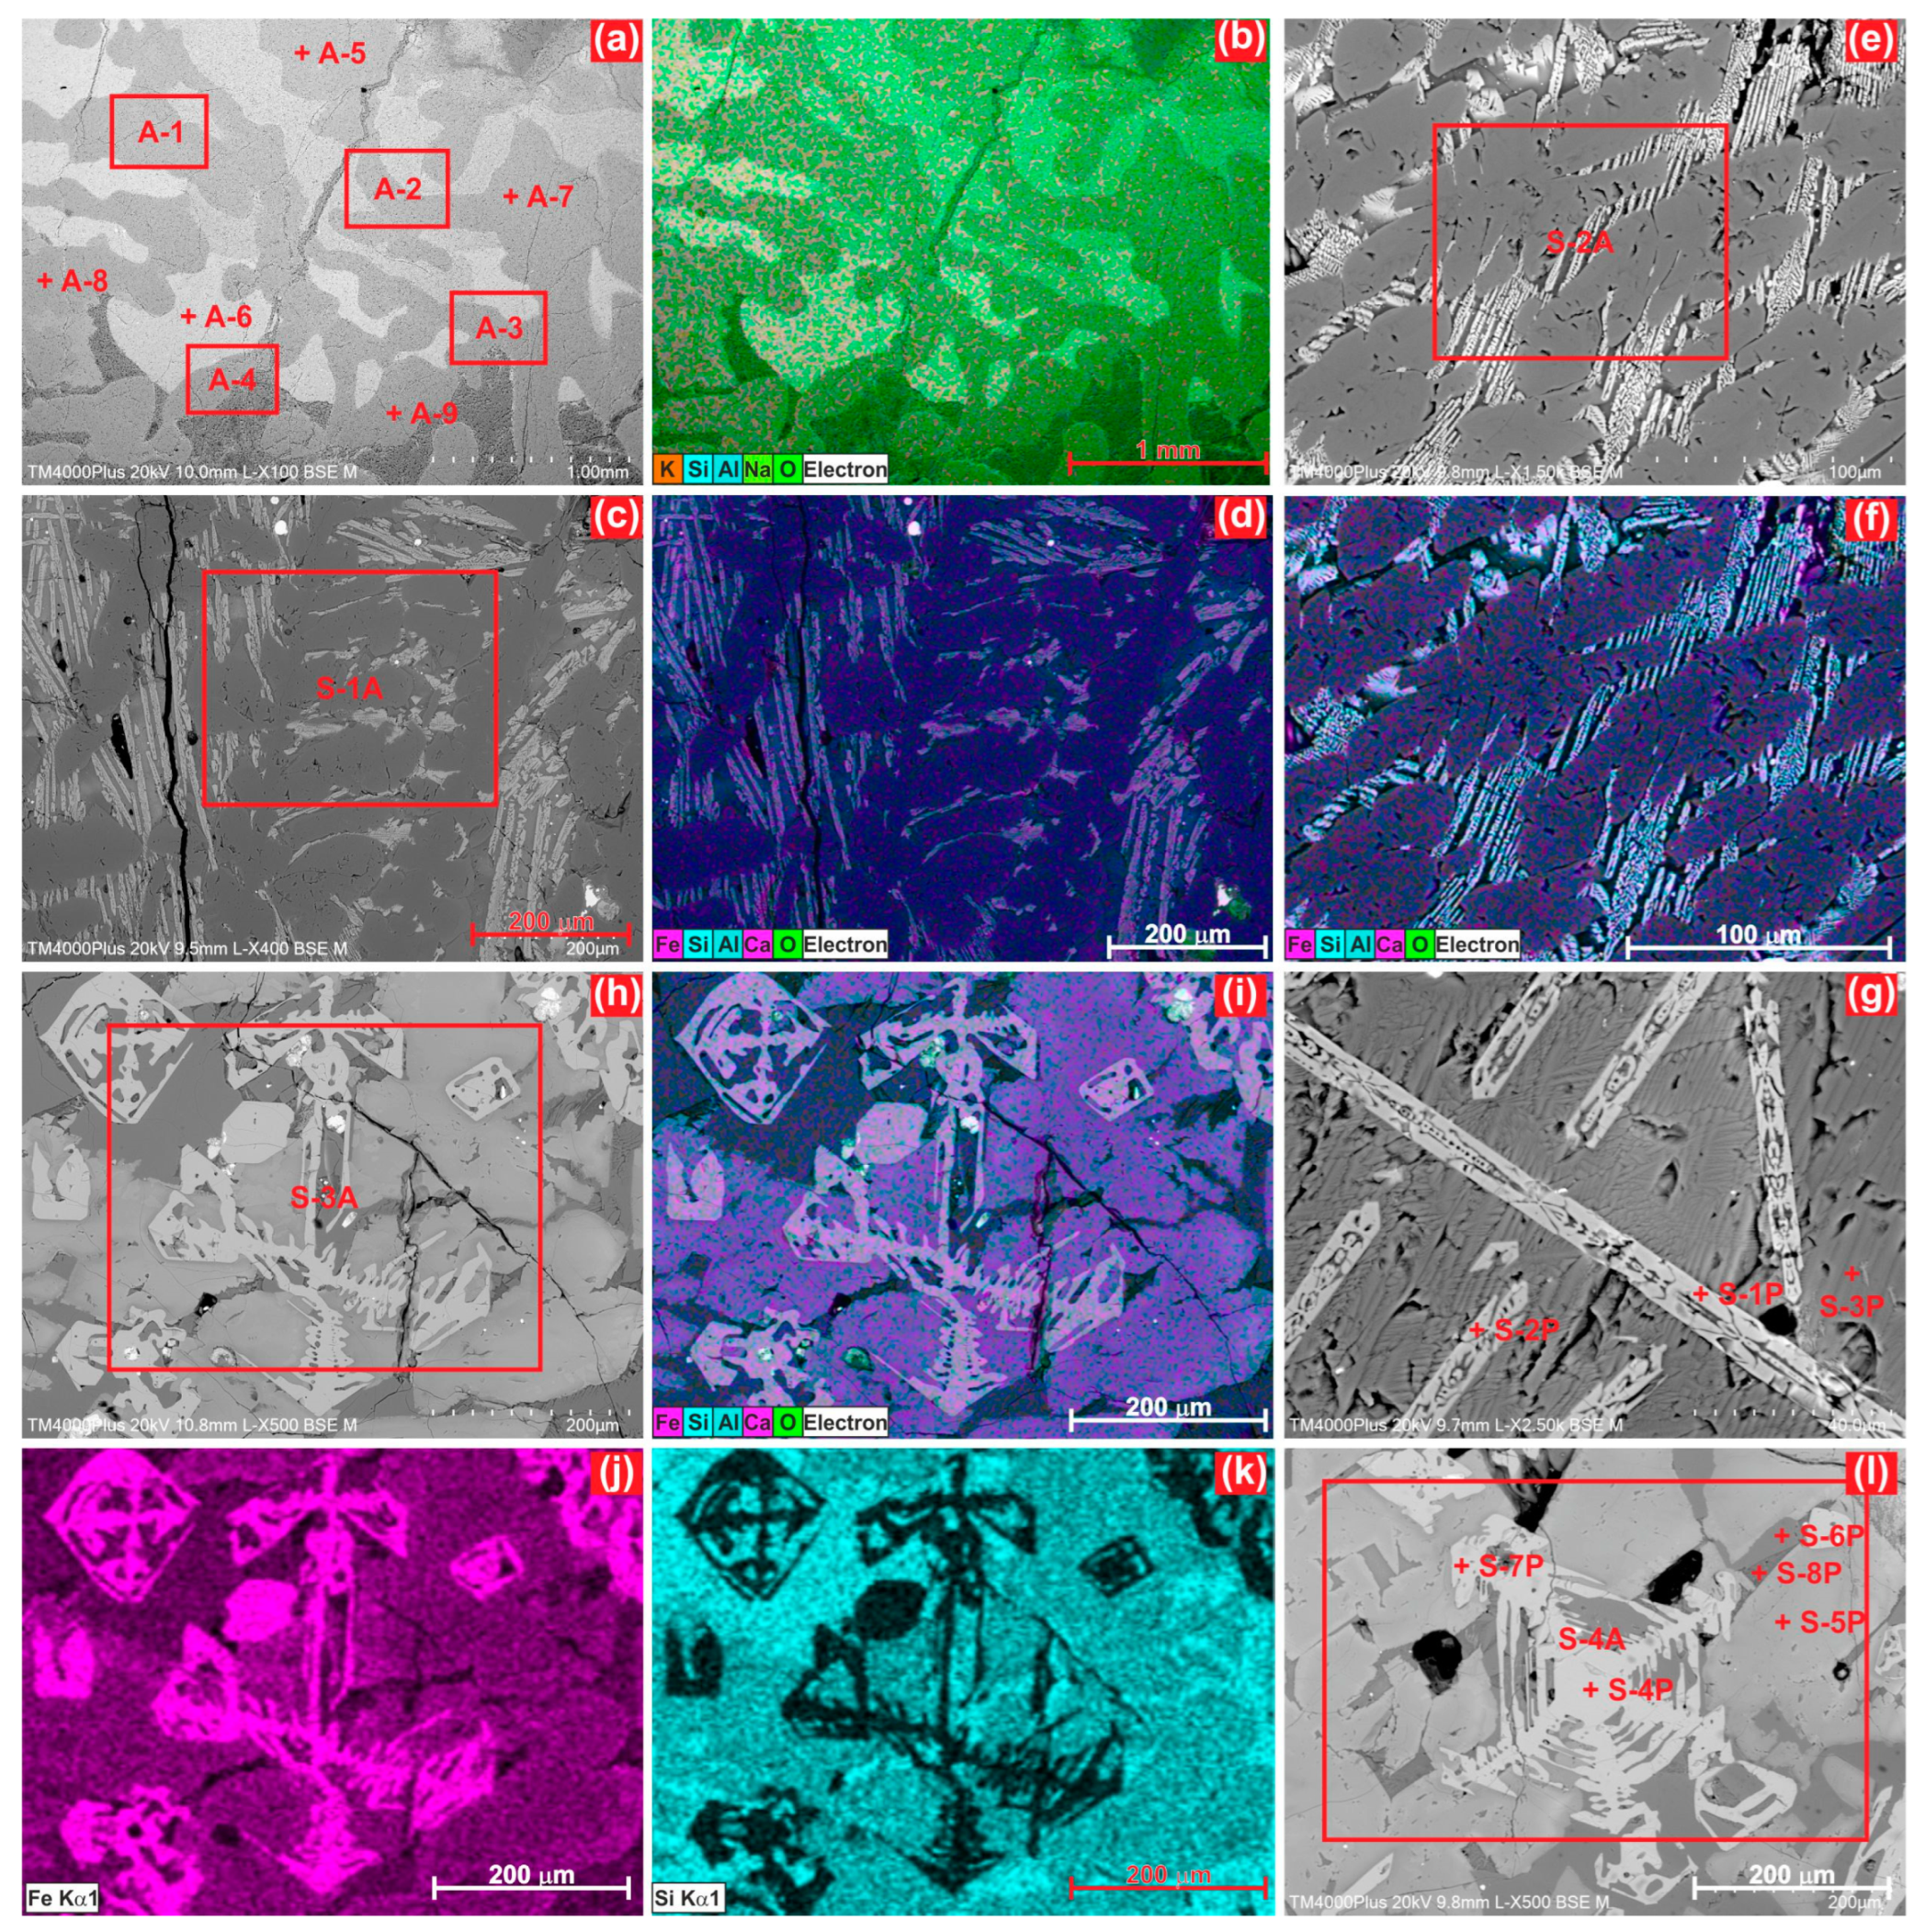
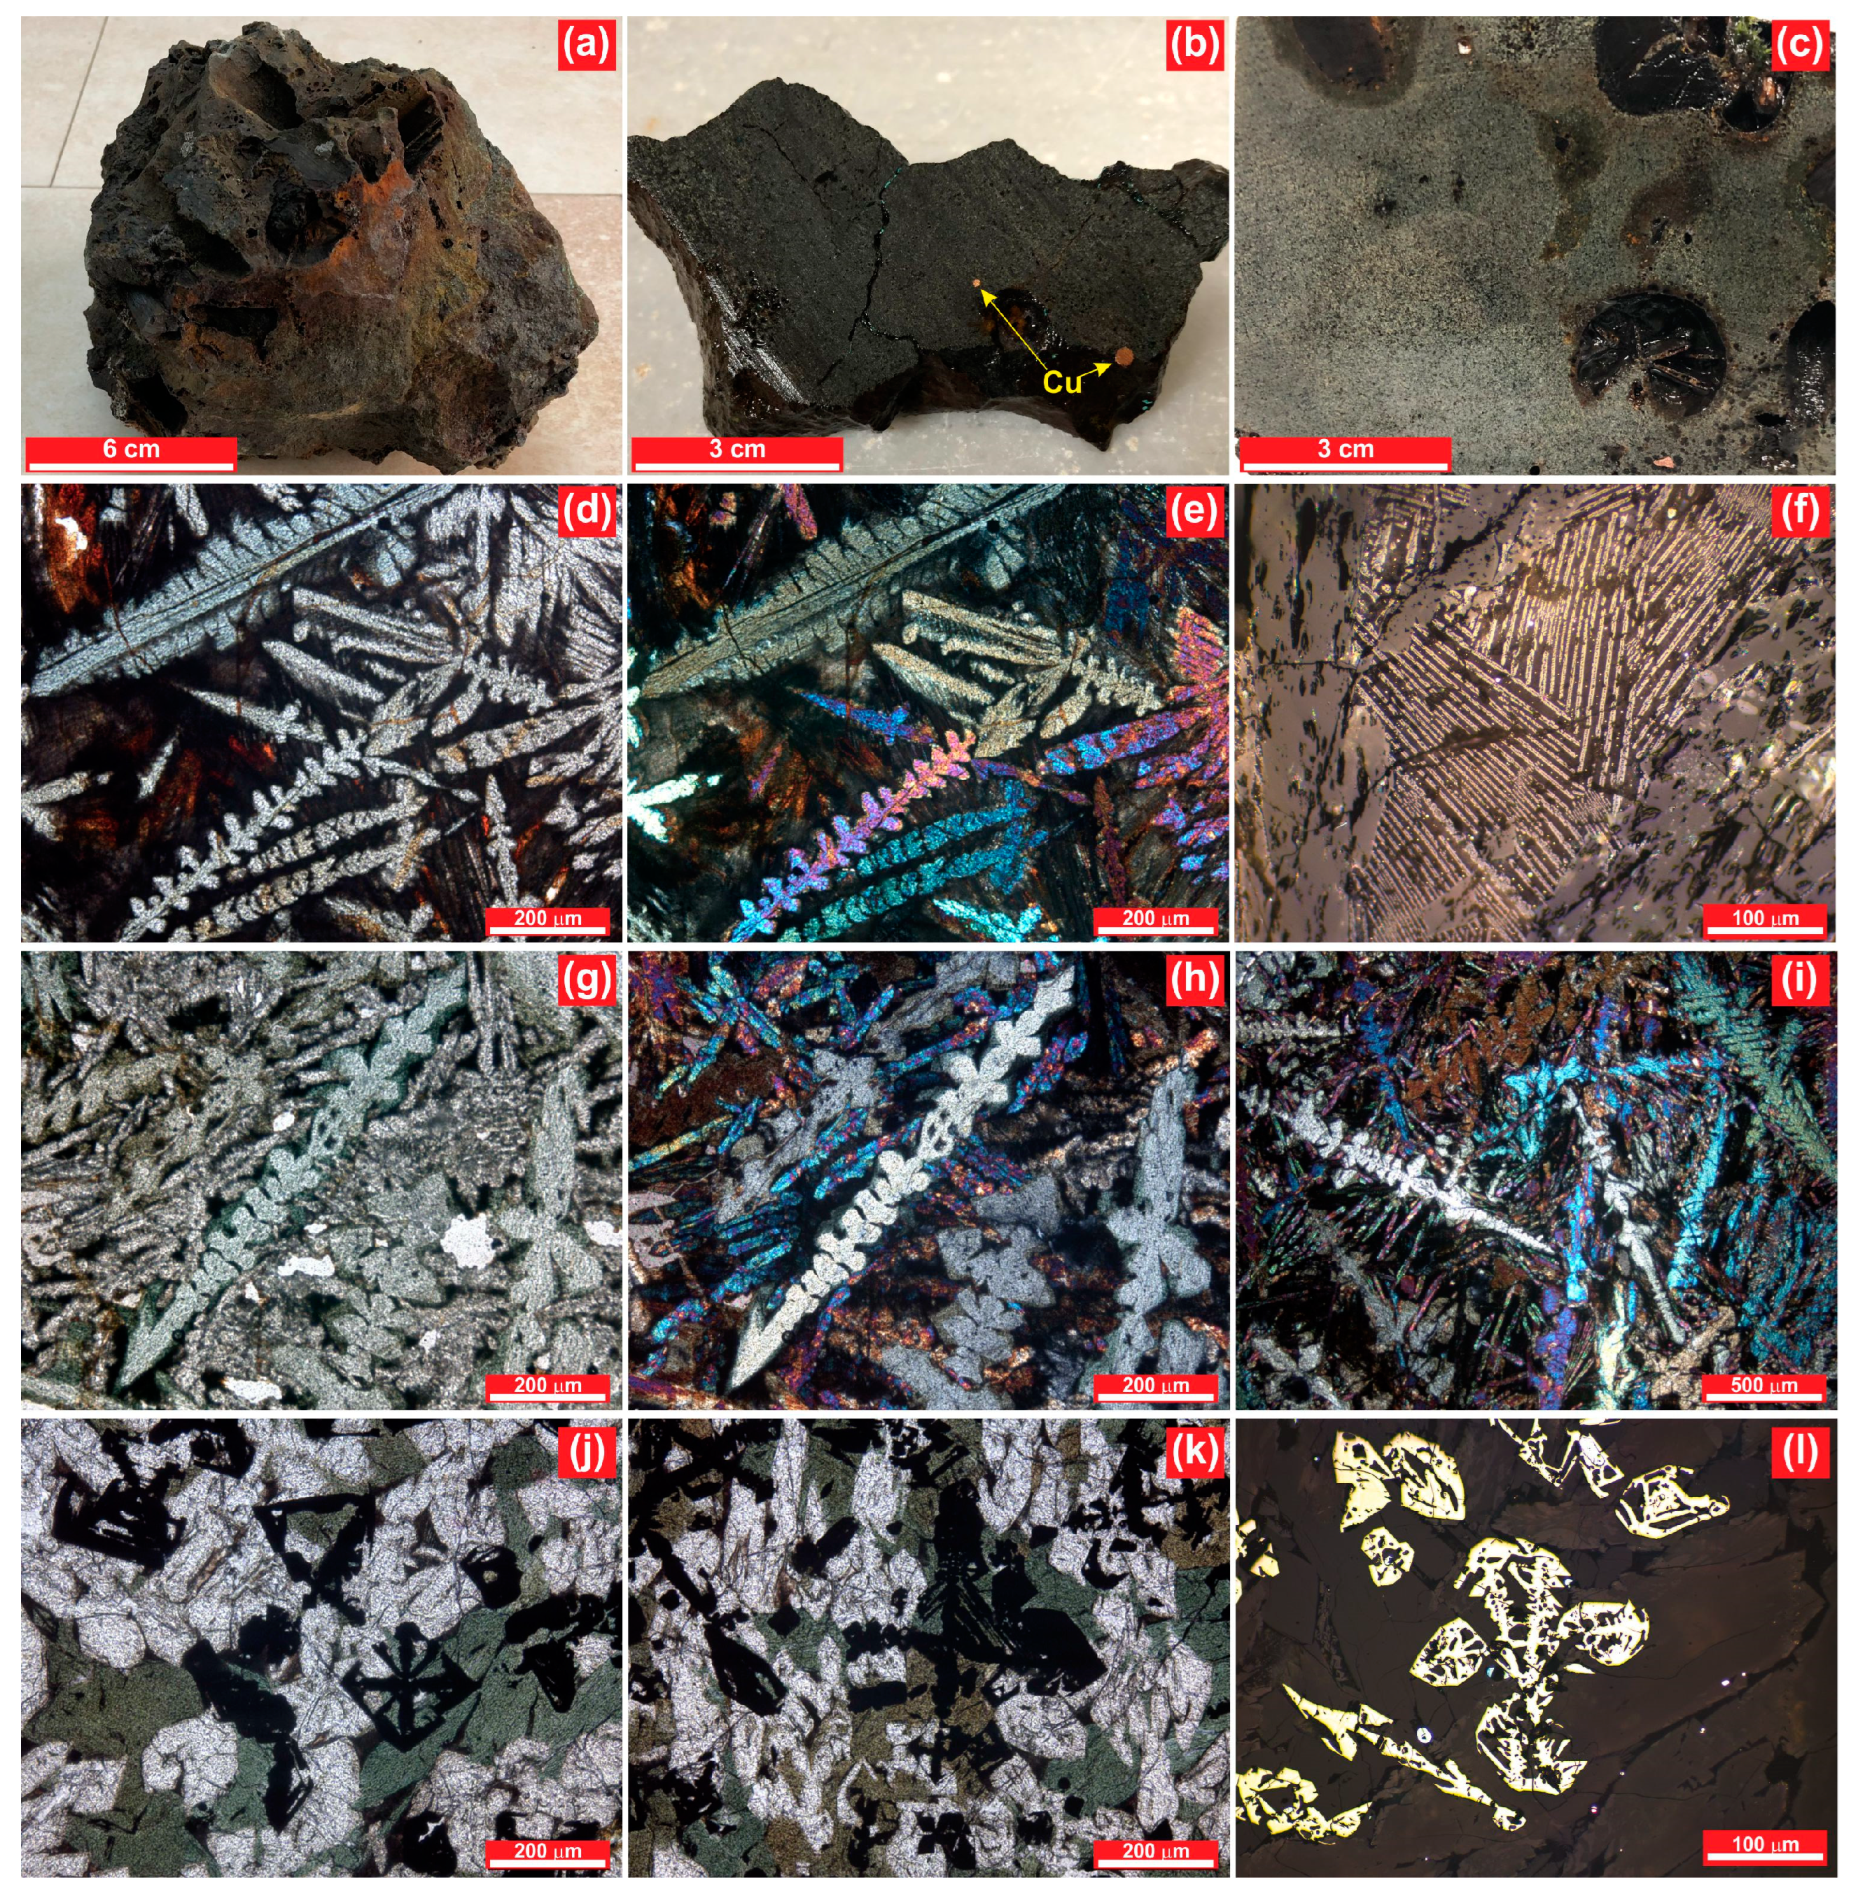
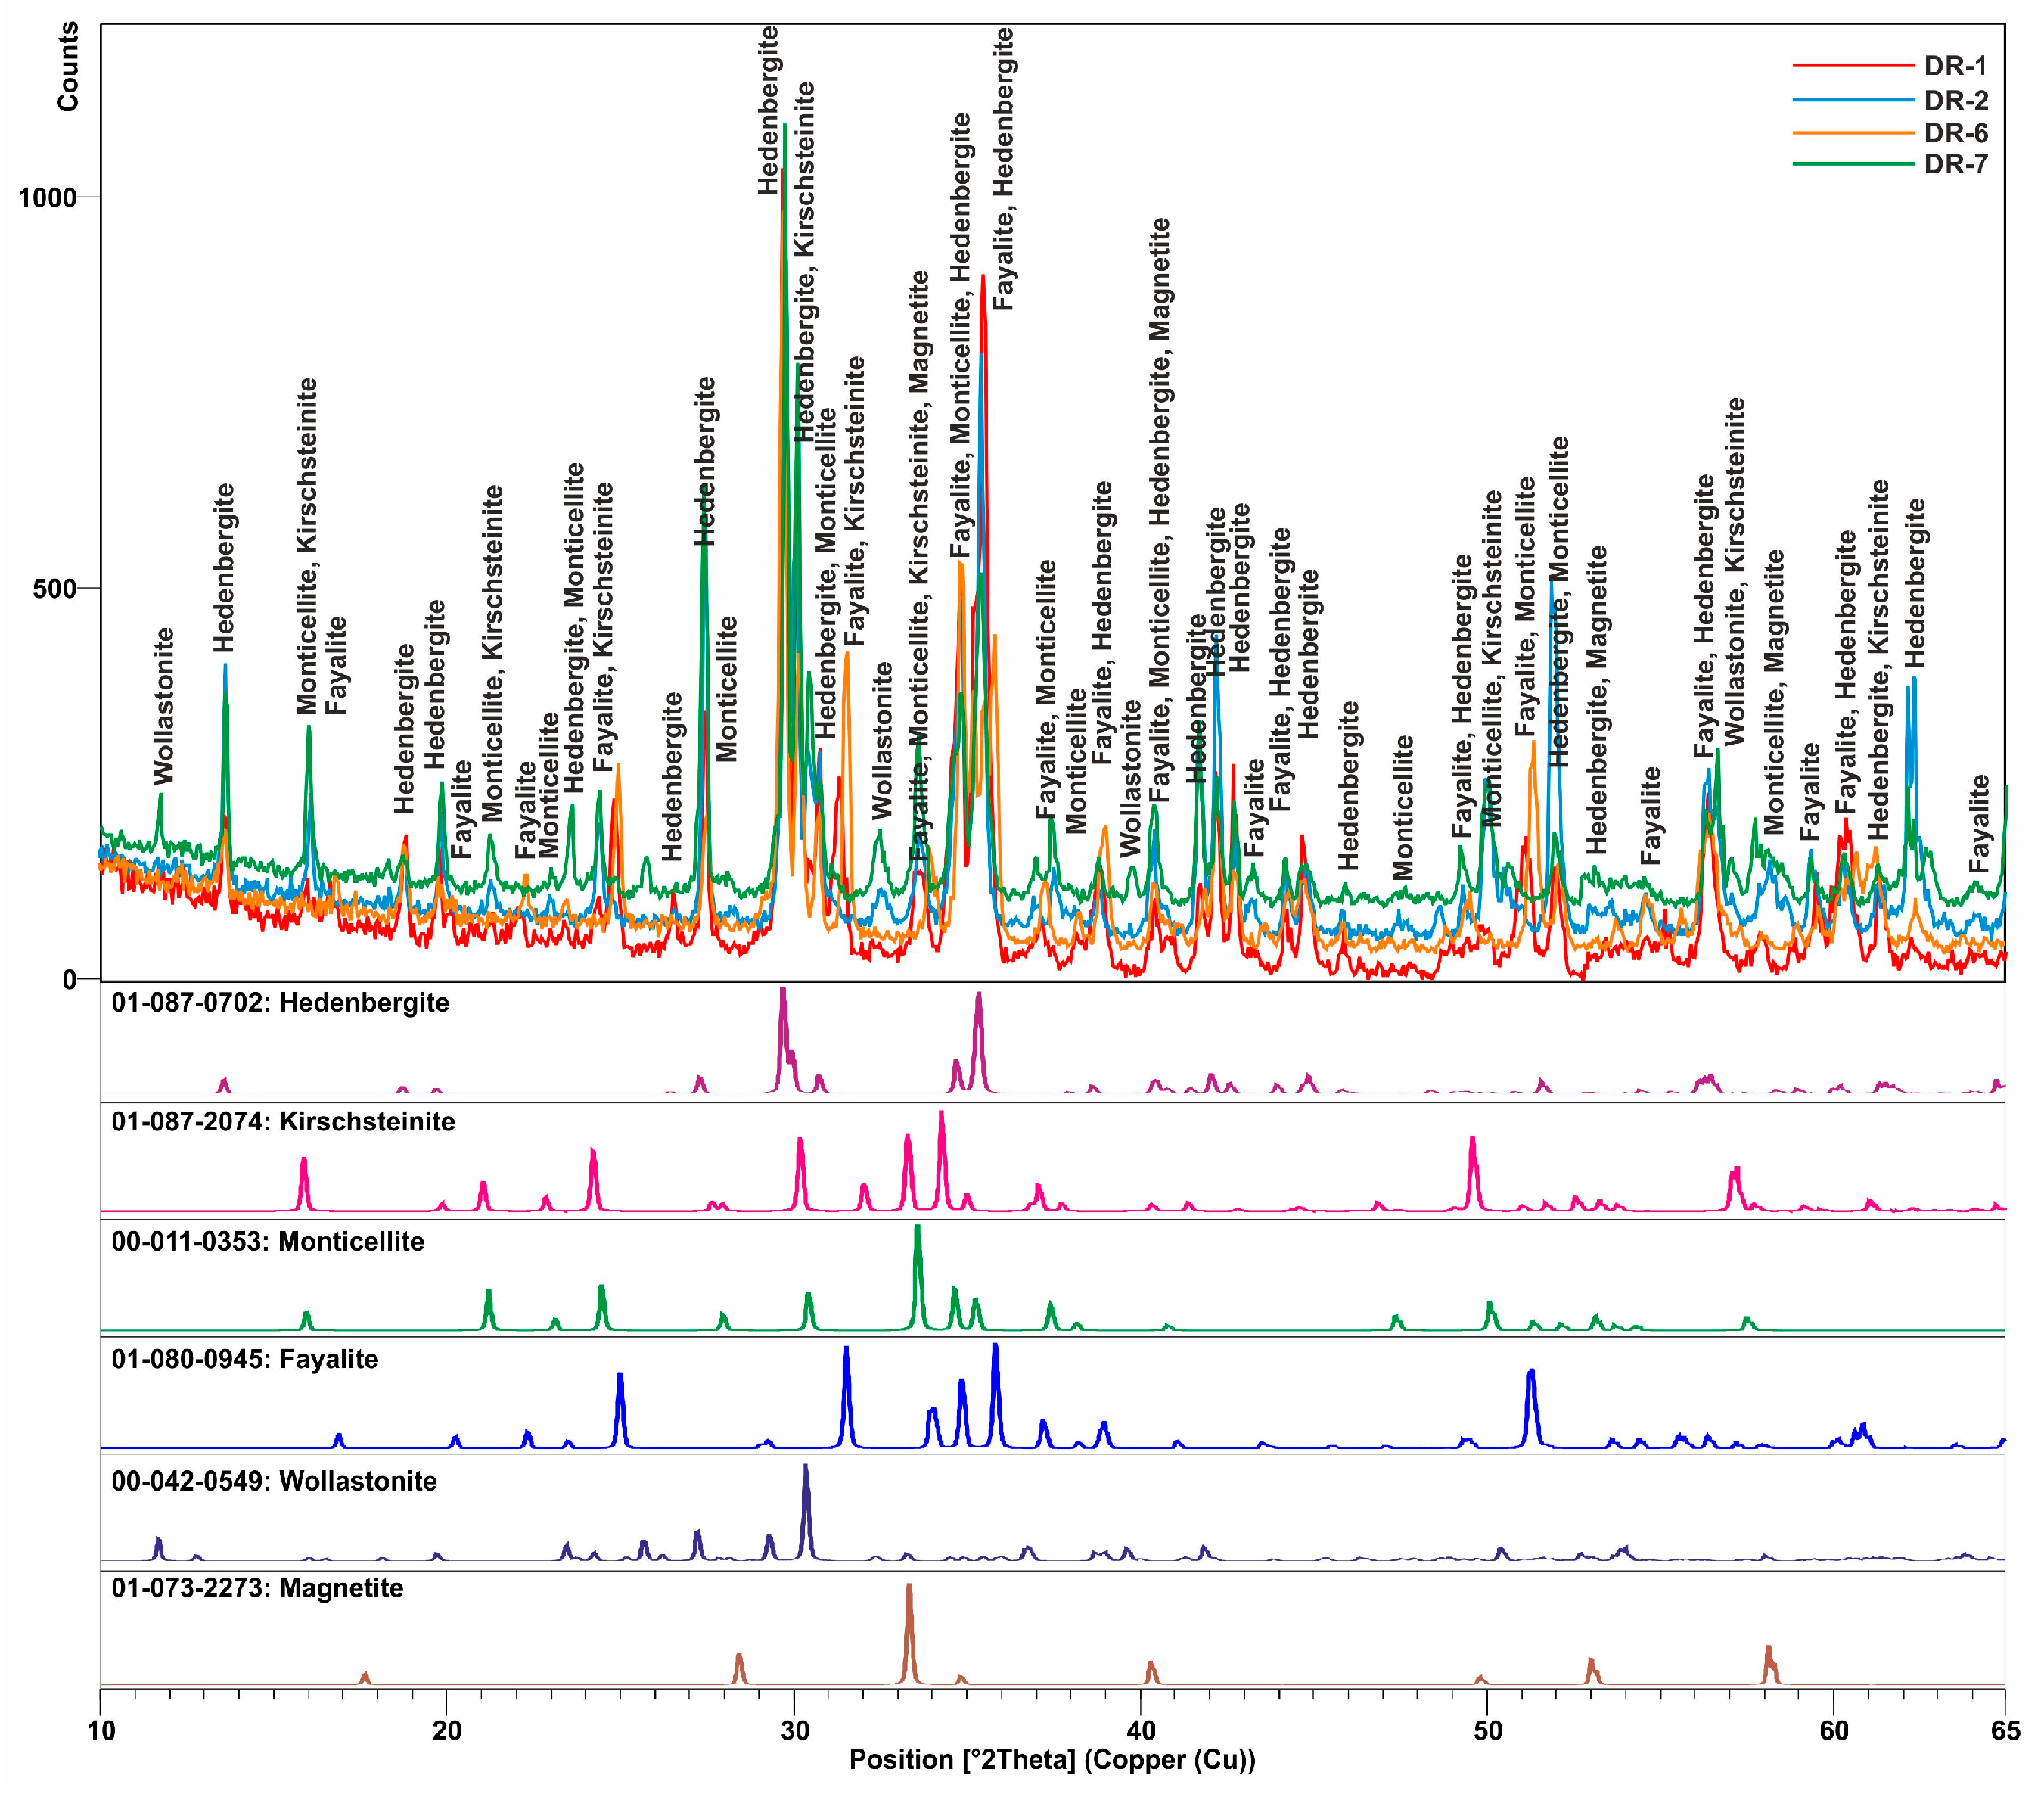
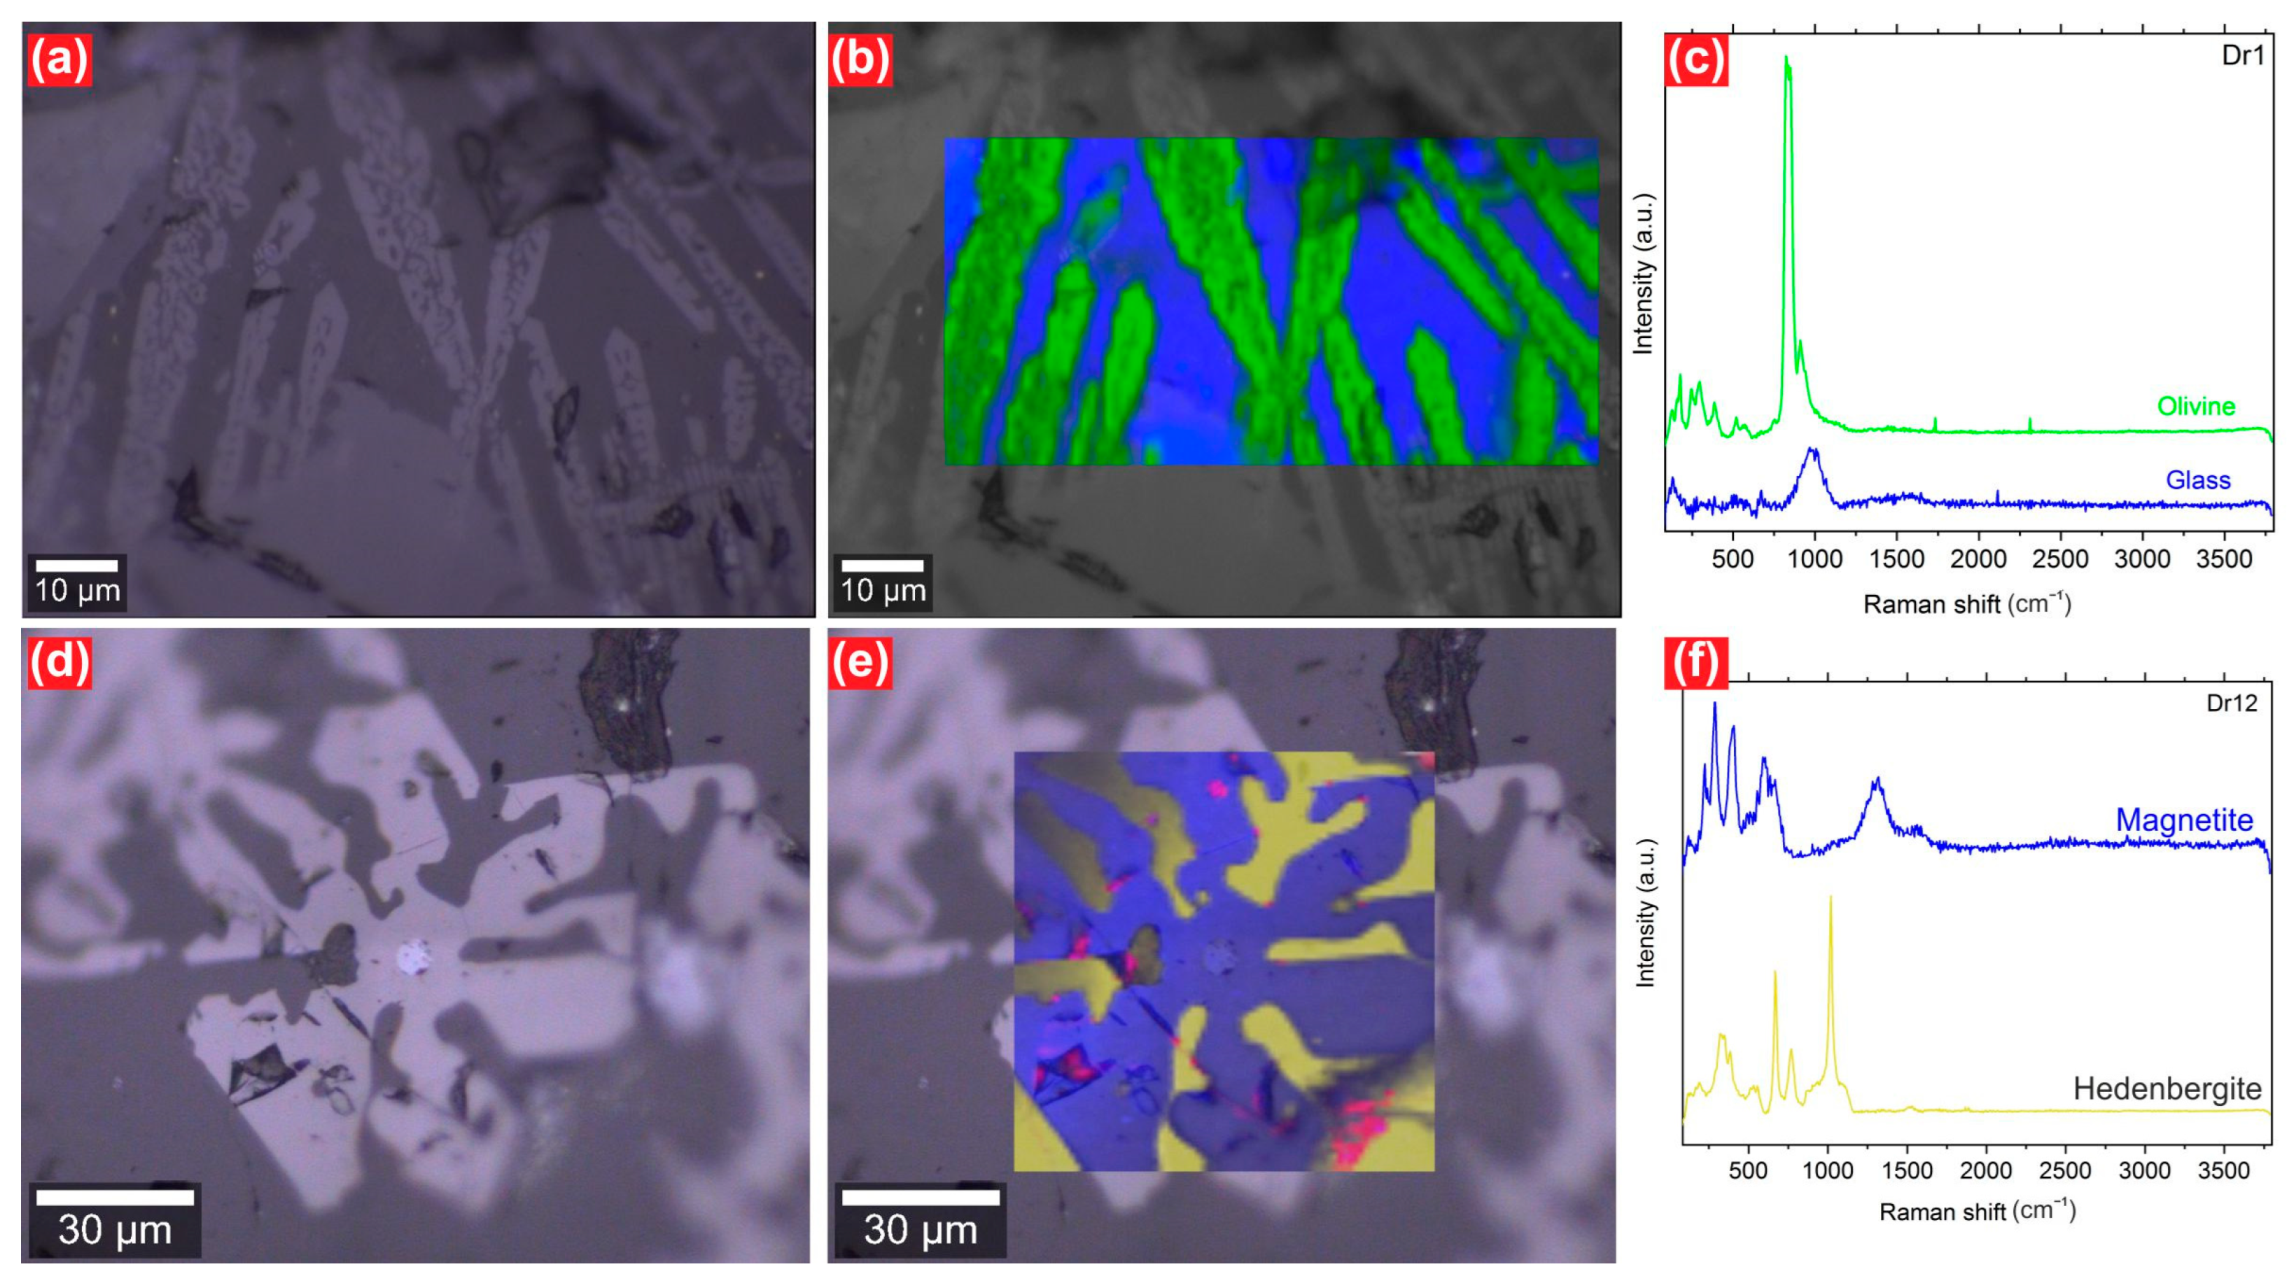
3.1. Mineralogical and Textural Characterization
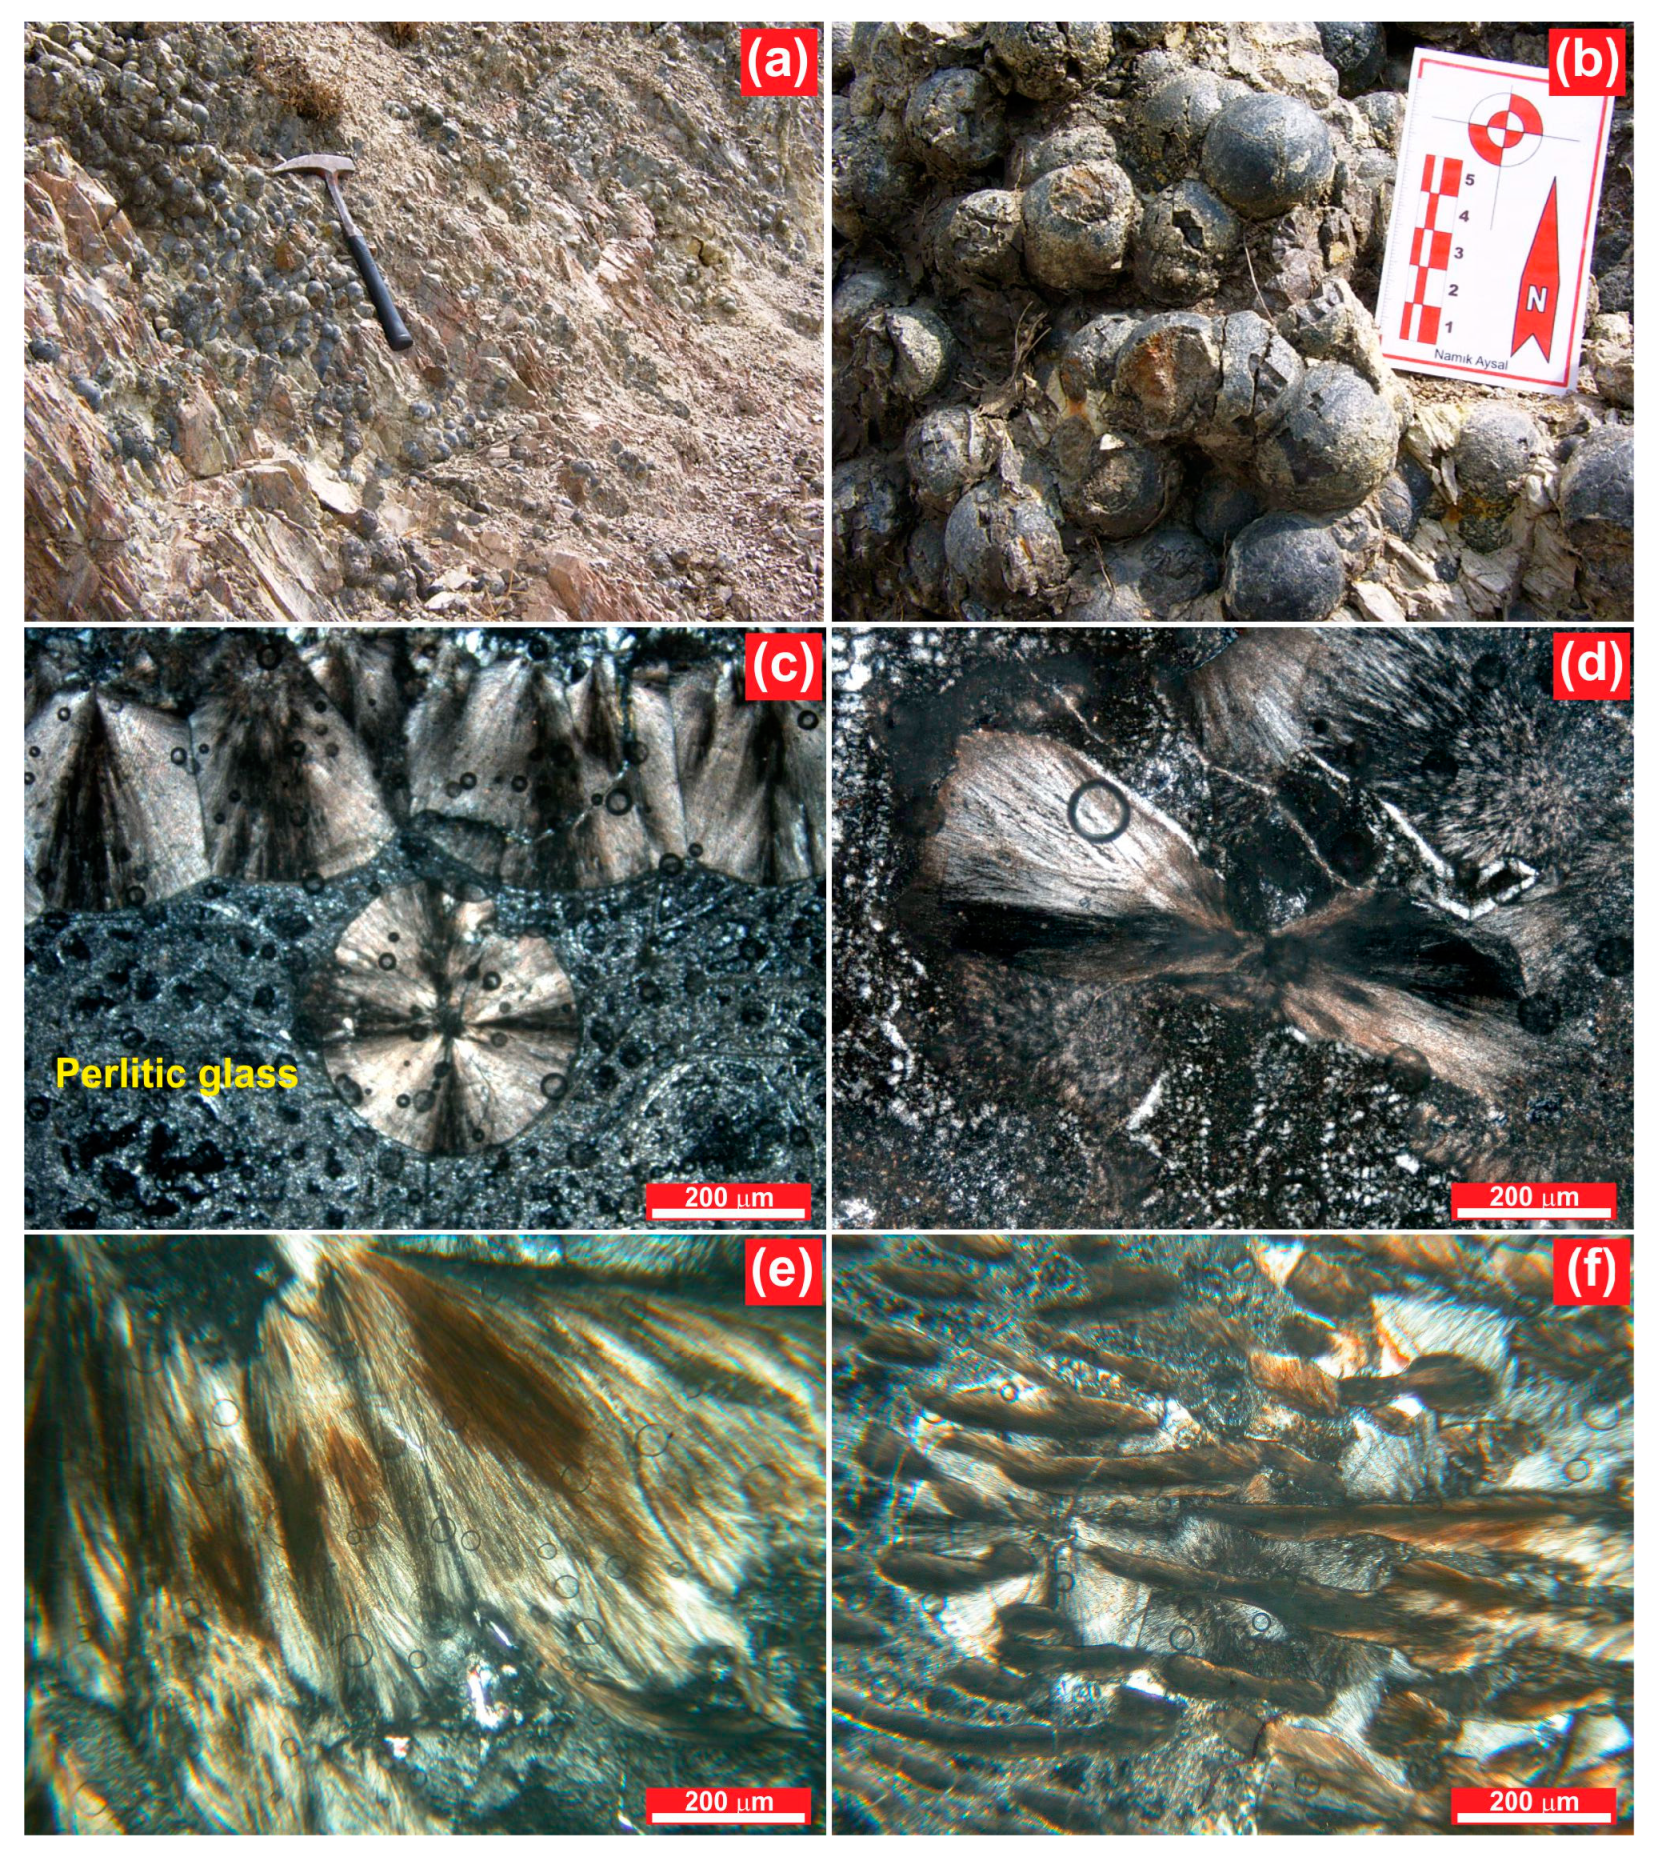
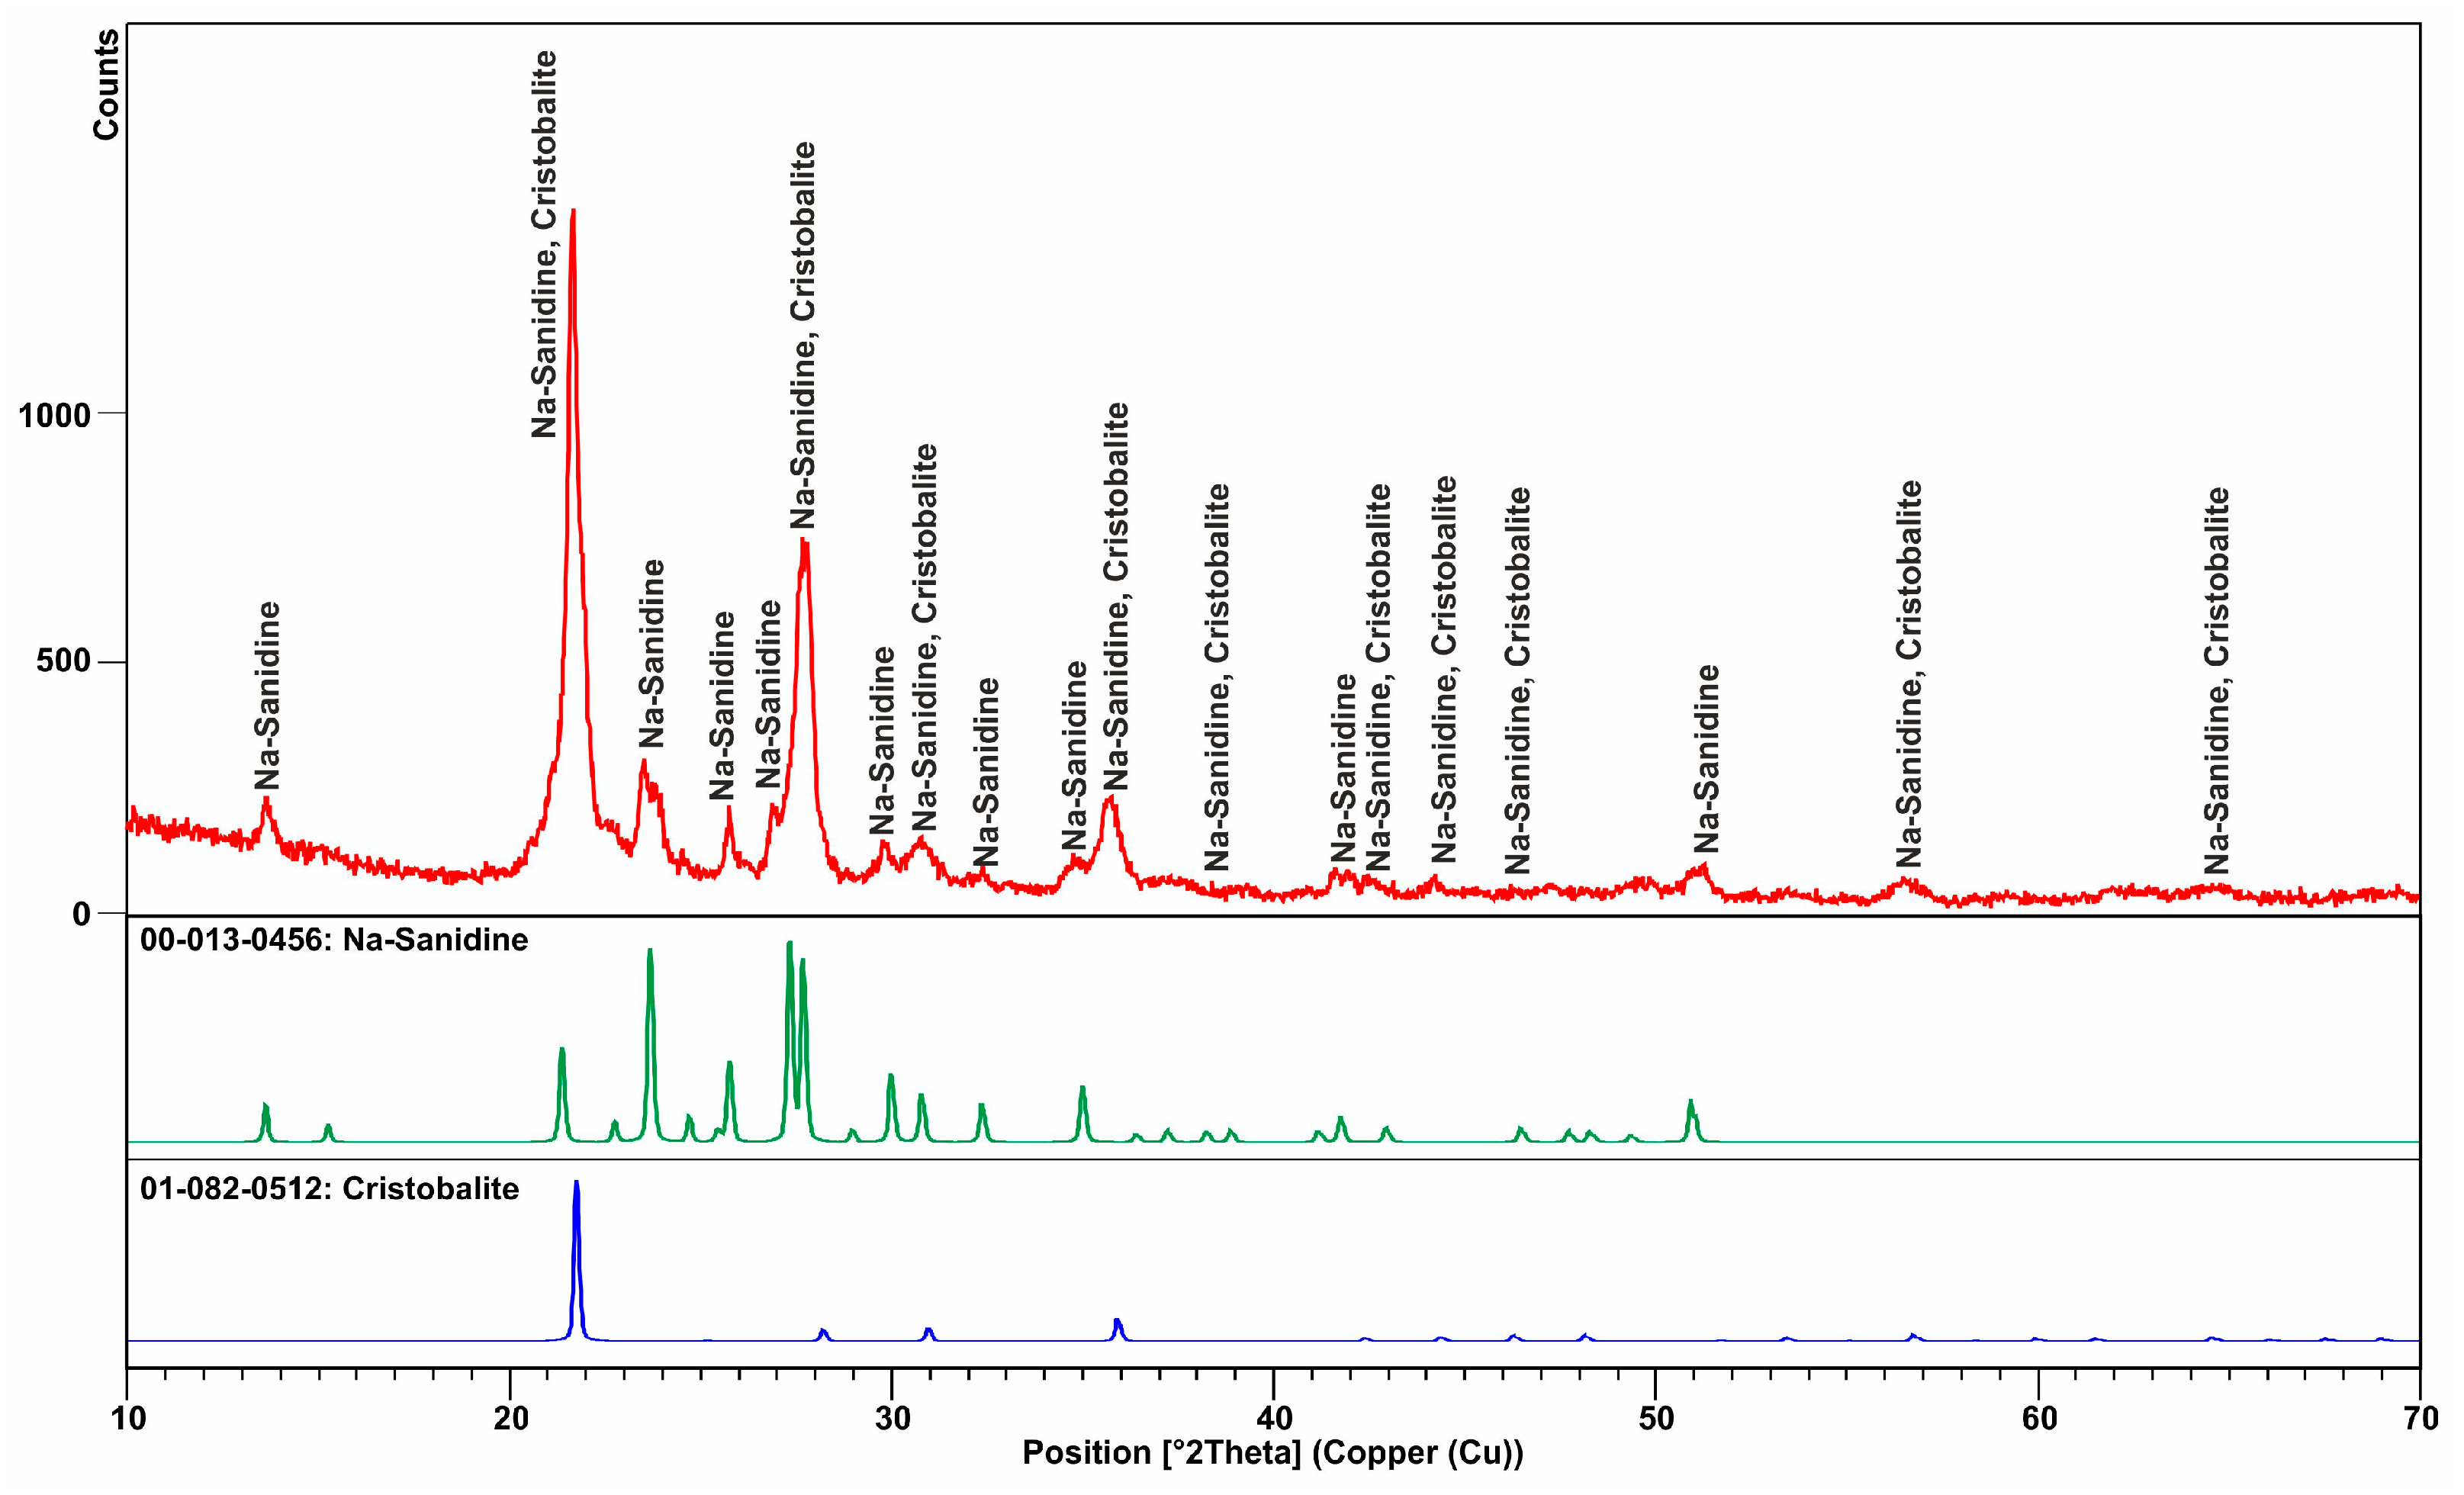
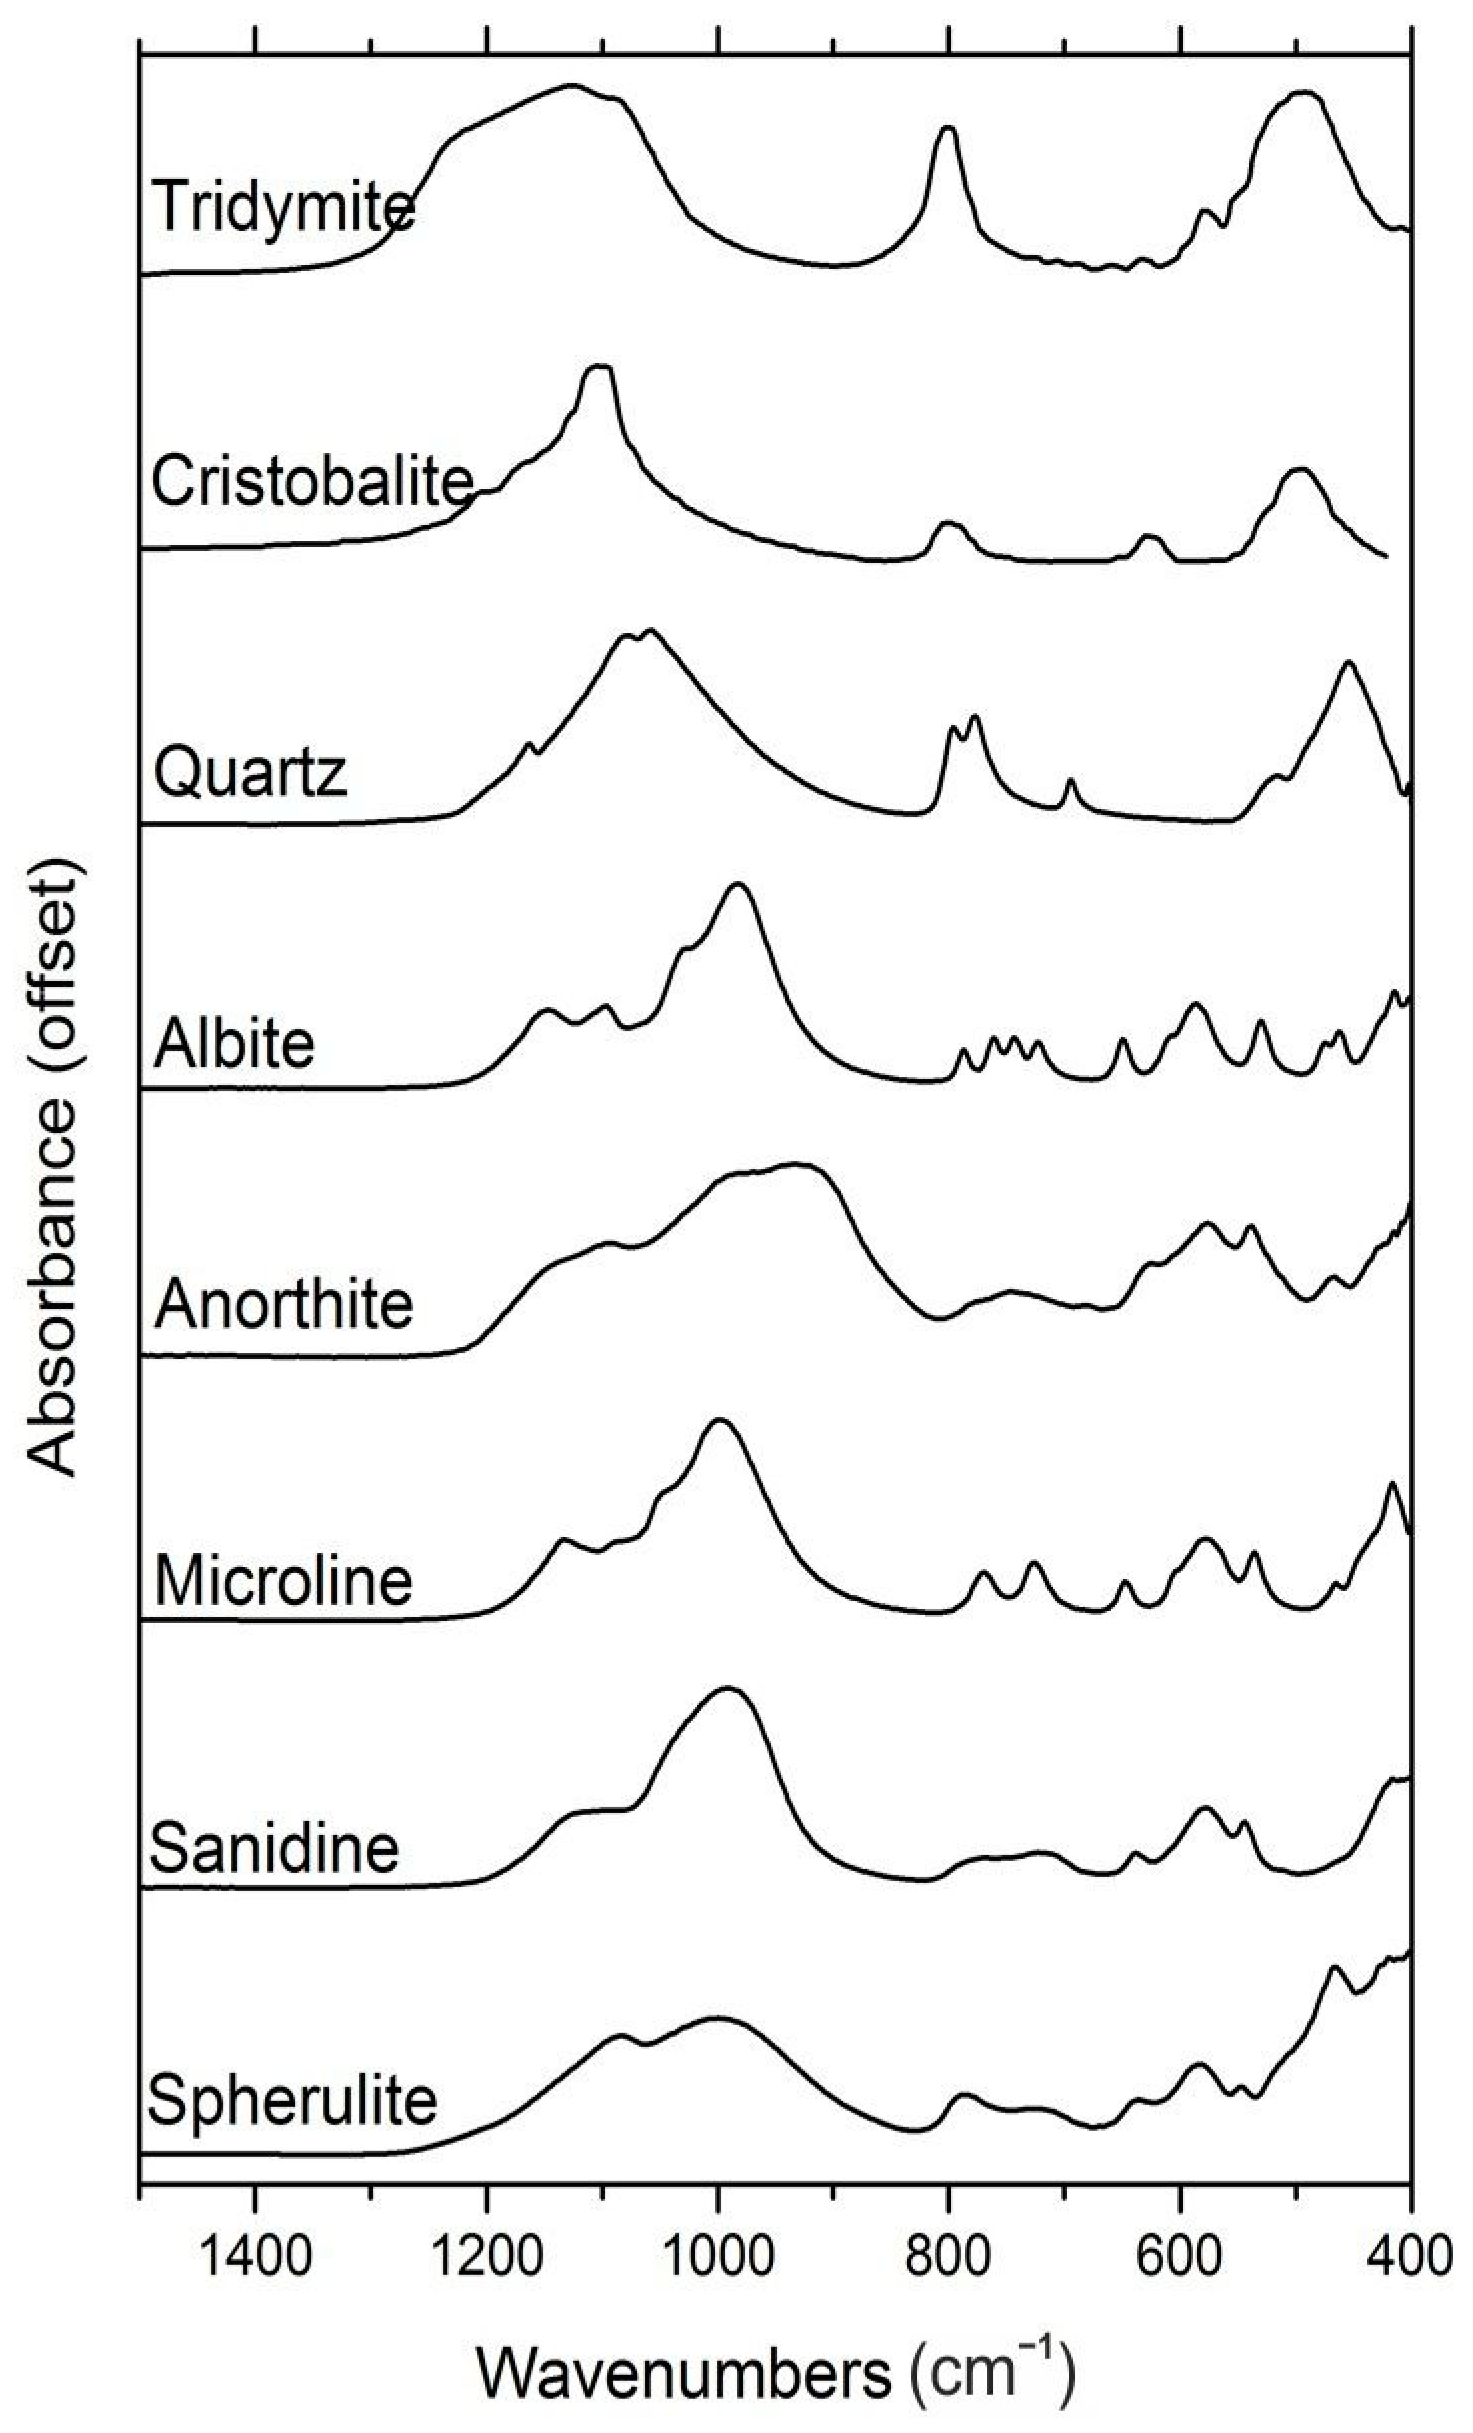
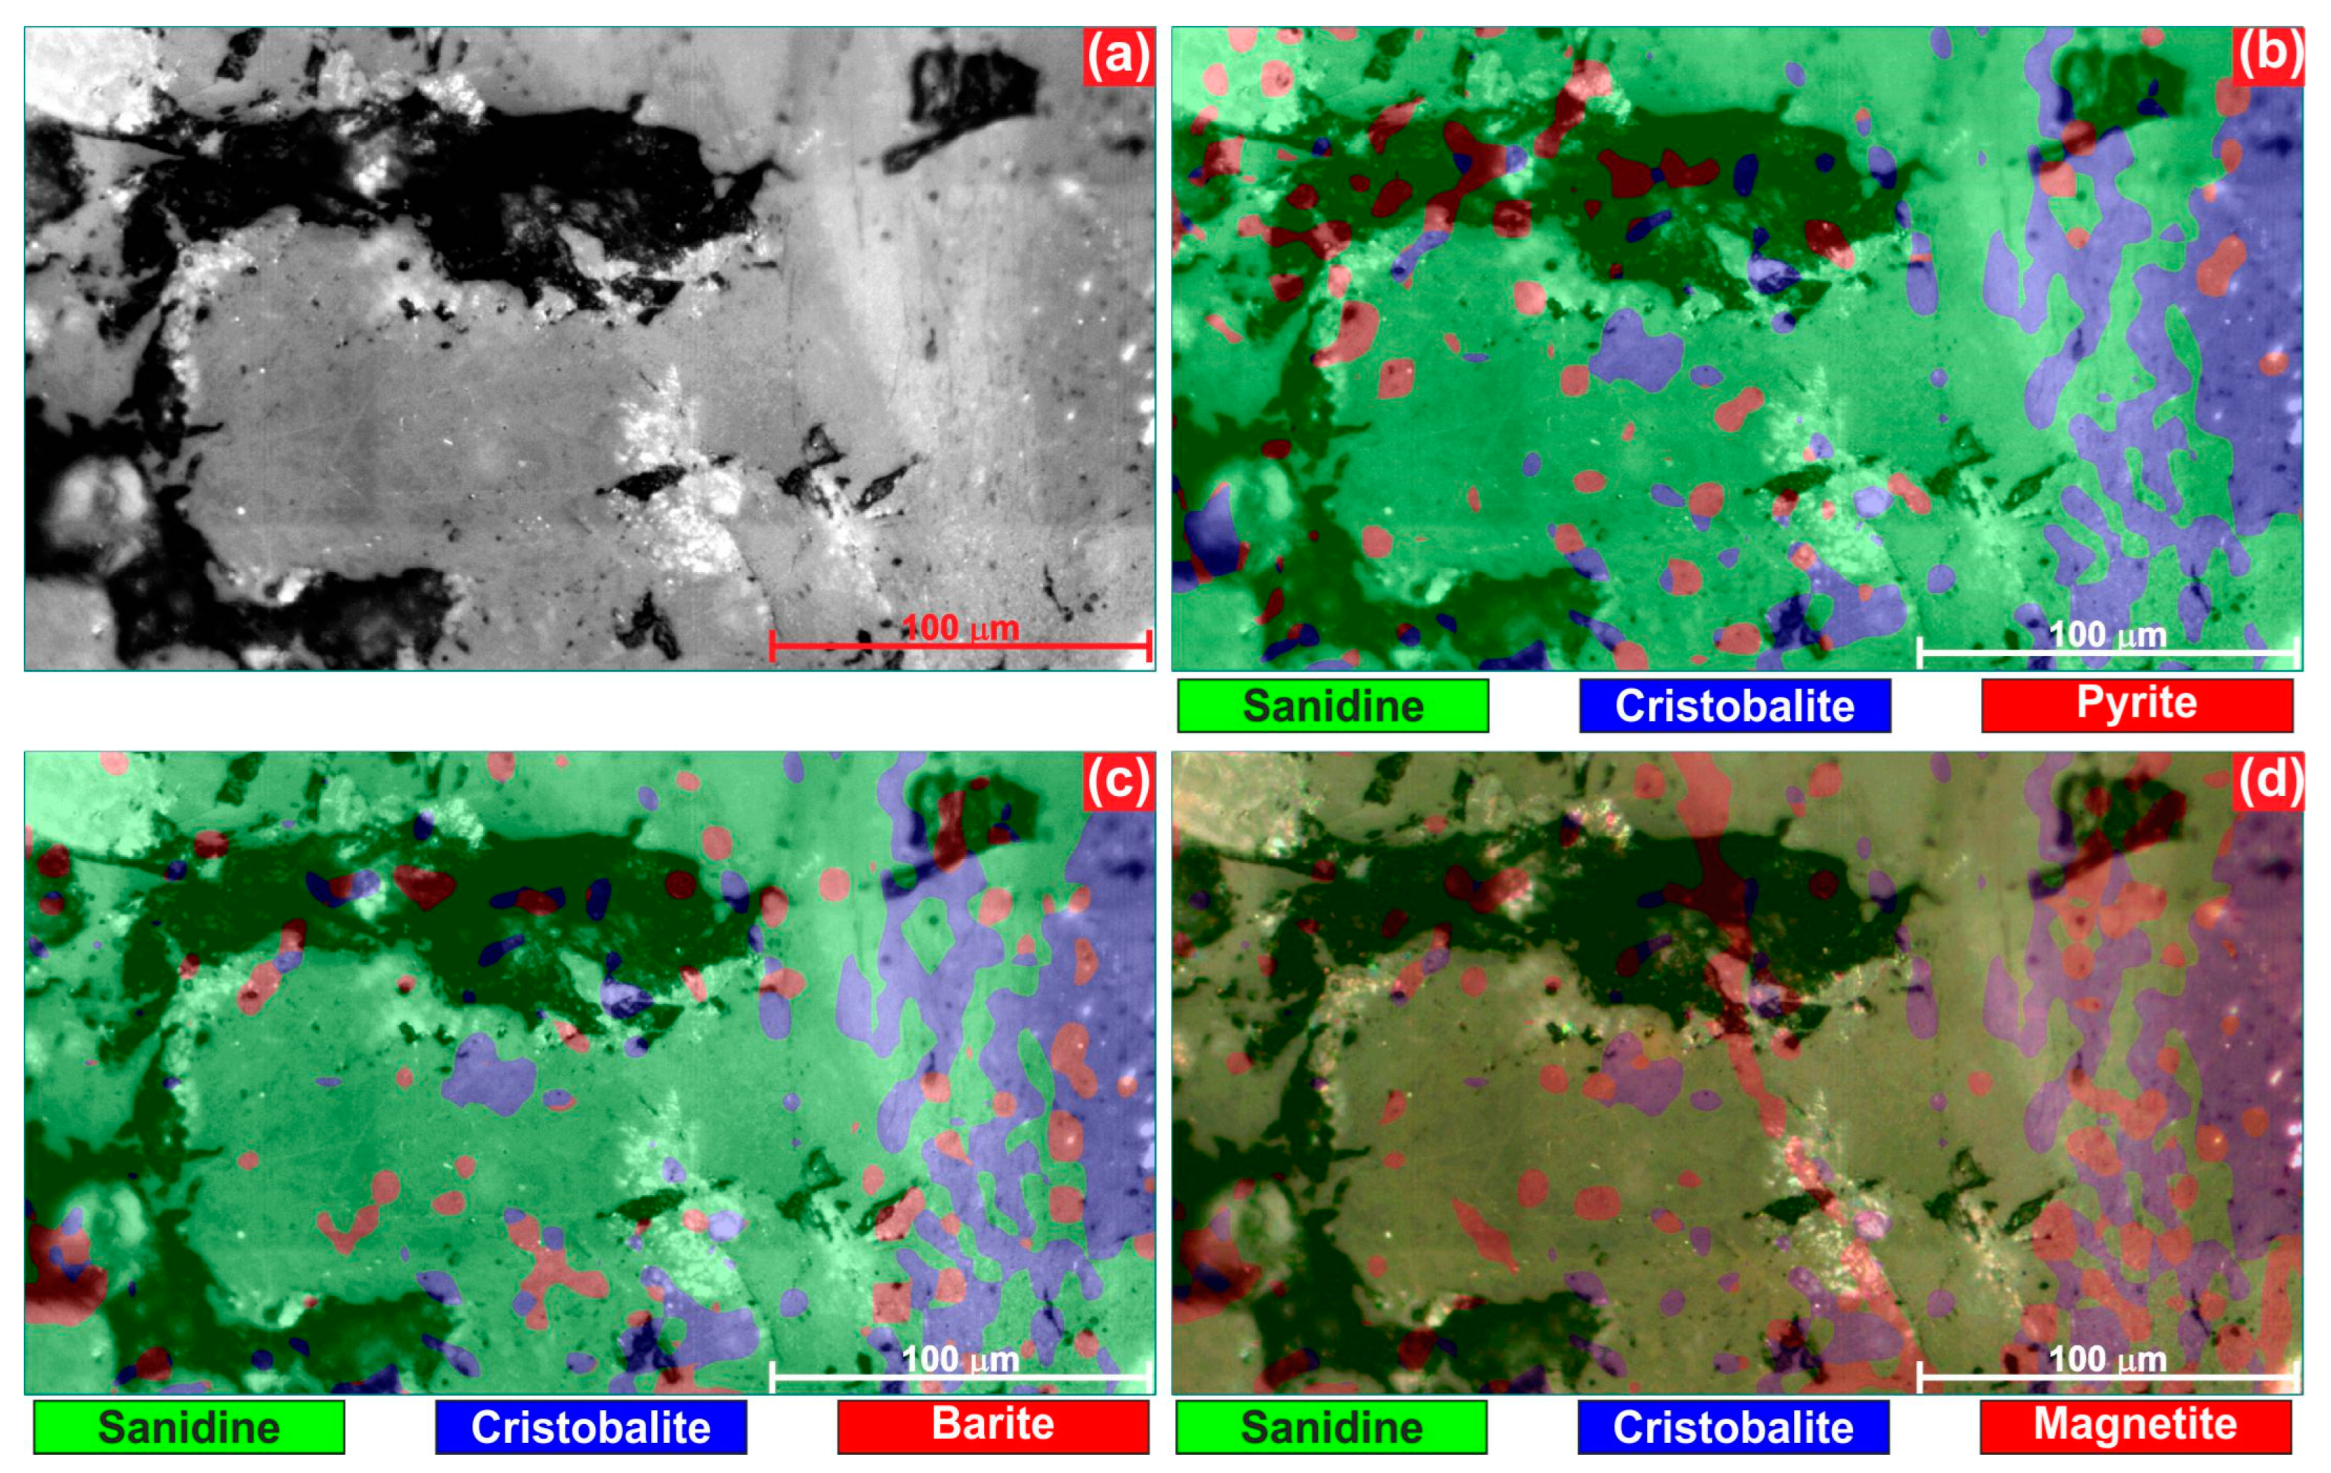
3.1.1. Spherulite
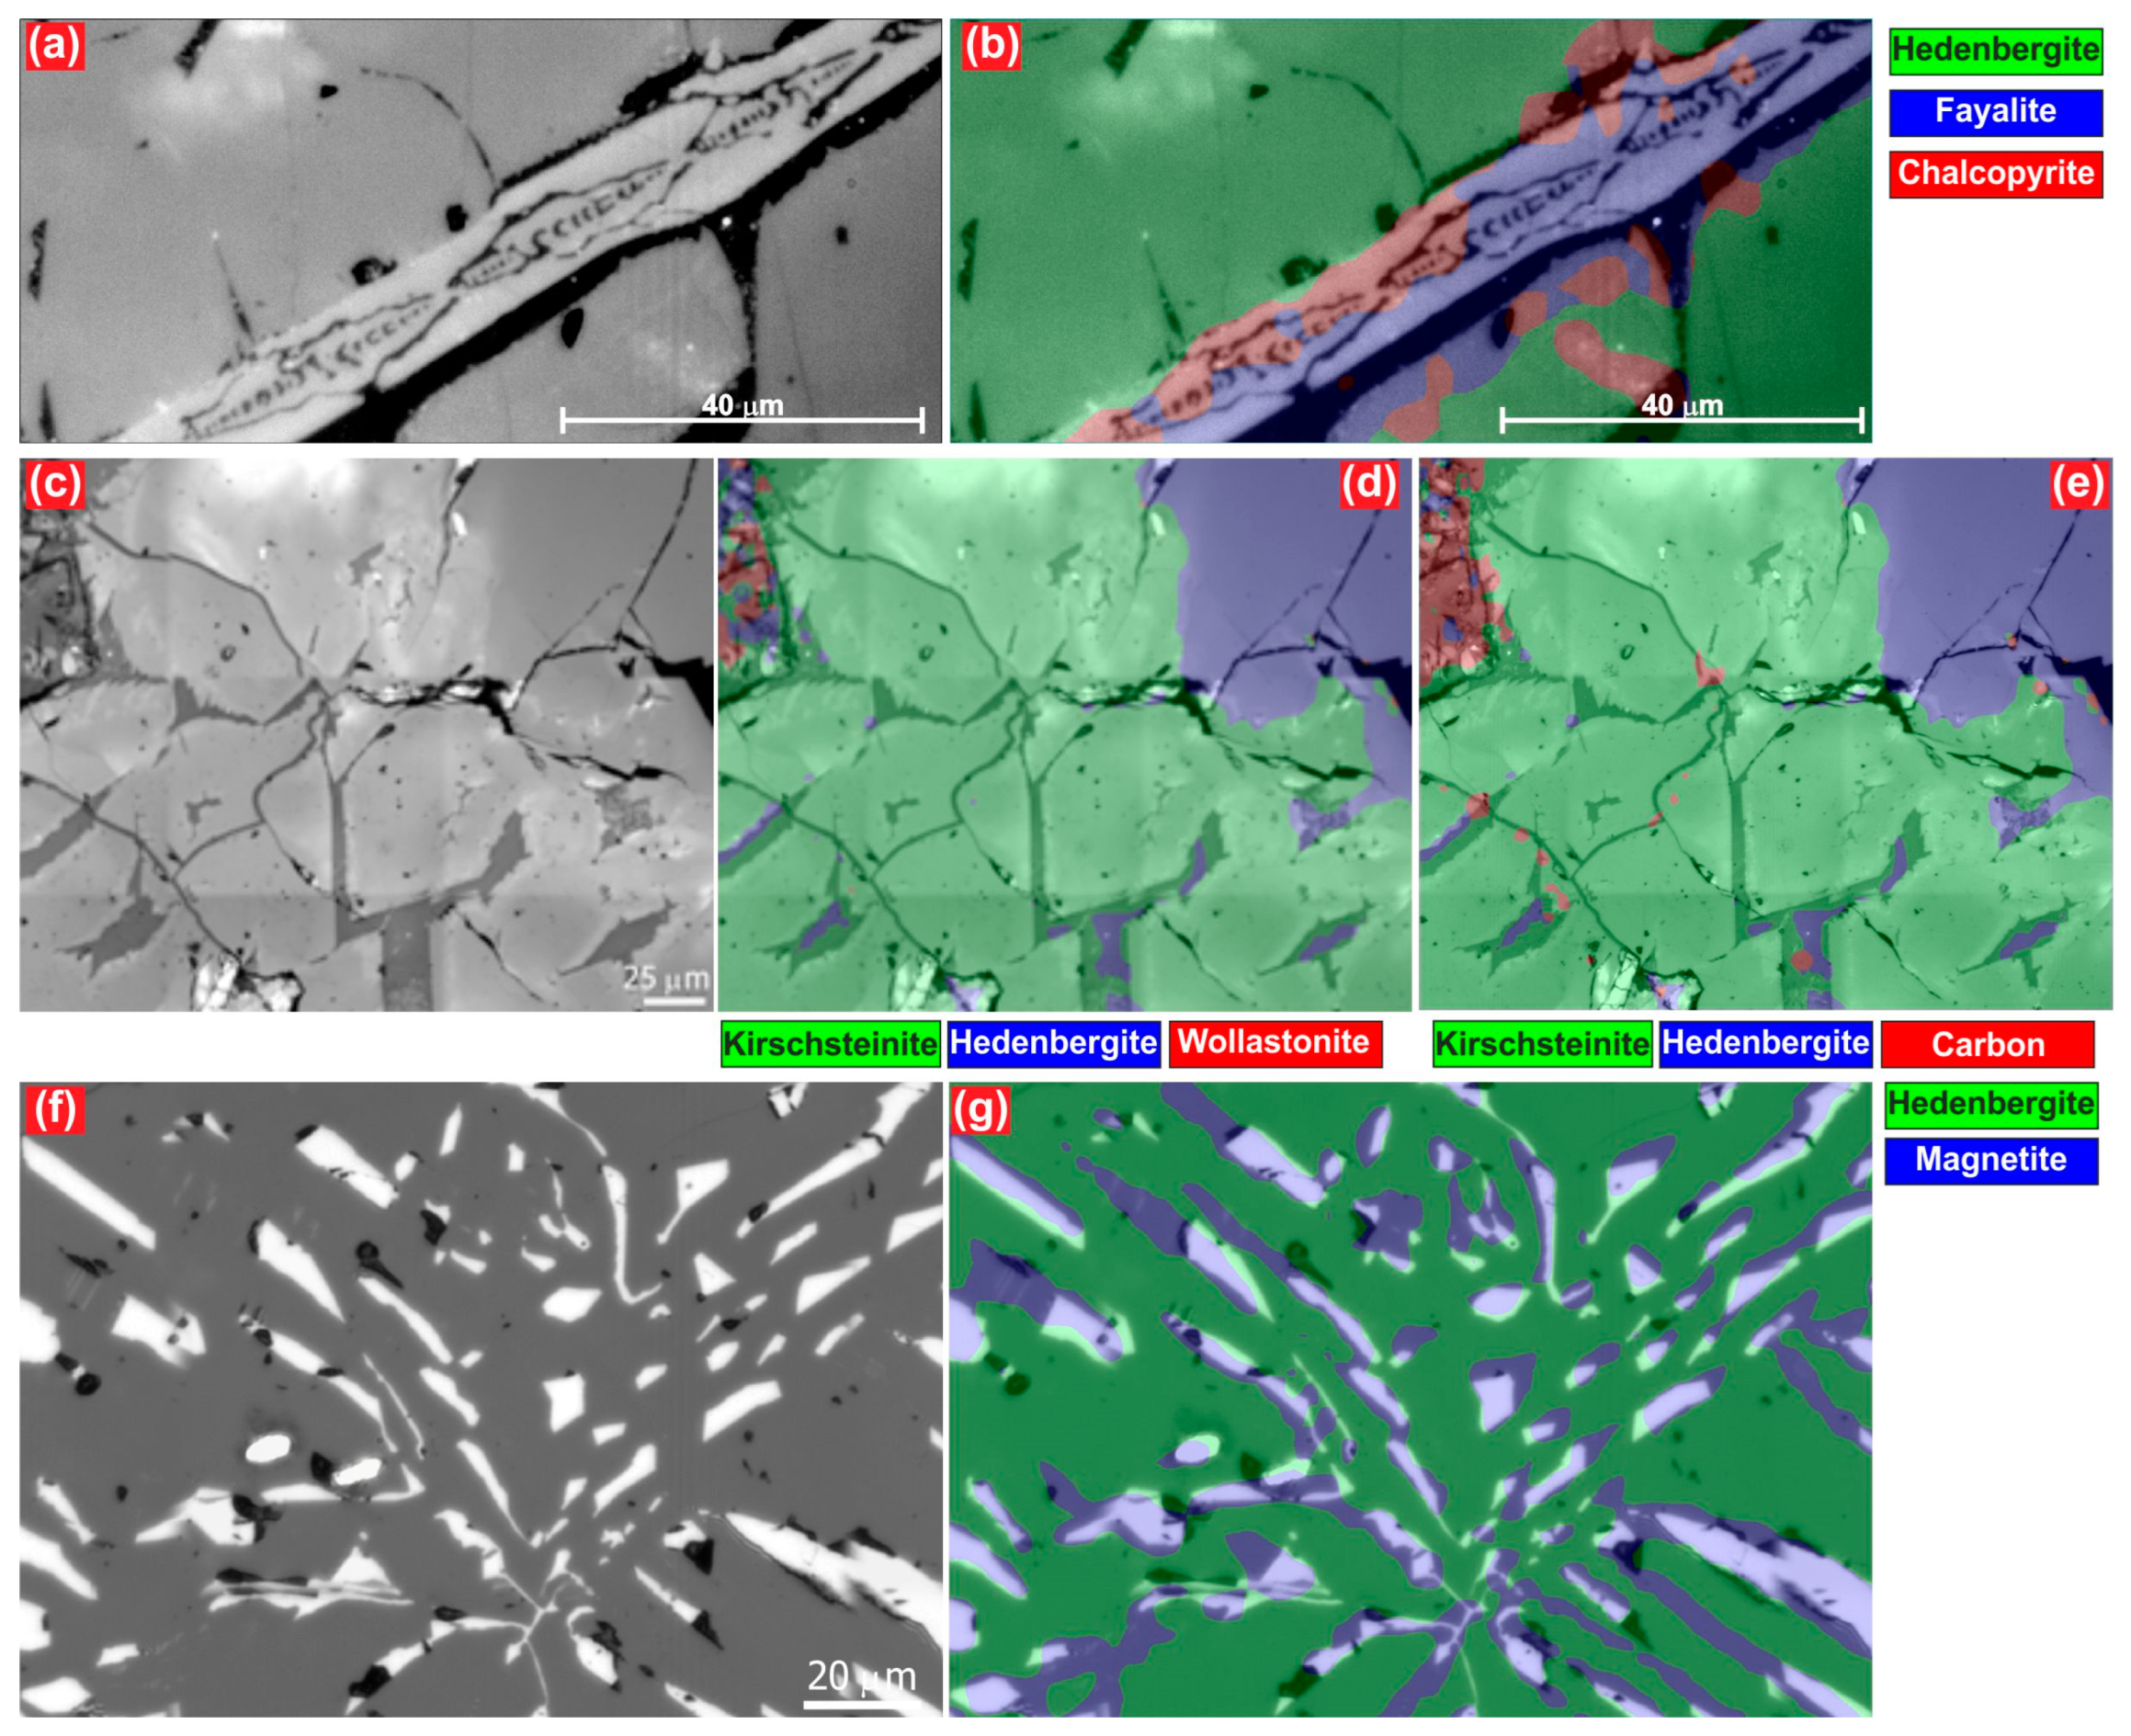
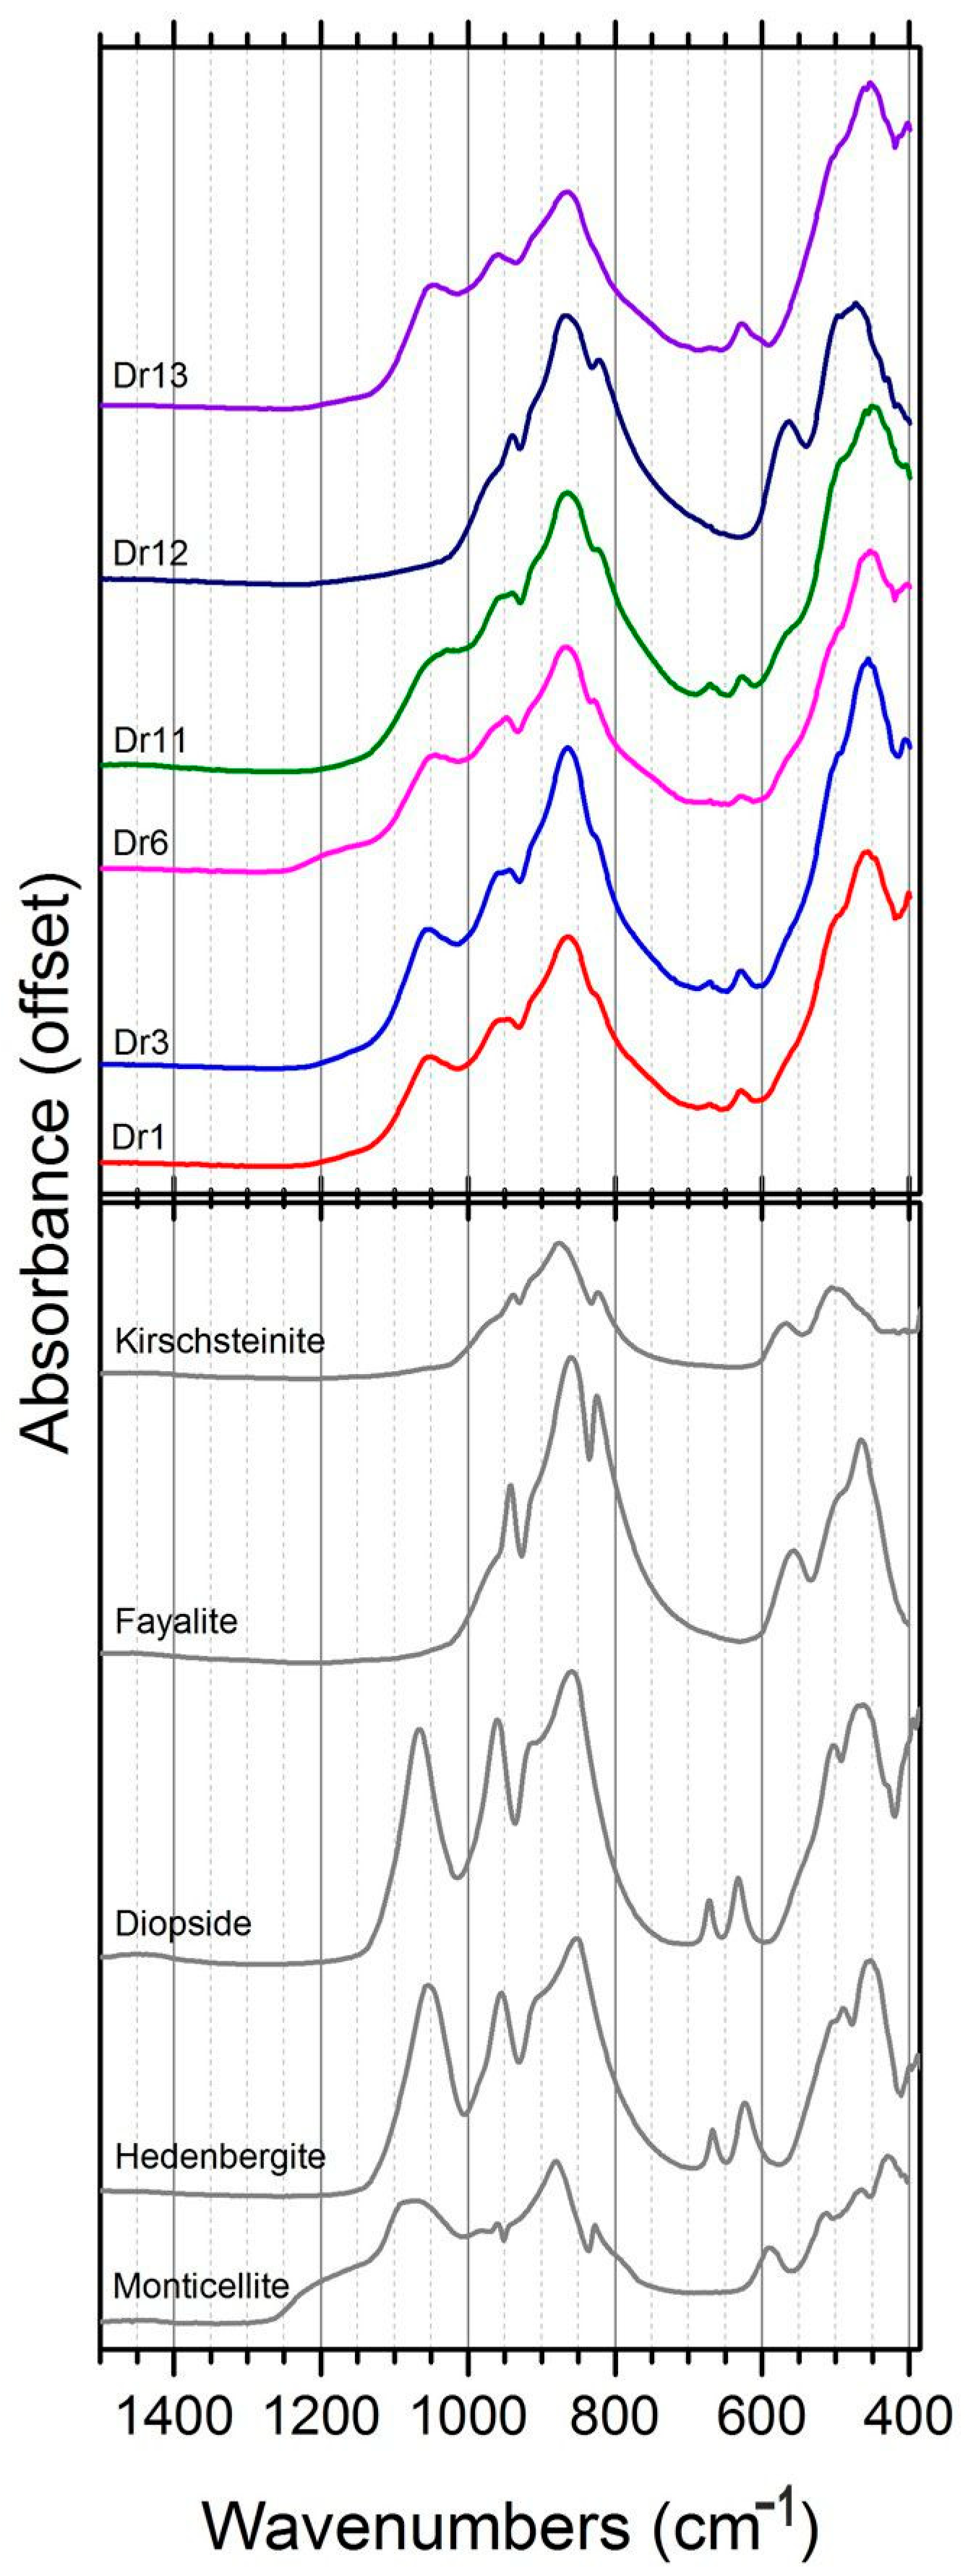
3.1.2. Slags
4. Discussion
4.1. Nucleation Rate and Crystal Growth

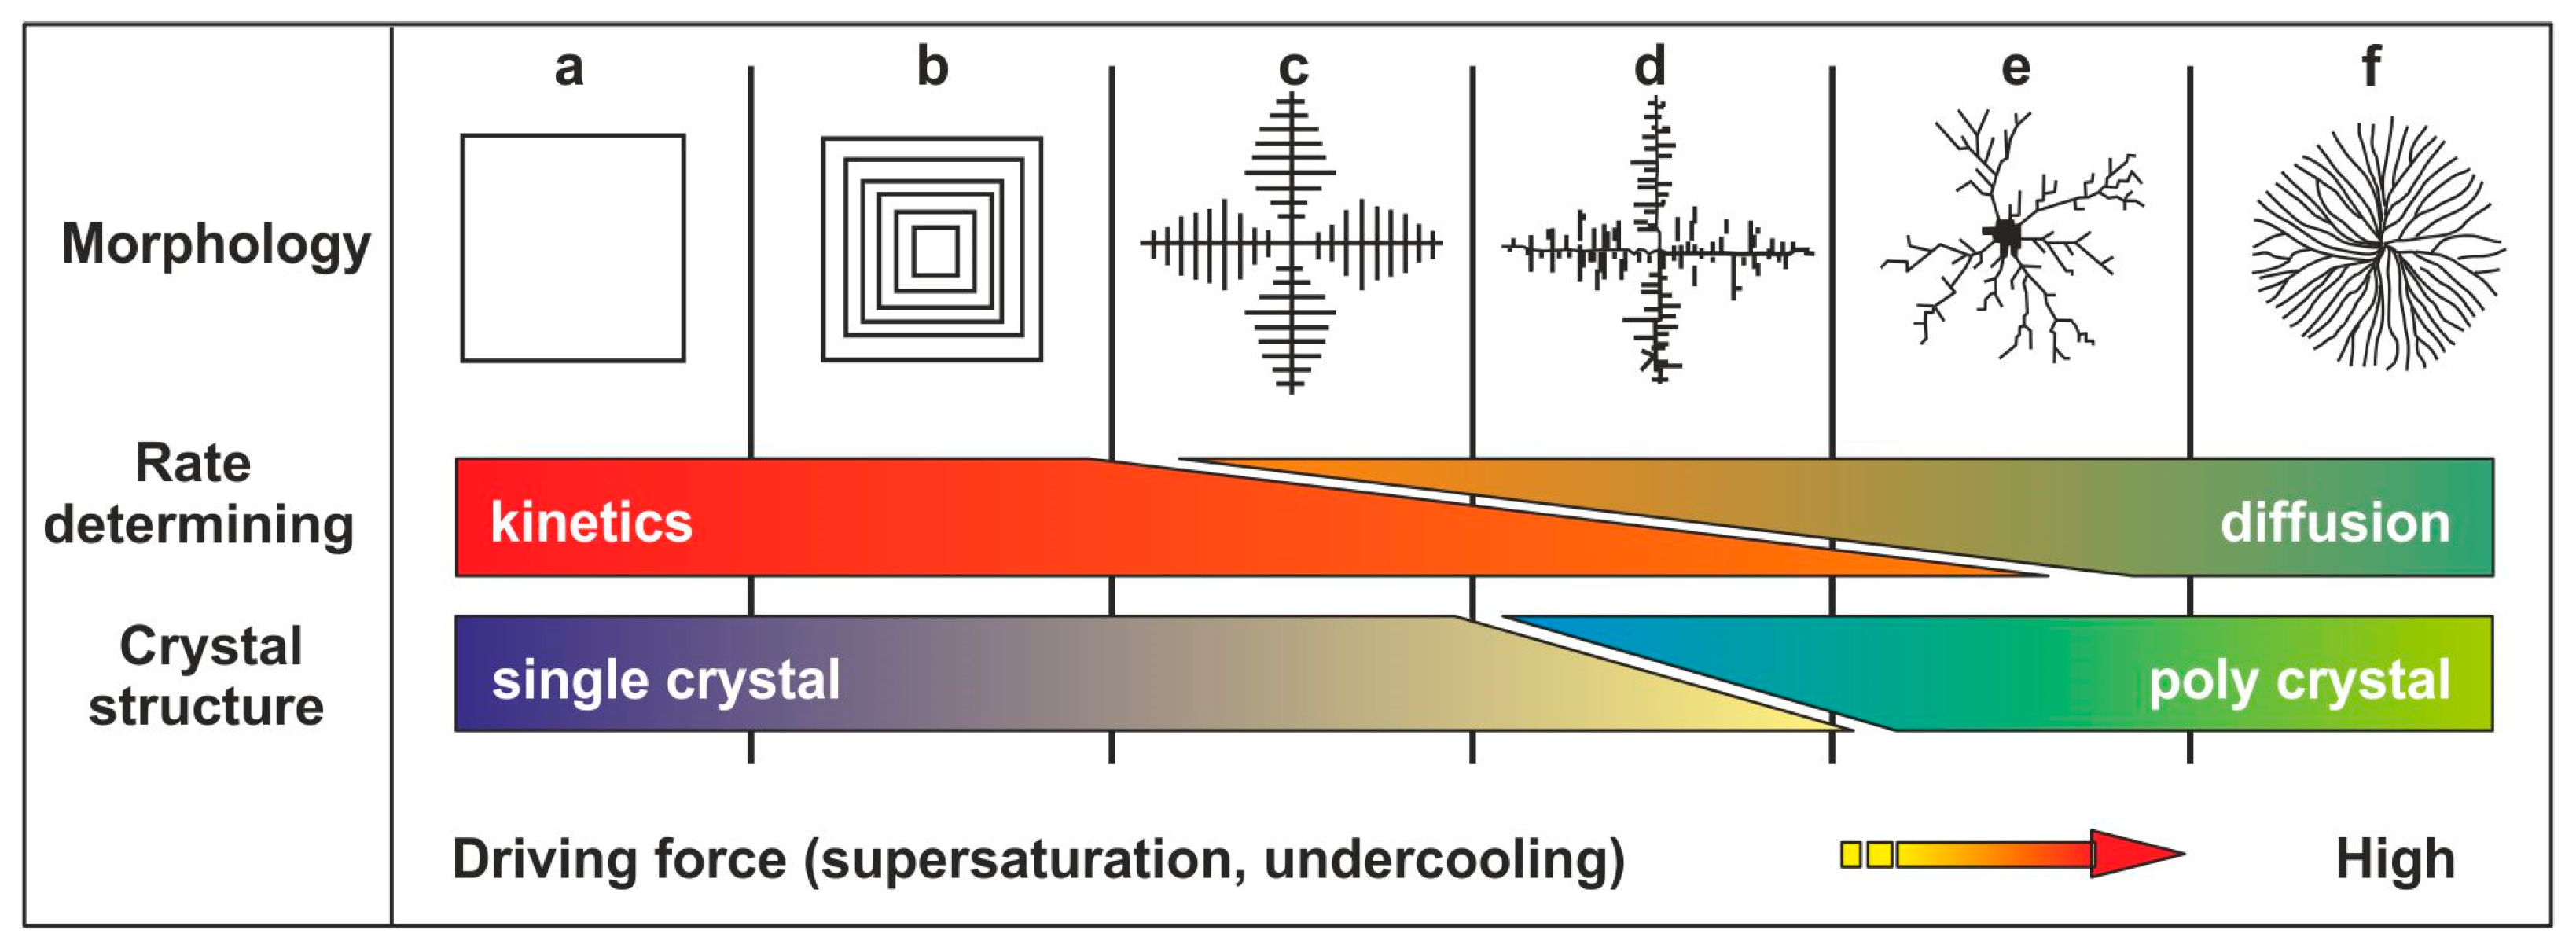
4.2. Crystal Morphologies
5. Conclusions
Author Contributions
Funding
Data Availability Statement
Acknowledgments
Conflicts of Interest
References
- Keith, H.D.; Padden, F.J. The Optical Behavior of Spherulites in Crystalline Polymers. Part II. The Growth and Structure of the Spherulites. J. Polym. Sci. 1959, XXXIX, 123–138. [Google Scholar] [CrossRef]
- Kirov, G.N.; Ivanov, I. Crystal morphology of fayalite from copper converter slags. Krist. Und Tech. 1968, 3, 637–642. [Google Scholar] [CrossRef]
- Nesbitt, R.V. Skeletal crystal forms in the ultramafic rocks of the Yilgarn block, western Australia: Evidence for an Archaean ultramafic liquid. Spec. Publs Geol. Soc. Aust. 1971, 3, 331–347. [Google Scholar]
- Goldenfeld, N. Theory of spherulitic crystallization. J. Cryst. Growth 1987, 84, 601–608. [Google Scholar] [CrossRef]
- Faure, F.; Trolliard, G.; Nicollet, C.; Montel, J.-M. A developmental model of olivine morphology as a function of the cooling rate and the degree of undercooling. Contrib. Miner. Pet. 2003, 145, 251–263. [Google Scholar] [CrossRef]
- Faure, F.; Arndt, N.; Libourel, G. Formation of Spinifex Texture in Komatiites: An Experimental Study. J. Pet. 2006, 45, 1591–1610. [Google Scholar] [CrossRef]
- Ichiyama, Y.; Ishiwatari, A.; Koizumi, K.; Ishida, Y.; Machi, S. Olivine-spinifex basalt from the Tamba Belt, southwest Japan: Evidence for Fe- and high field strength element-rich ultramafic volcanism in Permian Ocean. Isl. Arc 2007, 16, 493–503. [Google Scholar] [CrossRef]
- Arndt, N.T.; Lesher, C.M.; Barns, S.J. Komatiite, 1st ed.; Cambridge University Press: Cambridge, UK, 2008; pp. 1–488. [Google Scholar]
- Bouquain, S.; Arndt, N.T.; Hellebrand, E.; Faure, F. Crystallochemistry and origin of pyroxenes in komatiites. Contrib. Miner. Pet. 2009, 158, 599–617. [Google Scholar] [CrossRef]
- Longfellow, K.M.; Swanson, S.E. Skeletal tourmaline, undercooling, and crystallization history of the Stone Mountain granite, Georgia, USA. Can. Mineral. 2011, 49, 341–357. [Google Scholar] [CrossRef]
- Shea, T.; Houghton, B.F.; Gurioli, L.; Cashman, K.V.; Hammer, J.E.; Hobden, B.J. Textural studies of vesicles in volcanic rocks: An integrated methodology. J. Volcanol. Geotherm. Res. 2010, 190, 271–289. [Google Scholar] [CrossRef]
- Welsch, B.; Faure, F.; Famin, V.; Baronnet, A.; Bachèlery, P. Dendritic Crystallization: A Single Process for all the Textures of Olivine in Basalts? J. Petrol. 2013, 54, 539–574. [Google Scholar] [CrossRef] [Green Version]
- Ding, C.; Lv, X.; Chen, Y.; Bai, C. Crystallization Kinetics of 2CaO·Fe2O3 and CaO·Fe2O3 in the CaO–Fe2O3 System. ISIJ Int. 2016, 56, 1157–1163. [Google Scholar] [CrossRef] [Green Version]
- Shea, T.; Hammer, J.E. Kinetics of cooling- and decompression-induced crystallization in hydrous mafic-intermediate magmas. J. Volcanol. Geotherm. Res. 2013, 260, 127–145. [Google Scholar] [CrossRef]
- Aysal, N. Petrology of the Mesozoic-Tertiary Magmatism and Metamorphism in Northern Biga (Çanakkale). Ph.D. Thesis, Istanbul University, Istanbul, Turkey, 2005. [Google Scholar]
- Kurt, Y. Geological and Archaeometallurgical Investigation of the Dereköy Antique Copper Mine and Demirköy Antique İron Mine in Strandja. Ph.D. Thesis, Istanbul University, Istanbul, Turkey, 2020. [Google Scholar]
- Lafuente, B.; Downs, R.T.; Yang, H.; Stone, N. The power of databases: The RRUFF project. In Highlights in Mineralogical Crystallography; Armbruster, T., Danisi, R.M., Eds.; W. De Gruyter: Berlin, Germany, 2015; pp. 1–30. [Google Scholar]
- Öngen, S.; Aysal, N. Kinetics of spherulitic crystallization. İstanbul Earth Sci. Rev. 2004, 17, 27–34. (In Turkish) [Google Scholar]
- Lofgren, G. An experimental study of plagioclase crystal morphology; isothermal crystallization. Am. J. Sci. 1974, 274, 243–273. [Google Scholar] [CrossRef]
- Brandeis, G.; Jaupart, C.; Allègre, C.J. Nucleation, crystal growth and the thermal regime of cooling magmas. J. Geophys. Res. Solid Earth 1984, 89, 10161–10177. [Google Scholar] [CrossRef]
- Lofgren, G. Experimentally Produced Devitrification Textures in Natural Rhyolitic Glass. GSA Bull. 1971, 82, 111–174. [Google Scholar] [CrossRef]
- Swanson, S.E.; Naney, M.T.; Westrich, H.R.; Eichelberger, J.C. Crystallization history of Obsidian Dome, Inyo Domes, California. Bull. Volcanol. 1989, 51, 161–176. [Google Scholar] [CrossRef]
- Gránásy, L.; Pusztai, T.; Tegze, G.; Warren, J.A.; Douglas, J.F. Growth and form of spherulites. Phys. Rev. E 2005, 72, 011605. [Google Scholar] [CrossRef] [Green Version]
- Castro, J.M.; Beck, P.; Tuffen, H.; Nichols, A.R.; Dingwell, D.B.; Martin, M.C. Timescales of spherulite crystallization in obsidian inferred from water concentration profiles. Am. Mineral. 2008, 93, 1816–1822. [Google Scholar] [CrossRef]
- Watkins, J.; Manga, M.; Huber, C.; Martin, M. Diffusion-controlled spherulite growth in obsidian inferred from H2O concentration profiles. Contrib. Mineral. Petrol. 2009, 157, 163–172. [Google Scholar] [CrossRef] [Green Version]
- Rosseeva, E.; Simon, P.; Kniep, R. Crystal Branching and Spherulite Formation: Similar Shapes. Different Mechanisms. Sci. Rep. Max-Planck-Inst. Chem. Phys. Solids 2009, 181–185. [Google Scholar]
- Pooja, V.K.; Hetu, C.S.; Sheila, J.S.; Badrealam, S.; Poonam, M.; Trupti, G.; Dornadula, C. Spherulites and thundereggs from pitchstones of the Deccan Traps: Geology, petrochemistry, and emplacement environments. Bull. Volcanol. 2012, 74, 559–577. [Google Scholar]
- Lofgren, G. Experimental studies on the dynamic crystallization of silicate melts. In Physics of Magmatic Processes; Hargraves, R.B., Ed.; Princeton University: Princeton, NJ, USA, 1980; pp. 487–551. [Google Scholar]
- Robert, K.S.; Robin, L.T.; Gary, E.L. Growth of megaspherulites in a rhyolitic vitrophyre. Am. Mineral. 2001, 86, 589–600. [Google Scholar]
- Meldrum, C.F.; Helmut, C. Controlling Mineral Morphologies and Structures in Biological and Synthetic Systems. Chem. Rev. 2008, 108, 4332–4432. [Google Scholar] [CrossRef] [PubMed]
- Arzilli, F.; Polacci, M.; La Spina, G.; Le Gall, N.; Llewellin, E.; Brooker, R.A.; Torres-Orozco, R.; Di Genova, D.; Neave, D.A.; Hartley, M.; et al. Dendritic crystallization in hydrous basaltic magmas controls magma mobility within the Earth’s crust. Nat. Commun. 2022, 13, 3354. [Google Scholar] [CrossRef]


| SiO2 | TiO2 | Al2O3 | FeO | MnO | MgO | CaO | Na2O | K2O | P2O5 | BaO | SO3 | Cu | Total | |
|---|---|---|---|---|---|---|---|---|---|---|---|---|---|---|
| A-1 | 77.96 | 12.64 | 0.6 | 0.96 | 5.16 | 2.68 | 100 | |||||||
| A-2 | 78.54 | 12.74 | 1.01 | 4.94 | 2.77 | 100 | ||||||||
| A-3 | 78.61 | 12.17 | 0.6 | 0.95 | 4.82 | 2.85 | 100 | |||||||
| A-4 | 77.02 | 13.01 | 0.78 | 0.94 | 3.9 | 4.35 | 100 | |||||||
| A-5 | 89.58 | 6.07 | 0.2 | 0.27 | 1.52 | 2.36 | 100 | |||||||
| A-6 | 66.94 | 1.3 | 12.52 | 5.38 | 0.47 | 2.35 | 6.23 | 3.05 | 1.76 | 100 | ||||
| A-7 | 70.04 | 11.94 | 5.62 | 0.74 | 3.13 | 2.01 | 2.79 | 3.29 | 0.44 | 100 | ||||
| A-8 | 66.29 | 1.3 | 11.77 | 0.69 | 0.98 | 4.08 | 1.96 | 8.04 | 4.89 | 100 | ||||
| A-9 | 78.49 | 11.75 | 0.19 | 0.53 | 0.5 | 2.72 | 5.4 | 0.42 | 100 | |||||
| S-1A | 42.1 | 0.27 | 7.7 | 27.62 | 0.57 | 3.35 | 16.17 | 1.25 | 0.38 | 0.59 | 100 | |||
| S-2A | 42.15 | 0.25 | 7.6 | 28.72 | 0.88 | 2.9 | 15.65 | 1.3 | 0.34 | 0.21 | 100 | |||
| S-1P | 36.46 | 2.23 | 45.13 | 0.95 | 9.39 | 5.49 | 0.35 | 100 | ||||||
| S-2P | 35.99 | 2.44 | 45.76 | 1.01 | 8.41 | 5.94 | 0.45 | 100 | ||||||
| S-3P | 45.2 | 8.33 | 23.53 | 2.39 | 19.89 | 0.66 | 100 | |||||||
| S-3A | 26.6 | 0.15 | 2.89 | 50.7 | 0.47 | 1.84 | 14.8 | 0.32 | 0.19 | 0.2 | 1.84 | 100 | ||
| S-4A | 26.78 | 3.95 | 48.12 | 0.54 | 2.28 | 17.04 | 0.34 | 0.95 | 100 | |||||
| S-4P | 4.49 | 0.31 | 3.98 | 87.38 | 0.28 | 1.17 | 2 | 0.39 | 100 | |||||
| S-5P | 31.11 | 2.13 | 37.06 | 0.71 | 4.18 | 24.81 | 100 | |||||||
| S-6P | 37.5 | 0.16 | 6.3 | 31.92 | 0.36 | 0.99 | 22.34 | 0.11 | 0.32 | 100 | ||||
| S-7P | 5.36 | 0.23 | 4.25 | 86.71 | 0.77 | 2.68 | 100 | |||||||
| S-8P | 37.07 | 11.03 | 26.26 | 0.38 | 0.44 | 16.35 | 0.83 | 3.43 | 1.91 | 2.3 | 100 | |||
| DR-1 * | 38.6 | 0.26 | 7.48 | 32.3 | 0.62 | 3.12 | 14.70 | 0.58 | 1.16 | 0.32 | 0.29 | 0.50 | 99.93 | |
| DR-12 * | 29.5 | 0.09 | 3.01 | 46.1 | 0.49 | 2.40 | 15.30 | 0.27 | 0.28 | 0.22 | 0.18 | 2.10 | 99.92 |
Disclaimer/Publisher’s Note: The statements, opinions and data contained in all publications are solely those of the individual author(s) and contributor(s) and not of MDPI and/or the editor(s). MDPI and/or the editor(s) disclaim responsibility for any injury to people or property resulting from any ideas, methods, instructions or products referred to in the content. |
© 2023 by the authors. Licensee MDPI, Basel, Switzerland. This article is an open access article distributed under the terms and conditions of the Creative Commons Attribution (CC BY) license (https://creativecommons.org/licenses/by/4.0/).
Share and Cite
Aysal, N.; Kurt, Y.; Öztürk, H.; Ildiz, G.O.; Yesiltas, M.; Laçin, D.; Öngen, S.; Nikitin, T.; Fausto, R. Crystallization Kinetics: Relationship between Crystal Morphology and the Cooling Rate—Applications for Different Geological Materials. Crystals 2023, 13, 1130. https://doi.org/10.3390/cryst13071130
Aysal N, Kurt Y, Öztürk H, Ildiz GO, Yesiltas M, Laçin D, Öngen S, Nikitin T, Fausto R. Crystallization Kinetics: Relationship between Crystal Morphology and the Cooling Rate—Applications for Different Geological Materials. Crystals. 2023; 13(7):1130. https://doi.org/10.3390/cryst13071130
Chicago/Turabian StyleAysal, Namık, Yiğit Kurt, Hüseyin Öztürk, Gulce Ogruc Ildiz, Mehmet Yesiltas, Davut Laçin, Sinan Öngen, Timur Nikitin, and Rui Fausto. 2023. "Crystallization Kinetics: Relationship between Crystal Morphology and the Cooling Rate—Applications for Different Geological Materials" Crystals 13, no. 7: 1130. https://doi.org/10.3390/cryst13071130