1. Introduction
The aggregation phenomena of small organic molecules and functional polymers [
1] are relevant in many applications, and they affect the formation of crystalline phases from concentrated solutions [
2,
3,
4]. In pharmacology, aggregation phenomena in solution states are relevant as they influence drug behavior [
5,
6]. Self-assembly processes take place in solutions where molecules interact forming new supramolecular structures. For instance, it has been demonstrated that there is a direct dependence between the nucleation and growth of self-assembled monolayers and the concentration of the process solution [
7]. Owing to their tendency to form H- or J-aggregates, which strongly influence their photophysical and nonlinear optical properties, conjugated small molecules have been the subject of extensive aggregation studies [
8,
9]. In H-aggregates, the chromophores are arranged in a parallel fashion with a side-by-side orientation of their transition moment, which results in a broadening and hypsochromic shift in the absorption spectra. In J-aggregates, the molecules are arranged in a slipped face-to-face geometry with a head-to-tail orientation of their transition moment, causing red-shifted absorption spectra.
The nature of the aggregate can vary depending on the overall molecular structure as well as on the electronic and steric features of the substituents [
9]. In the field of synthetic dyes, the aggregation of azobenzenes has been investigated with both spectroscopical [
10,
11] and calorimetric techniques [
12] in pure solution [
11,
13] and in the presence of template molecules and polymers in the media [
10]. Both H-aggregate and J-aggregate have been observed for azodyes, depending on the molecule structure and on the testing conditions [
10,
14].
In this framework, we set out to develop a method that, by combining a computational and a spectral analysis approach, allows for the characterization and the rationalization of the occurring aggregation phenomenon at the molecular level.
UV-Vis absorption spectroscopy is certainly one of the most widely used methods that can probe the formation of aggregates in solutions [
15]. In such applications, the advantage of this technique relates to its high sensitivity in a wide concentration range. However, UV-Vis absorption spectroscopy may not allow for deriving information about the kind of local interactions that are driven by aggregation phenomena. For this reason, in this work we propose to complement UV-Vis spectroscopy with resonance Raman (RR) spectroscopy which combines fair sensitivity with useful information about intermolecular interactions. Indeed, Raman has been used successfully to show the changing effects of intermolecular interactions in different conditions, spanning from the solid phase [
16] to the formation of amyloid fibrils [
17] to the solvated phase [
18].
To establish a combined RR/UV-Vis spectroscopic method, we selected Disperse Orange 3 (DO3), a photochromic dye belonging to the class of push–pull azobenzenes [
19]. The presence of a strong donor and an acceptor group in the 4,4′ positions, an amine (NH
2) and a nitro (NO
2), respectively, imparts a strong charge transfer character and a sizeable ground state dipole moment (9.9 D [
20]). This results in strong dipole–dipole intermolecular interactions that can promptly drive aggregation, which is why DO3 was selected for this study. We chose dimethyl sulfoxide (DMSO) as the solvent because it is a well-known good solvent for DO3 and thus it allows the exploration of a wide range of concentrations. The combined RR/UV-Vis data were interpreted based on well-established theoretical models that highlighted the role of the transition dipole moment in both spectroscopic techniques. We accompany the experimental observations with TDDFT calculations that account for the effects of intermolecular interactions in H-aggregates containing an increasing number of DO3 units. The results show that the critical aggregation concentration that can be determined by UV-Vis spectroscopy corresponds to that derived from the observed changes in the resonance Raman intensities. Furthermore, the analysis of the concentration-dependent shift in resonance Raman spectra provides confirmation about intermolecular interactions.
Overall, as the main novelty of this work, we demonstrate an effective link between the well-established UV-Vis approach and a vibrational spectroscopic method. The good matching observed with the DO3 provides the foundations for a general analytical method that can be extended to any system with both a large enough molar absorptivity and a large resonance Raman cross-section.
2. Materials and Methods
Dimethyl sulfoxide (DMSO) and the Disperse Orange 3 dye (DO3) were used as purchased from Sigma-Aldrich. All solutions were obtained by dilution from a 10−1 M stock solution and were sonicated before dilution up to 10−6 M. The DMSO used was recently opened and stored under N2. A fresh stock solution was prepared before each sequence of experiments to avoid the setting up of aggregation phenomena with time.
UV-Vis experiments were recorded on a Cary5000 spectrophotometer. Quartz cuvettes with different optical path lengths were used, namely, 1 cm for concentrations ranging between [10−6 M–10−4 M], 5 mm for [2.5 × 10⁻⁴ M–10−3 M], and 0.5 mm for [2.5 × 10⁻³ M and 10−1 M]. This allowed us to obtain viable spectra, and to estimate the molar extinction coefficient ε(λmax) at concentrations varying between 10−1 M to 10−6 M. In the following, ε(λmax) will be simply denoted as ε. We evaluated the experimental error in the determination of ε by repeating the UV-Vis measurements at three different concentrations (10−4 M, 7.5 × 10⁻⁵ M, 5 × 10⁻⁵ M) on five different stock solutions prepared for this purpose. The relative error on ε (standard deviation/average) was 5%, independent of concentration. From basic error propagation theory, the relative error on the transition dipole () was σμ/μ = ½ σε/ε = 2.5%.
The Raman spectra were measured using the dispersive Raman spectrometer Horiba Jobin Yvon LabRAM HR800UV, equipped with a 1800 grooves mm
−1 grating, an Olympus BX41 microscope, and a Peltier-cooled CCD detector. A 405 nm laser, focused through a 50Xobjective, was used as the excitation source. The laser power was around 10 mW; the exposure time was 30 s, and we averaged two exposures. These same conditions were kept for all the recorded spectra. The Raman cross-section of the DO3 solute (
σa) was estimated based on the Raman cross-section of a reference band of the DMSO solvent (
σs), since the Raman intensity of a given band of a given species in solution is given by
I =
K I0 σ C [
21], where
I0 is the laser intensity,
C is the molar concentration, and
K accounts for the efficiency of detection by the instrument. Therefore, by dividing the Raman intensity by the concentration of a given species, one obtains a quantity proportional to the cross-section,
I/
C =
K I0 σ. This allows the cross-section ratio
σa/
σs to be expressed as follows:
Equation (1) correlates the Raman intensity of the analyte (Ia) and the solvent (Is), the concentration of the sample (Ca), and the solvent concentration (CS). CS was evaluated as a constant considering the density of DMSO (1.1 g/cm3) and the molecular weight of DMSO (78 g/mol). The ratio σa/σs was determined by using the intensity of the most intense band of DO3, corresponding to the NO symmetric stretching (1338 cm−1) of the nitro group, normalized with respect to the intensity of the Raman signal of DMSO at 1050 cm−1. The intensities of the two bands were determined on the spectra by subtracting the background using a baseline correction.
DFT calculations were carried out with Gaussian09 [
22], using the B3LYP/6-311G(d,p) method, including dispersion effects (D3BJ—Grimme’s D3 scheme including Becke–Johnson damping) and the implicit solvation scheme IEFPCM with the DMSO solvent. We computed the lowest 250 excited states of DO3 and its H-aggregates up to the hexamer with TD-B3LYP/6-311G(d,p) on fully geometry-optimized structures determined with the same DFT method. All calculations were carried out on a local cluster operated by our research group.
3. Results
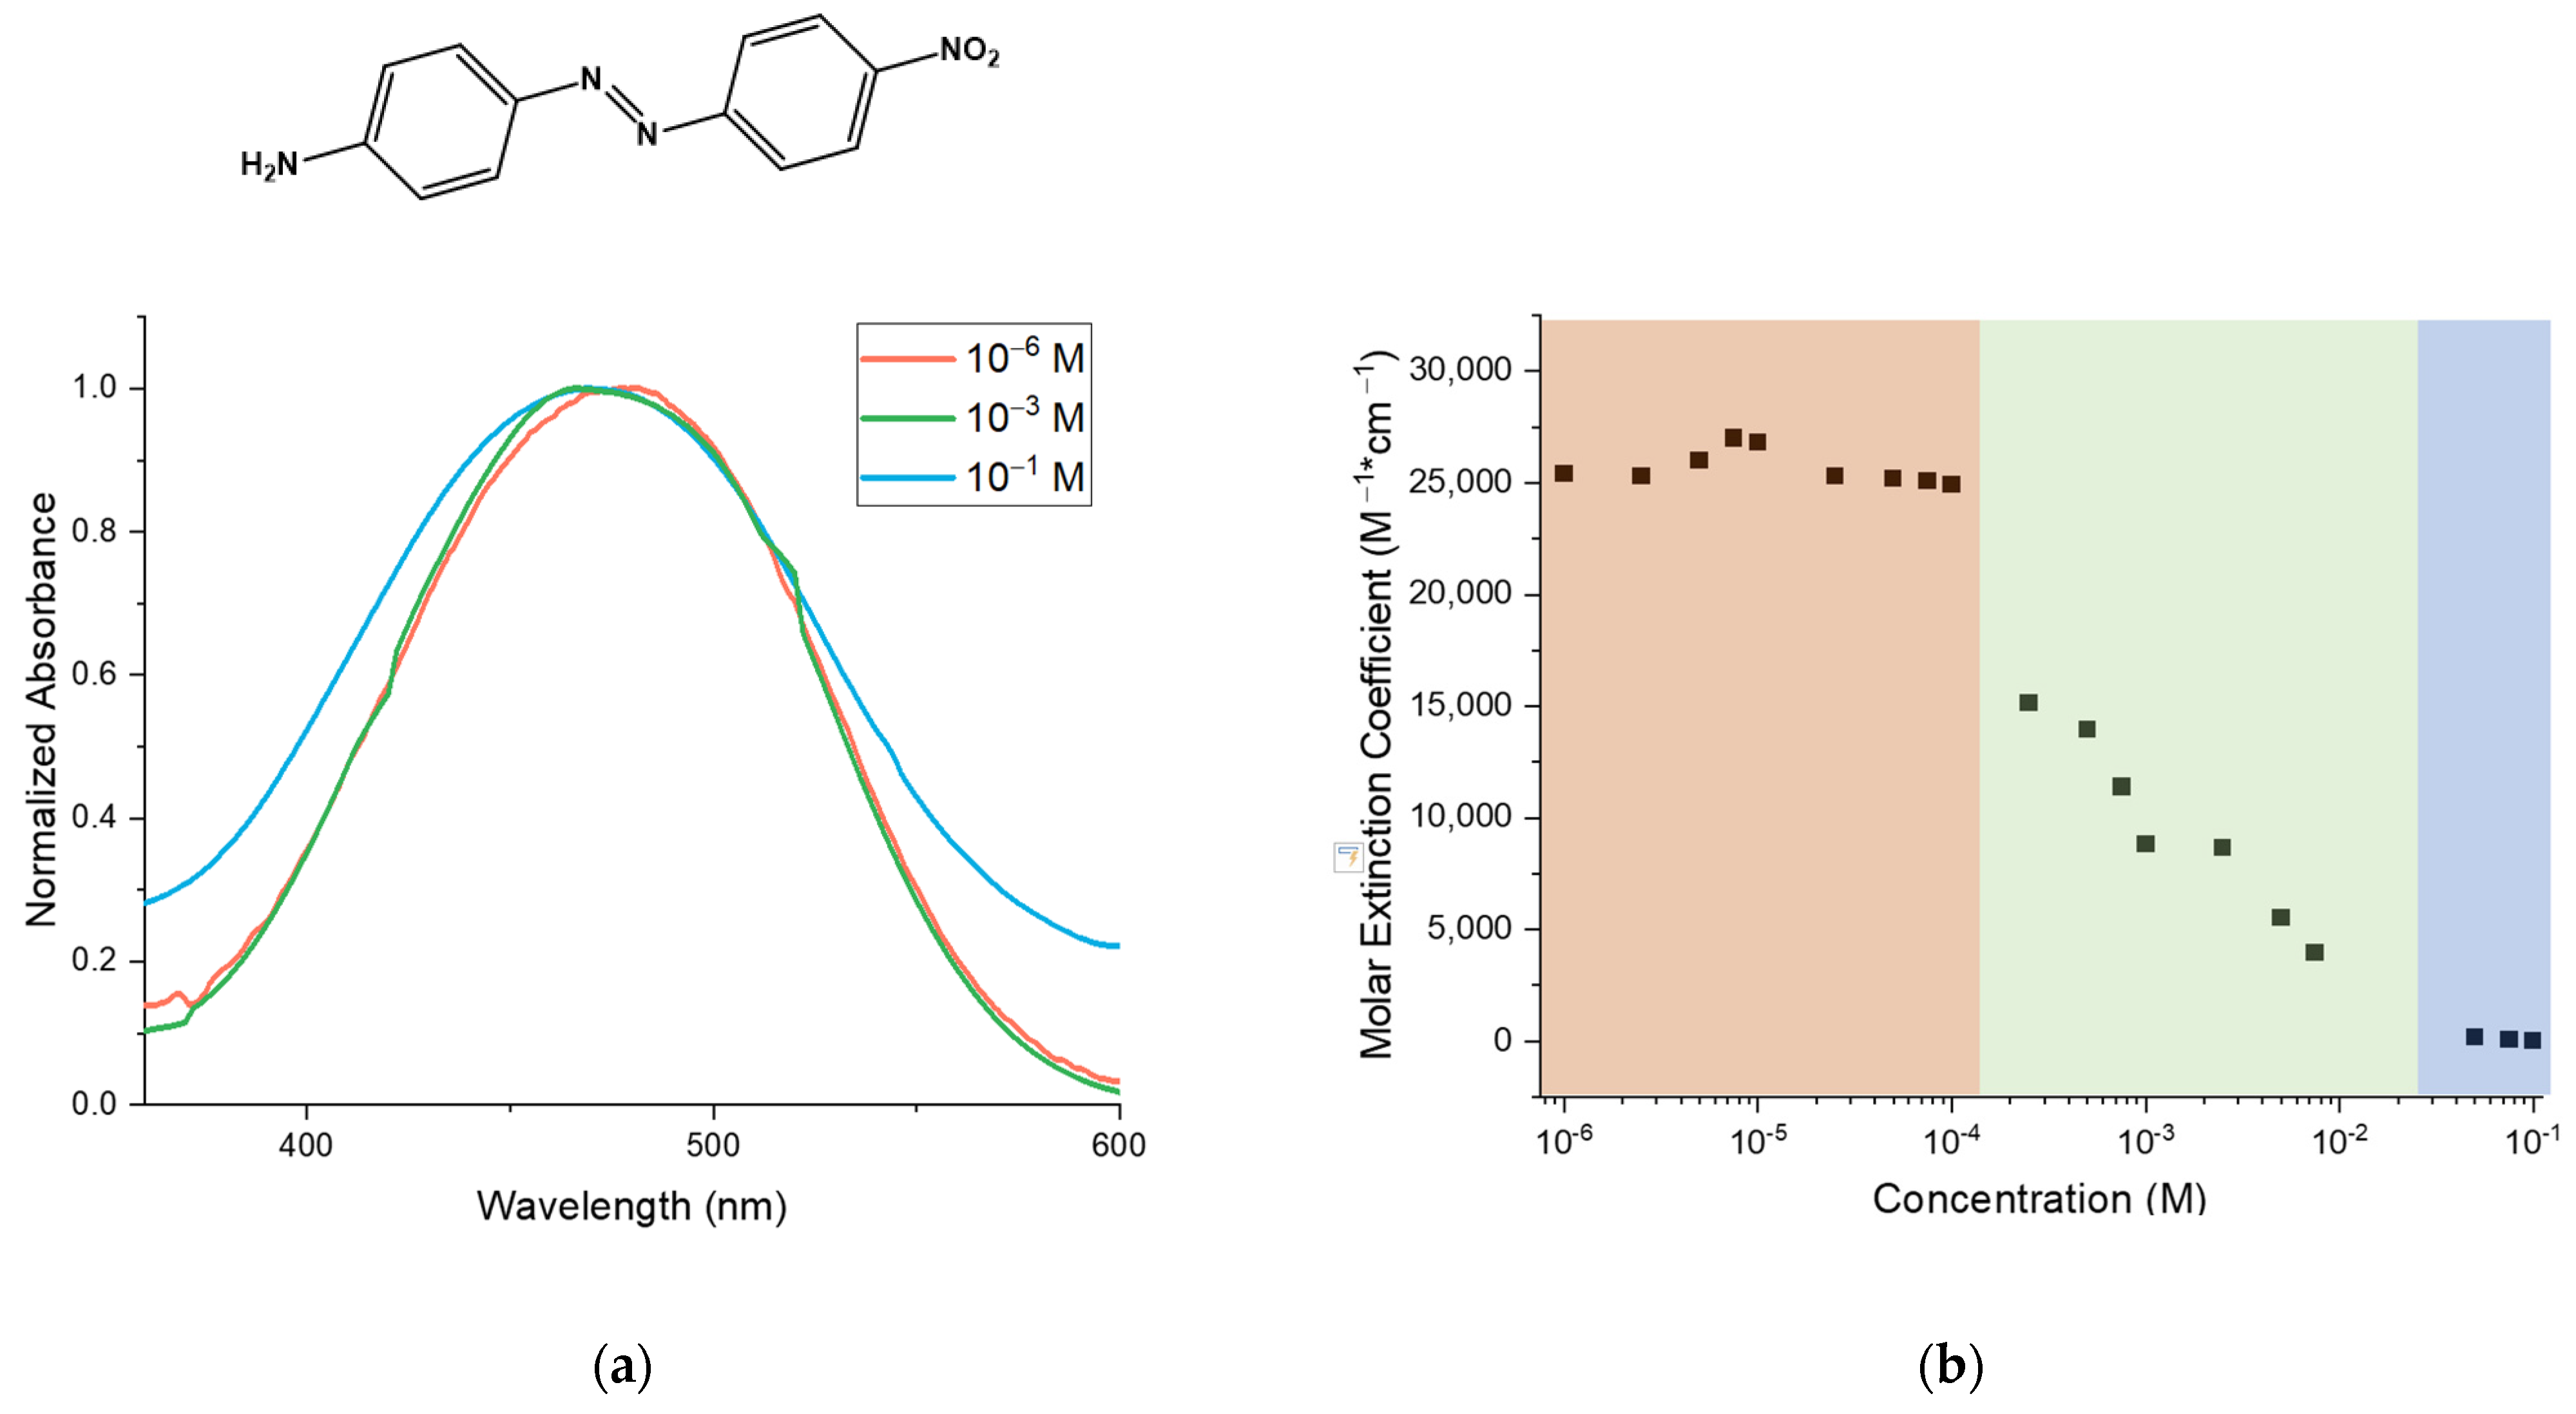
UV-Vis spectra were recorded in a wide range of concentrations, namely between 10
−1 M and 10
−6 M. This was meant to observe the DO3 in DMSO at different stages of aggregation. In
Figure 1 the UV-Vis spectra at different concentrations are shown, starting from the most diluted 10
−6 M to the most concentrated at 10
−1 M. The band corresponding to the most diluted solution is centered around 479 nm. When the concentration is increased (10
−3 M) the shape of the spectrum is unchanged with respect to the diluted solution; however, the peak starts to shift at lower wavelengths. In fact, the band corresponding to the most concentrated solution is broader and is centered at a λ
max of about 473 nm. The shift to lower wavelengths at higher concentrations indicates the formation of H-aggregates [
23]. In
Figure 1b we report the molar extinction coefficient (ε) of DO3 for each solution. The coefficient ε was estimated through the Lambert–Beer law. As a result of this plot, we identified three regimes: the first regimes between 10
−6 M and 10
−4 M where the molecules are isolated, a second regime between 10
−4 M and around 5×10
−2 M where aggregation begins, and finally a third regime at highest concentrations where the molecules are in an aggregated state.
We report in
Figure 2a the resonance Raman spectra of different solutions of DO3 in DMSO that were recorded with the same experimental conditions (see details in Materials and Methods). The ratio of the Raman cross-section of DO3 (
σa) with respect to that of DMSO (
σs) was determined using the intensity of one of the most intense bands of DO3, corresponding to the NO
2 symmetric stretch (1338 cm
−1), and the intensity of the Raman peak at 1048 cm
−1 of the DMSO. These bands were chosen carefully, as the NO
2 band is one of the most intense of DO3, which allows us to estimate the intensity of this band at very low concentrations. The band chosen for the DMSO was the only one which was not in correspondence with other DO3 vibrational modes or hindered by the fluorescence signal. Accordingly, the spectra were recorded using a 405 nm laser, avoiding fluorescence but still in resonance for DO3 (see the UV-Vis absorption spectra in
Figure 1a). In
Figure 2b, the
σa/
σs ratio is plotted with respect to the concentration of the DO3 solutions in DMSO. The first observation is that the
σa/
σs ratio decreases as the concentration increases. Moreover, three regimes are also identified here and, remarkably, they are found at concentration ranges approximately matching those observed with the UV-Vis spectroscopy. Furthermore, the position of selected Raman transitions can be affected by aggregation. For instance, for decreasing concentration, the NO
2 band remains unshifted at 1338 cm
−1, whereas the N=N band shifts to higher wavenumbers from 1384 cm
−1 to 1386 cm
−1, as reported in
Figure 2c. Accordingly, this confirms that the azo (N=N) group is involved in the aggregation since the frequency of its stretching mode is affected by the concentration. This is consistent with the formation of H-aggregates with sandwich-like stacking.
4. Discussion
The experimental data reported in
Figure 1 and
Figure 2 suggest that the onset of the formation of H-aggregates occurs around a concentration of 10
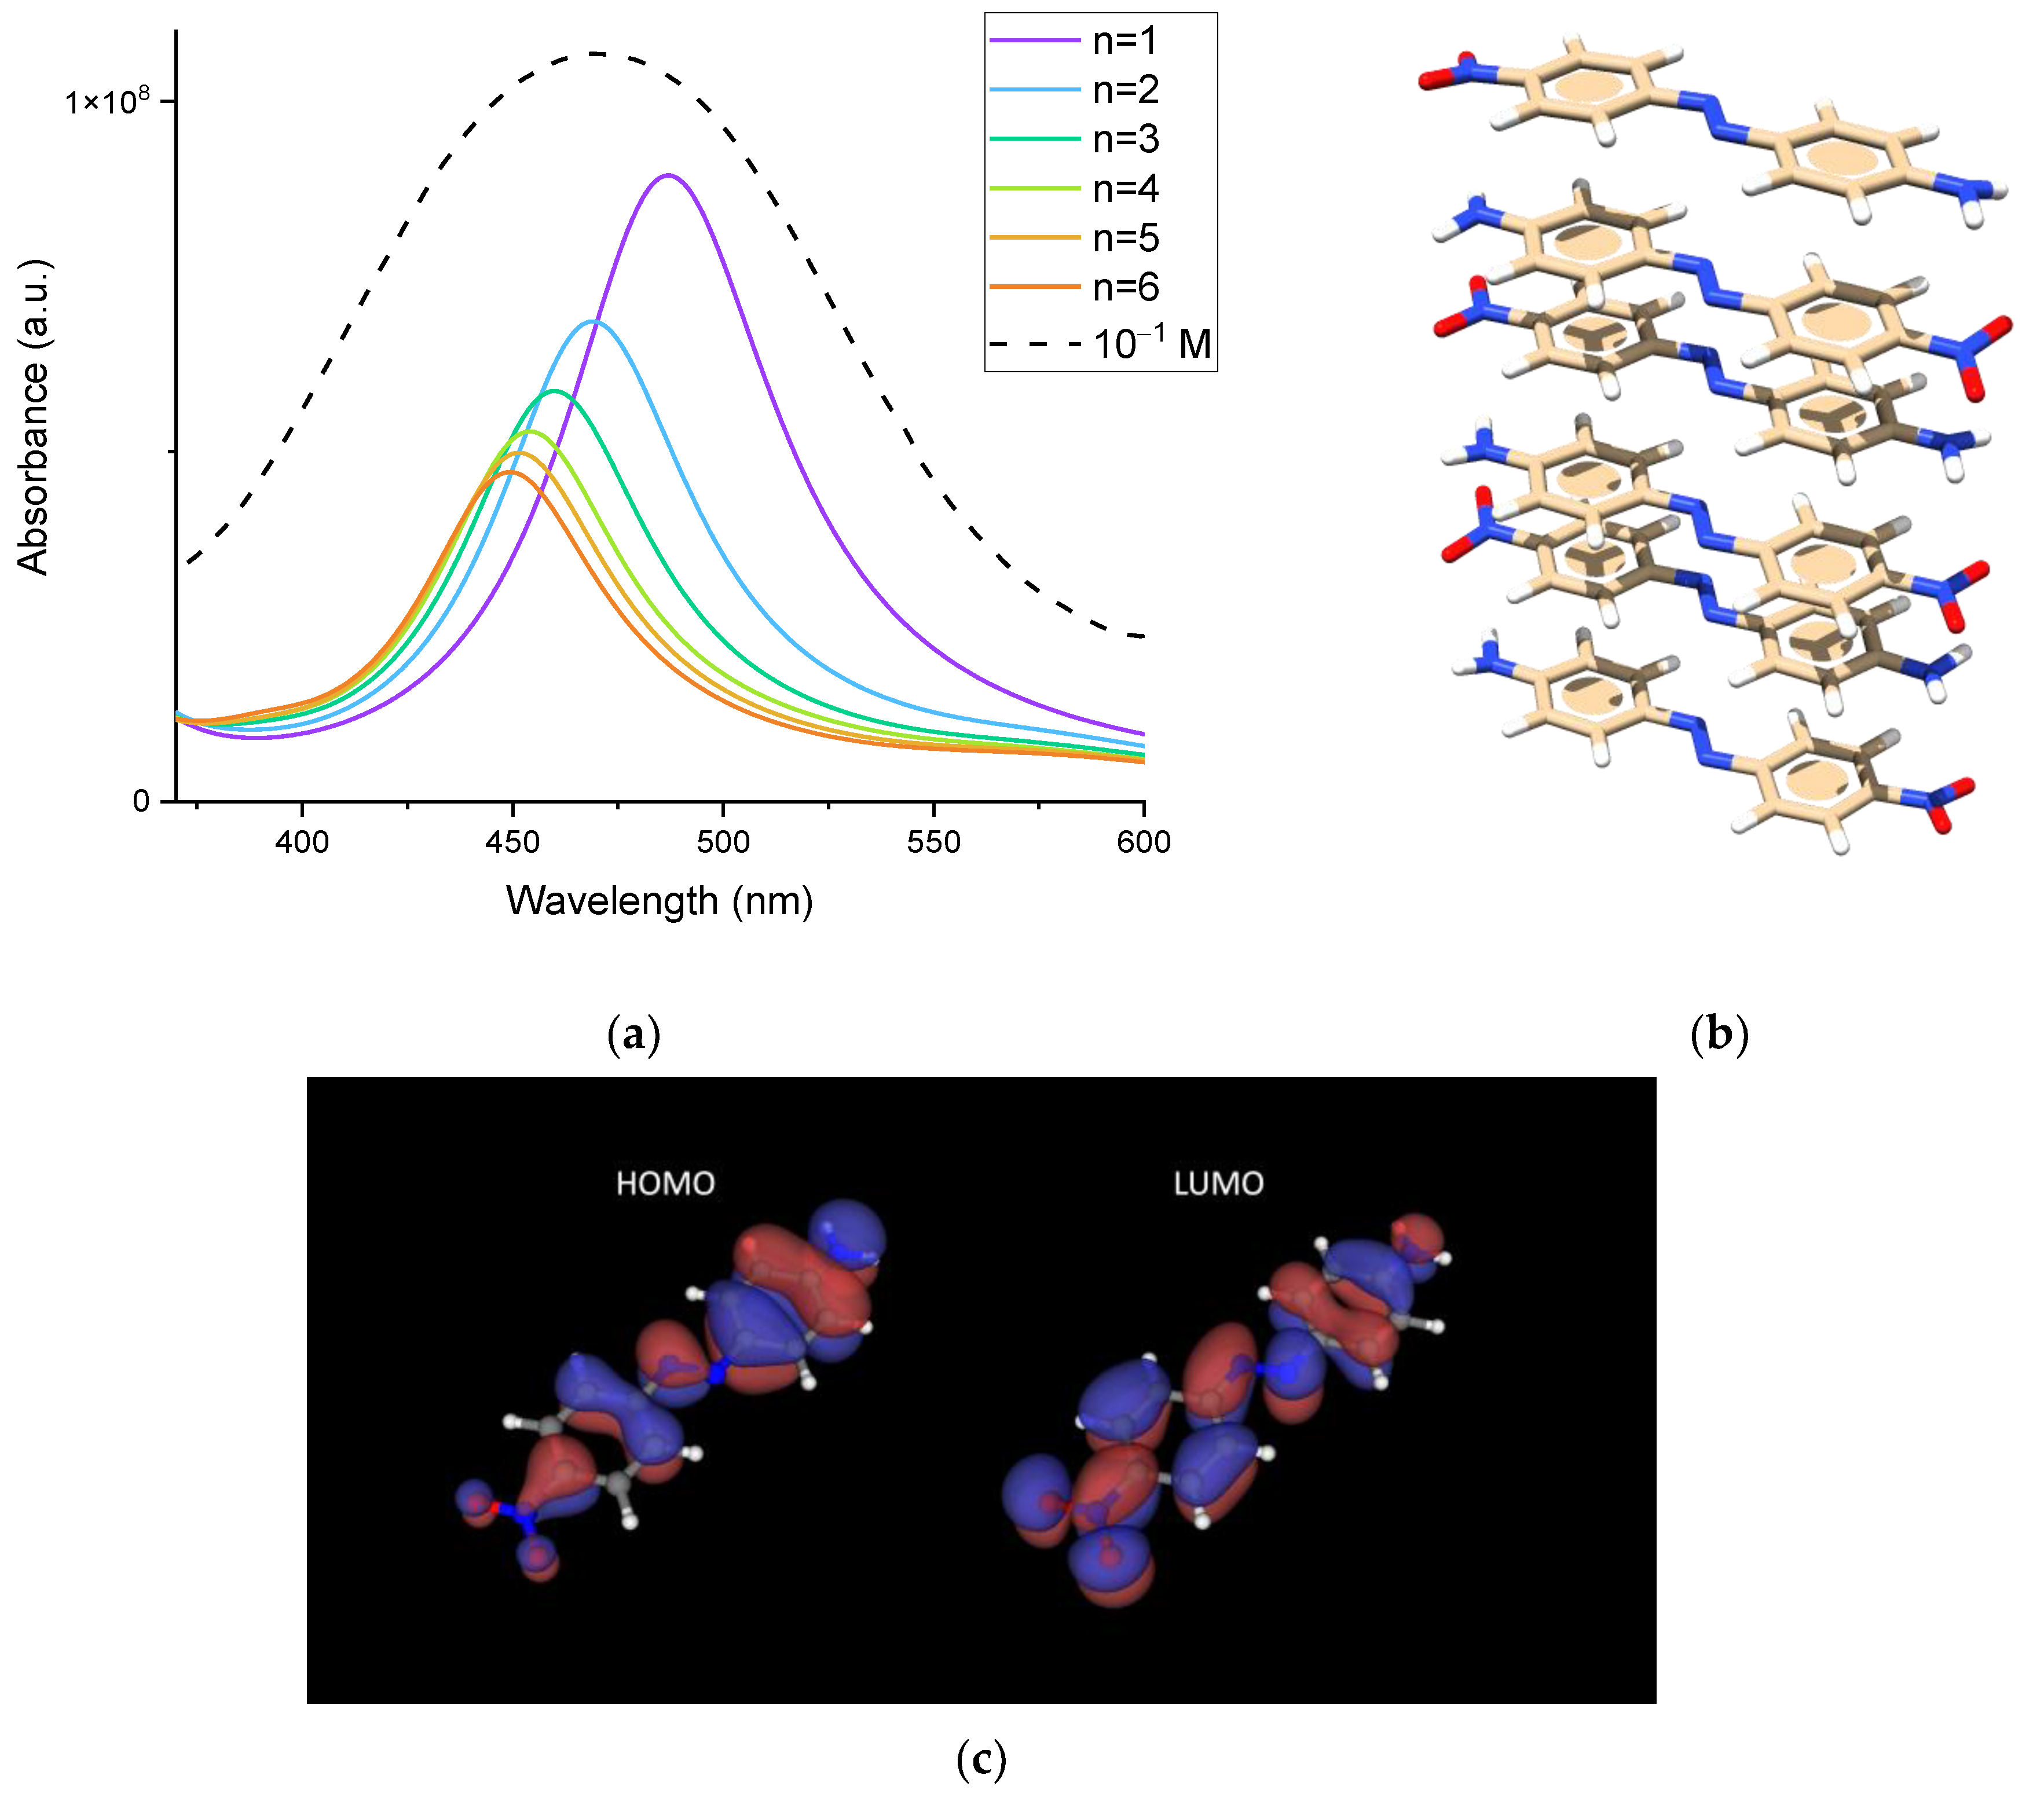
−4 M. TDDFT calculations were used to assess the effects of H-aggregation on UV-Vis absorption. We were interested in determining how the progressive stacking of DO3 molecules could affect the molar extinction coefficient so as to rationalize the experimental observation of its decrease for increasing concentration. We first checked if the selected DFT method could accurately represent the position and envelope of the observed experimental UV-Vis spectrum for a high concentration, where presumably the sample contains a significant amount of aggregates, which may be formed by a varying number of DO3 molecules. As reported in
Figure 3, TDDFT calculations—as expected—confirm the progressive blueshift of the absorption peak (assigned to the π→π* HOMO→LUMO transition) as the number of molecules per aggregate increases. Moreover, when the simulated spectra are normalized by the number of DO3 molecules forming the aggregate, the peak intensity significantly decreases, which qualitatively follows the experimental observation for the molar extinction coefficient. Remarkably, the presence of a broad UV-Vis band in the experimental spectrum can be attributed to the overlapping contributions of multiple components. These components originate from a distribution of H-aggregates made up of a varying number of molecules.
To better identify the mechanism responsible for the observed intensity decrease, we focused on the behavior of the transition dipole moment
μge, which is directly related to the molar absorptivity
[
25,
26]. Hence, in
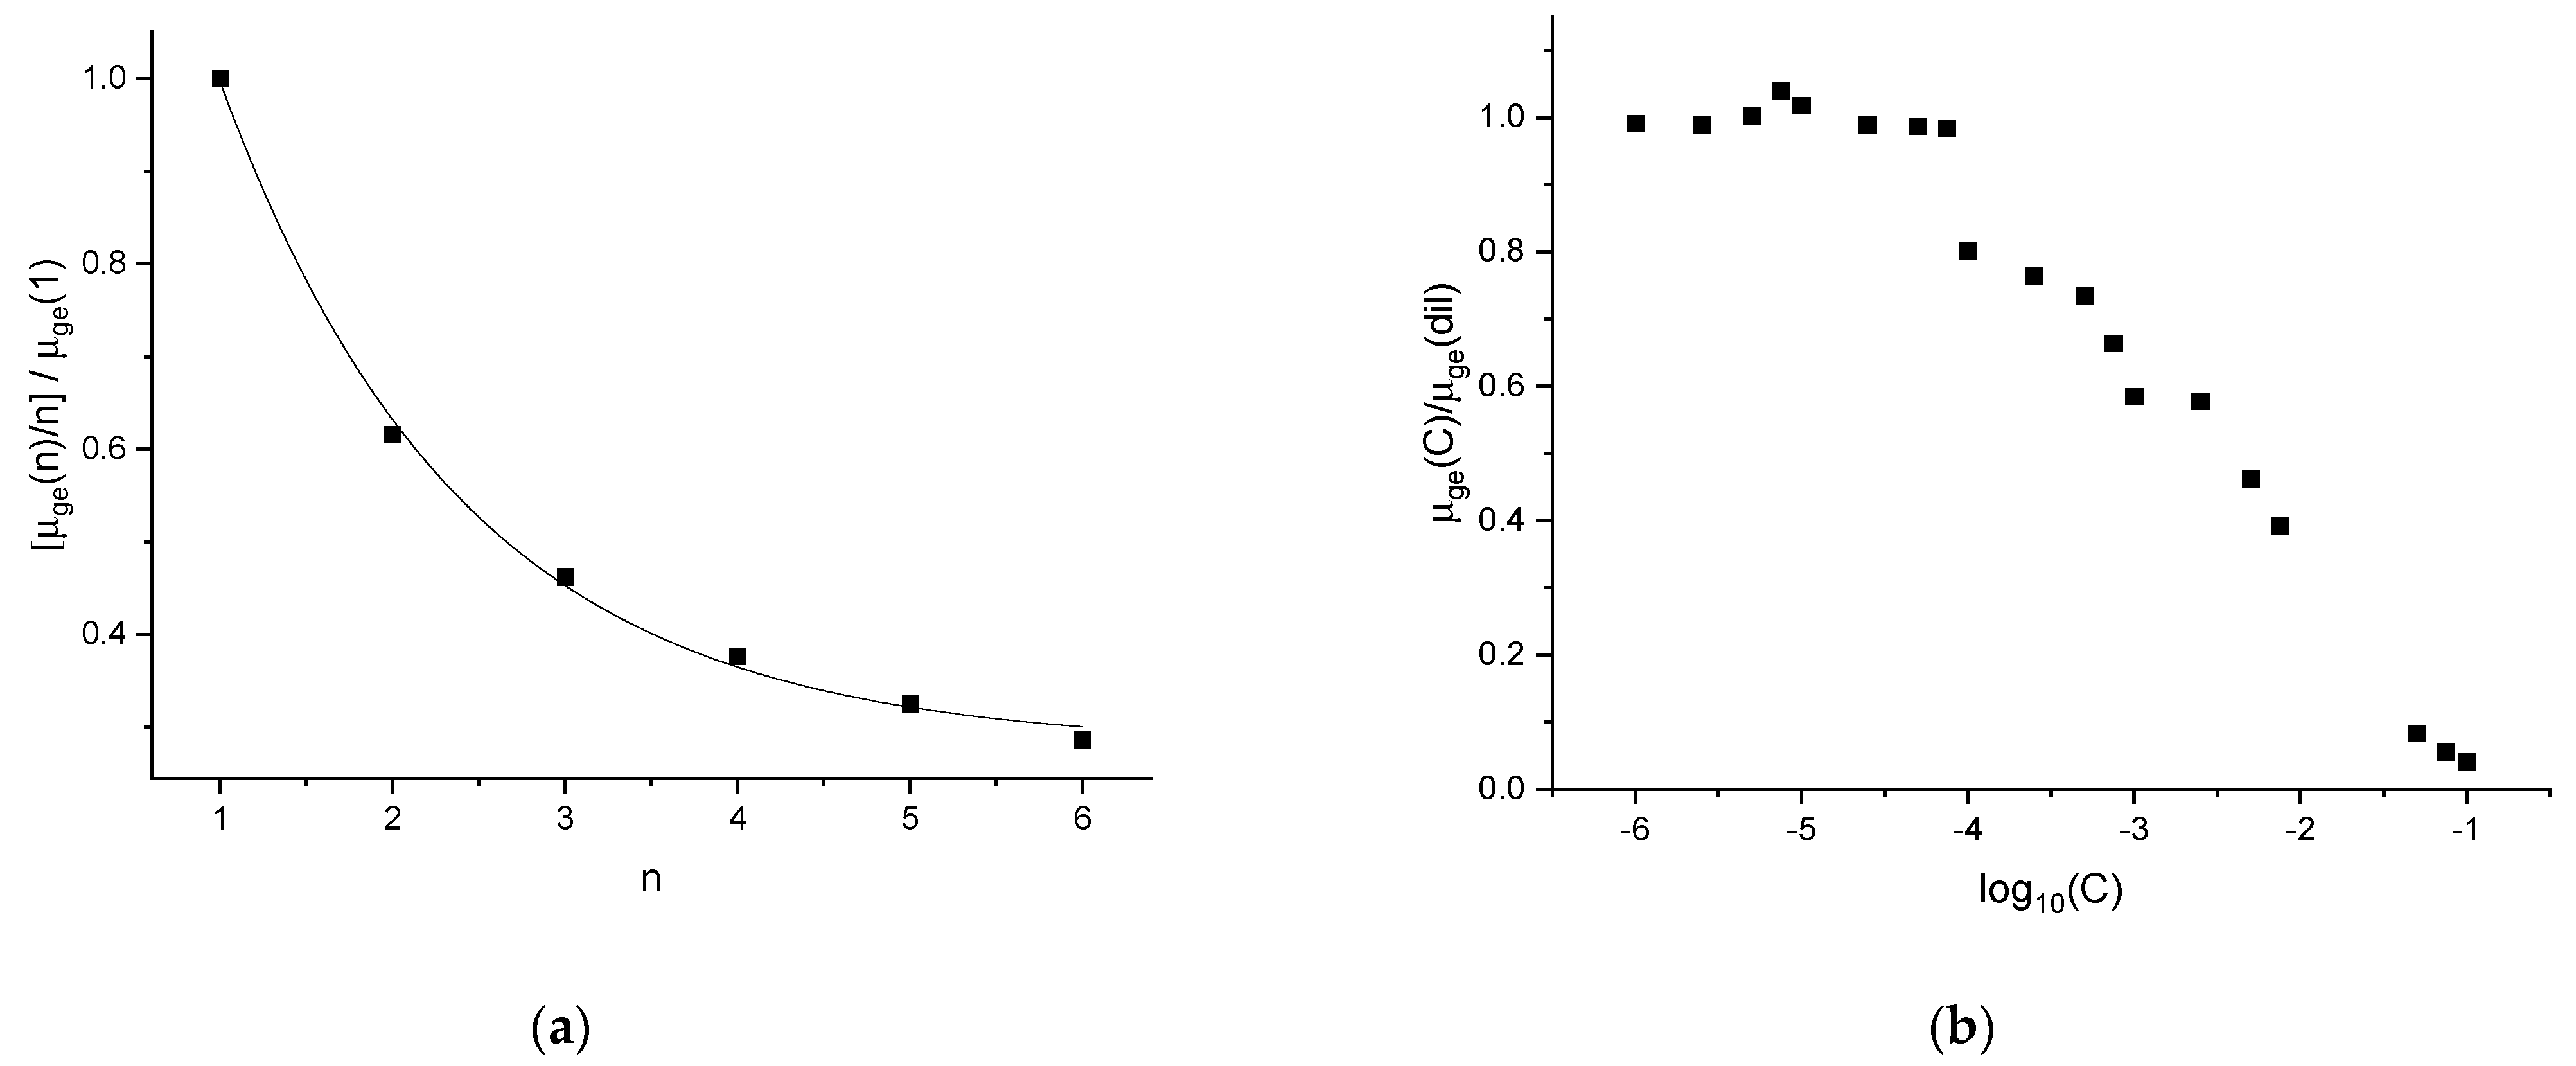
Figure 4, we compare the relative decrease in the transition dipole moment computed by TDDFT for an increasing number of molecules in the H-aggregate with the relative decrease in the same quantity estimated from the experimental molar absorptivity by
. To this aim, we compute from the TDDFT calculations the ratio
, where
is the modulus of the transition dipole moment of the H-aggregate formed by
n DO3 molecules, and
is the transition dipole moment of the monomer. By taking
we consider the average contribution to the transition dipole of the aggregate originating from one molecule within the aggregate. Hence, the
ratio indicates how intermolecular interaction within the aggregate may influence, on the average, the molecular contribution to the electronic transition of the aggregate. Of course, for negligible intermolecular interactions, the ratio is close to 1. Moreover, since the experimental value
μge(
C) is determined from
, by considering the nominal molar concentration of the solution (i.e., moles of DO3 per unit volume), it turns out that the quantity
μge(
C) represents the average value of the transition dipole of DO3, independently of its aggregation state. Therefore,
μge(
C)/
μ(
dil) is the experimental proxy of the quantity
that we have determined by TDDFT calculations.
The decreasing trends shown in
Figure 4 indicate that the transition dipole moment is significantly influenced by the formation of H-aggregates. Notably, TDDFT calculations indicate that the transition dipole moment of the hexamer is less than one-third of the transition dipole moment of the monomer. Similarly, when comparing the experimental counterpart (
Figure 4b), we observe a similar decrease: the transition dipole moment at the 10
−2M concentration is around one-third of the transition dipole moment of the diluted solutions. At higher concentrations, the observed transition dipole moment decreases further, to values that are even lower than those that can be extrapolated from
Figure 4a for large n values. We think this indicates the formation of other kinds of aggregates that have not been considered in our present DFT analysis. This is reasonable, since at increasingly large concentrations the formation of seeds of three-dimensional nanocrystals is expected, and these could be formed by, e.g., side-by-side stacks of H-aggregates, where the interactions among the DO3 molecules are different from those in H-aggregates. Therefore, it is not surprising that the transition dipole moment displays different trends in different concentration ranges.
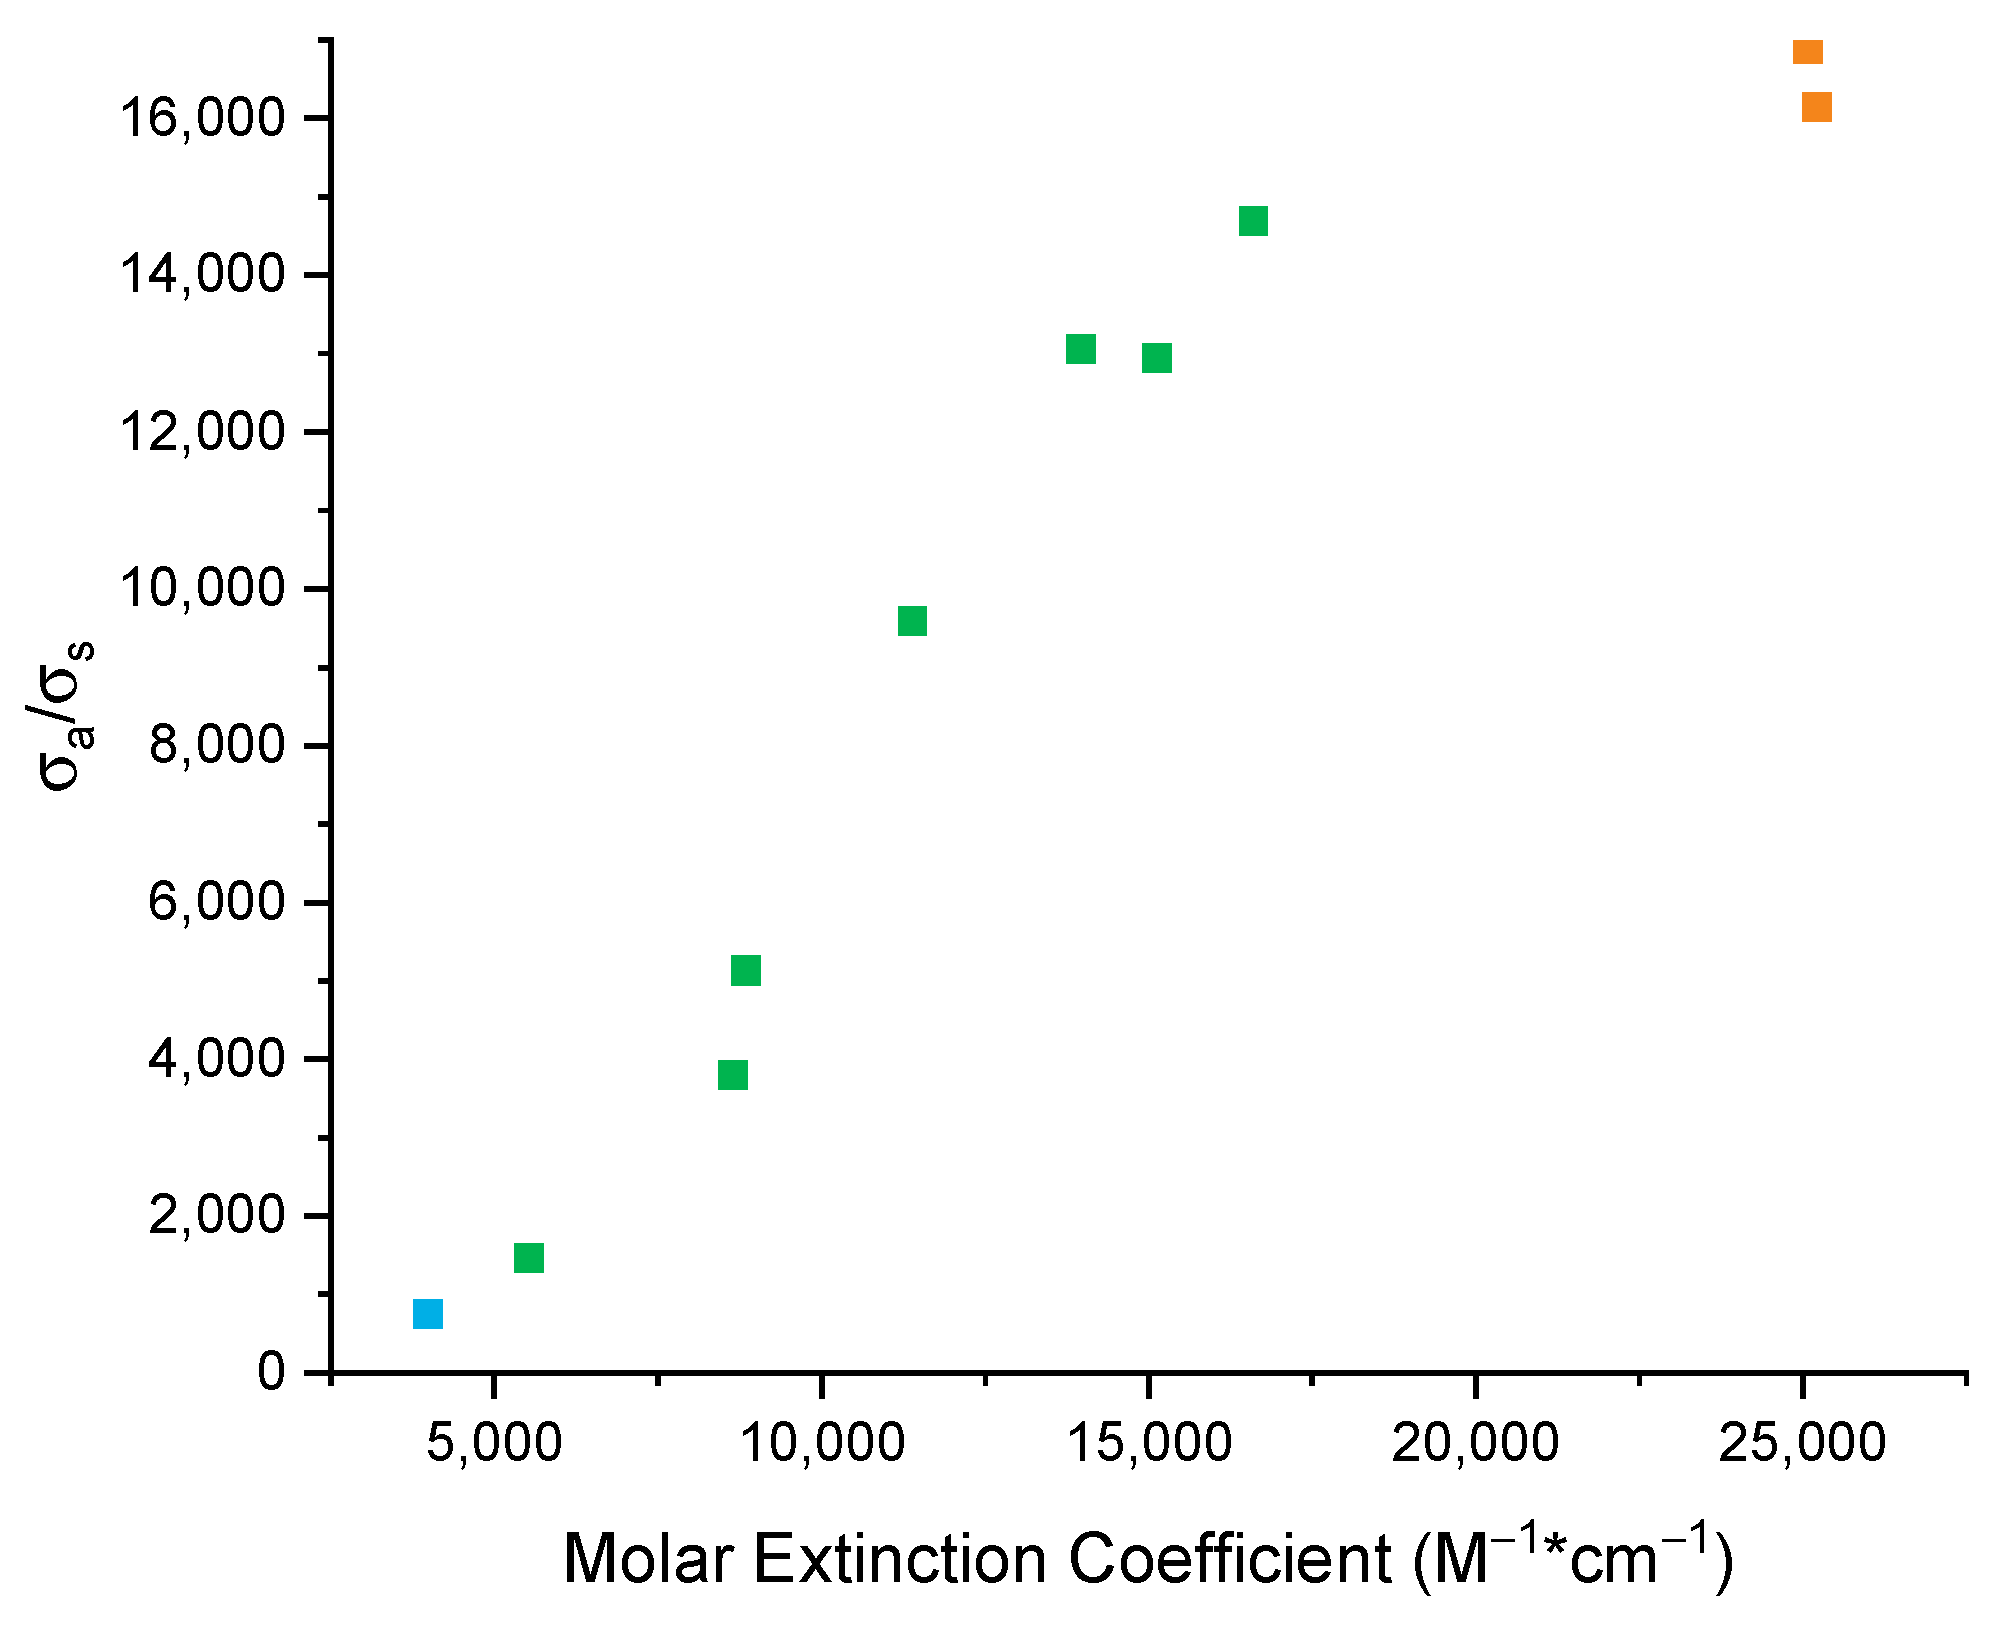
As discussed above (see
Figure 2), Raman spectroscopy as well is sensitive to aggregation phenomena, even though it is not applicable through such a wide concentration range as UV-Vis spectroscopy. This is due to intrinsic reasons, due to the inherent weakness of the Raman scattering process compared with photon absorption. It is thus interesting to correlate the behavior of the Raman cross-section ratio (
σa/
σs) with the molar extinction coefficient ε, as reported in
Figure 5, which shows a clear monotonic trend where a high ratio of Raman cross-sections (at low concentrations) corresponds to high molar extinction coefficients. This evident experimental observation can be justified by a straightforward theoretical analysis of the Raman cross-section. Since we work in near-resonance conditions, we consider the doubly resonant term in the Nafie–Peticolas–Stein expression of the Raman polarizability (α), which leads to [
27,
28]:
We recognize the presence of the same transition dipole moment which directly determines the molar absorptivity ε. Hence the expression for the Raman cross-section can be simplified as follows:
where
is the vibronic coupling matrix element and
is the difference between the transition energy to the excited state and the photon energy of the laser used in the Raman experiment. Equation (3) clearly justifies the monotonic relationship observed between σ and ε. Interestingly, since the data in
Figure 5 display a quadratic behavior only above a concentration of about 10
−3 M, we conclude that the
g2/Δ
Ε4 term is weakly dependent on concentration only for high concentrations.
5. Conclusions
By combining UV-Vis absorption, Raman spectroscopy, and DFT calculations, we could characterize the formation of molecular H-aggregates of Disperse Orange 3 (DO3) in a wide range of concentrations in DMSO. The aggregation in DMSO starts at roughly 10−4 M, as inferred from the relationship between the molar absorptivity and the transition dipole moment. The findings show the presence of H-aggregates made up of variable numbers of DO3 molecules as the concentration rises. As the concentration increases, the data indicate the coexistence of H-aggregates comprised of a varying number of DO3 molecules. Moreover, based on the peak position in the UV-Vis absorption spectrum and the observed relative decrease in the transition dipole moment, we estimate the substantial presence of H-aggregates formed by four DO3 molecules at a concentration of about 10−2M. In more concentrated solutions (10−1 M), the trend of the transition dipole moment shifts, indicating the emergence of higher aggregates that may be compared to the seeds of nanocrystals. The data from Raman spectroscopy support the formation of H-aggregates based on the shift in the N=N stretching mode with increasing concentration. Additionally, the established theory of resonance Raman justifies the monotonic correlation between the molar absorption coefficient and the dependency on the concentration of the Raman cross-section ratio through the transition dipole moment.
For future studies, our interest has now shifted to the phenomena that occur at higher concentrations. Our hypothesis is that above a certain concentration, nanoaggregates turn into nano-crystal seeds. For instance, TDDFT calculations on a model composed of two H-aggregate trimers of DO3 interacting side-by-side provide a lower value of the ratio than the fully stacked H-aggregate hexamer (i.e., 0.23 vs. 0.29), which confirms the role of more complex aggregates in the experimental data at high concentrations. The combination of DFT simulations and dynamic light scattering techniques could allow us to collect new data to apply the method presented here at higher concentrations ranges.

 ,
, 


