1. Introduction
Flow-accelerated or flow-assisted corrosion (FAC), also denoted as erosion–corrosion, of carbon or low-alloyed steel piping, occurs when the rate of dissolution of the protective oxide film that forms on the internal piping surface into a stream of flowing water or wet steam is enhanced, leading to an increased wall thinning rate [
1,
2,
3,
4,
5,
6,
7,
8,
9]. This phenomenon is encountered in both single and two-phase flow conditions and is the result of an increase in the rate of corrosion or material dissolution, induced by the relative movement between a corrosive fluid and a material surface; thus it does not involve erosion or cavitation damage. A thin layer of iron oxide (mostly magnetite) forms on the inside surface of carbon steel exposed to deoxygenated water in the temperature range 100–300 °C. This layer protects the underlying piping from the corrosive environment and limits further corrosion. An increase in fluid velocity, temperature, and alteration of water chemistry can lead to magnetite dissolution at the oxide–coolant interface and its substitution by new oxide formed at the alloy–oxide interface, resulting in material removal and thinning of the piping [
2,
3,
4,
5,
6,
7,
8]. In general, the FAC process consists of two steps. The first step is the production of soluble iron at the oxide–water interface, while the second step is the transfer of the soluble and particulate corrosion products to the bulk flow across the diffusion boundary layer. Although FAC is characterized by a general reduction in pipe wall thickness for a given component, it frequently occurs over a limited area within this component due to local high areas of turbulence [
3,
5,
9].
Several parameters influence the extent of degradation due to FAC, including the geometrical configuration of the components, piping orientation, position inside the pipe, flow Reynolds number, fluid chemistry, temperature, piping material, and flow turbulence structure, which affect the surface shear stress and mass transfer coefficients [
9,
10,
11,
12]. The dissolution rate is, in fact, equal to the sum of the current densities of the dissolution of the oxide and transfer of iron ions from the metal through the oxide layer, which emphasizes its role as one of the controlling factors of FAC [
10,
11]. Several works [
13,
14,
15,
16,
17] have been devoted to the characterization of the thin iron oxide layers formed on the carbon steel components under the chemical and hydrodynamical conditions prevailing within the secondary circuit of PWR plants (de-aerated and alkaline turbulent water or wet steam). However, the mechanism of the process has not been studied in detail with electrochemical methods. Very recently, some new approaches, including the wire beam electrode with electrochemical impedance spectroscopy, have shown promise in probing the initiation and propagation of erosion-corrosion [
18,
19] but, to the best of our knowledge, these methods have not been applied to steam-generator materials and environments.
In that context, the aim of the present paper is to investigate the corrosion of a typical alloy used in steam generators (carbon steel 22K) with a specially designed setup to ensure turbulent conditions. First, the setup and the associated hydrodynamic calculations are described. Second, in situ chrono-potentiometric and impedance spectroscopic measurements in the temperature range 100–240 °C in a simulated coolant of a nuclear plant steam generator are presented and discussed. Quantitative interpretation of the impedance data with a kinetic model allows for its parameterization in terms of interfacial rate constants, diffusion coefficients of ionic defects, and field strength in the forming oxide. Finally, the model is validated by comparison with operational data for FAC and directions for future research are indicated.
2. Materials and Methods
The experiments described in the paper are performed in a recirculation loop equipped with a special insert for a FAC study, mounted immediately after the preheater of the coolant (
Figure 1). It is constructed from a tube made of AISI 316 stainless steel that plays the role of sample holder. The insert playing the role of flow accelerator is located in the middle of the tube. To simulate the coolant as a single-phase flow at large Reynolds numbers, the k-ε model was implemented using a finite element method implemented in commercial software (Comsol Multiphysics, Burlington, MA, USA). Due to the axial symmetry of the system, 2D calculations were performed. The fluid was modelled as pure water at 100–240 °C and 90 bar (density 0.95–0.82 g cm
−3 and dynamic viscosity 10
−3–10
−4 Pa s).
Samples for working electrodes were cut from 22K steel (AISI 1022) with a nominal composition listed in
Table 1. The actual composition estimated by glow-discharge optical emission spectroscopy is also given in the Table.
Electrochemical measurements are carried out with a CompactStat.h10030 (Ivium Technologies, Eindhoven, The Netherlands) operating in a floating mode. In a three-electrode configuration, a Pt plate (99.9%, Goodfellow) plays the role of a counter-electrode, whereas the reference electrode is a Pd (99.9%, Goodfellow) cathodically polarized with 10 μA against another Pt to approximate the reversible hydrogen electrode (RHE). Before each measurement, this electrode is calibrated vs. a 3 M KCl/AgCl/Ag reference (LL-type, Metrohm, Switzerland). The potentials were recalculated to the standard hydrogen electrode scale using temperature dependences of the RHE estimated with commercial software [
20,
21]. The water chemistry used was ammonia-hydrazine-ethanolamine (AMETA, 3.0–5.0 mg kg
−1 NH
3, 20–100 μg kg
−1 N
2H
4, 0.3–0.5 mg kg
−1 HOCH
2CH
2NH
2, pH
25 °C = 9.8). To prepare the electrolyte, p.a. N
2H
4, NH
3 и HOCH
2CH
2NH
2 (Sigma Aldrich) with an Fe content of less than 0.00005% were used.
Measurements were performed at 100, 130, 160, 180, 200, 220, and 240 °C using the following procedure. After filling the loop with coolant, the hot part, including the flow-through cell with the flow-accelerating insert, is compressed to 90 bars, heated up to 80 °C, and purged with N2 (99.999%) for 16 h to reach a dissolved oxygen concentration <10 µg kg−1. After reaching this value, the temperature of the flow-through cell is increased gradually so that the highest measurement temperature (240 °C) is reached for ca. 2 h. Purging of the feedwater in the reservoir with N2 continued till the end of the experiment duration (typically 72–96 h). During the first 24 h, the inlet flow in the cell is 10 dm3 h−1, from 24–48 h it is maintained at 4 dm3 h−1, and from 48 to 72 h—increased again to 10 dm3 h−1. Impedance spectra were measured in a frequency range of 0.5 mHz to 11 kHz with an ac signal of 40 mV (rms) or 1 μA (rms). Spectra measured by both methods were identical within the reproducibility limit (±1% by impedance magnitude and ±2° by phase shift). The interval of spectra registration is between 2 and 8 h. Linearity was checked by measuring spectra with signal amplitudes between 10 and 40 mV, whereas causality was ensured by a Kramers–Kronig compatibility test. For complex nonlinear least squares fitting of spectra to a transfer function based on the proposed kinetic model, the Levenberg–Marquardt algorithm implemented in an Origin Pro platform (Originlab, Northampton, MA, USA) was employed.
To estimate the oxide thickness, the exposed samples were galvanostatically reduced with a current density of −30 µA cm−2 at 22 ± 1 °C in a borate buffer solution (0.1 mol dm−3 Na2B4O7 + 0.005 mol dm−3 H3BO3, pH = 9.2) de-aerated with N2. Experiments were conducted in a three-electrode glass cell featuring a Pt (99.9%, Goodfellow) plate counter electrode and a 3 M KCl/AgCl/Ag reference with an Autolab 302N potentiostat/galvanostat (Metrohm Eco Chemie, Utrecht, The Netherlands). The concentration of soluble iron generated during reduction was estimated with an ICP-OES apparatus (Prodigy, Teledyne Leeman Labs, Mason, OH, USA).
3. Results
3.1. Hydrodynamic Calculations
The profiles of linear flow rate and Reynolds number in the flow-through cell calculated by the procedure described in the Experimental section are presented in
Figure 2a,b for a temperature of 240 °C. The temperature dependence of maximum values of hydrodynamic parameters estimated in the vicinity of the working electrode are presented in
Figure 2c. Based on the performed calculations, it can be concluded that turbulent conditions are ensured in the flow-accelerating insert in the studied temperature interval.
3.2. Influence of Temperature and Flow Rate on Corrosion Potential
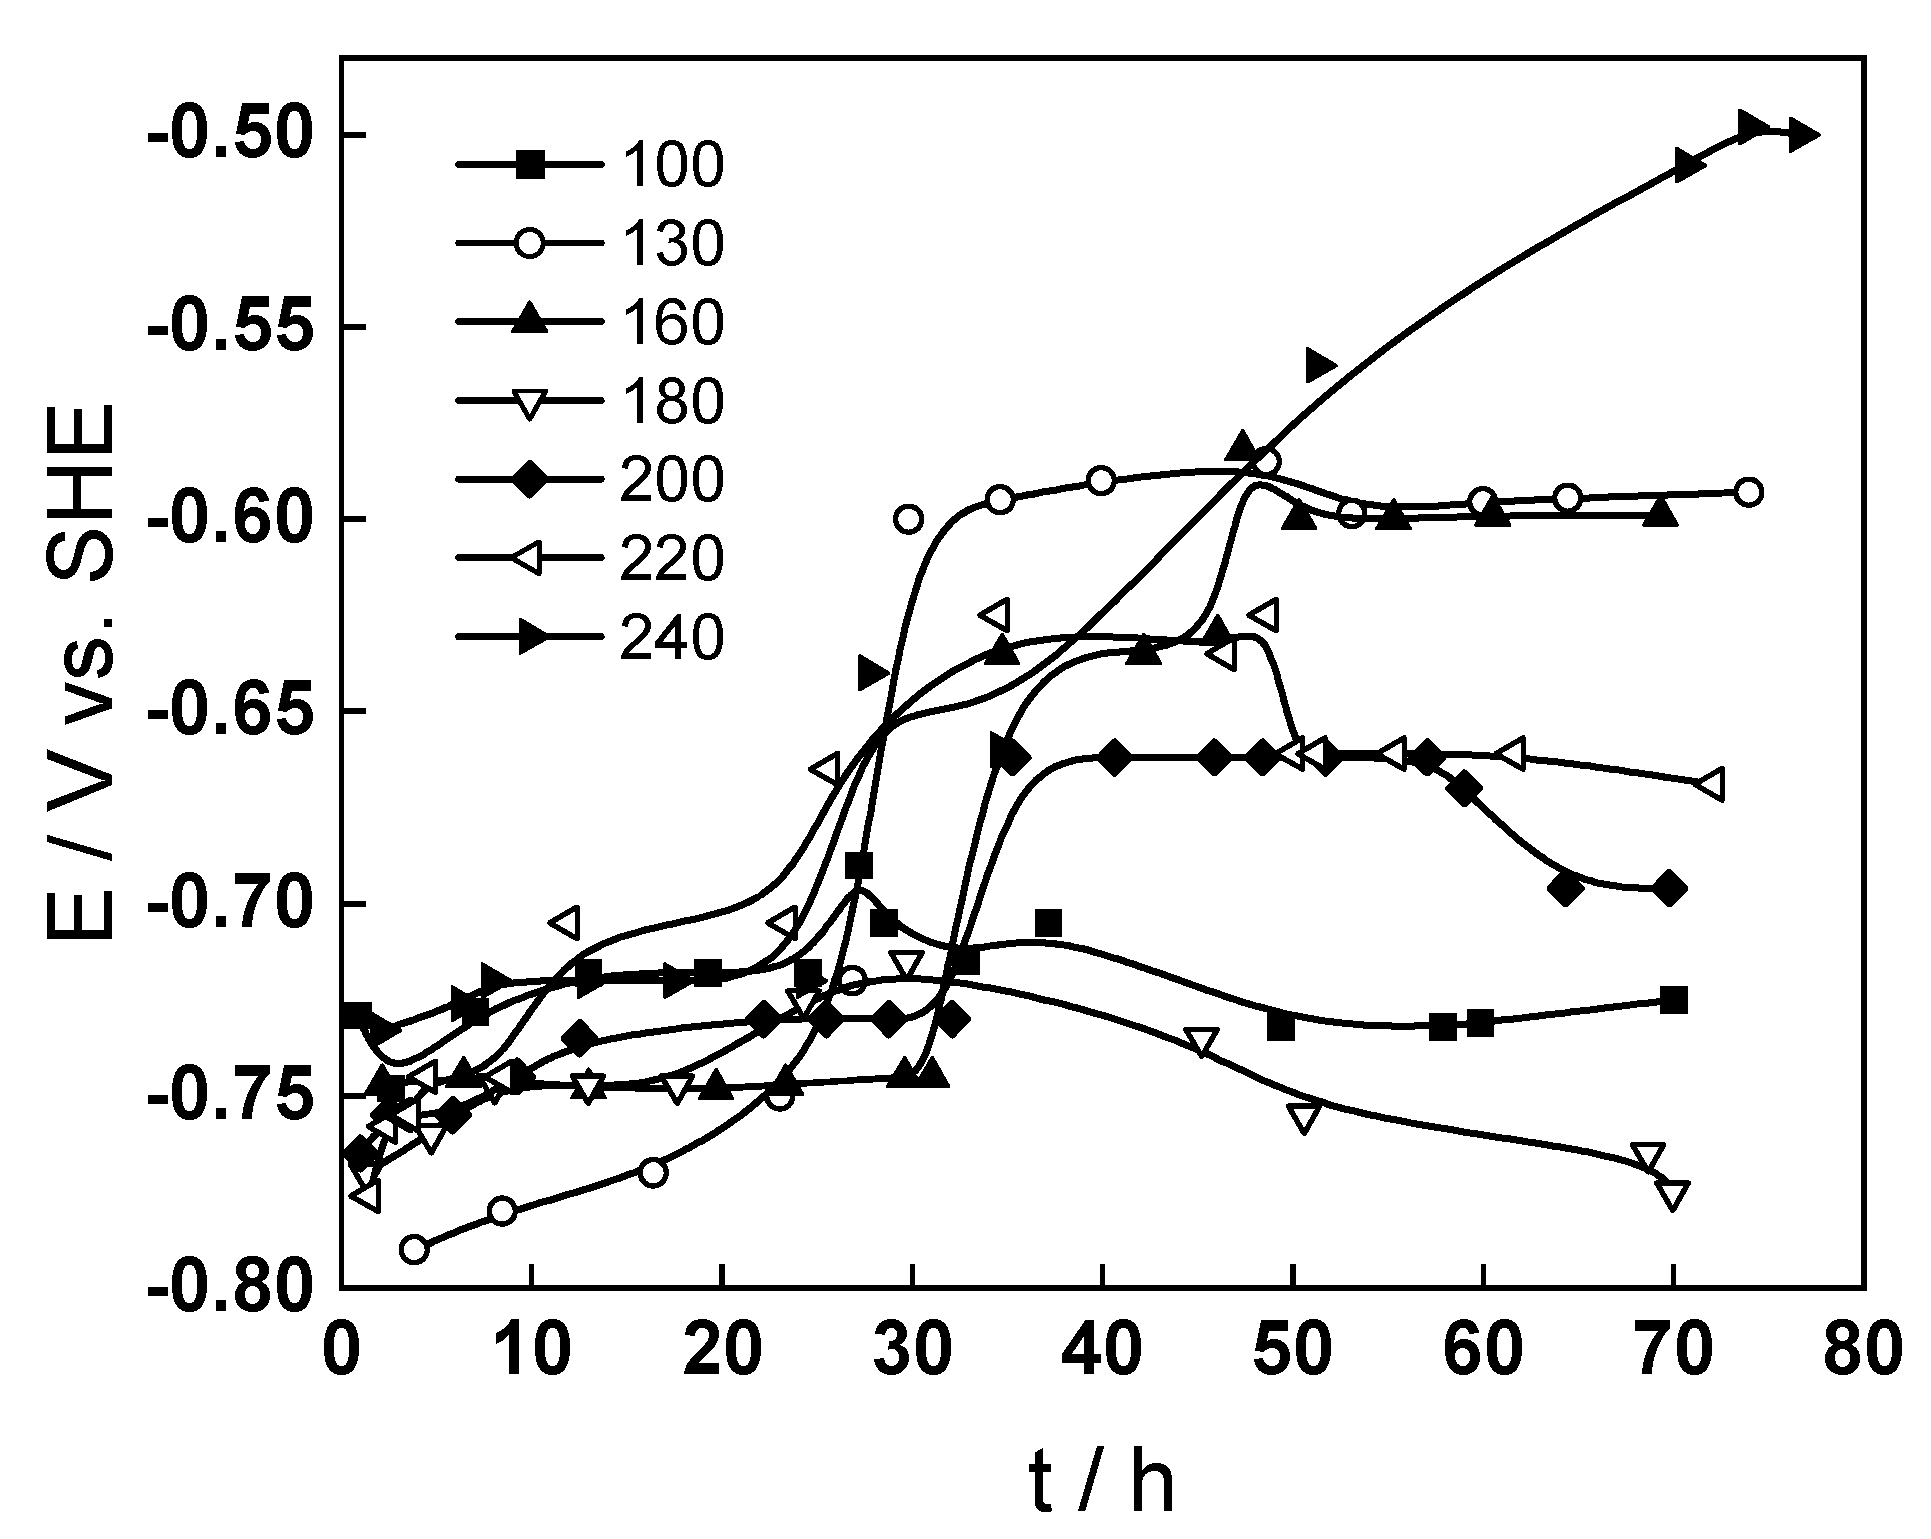
The corrosion-potential time dependences in the interval 100–240 °C are presented in
Figure 3.
During the first 24 h of oxidation (at a volume flow rate 10 dm3 h−1) potentials are lower than −0.70 V and weakly dependent on time. Decreasing the volume flow rate to 4 dm3 h−1 leads to a displacement of the corrosion potential to more positive values regardless of the temperature of oxidation. The subsequent increase in the flow rate leads to a return of the corrosion potential to more negative values in the temperature range 130–220 °C, whereas such a return is not observed at 100 and 240 °C.
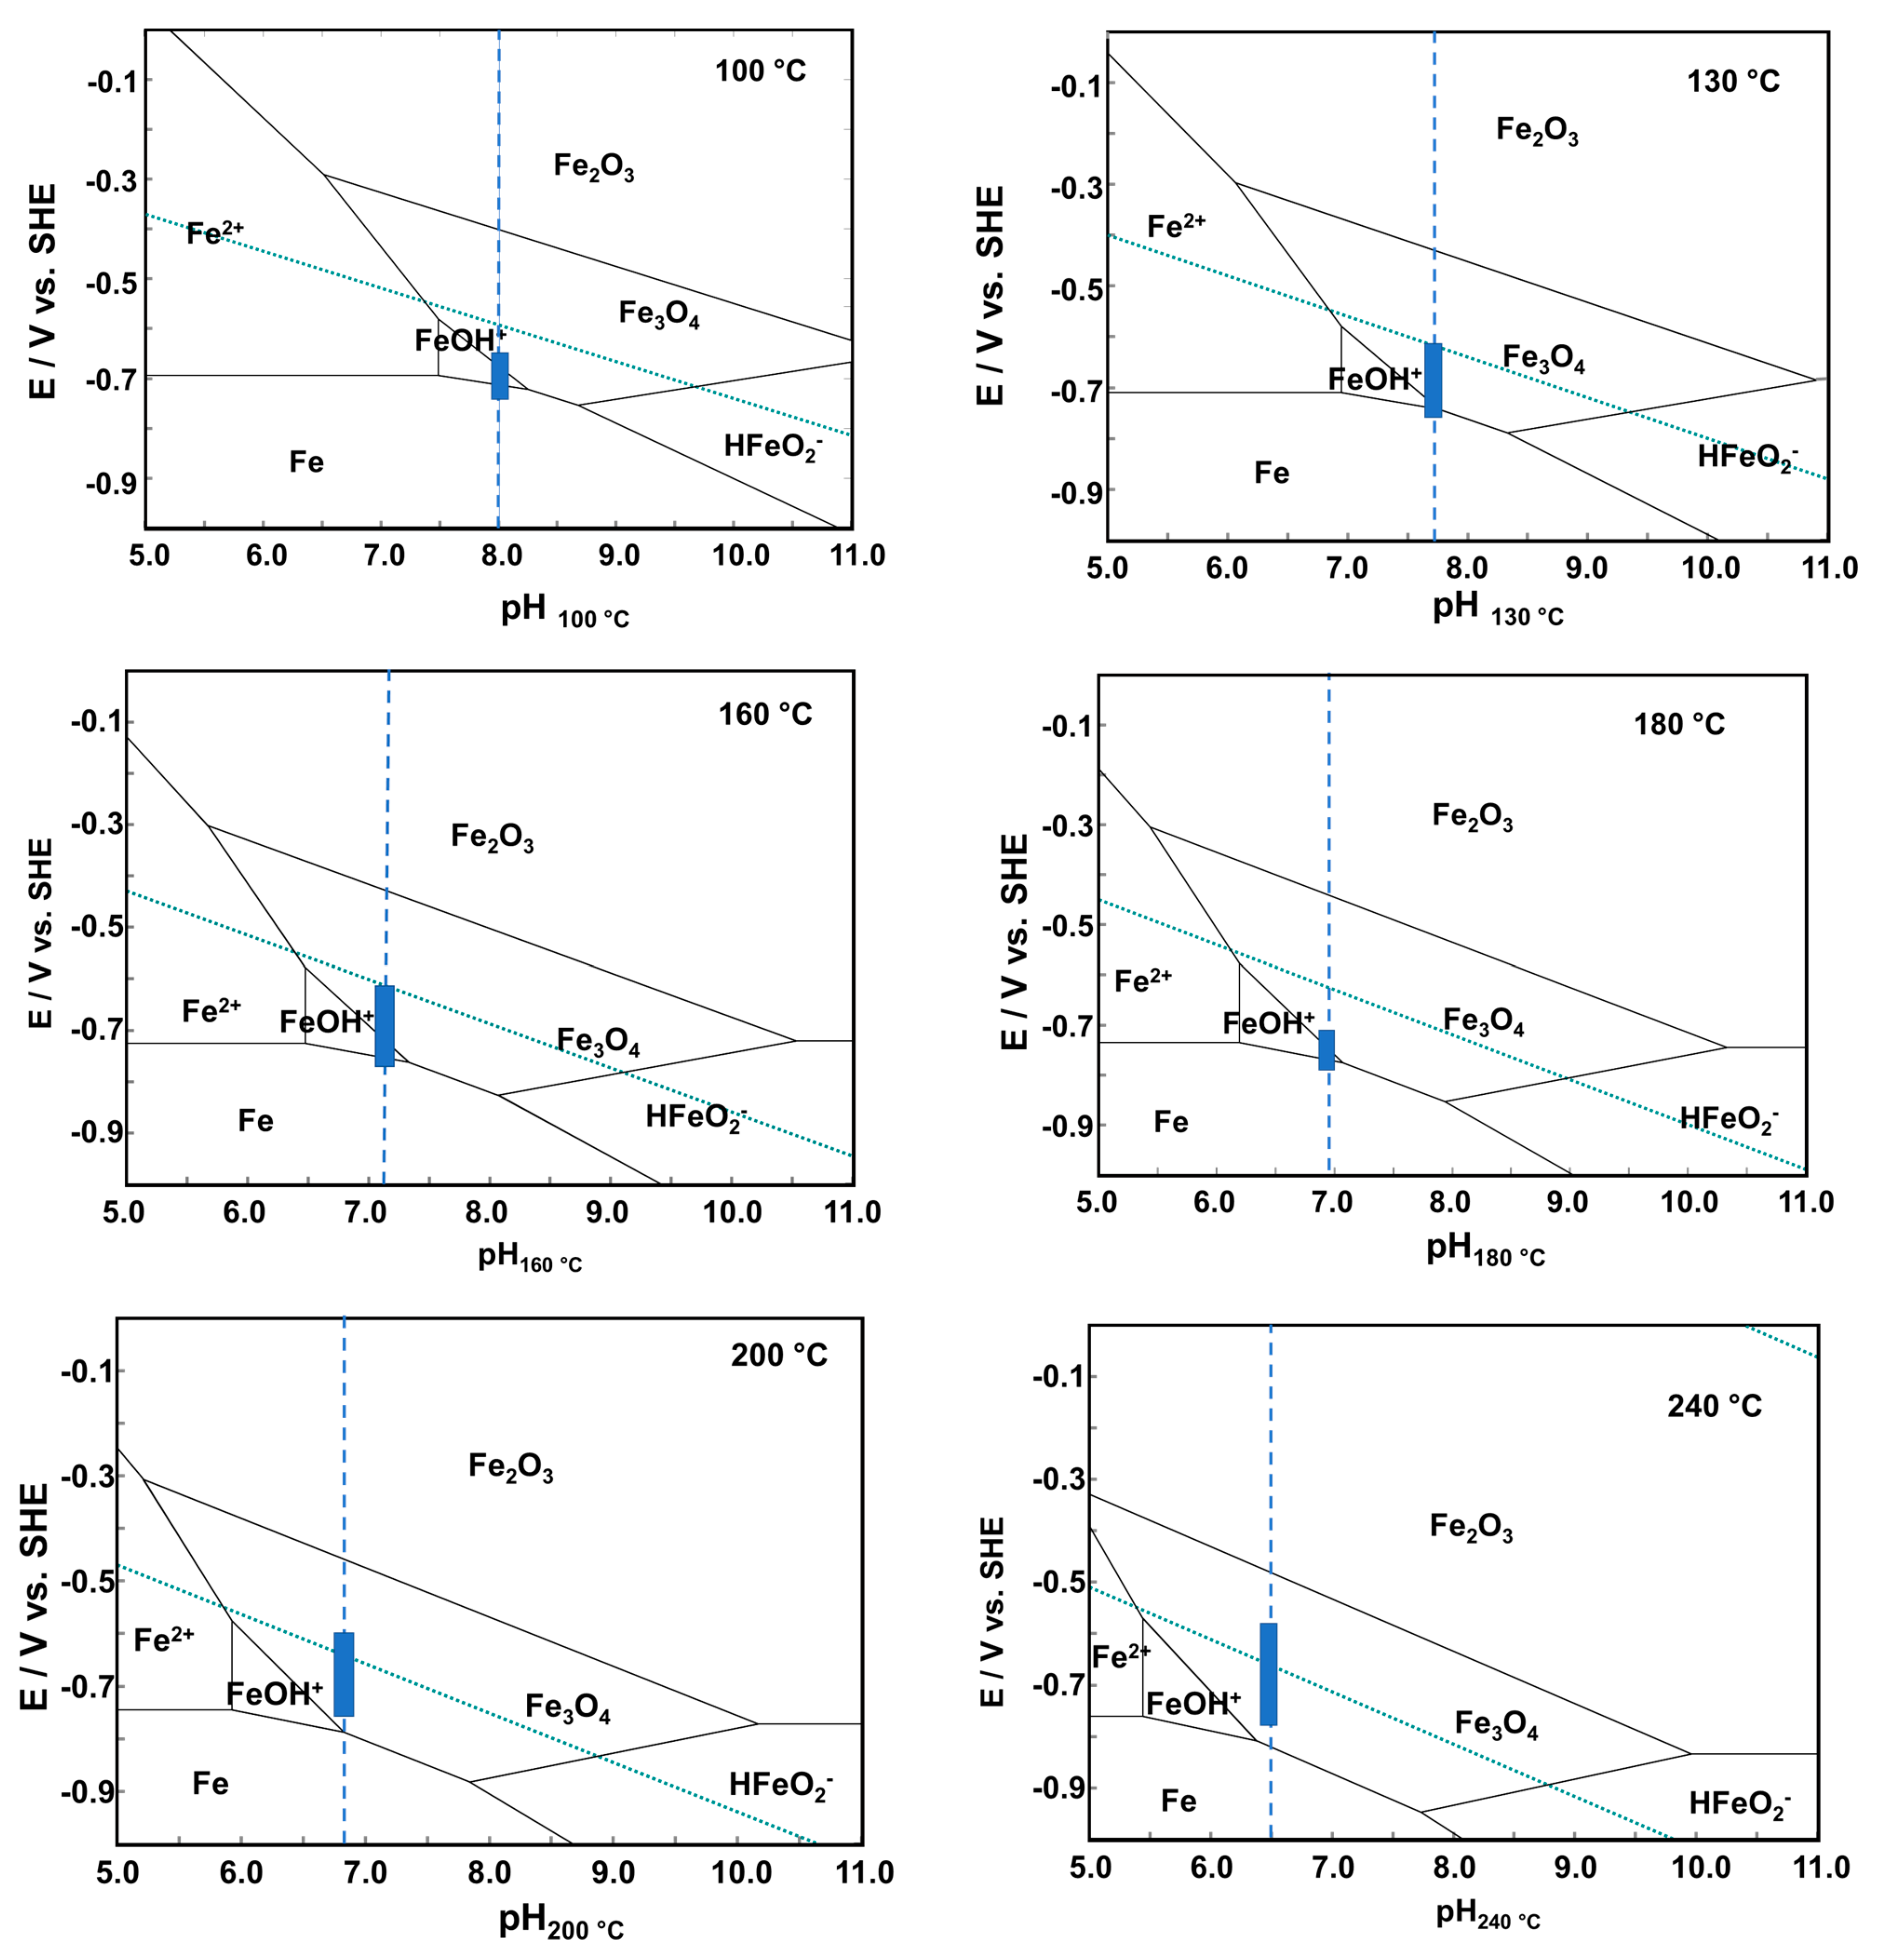
The interval of corrosion potentials at all temperatures is inserted in the corresponding E-pH diagrams of the Fe–H
2O system calculated by commercial software [
20] in
Figure 4. At temperatures up to 180 °C, the thermodynamically stable corrosion product is predicted to be the divalent iron ion FeOH
+, whereas at higher temperatures corrosion potentials are located in the magnetite stability region. These calculations indicate that both aqueous ions and magnetite are expected to be formed during the corrosion of 22K in the AMETA secondary coolant.
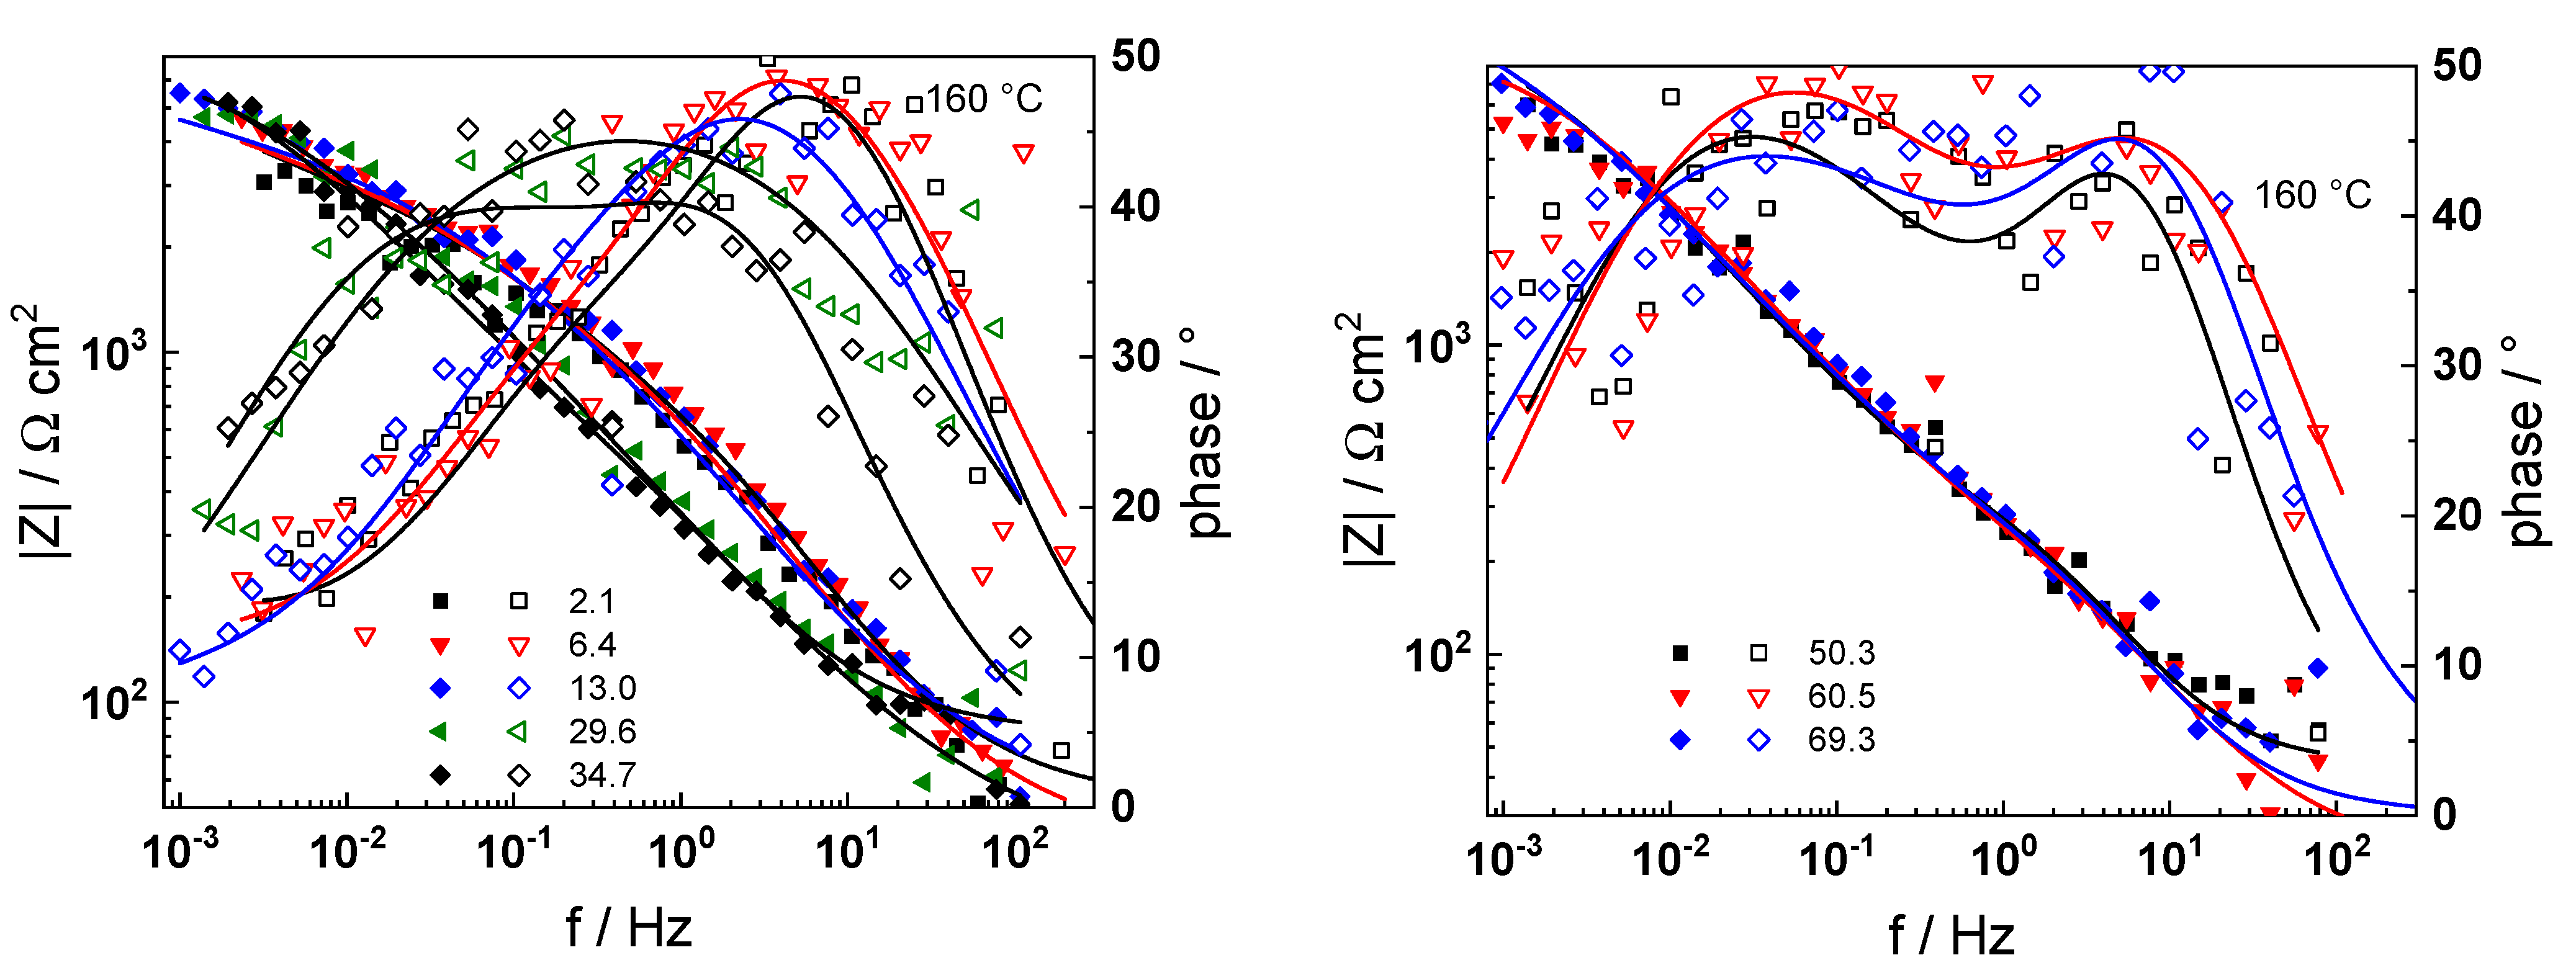
3.3. Influence of Temperature and Flow Rate on Impedance Spectra
The impedance spectra of 22K in AMETA electrolyte at the investigated temperatures (100–240 °C) and oxidation times (1–72 h) are collected in
Figure 5,
Figure 6,
Figure 7,
Figure 8,
Figure 9 and
Figure 10 in Bode coordinates. To facilitate the identification of processes in the high-frequency region, 95% of the electrolyte resistance is subtracted from the spectra. The impedance magnitude at frequencies approaching zero (Z
f→0) that can be interpreted as the polarization resistance (i.e., the inverse of corrosion/oxidation rate) decreases with temperature in the interval 100–180 °C and increases at higher temperatures, i.e., the temperature dependence of the corrosion rate is non-monotonous.
Deconvolution of the impedance spectra indicates three processes with different characteristic frequencies in the phase angle curves. According to the published interpretation of the impedance spectra of construction materials in high-temperature water electrolytes [
22,
23,
24,
25,
26,
27], the process with the highest characteristic frequency is related to the electrical properties of the protective layer of oxide; that at intermediate frequencies, with ion and electron transfer at the oxide–coolant interface, and the low-frequency process is identified as the transport of point defects in the oxide. Spectra calculated using the model described in the Discussion section are shown with solid lines and demonstrate its ability to reproduce quantitatively both the magnitude and the frequency dependence of experimental spectra. Thus, the data can be used to parameterize the model and estimate rates of production of soluble iron and magnetite particles, which is attempted in the next part of the paper.
3.4. Estimation of Oxide Film Thickness
The potential quantity of charge curves (chrono-potentiometric curves at constant current density) in de-aerated borate buffer solution (pH 8.4) of a range of samples oxidized for 72 h at different temperatures in AMETA coolant are collected in
Figure 11.
The method to estimate oxide thickness is based on the assumption that during constant current polarization in borate buffer solution, reductive dissolution of the oxide proceeds according to the overall reaction
The oxide thickness is calculated using two methods—the method of tangents in potential-charge curves, illustrated in
Figure 11 via Faraday’s law with 100% coulombic efficiency, and from the concentration of divalent iron measured by ICP-OES in the solution after completion of polarization (once again, using Faraday’s law). The estimates obtained via the two methods coincide with the reproducibility of the results, as shown in
Figure 11 (right). These values are used to calibrate the calculations described in the following section.
4. Discussion
4.1. Description of the Model
The present model is based on the mixed-conduction model for oxide films (MCM), in analogy to previous estimates of the rates of oxidation and corrosion of low-alloyed and stainless steels in simulated primary and secondary coolants of nuclear power plants [
22,
23,
24,
25,
26,
27]. Assuming that the protective oxide on the studied steel is magnetite, the following processes take place at the alloy–oxide (A/O) and oxide–coolant (O/C) interfaces
Thus, the reactions of the formation of soluble iron and hydroxide particles proceed in parallel at the protective oxide–coolant interface. The processes at the inner and outer interfaces are coupled by oxygen transport via vacancies and iron transport via interstitial cations. Accordingly, the transfer function that describes the impedance of the system has the form [
27]
In the above equations, the impedance of the oxide–coolant interface
ZO/C is represented as a parallel combination of an interfacial capacitance
CO/C and a charge transfer resistance of a single-step reaction (water reduction with hydrogen evolution)
RF/S. On the other hand, the impedance of the protective oxide
Zox is a parallel combination of the impedances of its electric properties,
Ze, and two ionic transport impedances corresponding to oxygen (
Zion,O) and iron (
Zion,Fe), respectively. The detailed expressions of these impedances are given below [
27]
In these expressions, De, DO, and DFe are the diffusion coefficients of electrons, oxygen vacancies, and iron cation interstitials, L is the protective film thickness, E is the electric field strength in the oxide, ε its dielectric constant, α is the part of the potential consumed as a potential drop at the oxide–coolant interface.
According to the model, the film thickness increases with time following the equation
Here,
LO is the initial film thickness,
Vm,ox—its molar volume (44.5 cm
3 mol
−1 for Fe
3O
4), and α
O—the transfer coefficient of the oxidation reaction at the alloy–oxide interface. The rate of dissolution of Fe through the oxide is given by:
The integration of the last equation gives the possibility to calculate the corrosion release rate (i.e., the rate of generation of soluble iron ions) as the alloy thinning rate in mm/y.
Vm,Fe being the atomic volume of Fe (7.2 cm3 mol−1).
4.2. Estimation of Kinetic and Transport Parameters
Using a complex nonlinear regression of the experimental impedance spectra with respect to the model equations by the Levenberg–Marquardt algorithm, estimates of the kinetic and transport parameters are obtained. As mentioned already above, the calculations were calibrated with the oxide thicknesses at the end of exposure obtained by cathodic reduction in borate buffer at room temperature. The dependences of the main parameters, layer thickness
L, field strength
E, interfacial capacitance
CO/C, and charge transfer resistance
RO/C at the oxide/coolant interface at the time of exposure, are collected in
Figure 12. The dependences of the remaining parameters on oxidation time were found to be comparatively insignificant.
The growth of the oxide follows a direct logarithmic law at all temperatures in accordance with model predictions. The field strength in the oxide decreases with time due to the accumulation of point defects forming a space charge. It is worth noting that the decrease of the volume flow rate at 24 h (from 10 to 4 dm3 h−1) has some influence on the field strength and the charge transfer resistance, whereas no influence of the subsequent increase of flow rate at 48 h is observed. This means that the oxide formed in turbulent conditions is weakly influenced by the hydrodynamic parameters, as inferred already from the analysis of the experimental impedance spectra.
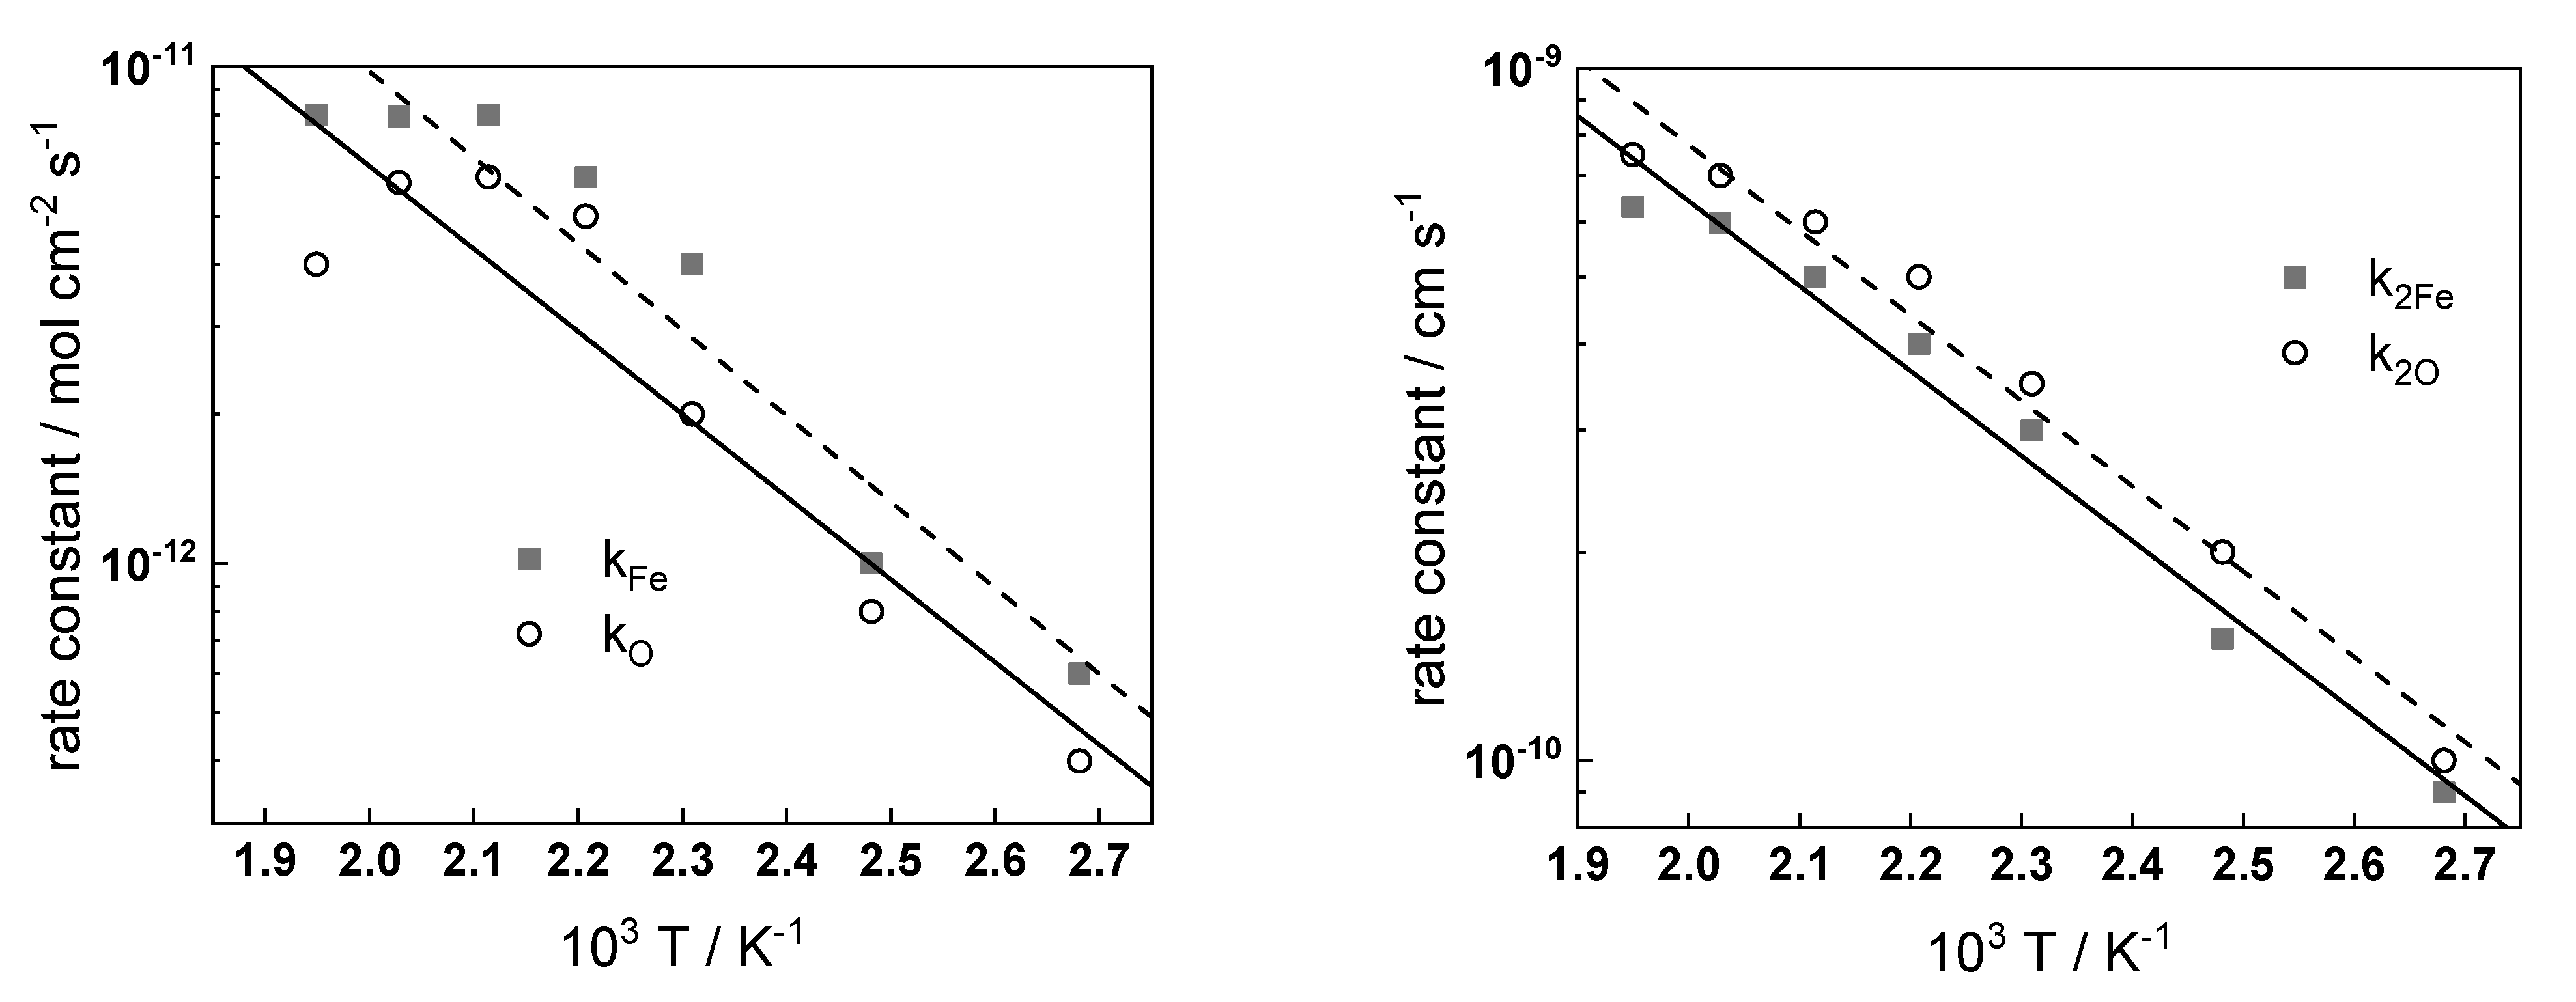
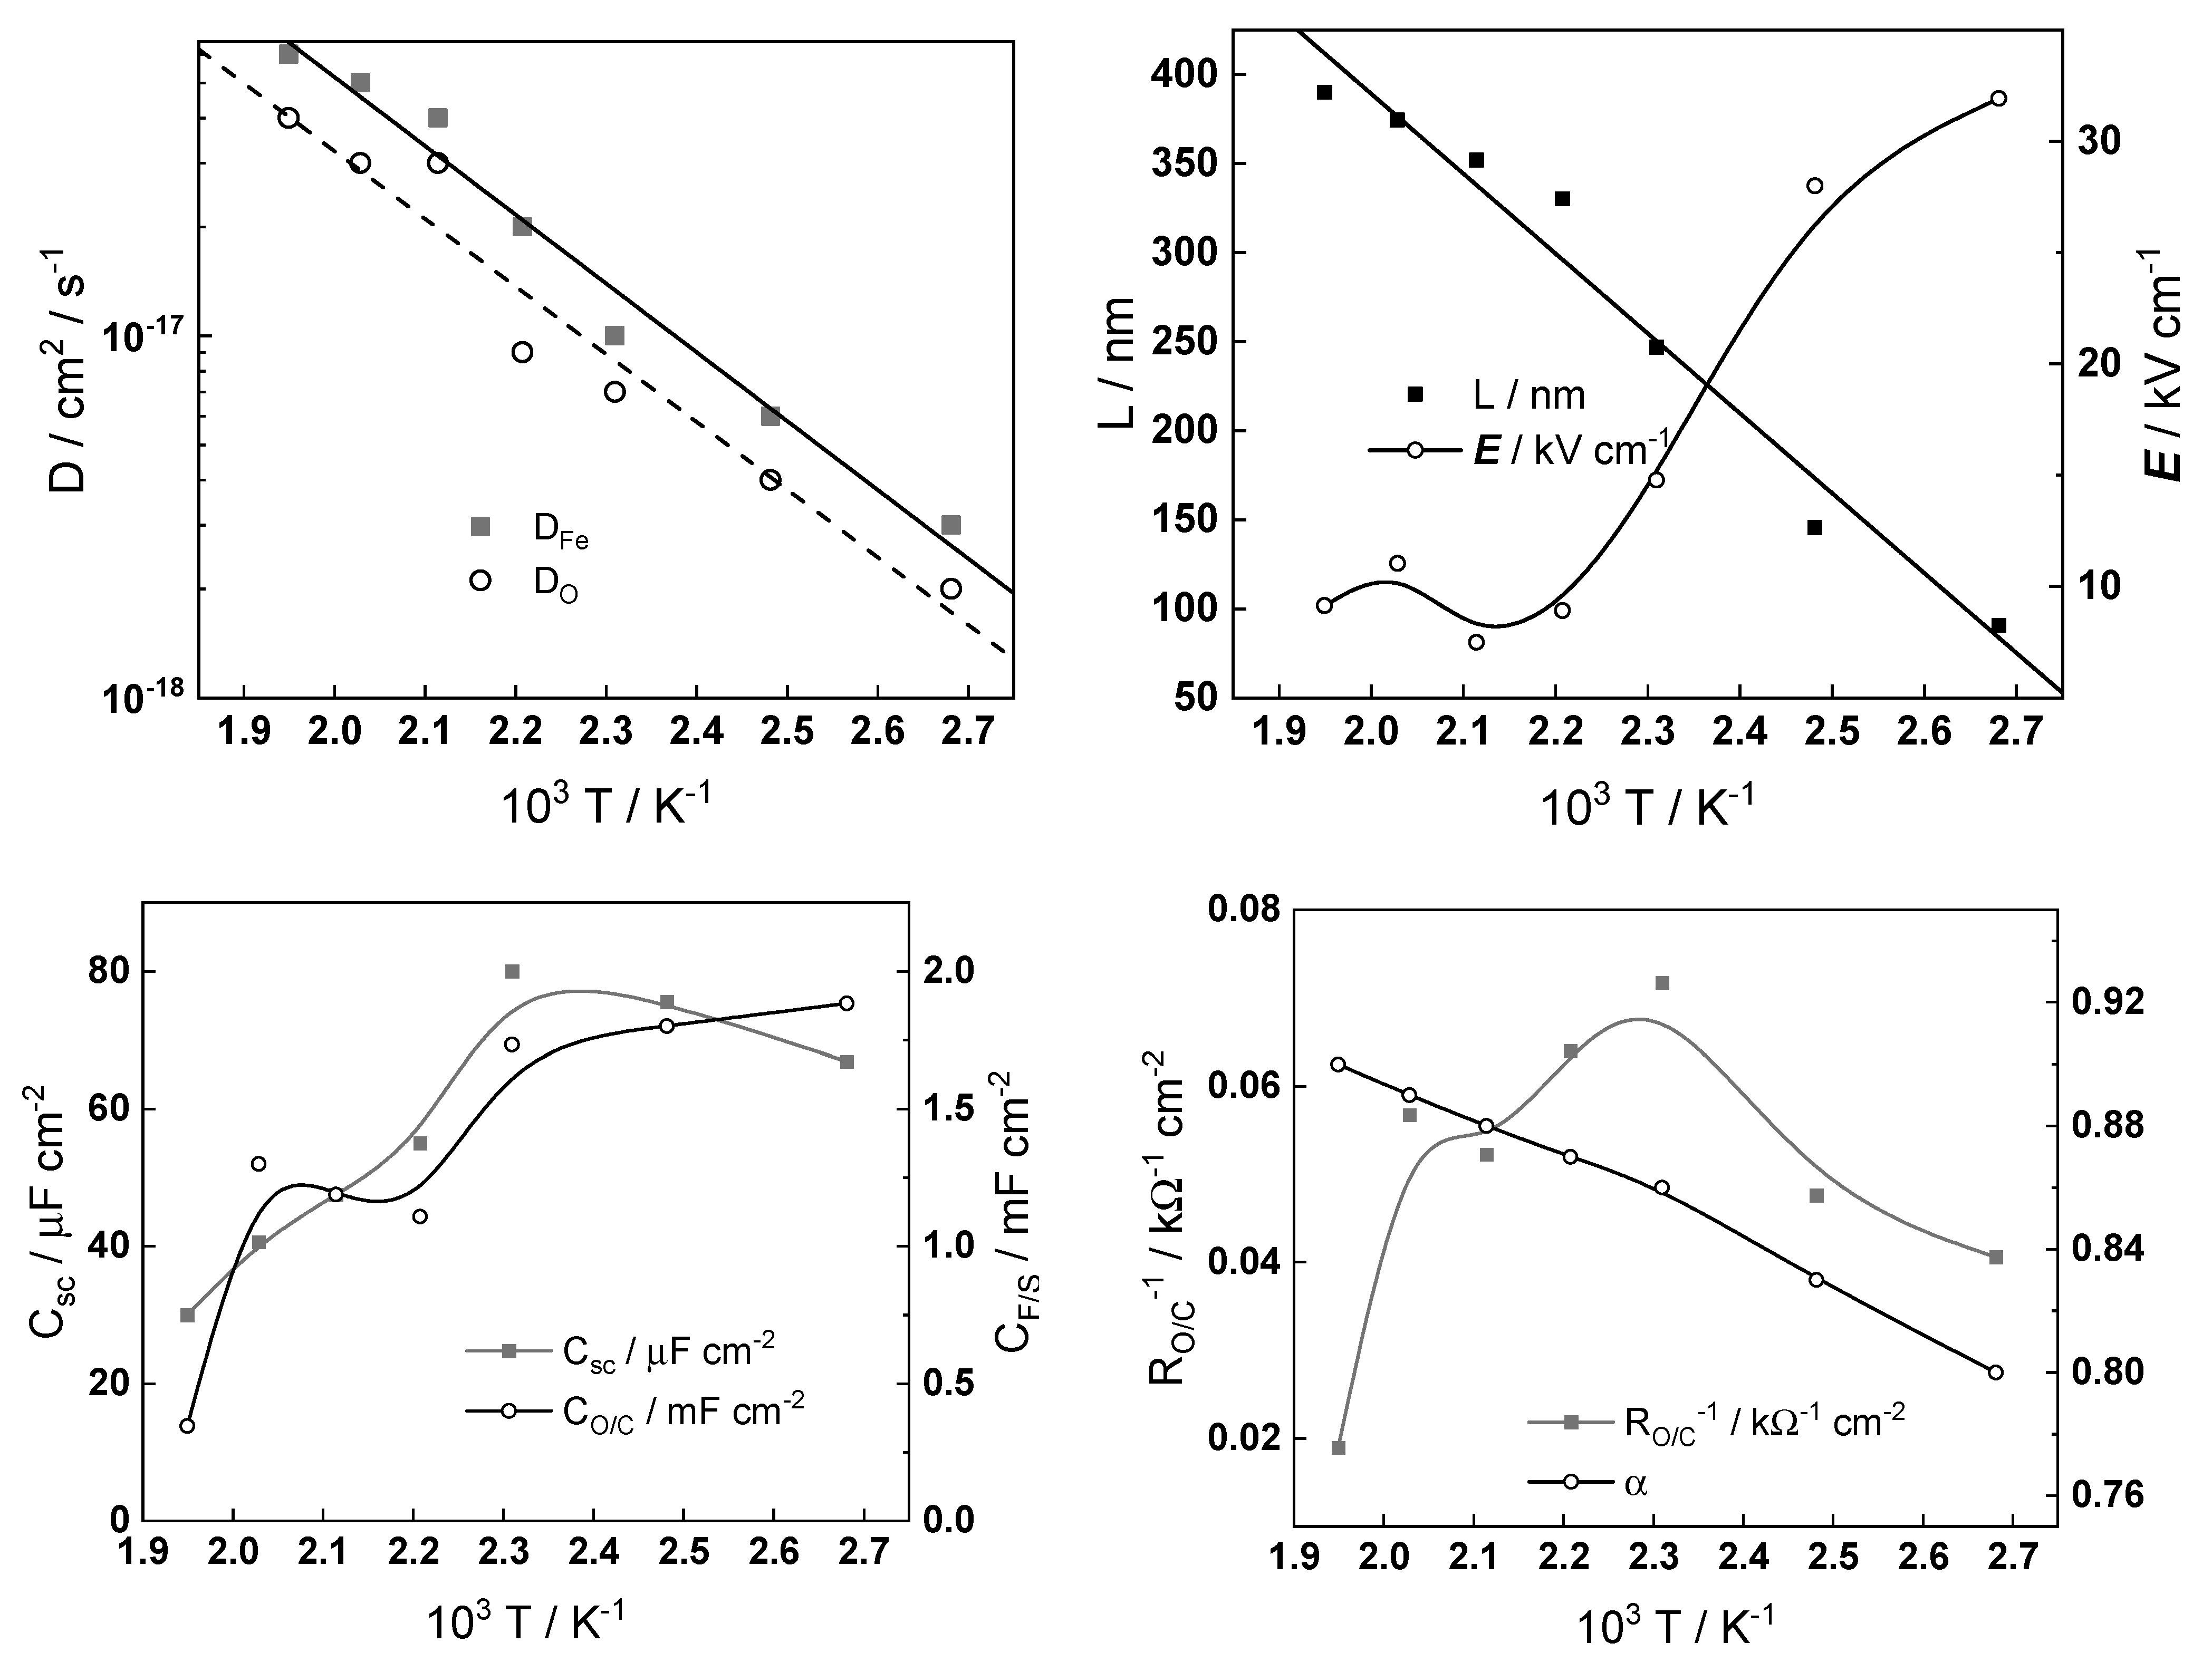
The temperature dependences of kinetic and transport parameters at the end of exposure (ca. 72 h) are shown in Arrhenius coordinates in
Figure 13.
The following conclusions can be drawn on the basis of their values:
The rate constants of electrochemical processes at the alloy–oxide and oxide–coolant interfaces increase exponentially with temperature, as expected. The values of the apparent activation energies are 33 ± 2 and 23 ± 2 kJ mol−1 for the reactions at the inner and outer interfaces, values that are typical for electrochemical processes;
The diffusion coefficients of oxygen and iron ions also follow an Arrhenius dependence as a first approximation, the activation energy being on the order of 45 kJ mol−1. That value is ca. two times lower than the activation energy for magnetite formation in steam via solid-state diffusion, i.e., the transport of cations and anions most probably proceeds via grain boundaries in the nanocrystalline oxide;
The field strength decreases with temperature in accordance with previous calculations for stainless steel in a borate buffer solution at 150–300 °C [
28]. This is due to an increase in the number of defects in the film with the temperature. It is important to mention that the field strength in the oxide on carbon steel is much lower than that in the oxide on stainless steel, which can be due to a different composition of the protective layer (magnetite on carbon steel and chromite FeCr
2O
4 on type 316 stainless steel);
Both the capacitance of the space charge layer in the oxide and the capacitance at the oxide–coolant interface in general decrease with temperature. The space charge capacitance has relatively high values, which is in accordance with the fact that magnetite is a degenerated semiconductor with a small depletion layer width. The interfacial capacitance values (0.5–2.0 mF cm−2) point out to its nature as a pseudo-capacitance of an intermediate of the film dissolution or water reduction reaction.
From the point of view of recent reviews of flow-assisted corrosion [
3,
4,
5,
6,
7,
8], the most interesting dependence is that of the inverse of the charge transfer resistance at the oxide–coolant interface (
RO/C−1). This parameter passes through a maximum at ca. 160 °C in accordance with operational data for the flow-assisted corrosion rate in steam generators of both conventional and nuclear power plants. It can be argued that in the studied conditions, the rate of flow-assisted corrosion is determined by the processes at the interface of oxide–solution and the maximum is due to the opposing influence of two factors—magnetite solubility, which decreases with increasing temperature [
7], and the dissolution rate of the oxide, which increases with temperature.
5. Conclusions
The flow-assisted corrosion of carbon steel type 22K in an ammonia-ethanolamine secondary coolant of a nuclear power plant is studied by in situ EIS in the temperature interval 100–240 °C at 90 bar and inlet volume flow rates 4–10 dm3 h−1. Hydrodynamic calculations indicate that the developed flow-through cell with an accelerating insert ensures linear flow rates up to 1 m s−1 and Reynolds numbers above 104, i.e., turbulent conditions are reached. The influence of flow rate on corrosion potential is explained by a change of the main thermodynamically stable product with increasing temperature (from FeOH+aq in the interval 100–160 °C to magnetite at higher temperatures). The effect of changing the flow rate on electrochemical impedance spectra is relatively insignificant, which means that in the present experimental conditions, corrosion rates are limited by interfacial processes and solid-state transport and not by the convective transfer of products in the coolant.
The results are interpreted with a quantitative kinetic model featuring two parallel processes—growth and dissolution of oxide with soluble Fe(OH)2 as the end product and dissolution of Fe through the protective film resulting in soluble iron ions (probably FeOH+) as the end product. Equations for the fluxes of iron hydroxide are limited by the dissolution rate of oxide and divalent iron ions are limited by the transport and ejection of interstitials from the oxide. The model is calibrated by oxide thicknesses at the end of exposure estimated via galvanostatic cathodic reduction.
The model is fully parameterized by complex nonlinear regression of experimental impedance spectra to the respective transfer function, allowing for the rate constants of film formation and metal oxidation at the alloy–oxide interface, diffusion coefficients of oxygen vacancies, and interstitial iron cations, as well as field strength in the growing oxide to be estimated as depending on temperature (100–240 °C). On the basis of these calculations, equations for oxide growth and release rates with time were derived. As a main conclusion, the soluble iron release rate is proposed to obey the equation
i.e., it is determined by both the rate of iron oxidation at the alloy–oxide interface, the field strength in the oxide, and the thickness of the protective layer. The temperature dependence of the flow-assisted corrosion rate in the present experimental conditions indicates that it is expressed by the reciprocal value of the charge transfer resistance at the oxide–coolant interface. Further research is needed in order to establish quantitative correlations between iron release rates and hydrodynamic parameters in a range that covers the operational conditions of steam generators.
Author Contributions
Conceptualization, M.B. and I.B.; methodology, M.B.; validation, I.B. and V.K.; formal analysis, I.B.; investigation, V.K.; resources, M.B.; data curation, V.K.; writing—original draft preparation, I.B.; writing—review and editing, M.B.; visualization, I.B. All authors have read and agreed to the published version of the manuscript.
Funding
This research was funded by The National Scientific Fund of Bulgaria, grant number KTI-06-H59/4-2021 “Deterministic modeling of degradation of structural materials for energy systems in high-temperature electrolytes”. Measurements were performed with equipment of the National Scientific Infrastructure “Energy Storage and Hydrogen Energy” (ESHER, contract DO1-160/28.08.18).
Data Availability Statement
The data presented in this study are available on request from the corresponding author.
Conflicts of Interest
The authors declare no conflict of interest.
References
- Ahmed, W.H. Evaluation of the proximity effect on flow-accelerated corrosion. Ann. Nucl. Energy 2010, 37, 598–605. [Google Scholar] [CrossRef]
- Betova, I.; Bojinov, M.; Saario, T. Predictive Modelling of Flow-Accelerated Corrosion—Unresolved Problems and Issues; VTT-R-08125-10; VTT Technical Research Centre of Finland: Espoo, Finland, 2010; p. 55. [Google Scholar]
- Poulson, B. Predicting and Preventing Flow Accelerated Corrosion in Nuclear Power Plant. Int. J. Nuclear Energy 2014, 2014, 423295. [Google Scholar] [CrossRef]
- Dooley, R.B. Flow-Accelerated Corrosion in Fossil and Combined Cycle/HRSG Plants. Power Plant Chem. 2008, 10, 68–89. [Google Scholar]
- Trevin, S. Flow accelerated corrosion (FAC) in nuclear power plant components. In Nuclear Corrosion Science and Engineering; Feron, D., Ed.; Woodhead Publishing Limited: Sawston, UK, 2012; pp. 186–229. [Google Scholar]
- Tomarov, G.V.; Shipkov, A.A. Flow-Accelerated Corrosion Wear of Power-Generating Equipment: Investigations, Prediction, and Prevention. Therm. Eng. 2018, 65, 493–503. [Google Scholar] [CrossRef]
- Dooley, R.B.; Lister, D. Flow-Accelerated Corrosion in Steam-Generating Plants. Power Plant Chem. 2018, 20, 194–244. [Google Scholar]
- Gipon, E.; Trevin, S. Flow-accelerated corrosion in nuclear power plants. In Nuclear Corrosion—Research, Progress and Challenges, European Federation of Corrosion (EFC) Series; Elsevier: Amsterdam, The Netherlands, 2020; pp. 213–250. [Google Scholar]
- Schmitt, G.; Bakalli, M. Flow-Assisted Corrosion. In Shreir’s Corrosion, 4th ed.; Richardson, T., Ed.; Elsevier: Amsterdam, The Netherlands, 2007; Volume 2, pp. 954–987. [Google Scholar]
- Vermorel, F.; Romand, M.; Charbonnier, M.; Bouchacourt, M. Caractérisation par émission et diffraction des rayons X des couches d’oxydes formées par corrosion-érosion des aciers dans les circuits secondaires des centrales REP. J. Phys. IV 2000, 10, Pr10-313–Pr10-322. [Google Scholar] [CrossRef]
- Nazradani, S.; Nakka, R.K.; Hopkins, D.; Stevens, J. Characterization of oxides on FAC susceptible small-bore carbon steel piping of a power plant. Int. J. Press. V. Pip. 2009, 86, 845–852. [Google Scholar] [CrossRef]
- Laleh, M.; Xu, Y.; Tan, M.Y.J. A three-dimensional electrode array probe designed for visualising complex and dynamically changing internal pipeline corrosion. Corros. Sci. 2023, 211, 110924. [Google Scholar] [CrossRef]
- Moed, D.H.; Weerakul, S.; Lister, D.H.; Leaukosol, N.; Rietveld, L.C.; Verliefde, A.R.D. Effect of Ethanolamine, Ammonia, Acetic Acid, and Formic Acid on Two-Phase Flow Accelerated Corrosion in Steam–Water Cycles. Ind. Eng. Chem. Res. 2015, 54, 8963–8970. [Google Scholar] [CrossRef]
- Olmedo, A.M.; Bordoni, R. Studies of Oxide Layers Grown at 260 °C on A106 B Carbon Steel in Aqueous Medium with Ethanolamine or Morpholine. Mater. Sci. Appl. 2015, 6, 783–791. [Google Scholar] [CrossRef] [Green Version]
- Kim, S.; Kim, T.; Lee, Y.; Kim, J.H. Soft X-ray study on electronic structure of passive oxide layer of carbon steel and low alloy steel in flow-accelerated corrosion environments of pressurized water reactors. Corros. Sci. 2019, 159, 108143. [Google Scholar] [CrossRef]
- Zhang, T.; Li, T.; Lu, J.; Guo, Q.; Xu, J. Microstructural Characterization of the Corrosion Product Deposit in the Flow-Accelerated Region in High-Temperature Water. Crystals 2022, 12, 749. [Google Scholar] [CrossRef]
- Hu, Y.; Xin, L.; Hong, C.; Han, Y.; Lu, Y. Microstructural Understanding of Flow Accelerated Corrosion of SA106B Carbon Steel in High-Temperature Water with Different Flow Velocities. Materials 2023, 16, 3981. [Google Scholar] [CrossRef] [PubMed]
- Huo, Y.; Tan, M.Y.-T.; Forsyth, M. Visualising dynamic passivation and localised corrosion processes occurring on buried steel surfaces under the effect of anodic transients. Electrochem. Commun. 2016, 66, 21–24. [Google Scholar] [CrossRef]
- Xu, Y.; Tan, M.Y.J. Probing the initiation and propagation processes of flow accelerated corrosion and erosion corrosion under simulated turbulent flow conditions. Corros. Sci. 2019, 151, 163–174. [Google Scholar] [CrossRef]
- HSC Software, version 6.0; Outokumpu Research Oy: Outokumpu, Finland, 2006.
- OLI Analyzer Studio, version 3.1; OLI Systems, Inc.: Parsippany, NJ, USA, 2010.
- Sipilä, K.; Bojinov, M.; Mayinger, W.; Saario, T.; Stanislowski, M. Effect of chloride and sulfate additions on corrosion of low alloy steel in high-temperature water. Electrochim. Acta 2015, 173, 757–770. [Google Scholar] [CrossRef]
- Järvimäki, S.; Saario, T.; Sipilä, K.; Bojinov, M. Effect of hydrazine on general corrosion of carbon and low-alloyed steels in pressurized water reactor secondary side water. Nucl. Eng. Des. 2015, 295, 106–115. [Google Scholar] [CrossRef]
- Sipilä, K.; Bojinov, M.; Jäppinen, E.; Mayinger, W.; Saario, T.; Selektor, M. Localized corrosion of pressure vessel steel in a boiling water reactor cladding flaw—Modeling of electrochemical conditions and dedicated experiments. Electrochim. Acta 2017, 241, 10–27. [Google Scholar] [CrossRef]
- Alami, A.; Bojinov, M. Effect of sulfate and dissolved hydrogen on oxide films on stainless steel in high-temperature water. J. Solid State Electrochem. 2017, 21, 3505–3518. [Google Scholar] [CrossRef]
- Jäppinen, E.; Ikäläinen, T.; Järvimäki, S.; Saario, T.; Sipilä, K.; Bojinov, M. Corrosion behavior of carbon steel coated with octadecylamine in the secondary circuit of a pressurized water reactor. J. Mater. Eng. Perform. 2017, 26, 6037–6046. [Google Scholar] [CrossRef]
- Bojinov, M.; Jäppinen, E.; Saario, T.; Sipilä, K.; Toivonen, A. Effect of lead and applied potential on corrosion of carbon steel in steam generator crevice solutions. Corros. Sci. 2019, 159, 108117. [Google Scholar] [CrossRef]
- Bojinov, M.; Kinnunen, P.; Lundgren, K.; Wikmark, G. A Mixed-Conduction Model for the Oxidation of Stainless Steel in a High-Temperature Electrolyte—Estimation of Kinetic Parameters of Oxide Layer Growth and Restructuring. J. Electrochem. Soc. 2005, 152, B250–B261. [Google Scholar] [CrossRef]
Figure 1.
Scheme of the insert used to investigate flow-assisted corrosion.
Figure 1.
Scheme of the insert used to investigate flow-assisted corrosion.
Figure 2.
(a) Profiles of linear flow rate (m s−1) and (b) Reynolds number in the cell at 240 °C, (c) dependence of flow rate and Reynolds number on temperature.
Figure 2.
(a) Profiles of linear flow rate (m s−1) and (b) Reynolds number in the cell at 240 °C, (c) dependence of flow rate and Reynolds number on temperature.
Figure 3.
Corrosion potential of 22K in simulated secondary coolant at temperatures from 100 to 240 °C.
Figure 3.
Corrosion potential of 22K in simulated secondary coolant at temperatures from 100 to 240 °C.
Figure 4.
pH diagrams of an Fe–H2O system at the studied temperatures. The rectangle shows the interval of corrosion potentials at the operational pH of the coolant (marked with a vertical line).
Figure 4.
pH diagrams of an Fe–H2O system at the studied temperatures. The rectangle shows the interval of corrosion potentials at the operational pH of the coolant (marked with a vertical line).
Figure 5.
Impedance spectra at 100 °C as a function of time. Points—experimental values, solid lines—best-fit calculation according to the proposed model. Parameter is the exposure time in h.
Figure 5.
Impedance spectra at 100 °C as a function of time. Points—experimental values, solid lines—best-fit calculation according to the proposed model. Parameter is the exposure time in h.
Figure 6.
Impedance spectra at 130 °C as a function of time. Points—experimental values, solid lines—best-fit calculation according to the proposed model. Parameter is the exposure time in h.
Figure 6.
Impedance spectra at 130 °C as a function of time. Points—experimental values, solid lines—best-fit calculation according to the proposed model. Parameter is the exposure time in h.
Figure 7.
Impedance spectra at 160 °C as a function of time. Points—experimental values, solid lines—best-fit calculation according to the proposed model. Parameter is the exposure time in h.
Figure 7.
Impedance spectra at 160 °C as a function of time. Points—experimental values, solid lines—best-fit calculation according to the proposed model. Parameter is the exposure time in h.
Figure 8.
Impedance spectra at 180 °C as a function of time. Points—experimental values, solid lines—best-fit calculation according to the proposed model. Parameter is the exposure time in h.
Figure 8.
Impedance spectra at 180 °C as a function of time. Points—experimental values, solid lines—best-fit calculation according to the proposed model. Parameter is the exposure time in h.
Figure 9.
Impedance spectra at 200 °C as a function of time. Points—experimental values, solid lines—best-fit calculation according to the proposed model. Parameter is the exposure time in h.
Figure 9.
Impedance spectra at 200 °C as a function of time. Points—experimental values, solid lines—best-fit calculation according to the proposed model. Parameter is the exposure time in h.
Figure 10.
Impedance spectra at 240 °C as a function of time. Points—experimental values, solid lines—best-fit calculation according to the proposed model. Parameter is the exposure time in h.
Figure 10.
Impedance spectra at 240 °C as a function of time. Points—experimental values, solid lines—best-fit calculation according to the proposed model. Parameter is the exposure time in h.
Figure 11.
(a) Potential quantity of charge curves (chrono-potentiometric curves at constant current density) in de-aerated borate buffer solution (pH 8.4) of a range of samples oxidized for 72 h at different temperatures. The dashed lines show the used method of estimation of the quantity of charge equivalent to the oxide layer thickness; (b) Calculated thickness vs. temperature dependence using the two methods outlined in the text.
Figure 12.
Film thickness (L), field strength (E), interfacial capacitance (CO/C), and charge transfer resistance (RO/C) depending on exposure time at different temperatures (°C).
Figure 12.
Film thickness (L), field strength (E), interfacial capacitance (CO/C), and charge transfer resistance (RO/C) depending on exposure time at different temperatures (°C).
Figure 13.
Temperature dependences of kinetic and transport parameters at the end of exposure.
Figure 13.
Temperature dependences of kinetic and transport parameters at the end of exposure.
Table 1.
Chemical composition of the steel used in the present investigation (wt.%, balance Fe).
Table 1.
Chemical composition of the steel used in the present investigation (wt.%, balance Fe).
| 22K | C | Cr | Cu | Mn | Mo | Ni | P | S | Si |
|---|
| nominal | 0.17–0.24 | ≤0.25 | ≤0.30 | 0.7–1.0 | ≤0.15 | ≤0.25 | ≤0.035 | ≤0.035 | 0.17–0.37 |
| analyzed | 0.22 | 0.23 | 0.04 | 0.91 | 0.12 | 0.40 | 0.012 | 0.02 | 0.31 |
| Disclaimer/Publisher’s Note: The statements, opinions and data contained in all publications are solely those of the individual author(s) and contributor(s) and not of MDPI and/or the editor(s). MDPI and/or the editor(s) disclaim responsibility for any injury to people or property resulting from any ideas, methods, instructions or products referred to in the content. |
© 2023 by the authors. Licensee MDPI, Basel, Switzerland. This article is an open access article distributed under the terms and conditions of the Creative Commons Attribution (CC BY) license (https://creativecommons.org/licenses/by/4.0/).


