Article

Effect of Cooling Rate on Crystallization Behavior during Solidification of Hyper Duplex Stainless Steel S33207: An In Situ Confocal Microscopy Study

1
Key Laboratory for Ferrous Metallurgy and Resources Utilization of Ministry of Education & Hubei Provincial Key Laboratory for New Processes of Ironmaking and Steelmaking, Wuhan University of Science and Technology, Wuhan 430081, China
2
Department of Materials Science and Engineering, KTH Royal Institute of Technology, SE-100 44 Stockholm, Sweden
*
Author to whom correspondence should be addressed.
Crystals 2023, 13(7), 1114; https://doi.org/10.3390/cryst13071114
Submission received: 6 May 2023 / Revised: 8 July 2023 / Accepted: 14 July 2023 / Published: 17 July 2023
(This article belongs to the Special Issue Crystallization of High Performance Metallic Materials)

Abstract

:
Hyper duplex stainless steel (HDSS) is a new alloy group of duplex stainless steels with the excellent corrosion resistance and mechanical properties among the existing modern stainless steels. Due to the incorporation of the high content of alloying elements, e.g., Cr, Ni, Mo, etc., the crystallization behavior of δ-ferrite from liquid is of vital importance to be controlled. In this work, the effect of the cooling rate (i.e., 4 °C/min and 150 °C/min) on the nucleation and growth behavior of δ-ferrite in S33207 during the solidification was investigated using a high-temperature confocal scanning laser microscope (HT-CLSM) in combination with electron microscopies and thermodynamic calculations. The obtained results showed that the solidification mode of S33207 steel was a ferrite–austenite type (FA mode). L→δ-ferrite transformation occurred at a certain degree of undercooling, and merging occurred during the growth of the δ-ferrite phase dendrites. Similar microstructure characteristics were observed after solidification under two different cooling rates. The variation in the area fraction of δ-ferrite with different temperatures and time intervals during the solidification of S33207 steels was calculated at different cooling rates. The post-microstructure as well as its composition evolution were also briefly investigated. This work shed light on the real-time insights for the crystallization behavior of hyper duplex stainless steels during their solidification process.

1. Introduction

Duplex stainless steel (DSS) has shown increasing demands for its application across important industrial areas, such as deep-sea pipelines and submarines [1,2] and petrochemical industries [1,3], due to their excellent corrosion resistance and mechanical properties [4,5]. The desired properties of DSS are mainly corrected with the precise control of the fractions of ferrite and austenite. Despite the very successful applications and experience of DSSs, the development of highly alloyed DSSs has been very active since there are still areas where the corrosion resistance of the current DSSs has been insufficient for a long service life or at higher temperatures. Based on this challenge, the flagship hyper DSS, UNS S33207 (marked as S33207 from herein), which has the highest corrosion resistance and strength among the existing modern DSSs has since been developed [6,7,8,9].
DSSs are designed to solidify with ferrite as the parent phase, with subsequent austenite formation occurring in the solid state, implying that the solidification process plays an important role in the dual-phase microstructure control [10,11]. That is to say, the changes in the fractions of ferrite and austenite in these DSSs are due to the different solidification conditions. It has been recognized that the cooling rate has an important effect on the microstructure evolution of the DSSs [12,13]. Zhu et al. [14] revealed that the austenite fraction in DSS 2205 after the sub-rapid solidified process was substantially decreased compared to the slow cooling process, and the hardness and wear-resisting properties of steel were improved. High-temperature confocal laser scanning microscopy (HT-CLSM) has provided a convenient possibility of making an in situ observations of the solidification and post-microstructure evolution of various alloy grades, including low carbon steels [15,16,17], austenite stainless steels [18,19,20], and duplex stainless steels [21,22,23]. Sun et al. [21] assessed the characteristics of the δ→γ phase transformations at different cooling rates on the surface of DSS S31308 by HT-CLSM. They found that the γ-cells preferred to precipitate along the δ/δ grain boundaries with a flaky pattern, and that their fronts were jagged in shape under the slow cooling rate but were in a needle-like feature at the rapid cooling rate. Moreover, they reported that higher N contents promoted the nucleation and growth of the γ-phase during the δ→γ transformation by increasing both the starting and finishing temperatures of the phase transformation [23]. Shin et al. [24] assessed the effects of the cooling rate after heat treatment on the pitting corrosion of DSS S32750, and they found that the ferrite volume fraction increased accordingly with the increase in the cooling rate. In a former study by the current authors, the solidification behavior of the different grades of DSSs have been investigated in situ [25] using a combinational approach of HT-CLSM and differential scanning calorimetry (DSC) [26]. Till now, the δ→γ transformation has been reported in previous works, but the evolution mechanism of δ-ferrite during the solidification process is still not clear regarding the DSSs. Moreover, there have been no in situ observations made for the solidification process of hyper duplex stainless steel S33207 under different cooling conditions.
Previous studies have demonstrated that the solidification process of DSSs has a great influence on their performance. Changing the cooling rate is one of the important methods to control the fractions of the ferrite and austenite phases. S33207 hyper DSS has quite high Cr contents (32%) compared to the other grades of super DSSs, which results in a high corrosion resistance, yield strength, and superior fatigue features. Therefore, understanding its solidification behavior is of great interest for the subsequent annealing homogenization treatment process. In this work, the characteristics of the δ formation and growth during the solidification process were observed on the sample surface of DSS S33207 at different cooling rates using the HT-CLSM. The chemical element distribution of the solidified samples was also characterized. This work is of great significance to both understand and control the solidification process of Hyper DSS S33207.

2. Materials and Methods

Differential thermal analysis (DTA), equipped in a Netzsch STA 449 F1 Jupiter®, was used to detect the melting and solidification temperatures during the heating and cooling stages to ultimately guide the design of the in situ observation experimental conditions. The DTA facility was calibrated using pure metals (Ag, Ni, and Fe) prior to its use, and approximately a 100 mg of specimen was used for the measurement. HT-CLSM (Lasertec, 1LM21H) with a He–Ne laser beam, equipped with a power of 1.5 mW and a wavelength of 632.8 nm, was used to analyze the crystallization during the solidification of DSS 3207 under different cooling conditions. The chemical composition of the proposed DSS sample is listed in Table 1. For all HT-CLSM experiments, the diameter of the sample was 4 mm and the thickness was 1.5 mm, respectively. All the slices were grounded by 800, 1200, and 2000 SiC papers, following which they were then polished using 3 μm and 1 μm diamond pastes, respectively. The processed sample was filled with an Al2O3 crucible (Φ 5.5 mm O.D., Φ 4.5 mm I.D., and 5.0 mm height) and was then put into the ellipsoidal chamber of the HT-CLSM instrument. The chamber was cleaned thoroughly through a vacuum cycle (of less than 4.5 × 10⁻⁵ torr) followed by purging with a high purity Ar (purity > 99.9999%) passing through a 300 °C Mg column. The temperature was measured using a Type B (PtRh30%–PtRh6%) thermocouple at the bottom of the holder of the crucible. The steel samples were first heated to 1500 °C at a rate of 20 °C /min and were then kept for 2 min for melt stabilization, followed by cooling at two different cooling rates of 4 °C /min (0.07 °C/s) and 150 °C/min (2.5 °C/s), respectively. The solidified samples after HT-CLSM were directly analyzed using a scanning electron microscope (SEM, S3700N-Hitachi, Japan) equipped with an energy dispersive spectrometer (EDS, Bruker, Germany). The nitrogen content of the samples before and after HT-CLSM was measured through LECO analysis. Standard stainless steels with 0.1% and 0.2% N content were used, respectively.

3. Results and Discussion

3.1. In situ Observations of the Solidification of S33207 at Different Cooling Rates

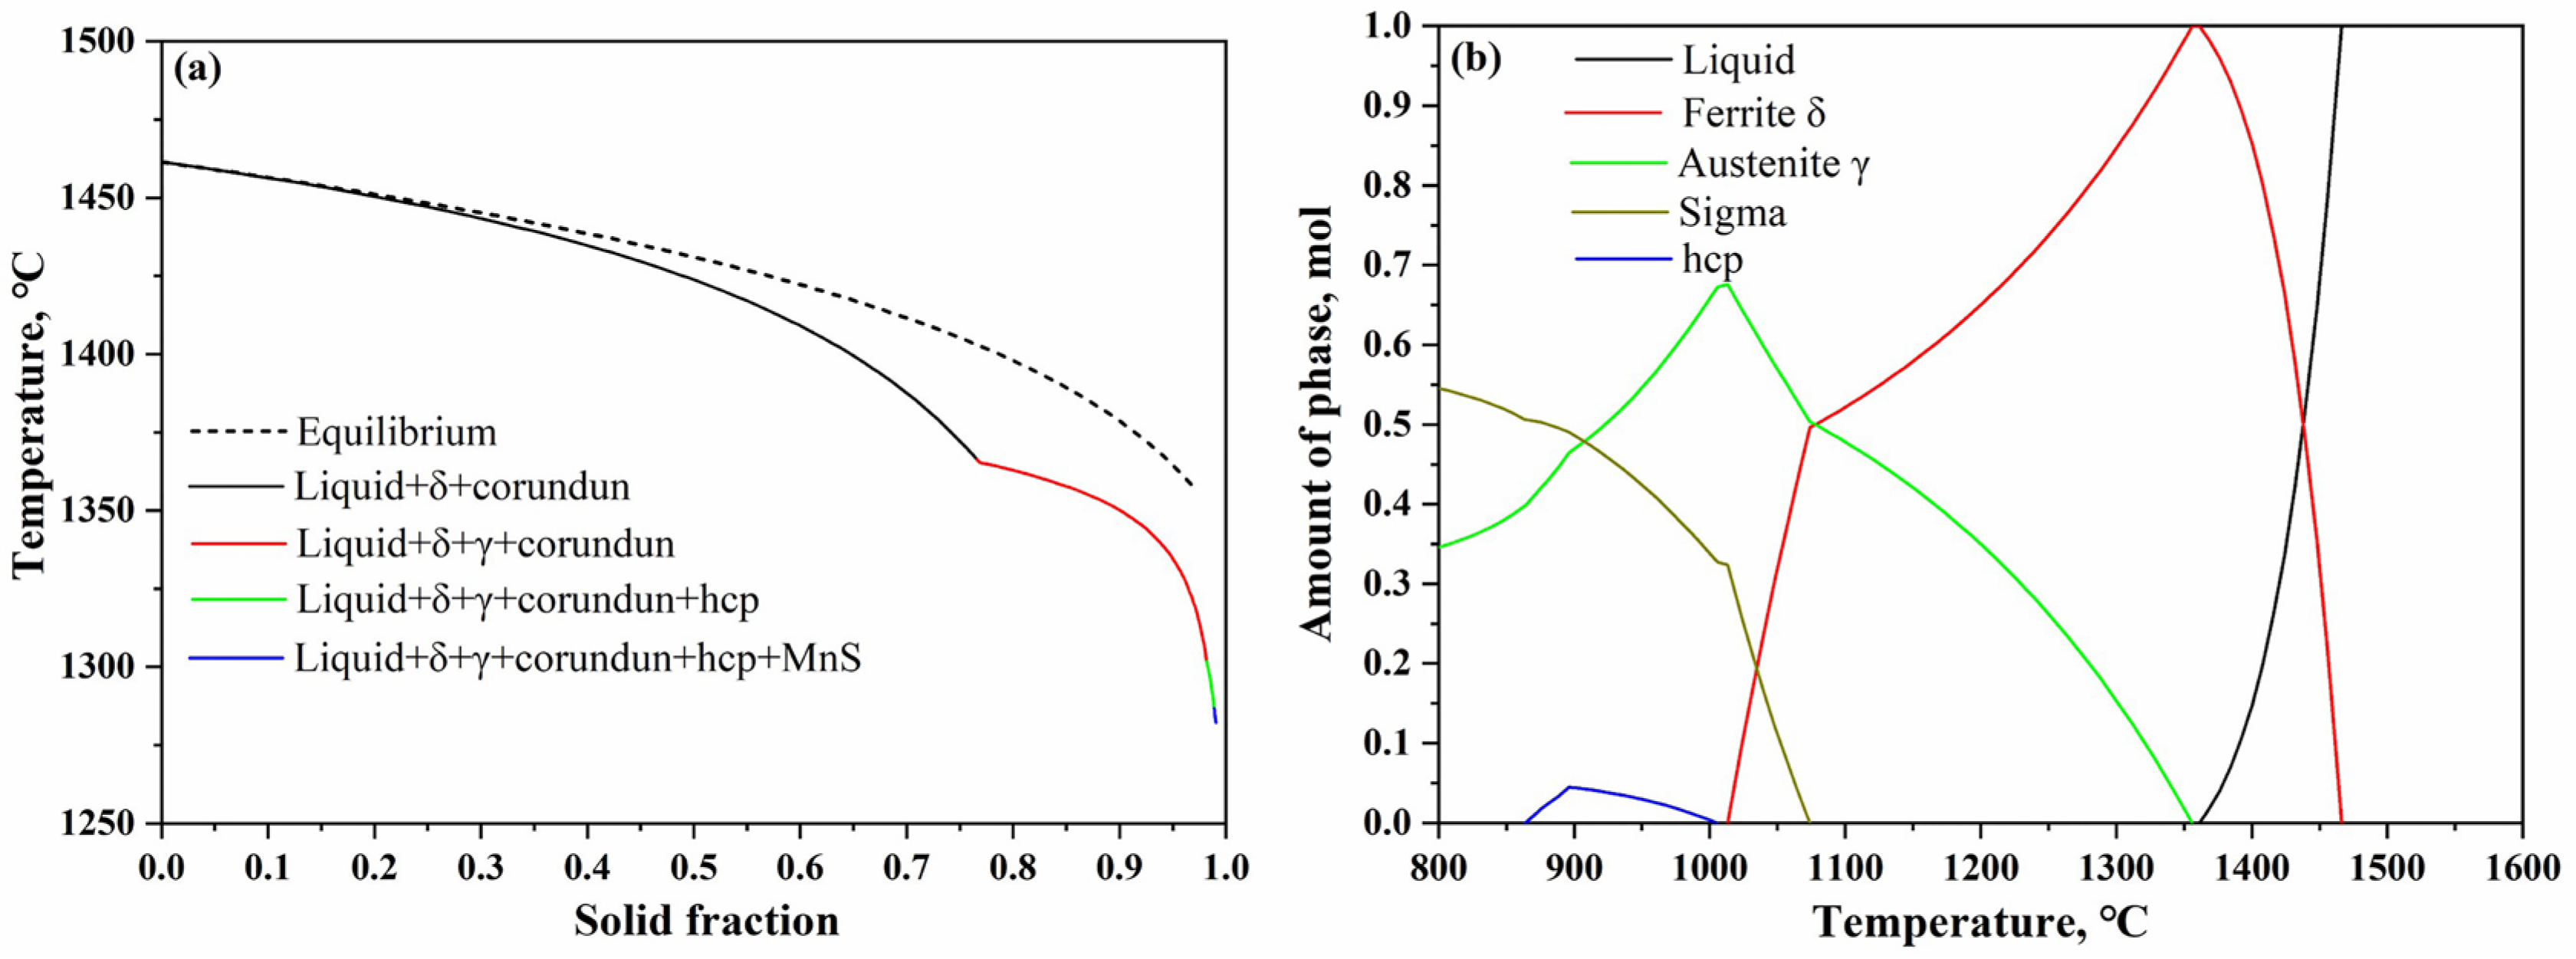
The solidification phase diagram and phase fraction during the solidification of S33207 steel was calculated using the Scheil solidification and equilibrium modules in Thermo-Calc 2022a, the results are shown in Figure 1. The Scheil solidification module can calculate the actual solidification path of DSS S33207 under a non-equilibrium state and provide a basis for the solidification sequence in situ observation using the HT-CLSM. According to Figure 1, the solidification sequence of S33207 steel calculated by both modules belonged to the ferrite–austenite mode (FA): L(liquid)→L + δ (ferrite)→L + δ + γ (austenite). This indicated that the δ-ferrite phase started to form first followed by the δ→γ transformation at the terminal stage of the solidification process. The morphologies of the crystallized phases can vary depending on the cooling rate, which has been discussed in detail in the following part.
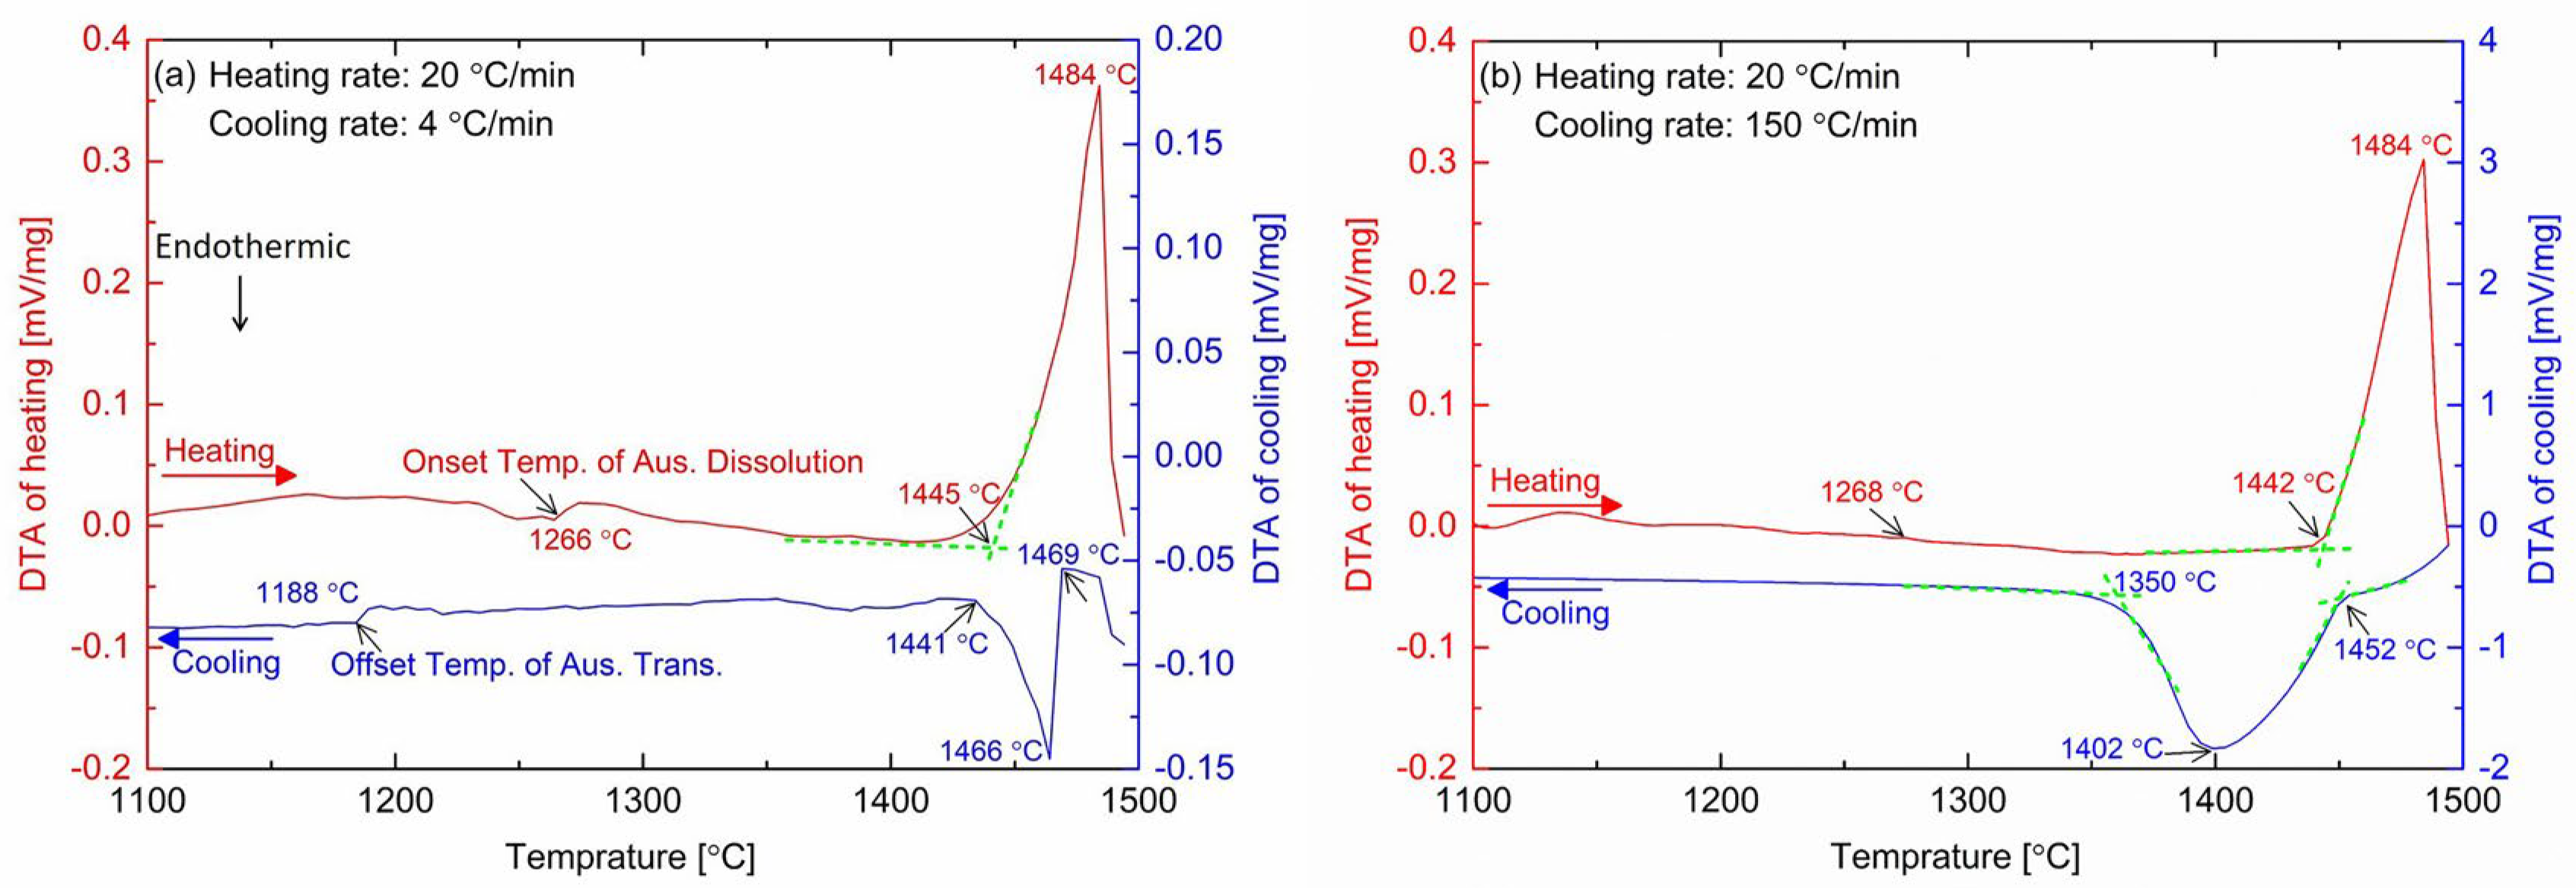
DTA results of the DSS33207 with the different solidification rates of 4 °C/min and 150 °C/min are presented in Figure 2. For both measurements, the same heating of 20 °C/min was used to heat the specimen till 1550 °C, and two cooling rates with the same ones used for the HT-CLSM was performed here. The phase transition temperatures of the heating and cooling stages are summarized in Table 2. In Figure 2, it is shown that the liquidus and solidus temperatures during heating are almost overlapping since the heating rate was the same. The on-set and peak temperatures of the solidification varied a lot due to the influence of the solidification cooling rate. Slower cooling led to the much higher solidification temperatures obtained (i.e., 1469 and 1466 °C for the cooling rate of 4 °C/min; 1452 and 1402 °C for the cooling rate of 150 °C/min) in the DSS3207.
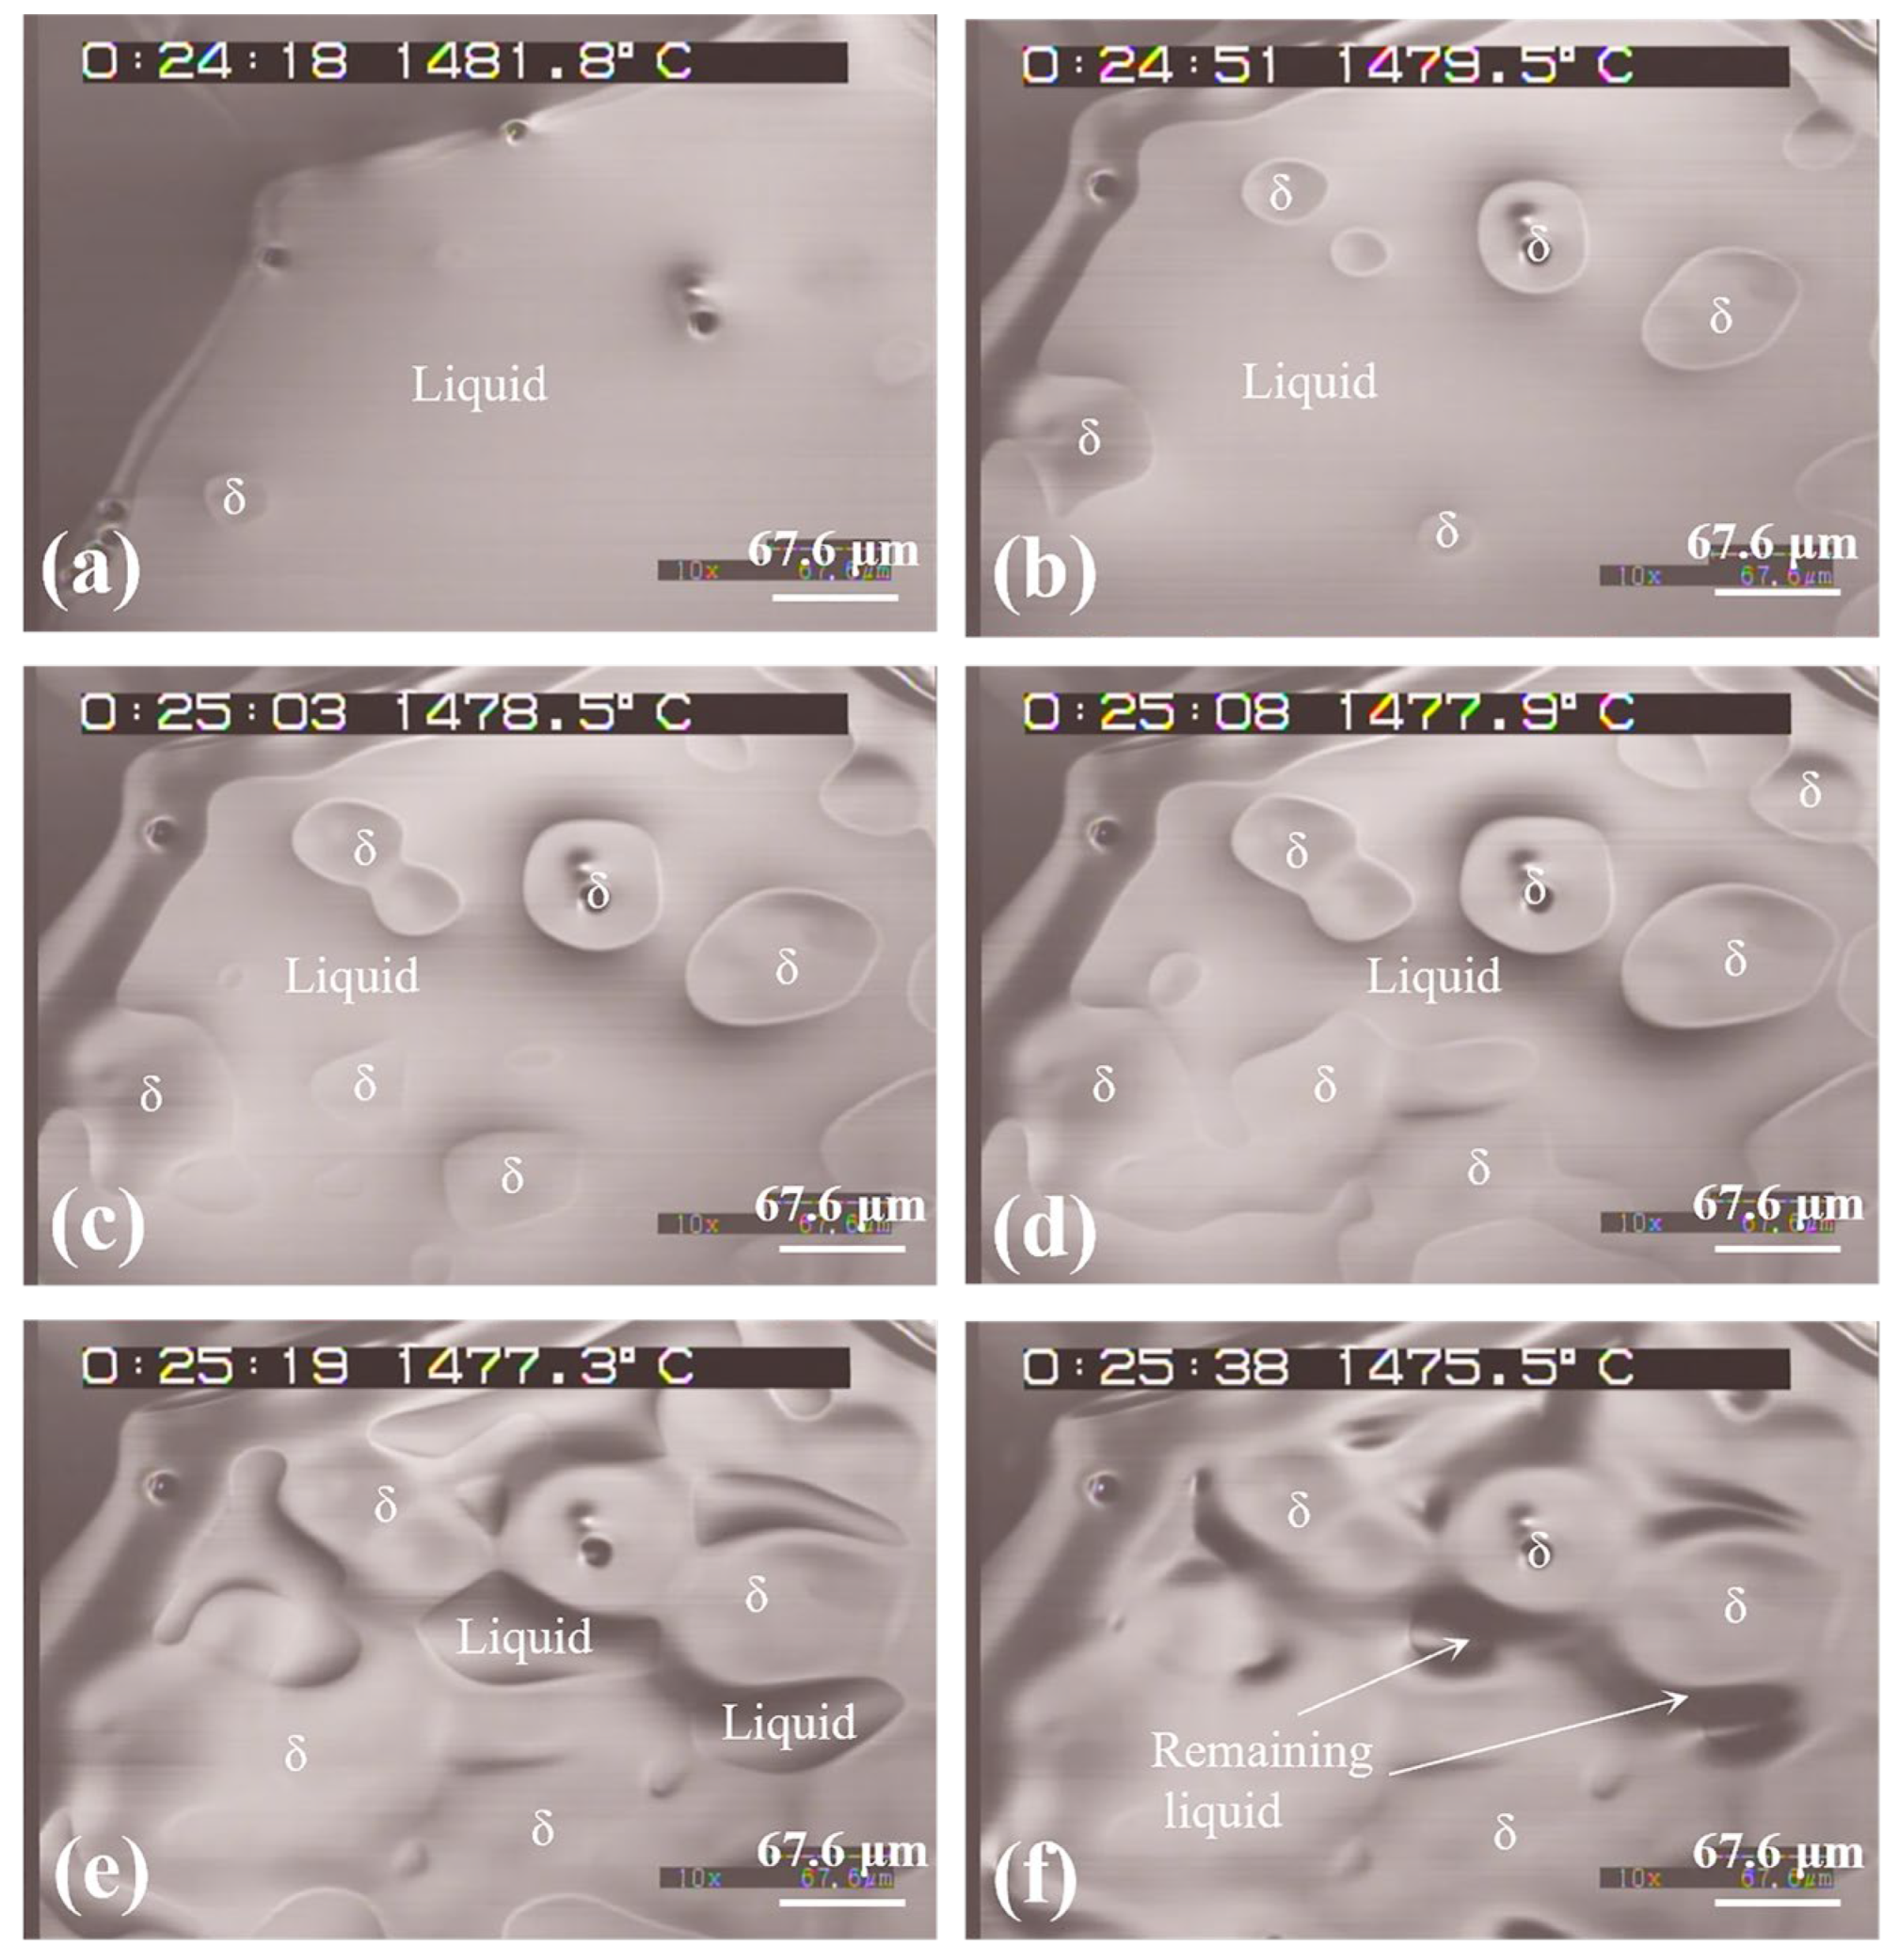
Figure 3 presents several representative micrographs of phase formation during the solidification process of the DSS33207 through in situ observations at a cooling rate of 4 °C/min. When the molten steel was undercooled to 1482.7 °C, the L→δ transformation began to occur, and the formation of the cellular δ phase was observed on the surface of the sample. It should be pointed out that a thin δ layer formed on the outside of the liquid steel at the beginning of the solidification process (Figure 3a). It is generally believed that the crucible provided a core for the heterogeneous nucleation of the new phase formation during the solidification observation by the HT-CLSM. Due to the slow cooling rate of liquid steel, pro-eutectoid δ-ferrite solidified in the form of cellular crystals. With the decrease in temperature, the number of δ-ferrite nuclei increased and the grains gradually grew up and coarsened. When the δ-ferrite cell grew to some extent, several cells gradually approached and merged into a large irregular δ cell, and there was no obvious boundary between these cells after merging (Figure 3b). With further cooling, more δ cells merged together and the remaining liquid between these δ cells became less and less (Figure 3c). The growth of δ-ferrite was completed when the area of δ cells was not obviously increased based on the HT-CLSM observations. Some amount of liquid was still present after the ferrite growth was complete (Figure 3d), which has been reported in previous works [27,28].
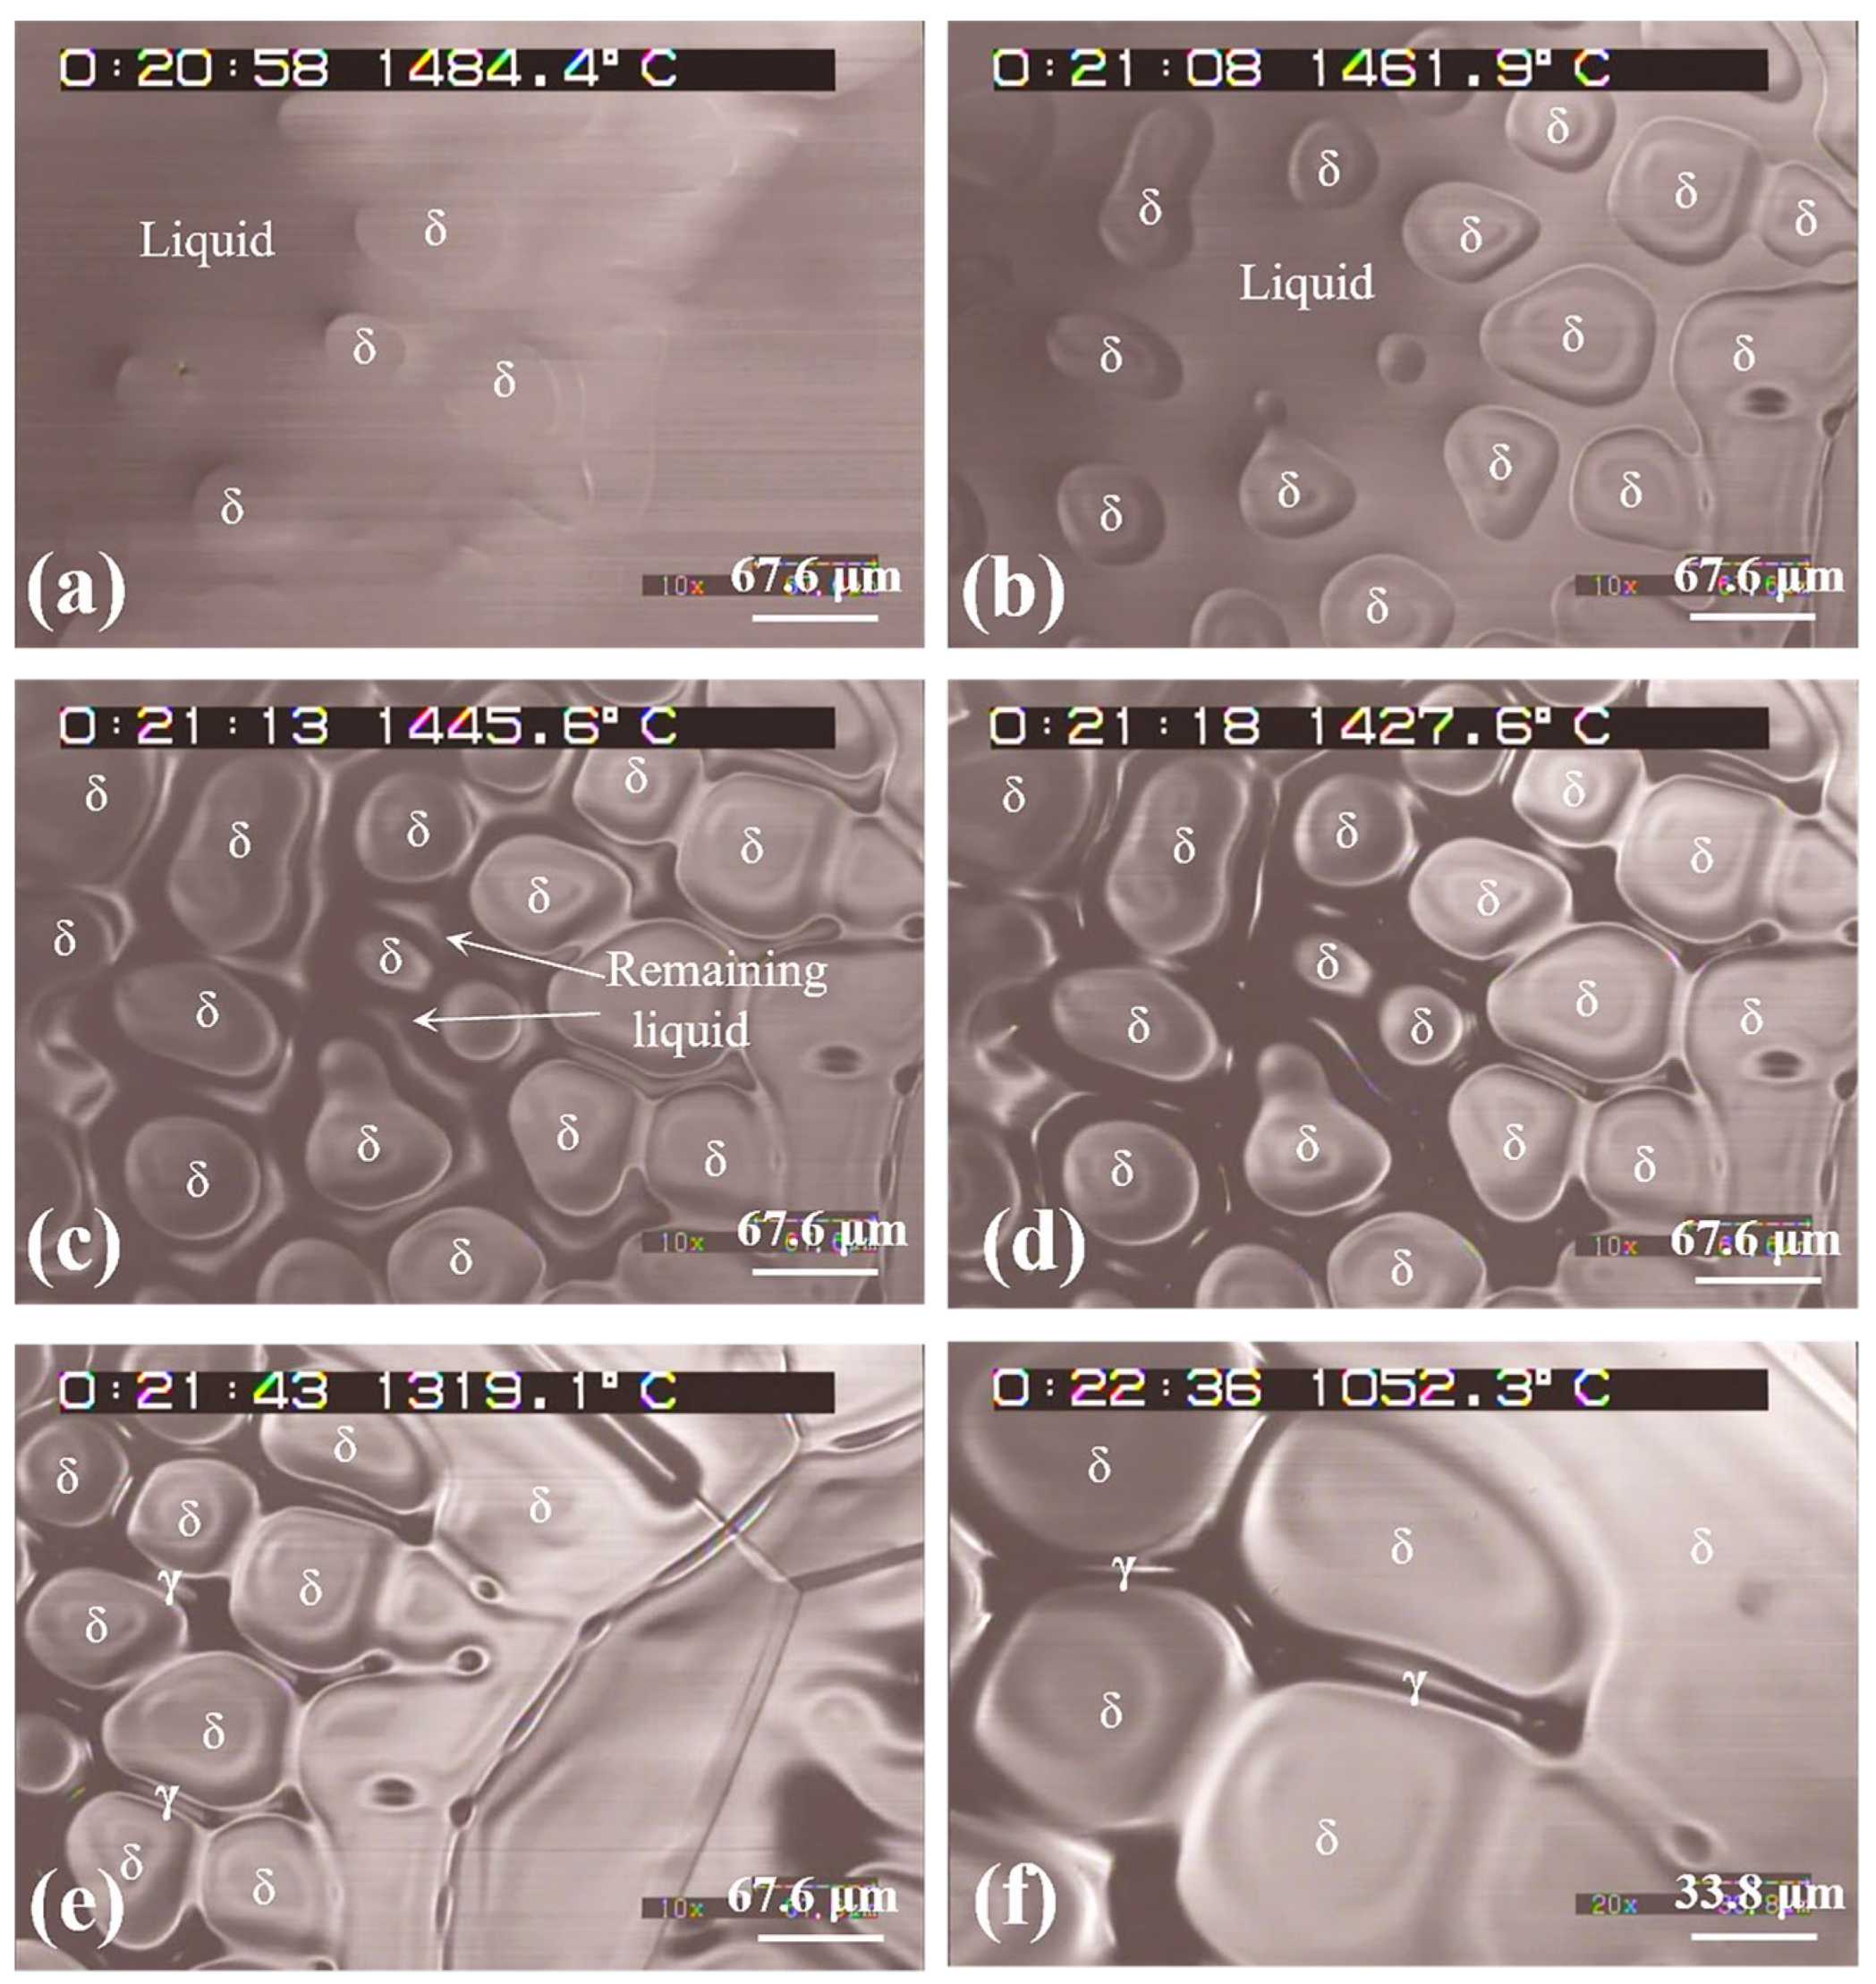
The solidification process of the δ-ferrite phase with a cooling rate of 150 °C/min is shown in Figure 4. It should be mentioned that the focus of the initial stage of δ-ferrite nucleation from the liquid steel was not clear enough during the HT-CLSM observations made at this high cooling rate. Therefore, the formation temperature of δ-ferrite on the liquid surface was not determined correctly. More δ-ferrite cells can be formed simultaneously at the beginning of the solidification process compared to that of the low cooling rate. This indicated that a fast cooling rate favored primary δ-ferrite nucleation. The increase of the cooling rate during the solidification process of steel increased the undercooling of the liquid steel’s composition, which promoted the increase in the nucleation rate of the δ-ferrite phase. It is believed to be beneficial to the refinement of δ cell crystals. Additionally, the growth temperature of the δ-ferrite phase (Figure 3b) formed at a higher temperature with a slow cooling rate. This tendency was the same as the DTA results (Figure 2) as well as the previous work [29], where a higher cooling rate resulted in a higher undercooling degree of melt and a lower crystallization temperature of δ-ferrite. The δ-ferrite grew quickly and a similar merging phenomenon was observed with a temperature decrease. In addition, a clear interphase boundary that usually separated these phases was observed (Figure 4b). Under a high cooling rate, an obvious δ-ferrite growth layer was observed outside of the original δ cells due to the unstable growth characteristics of the δ cells. The liquid area was pushed by the growth of δ-ferrite during the late stage of the solidification process and then a volume shrinkage occurred between the δ-ferrite phase boundaries (Figure 4c). The growth rate of δ-ferrite decreased due to less liquid having been left at this stage. With a further decrease in the temperature, the area of δ-ferrite slowly increased and was kept at a stable value (Figure 4d). This remaining liquid area was the place where the localized transformation occurred from δ-ferrite to γ-austenite at a lower temperature. Generally, the concentration of the segregated elements increased greatly in the remaining liquid, where serious segregation took place [27]. This segregation can result in the decrease in the solidifying temperatures for steel. With time having passed, the δ-ferrite to γ-austenite transformation began at the δ-ferrite boundaries (Figure 4e,f). This finding is similar to that of Li et al. [19], who reported that δ→γ transformation occurred accompanied with a significant volume shrinkage.
However, the start temperature of the δ to γ transformation was not able to be obtained clearly due to the limitation of resolution of uneven surface after solidification. It was reported that the δ–γ phase transformation started earlier and occurred at a higher temperature in the S32101 DSS based on the concentric solidification technique with the increase in the cooling rate [22]. However, Sun et al. [21] found that starting temperature of the δ–γ transformation at the slow cooling rate was higher than that at the rapid cooling rate in an S31308 DSS. Additionally, the slow cooling rate more strongly favored the nucleation and growth of the γ-phase than the rapid cooling rate due to the fact that the higher diffusion rates of elements and longer diffusion times were obtained at a lower cooling rate.
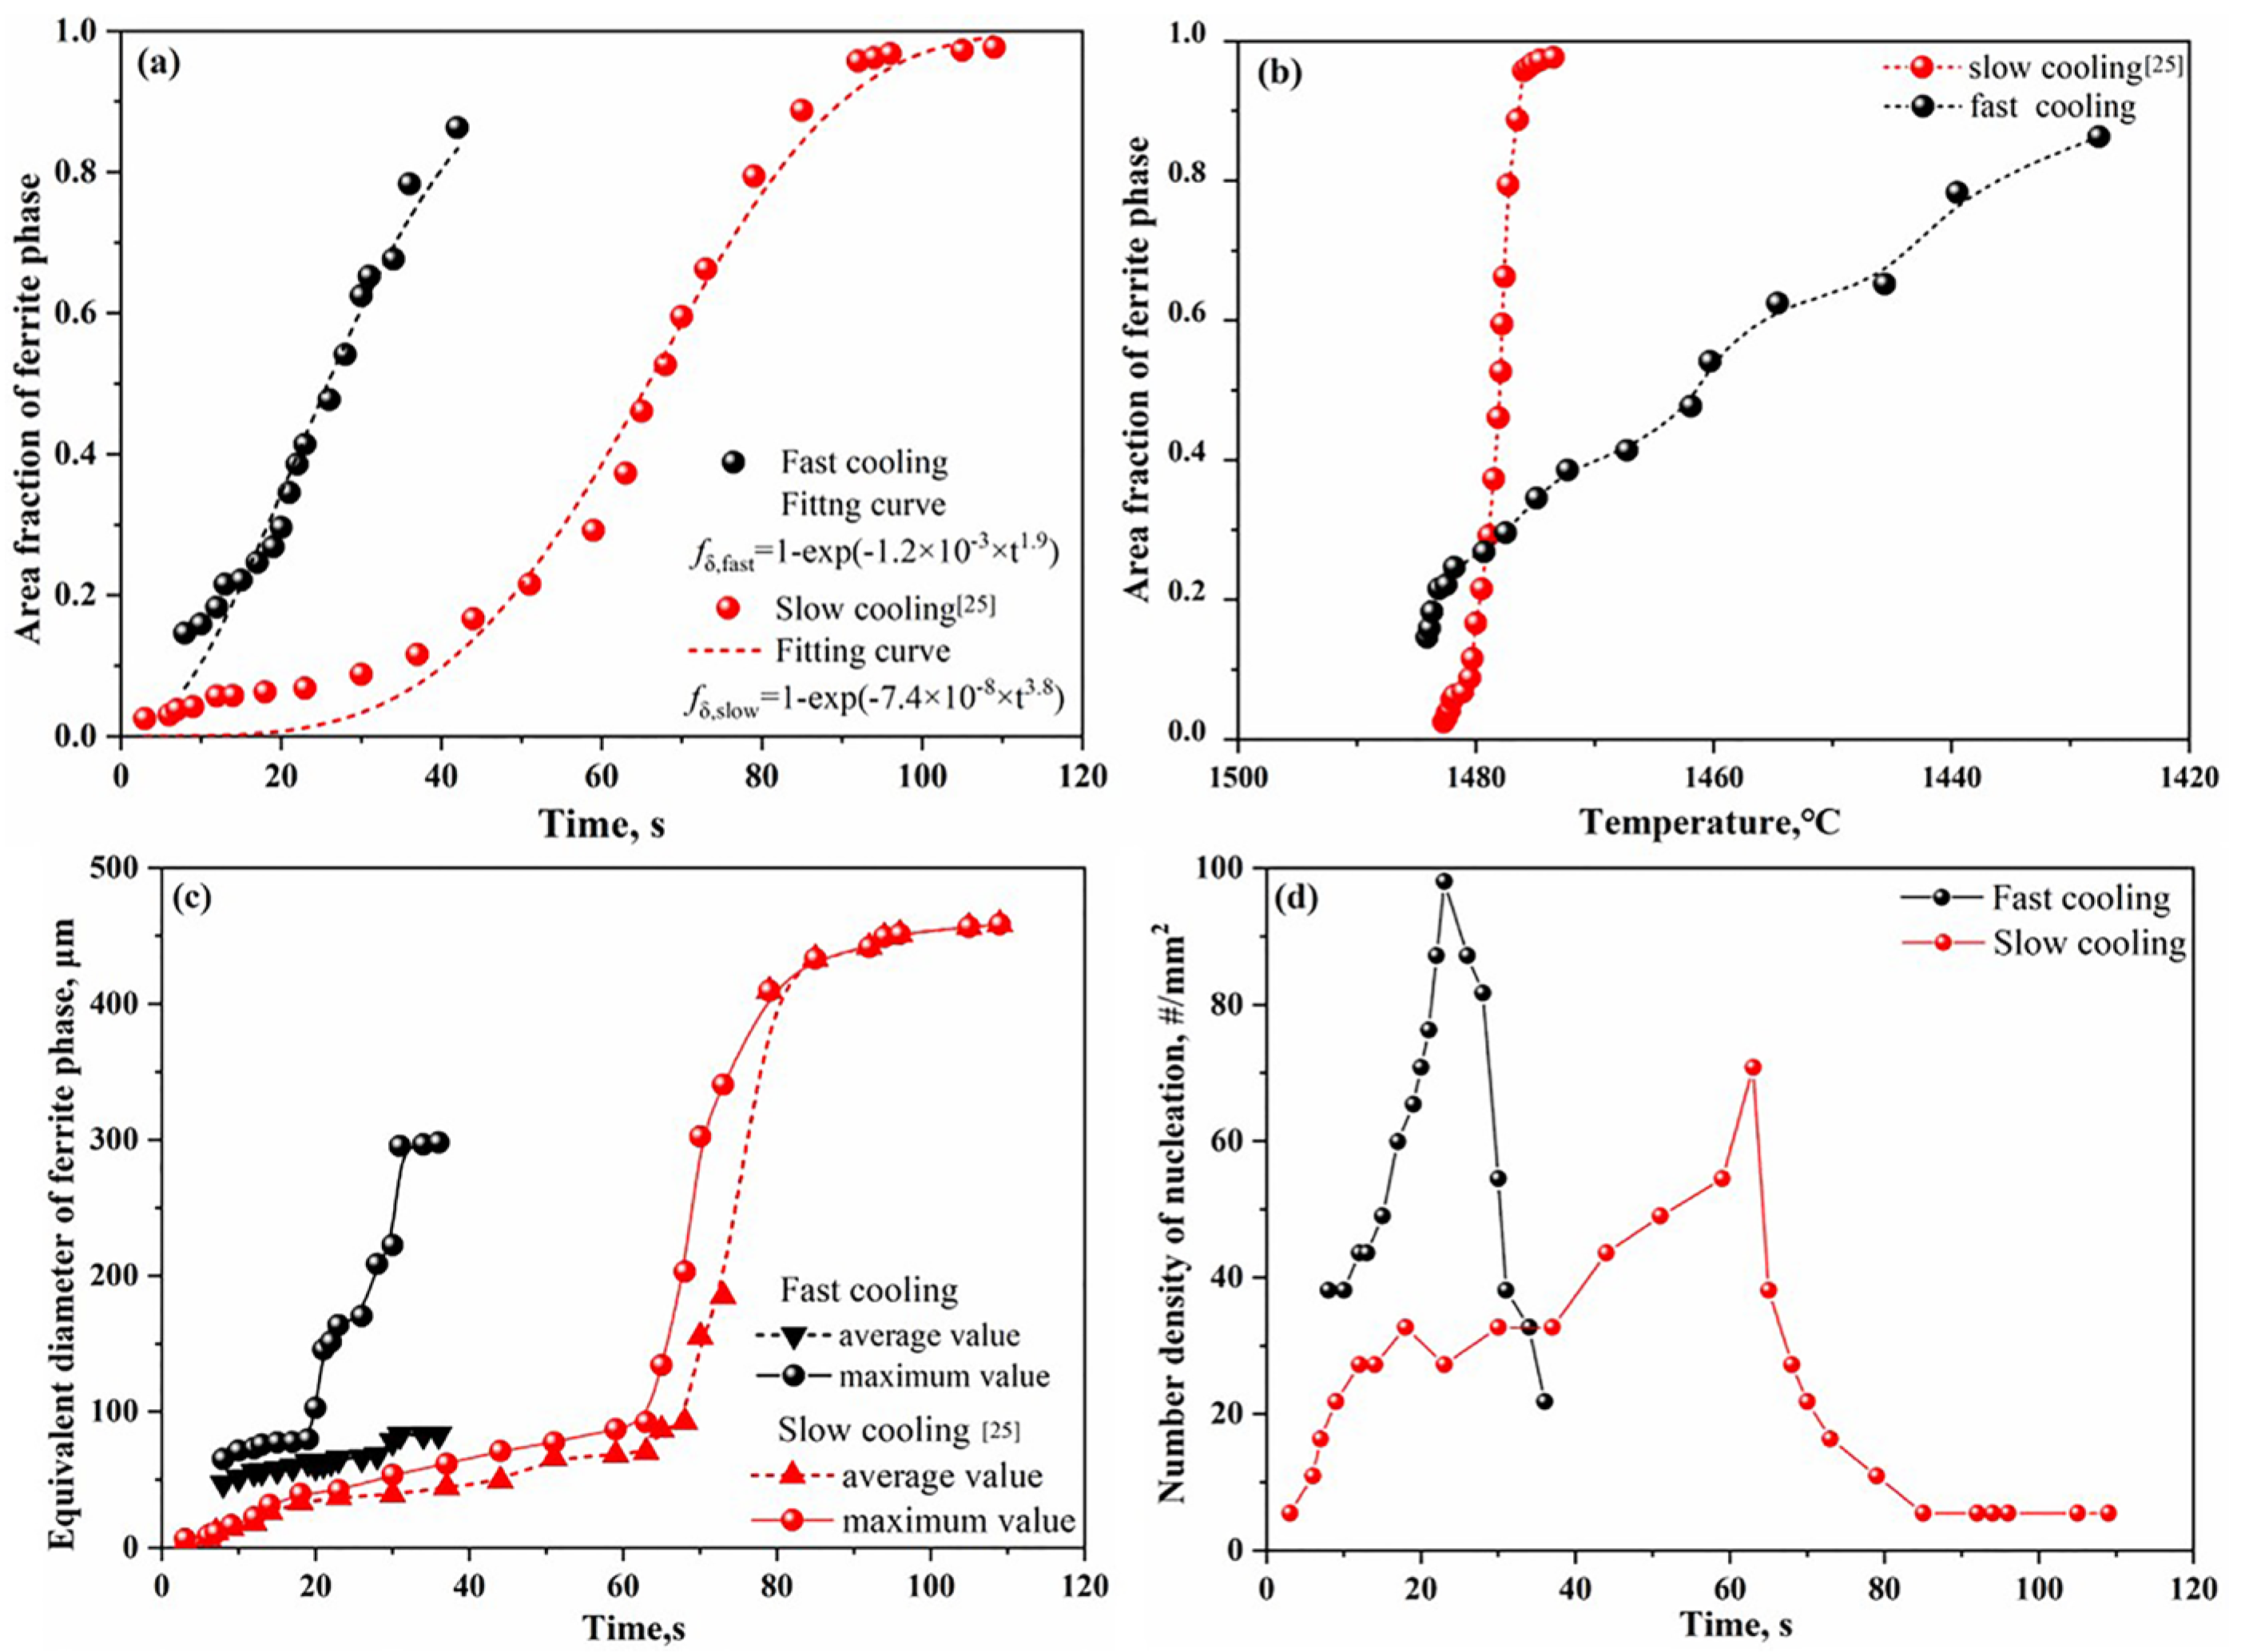
The area fraction of ferrite in multiple sets of video screenshots during the solidification process at different cooling rates and temperatures were evaluated by Image J software, and the Avrami equation was used to fit the relationship between the area fraction of ferrite and the time and temperature; the results are shown in Figure 5. The Avrami Equations (1) and (2) [30,31] describe the crystallization of undercooled liquids into a solid state:
f δ = 1 exp ( k t n )
t m a x = [ ( n 1 ) / ( n k ) ] 1 / n
where is the area fraction of δ-ferrite, n is the Avrami coefficient, k is the overall growth rate constant, and t is the solidification time after the nucleation of δ-ferrite, tmax, the time required for maximum crystallization rate of ferrite.
It can be seen from Figure 5a that the area fraction of δ-ferrite increases with time, and it has a higher growth rate at a high cooling rate. In addition, the growth rate of δ-ferrite showed smaller values at the initial and late stages of solidification and a higher value at the stable stage of the solidification process. As mentioned before, the formation point of δ-ferrite in liquid was not obtained correctly, and thus the area fraction of δ-ferrite curve was obtained using the Avrami fitting function when the fitted linear correlation coefficient (R2) was greater than 95%. Furthermore, the area fraction of δ-ferrite was less than one due to the adverse effects of its undulating cellular morphology on the depth of the observation field in the HT-CLSM image, which was more prominent under the high cooling rate. The fitted equations between the area fraction of δ-ferrite (fδ) and time in the cases of the cooling rates of 4 °C/min and 150 °C/min are expressed by Equations (3) and (4), respectively. The rate constant k represents the velocity at which liquid transforms to solid. According to the fitted equations, the larger growth rate constant can be obtained under the fast cooling rate, which indicates the larger growth rate of δ-ferrite. This can be explained by the different number density of the nucleation sites and total growth times for the δ-ferrite. Specifically, the time required for the maximum crystallization rate of ferrite under the slow cooling rate obtained from Equation (2) was calculated to be 113 s, which is almost five times longer than that under the fast cooling rate (23 s).
f δ , fast = 1 exp ( 1.2 × 10 3 × t 1.9 )
f δ , slow = 1 exp ( 7.4 × 10 8 × t 3.4 )
The growth of δ-ferrite finished in a narrow temperature range (of less than 10 °C) at the cooling rate of 4 °C/min, while a much wider temperature was obtained at the cooling rate of 150 °C/min (Figure 5b). Notably, δ-ferrite began to form under a higher temperature with the growth ending at a lower temperature in the case of fast cooling compared to that of slow cooling. It is known that undercooling phenomenon usually occurs in the solidification process of steel, meaning that the ferrite formation temperature should be lower than the liquidus temperature of steel. From the in situ HT-CLSM observation results of the solidification process, the δ-ferrite formation temperature was slightly higher but has the same tendency as the results measured by DTA, which has been presented in Figure 2. This can be attributed to the details of the different instrumentation settings (sample size, thermocouple position, etc.) between the DTA and HT-CLSM measurements.
In terms of the maximum and average diameter changes of δ-ferrite (Figure 5c), the maximum diameter of δ-ferrite slowly increased at the beginning and began to increase rapidly when the δ-ferrite grew to a certain extent. The maximum and average diameter changes of δ-ferrite showed a similar tendency in the case of slow cooling, while the average diameter of δ-ferrite gradually increased during the whole solidification period under a fast cooling rate. As a result, the average diameter of δ-ferrite at the end of the solidification stage was approximately 80 μm at the cooling rate of 150 °C/min compared to 460 μm at the cooling rate of 4 °C/min, respectively. It can be indicated that the faster cooling rate can result in a smaller size of δ-ferrite. Moreover, the larger number density of the nucleation sites of δ-ferrite at the beginning of solidification can be found in the case of a high cooling rate, as shown in Figure 5d. The peak of the number density of the nucleation sites curves indicates that no new nucleation sites can be formed after that point, and the existing nucleation phases start to grow and merge to form bigger cells. In combination with the evolution of the number density of nucleation sites and the diameter of δ-ferrite changing during the solidification of steel, we can conclude that a slow cooling rate favored the growth of δ-ferrite, whereas a high cooling rate favored the nucleation of δ-ferrite.
In conclusion, the grain size will be finer as the cooling rate increases, the morphology comprises smaller grains, and the solidification behavior will commerce faster. This information can guide the actual continuous casting process of DSSS33207s.

3.2. Microstructure and Composition Evolution on the Surface of the Specimen after Solidification

In this section, the microstructure, as well as the chemical composition of the S33207 steel after solidification with different cooling rates, is briefly presented in this section.

3.2.1. Features on the Surface of the Specimen with a Slow Cooling Rate

Figure 6 presents the typical morphology of the S33207 steel after solidification with a cooling rate of 4 °C/min. It is shown that the solidified surface shows a ‘bumpy’ morphology, which is presented in Figure 6a; however, there is no clear segregation of the chemical elements, with all the elemental maps presented in Figure 6b–i showing an almost homogeneous distribution. In order to examine the detailed microstructure and chemical composition evolution, a line scan analysis of the main elements in the steel with the same cooling condition has been presented in Figure 7. To see these trends more clearly, the atomic % of each main element was used in this line scan. It is indicated that there is a main variation in the presence of Fe, Cr, and O at each specific location on the solidified surface, and the variation trend of Fe and Cr always corresponded with each other at the same location. This fact can lead to a basic understanding in that the ‘bumpy’ surface morphology formed is either due to the chemical element variation or precipitate and inclusion (i.e., oxide and nitride) formation in the bulk under the surface. Detailed considerations can be investigated further in future work.
In order to view the detailed composition of all the elements presented as a mass %, the chemical content of positions A, B, and C in Figure 7a has been presented in Table 3. It is seen that the variation is rather small, since there is almost a single δ-ferrite phase observed after the solidification under a slow cooling rate. This finding is consistent with the above line scan and chemical mapping analysis.
In addition, many fine particles with a concave morphology on the solidified surface with a cooling rate of 4 °C/min were observed; the SEM-EDS line scan analysis result is shown in Figure 8. It is clearly seen that the particles are Al2O3; this is due to the re-oxidation reaction between the trace of Al in the matrix and the newly absorbed O on the sample surface. According to the HT-CLSM observation, it is not the non-metallic inclusion that formed in the liquid, and rather the formation could have been due to either surface re-oxidation or the undertaking of O to the sample surface.

3.2.2. Features on the Surface of the Specimen with a Fast Cooling Rate

The typical morphology of the steel surface after solidification with 150 °C/min has been presented in Figure 9. It is clearly seen that the dendrite microstructure can be observed. This microstructure was believed to be formed due to the fast cooling rate, and was not observed in the case with a slow cooling rate of 4 °C/min. In order to obtain the chemical composition of each location, SEM-EDS point analysis as well as a line scan was performed; the line scan result can be seen in Figure 10. It is seen that the variation of the γ-stabilized elements (e.g., Ni and N) and δ-stabilized elements (e.g., Cr) correspond with each other and were able to be distinguished between the austenite and ferrite phases. Figure 10c–j shows the chemical maps of different elements (i.e., Fe, Cr, Ni, Mo, Mn, N, Nb, and V). The concentration of the different elements in these maps was not so obvious, which can indicate that the difference in these elements at each location was not so large after solidification. Detailed EDS data of each point was summarized in Table 4; points B and C hold a relatively higher range of Cr and a lower range of Ni, which can indicative of the δ-ferrite phase. Alternatively, points A and D hold the higher Ni and lower Cr, which can be recognized as the γ austenite phase. Of note, in the solidified microstructure, the fraction of γ austenite was not really high, which has been confirmed by a separate work using electron backscatter diffraction (EBSD) [25]. This fact was deemed to be due to the loss in nitrogen during solidification, as well as lacking a post-heat treatment for austenite growth. Potential solution using a mixed Ar–N2 gas instead of pure Ar and adding the isothermal ageing process at approximately 1000–1150 °C will favor the balance of the fractions of austenite and ferrite.

3.3. Comments on the Microstructure Evolution after Solidification

The nitrogen (N) content in the DSSs is one of the important elements used to determine the austenite formation temperature and fraction. Normally, the nitrogen was forced to be added into the DSSs in the liquid by e.g. pressure metallurgy. However, during the solidification process, and in the δ-ferrite phase, the solubility of N is much lower compared to the original amount, meaning the nitrogen will lose during in situ observations using Ar gas. In order to confirm this, the original DSS33207 alloy as well as the specimens after solidification with different rates are shown in Table 5; the data was measured by LECO analysis. It is seen that the N content after solidification was much lower than the original one (0.47%), which led to an unbalanced fraction between δ-ferrite and austenite. In fact, the loss of nitrogen during the melting and solidification of the DSSs is the actual limitation of the in situ observations of DSSs, and this process is inevitable. However, the obtained results are still quite useful and meaningful, since this simulates the actual case of DSS an as-cast ingot and heat-affected zone (HAZ) of welding, which also have a very low N content.
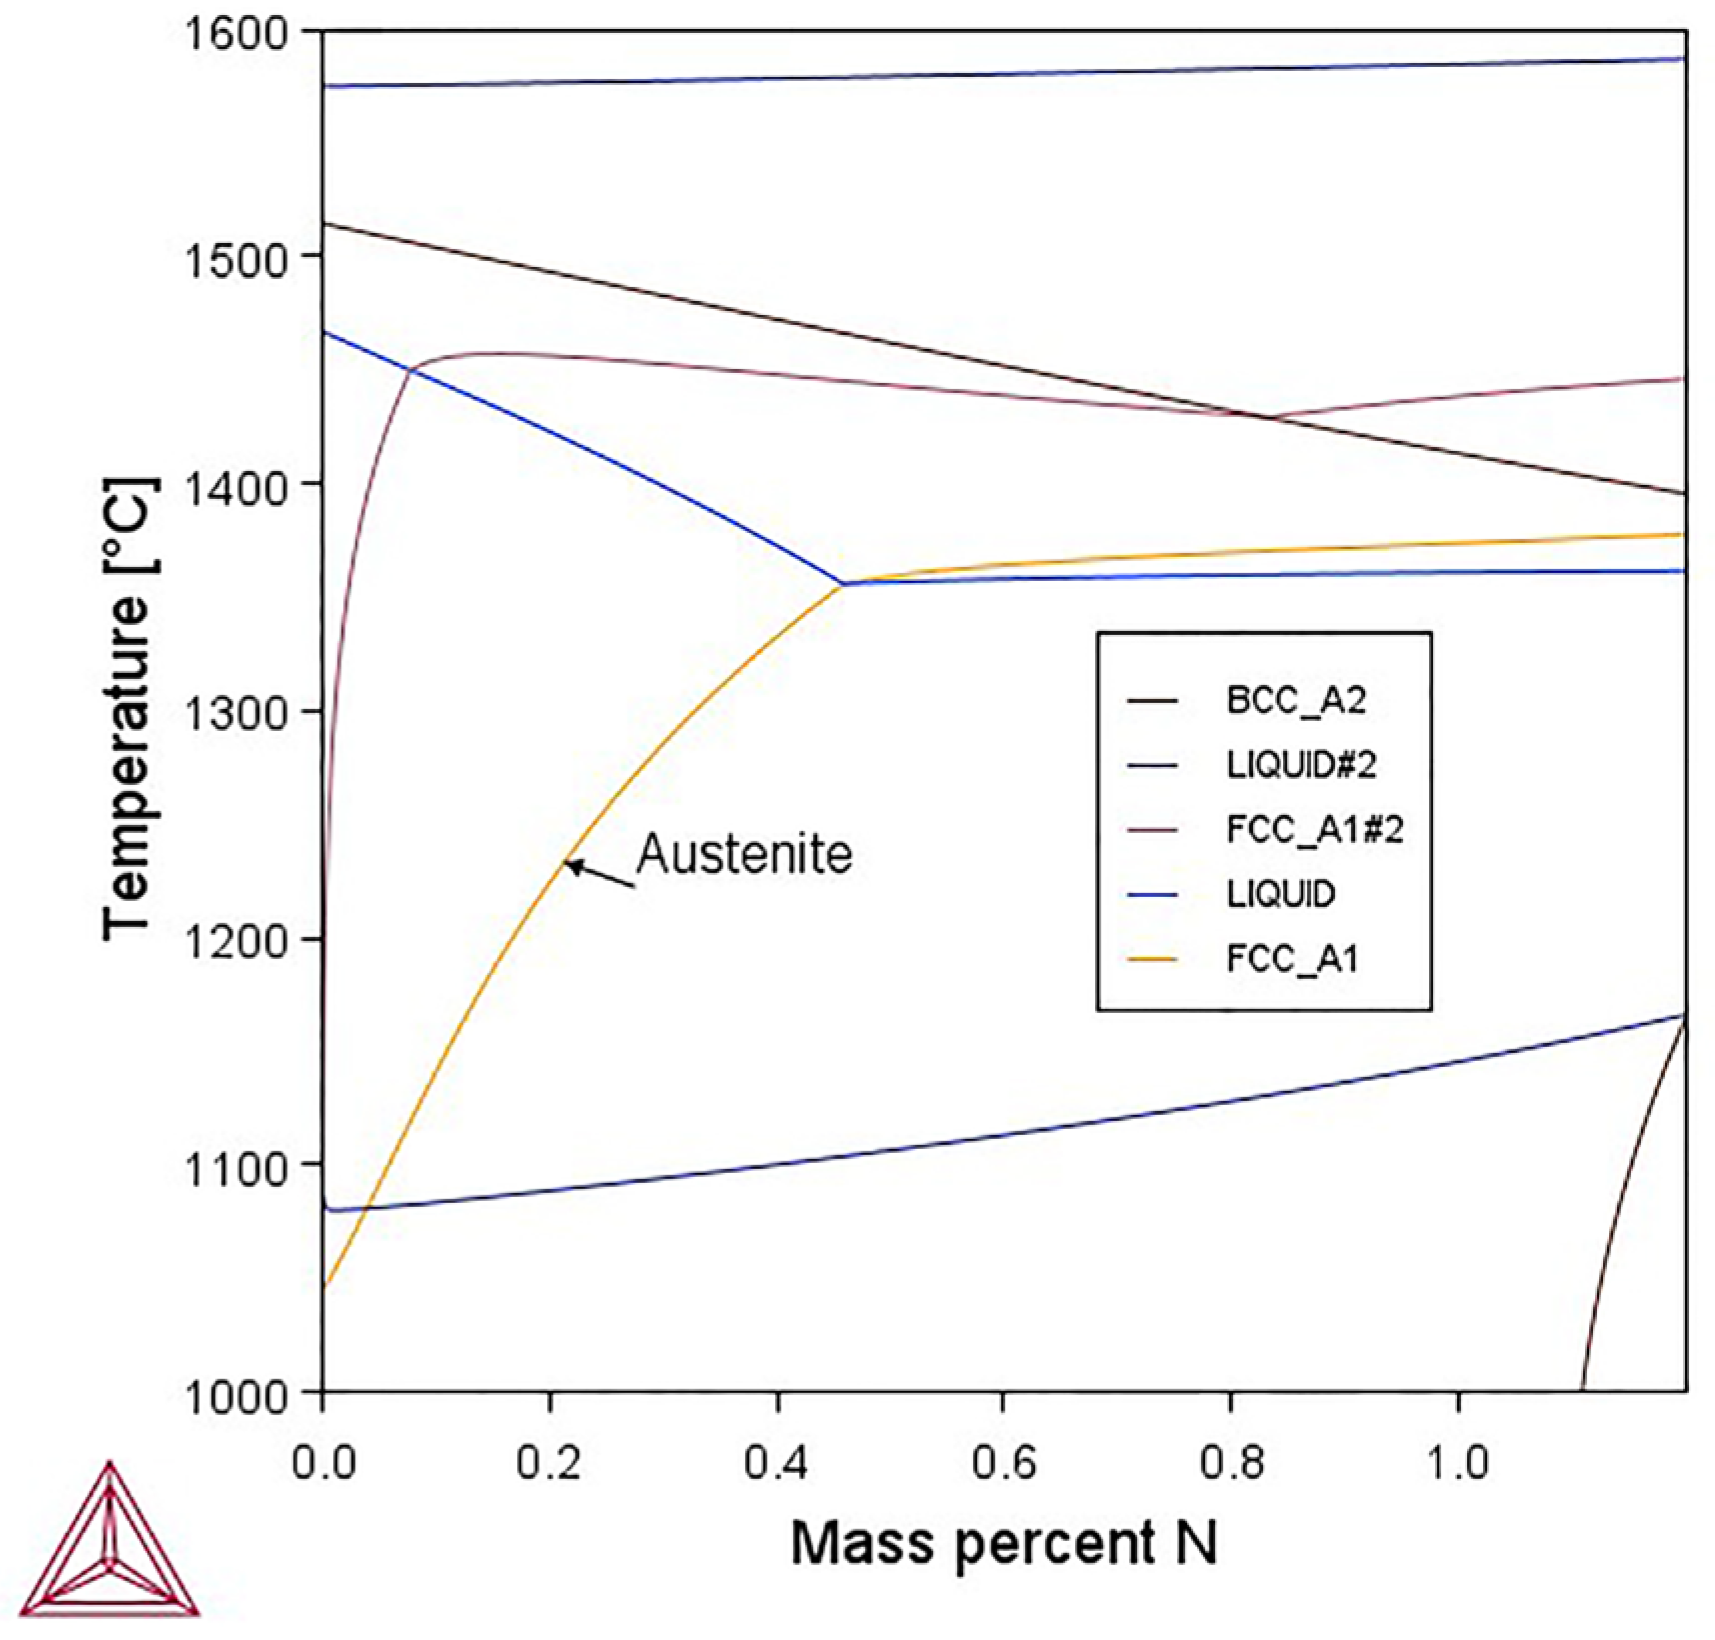
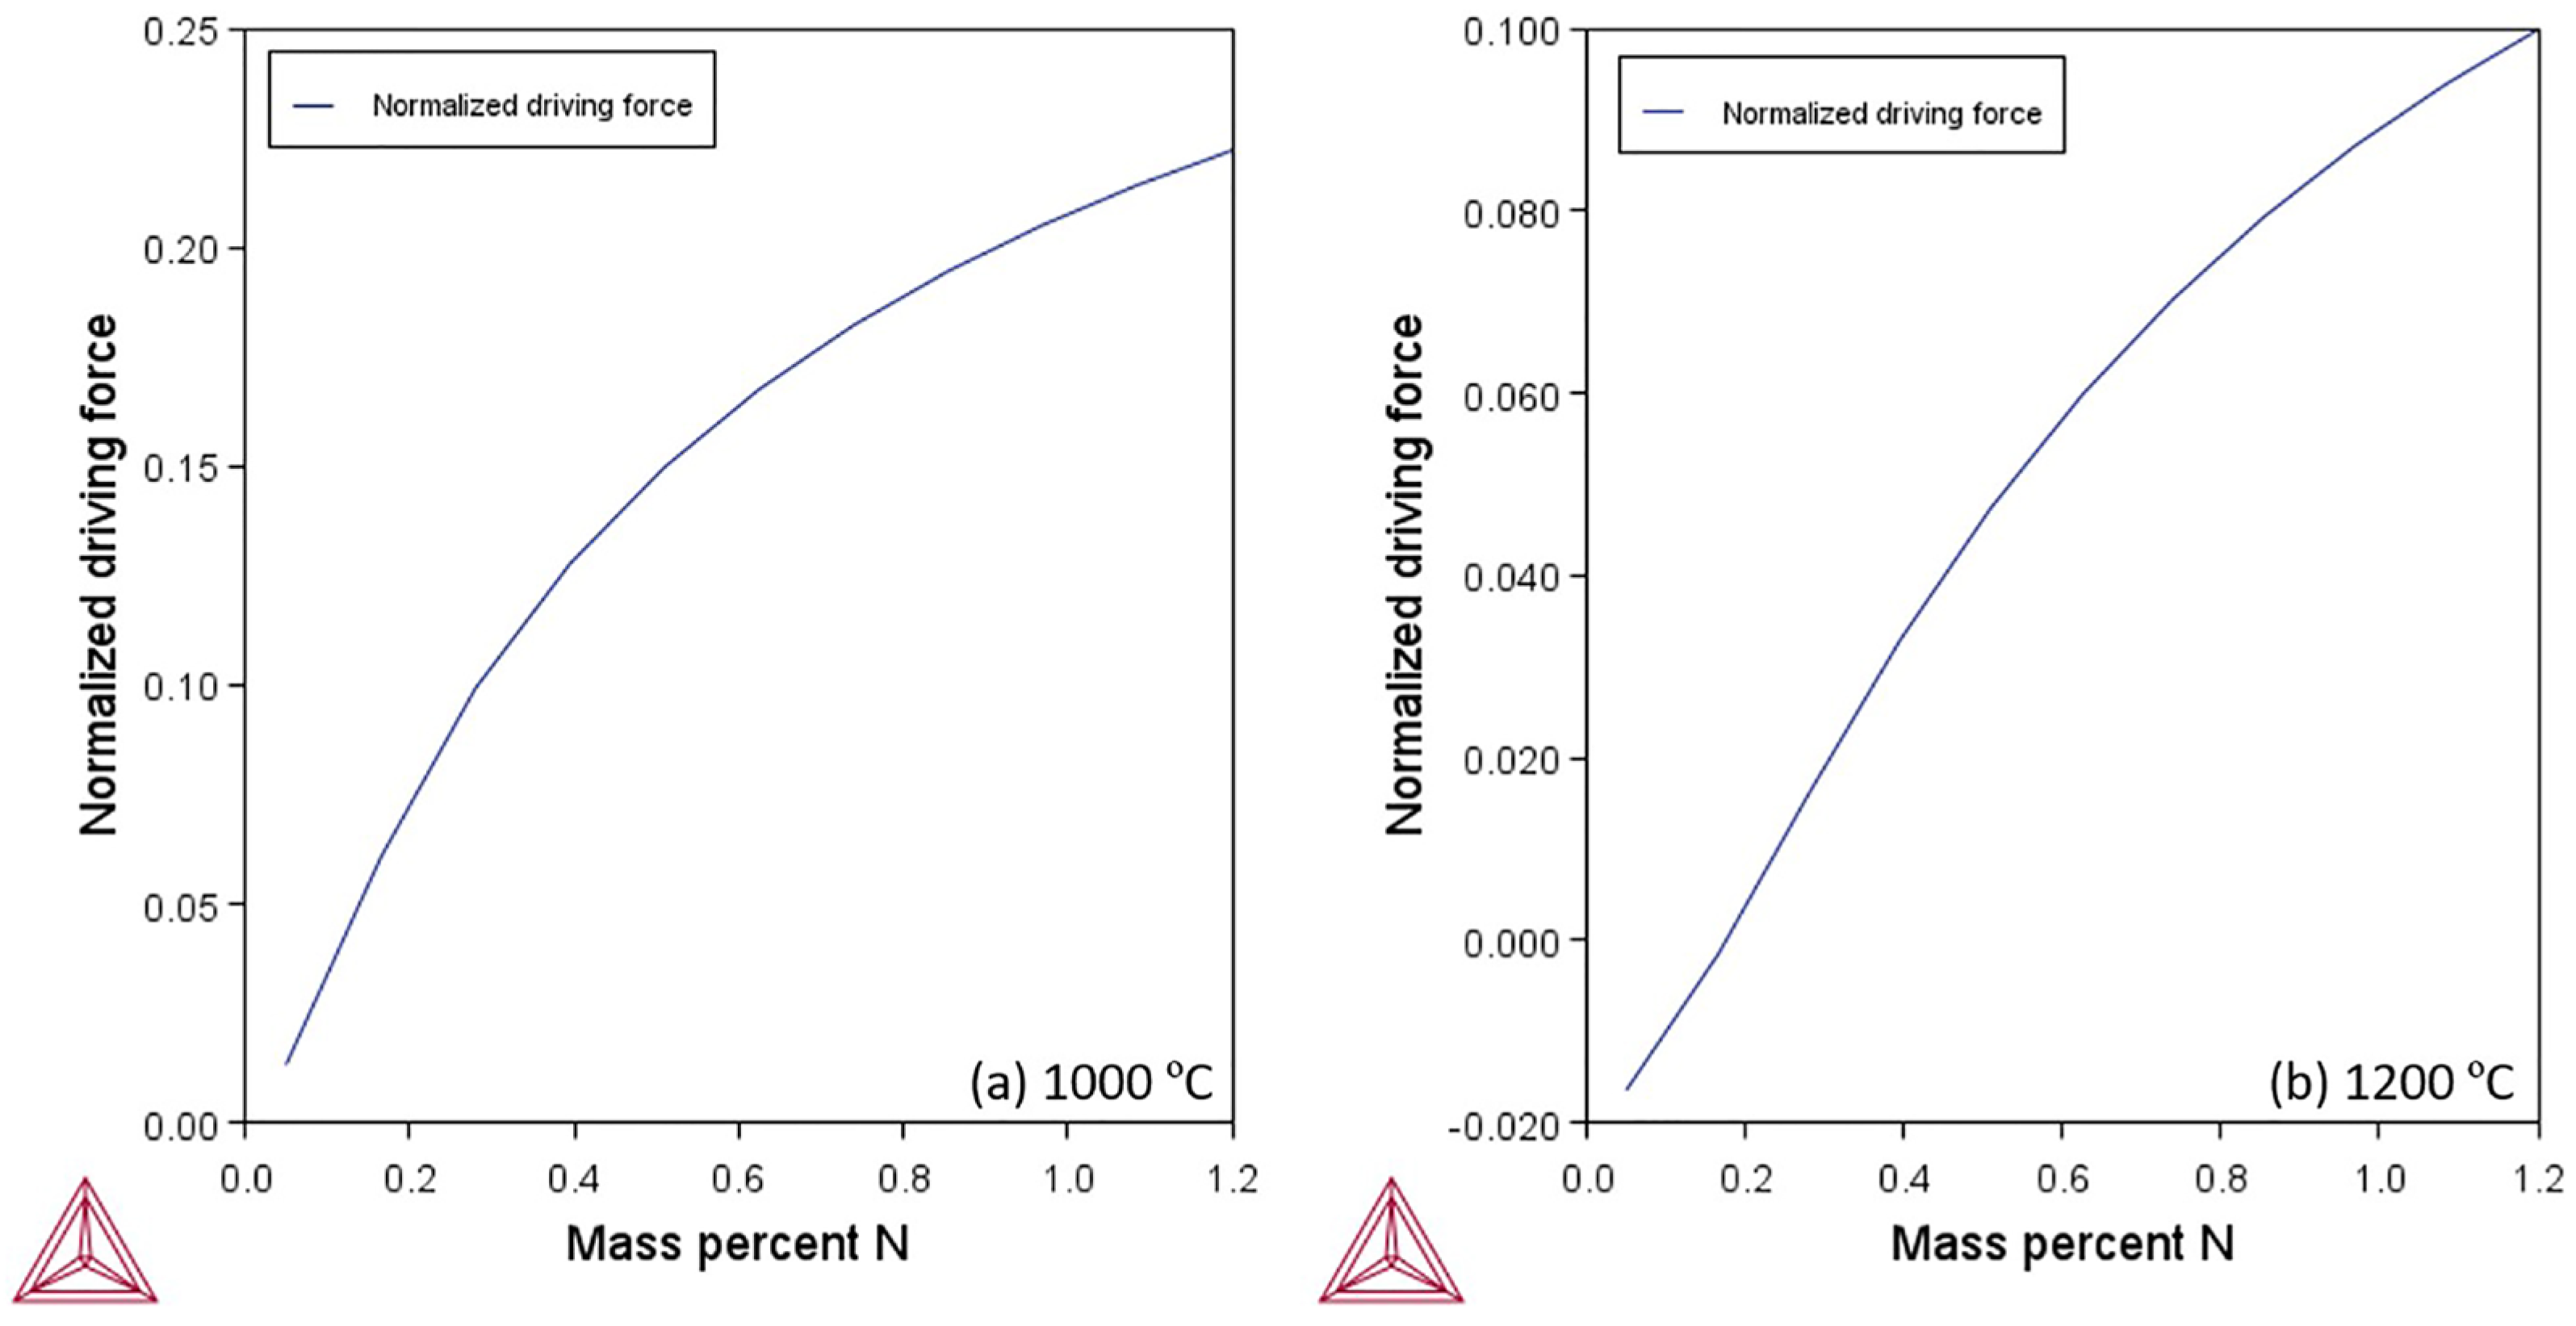
Thermodynamic calculations using Thermo-Calc 2023b with the TCFE12 database were used to calculate the phase diagram as well as the driving force of austenite in the DSS33207 with the increase in N content. The results are presented in Figure 11 and Figure 12. In Figure 11, the stable phase region of austenite was much larger when N was relatively higher since N stabilizes the FCC phase. Furthermore, the normalized driving force of austenite also significantly increased the increasing N content, which can be seen in two typical temperatures of 1000 and 1200 °C, respectively, as shown in Figure 12. It is worth mentioning that the driving force value at 1000 °C is always higher than that at 1200 °C since lower temperatures always facilitate austenite formation.
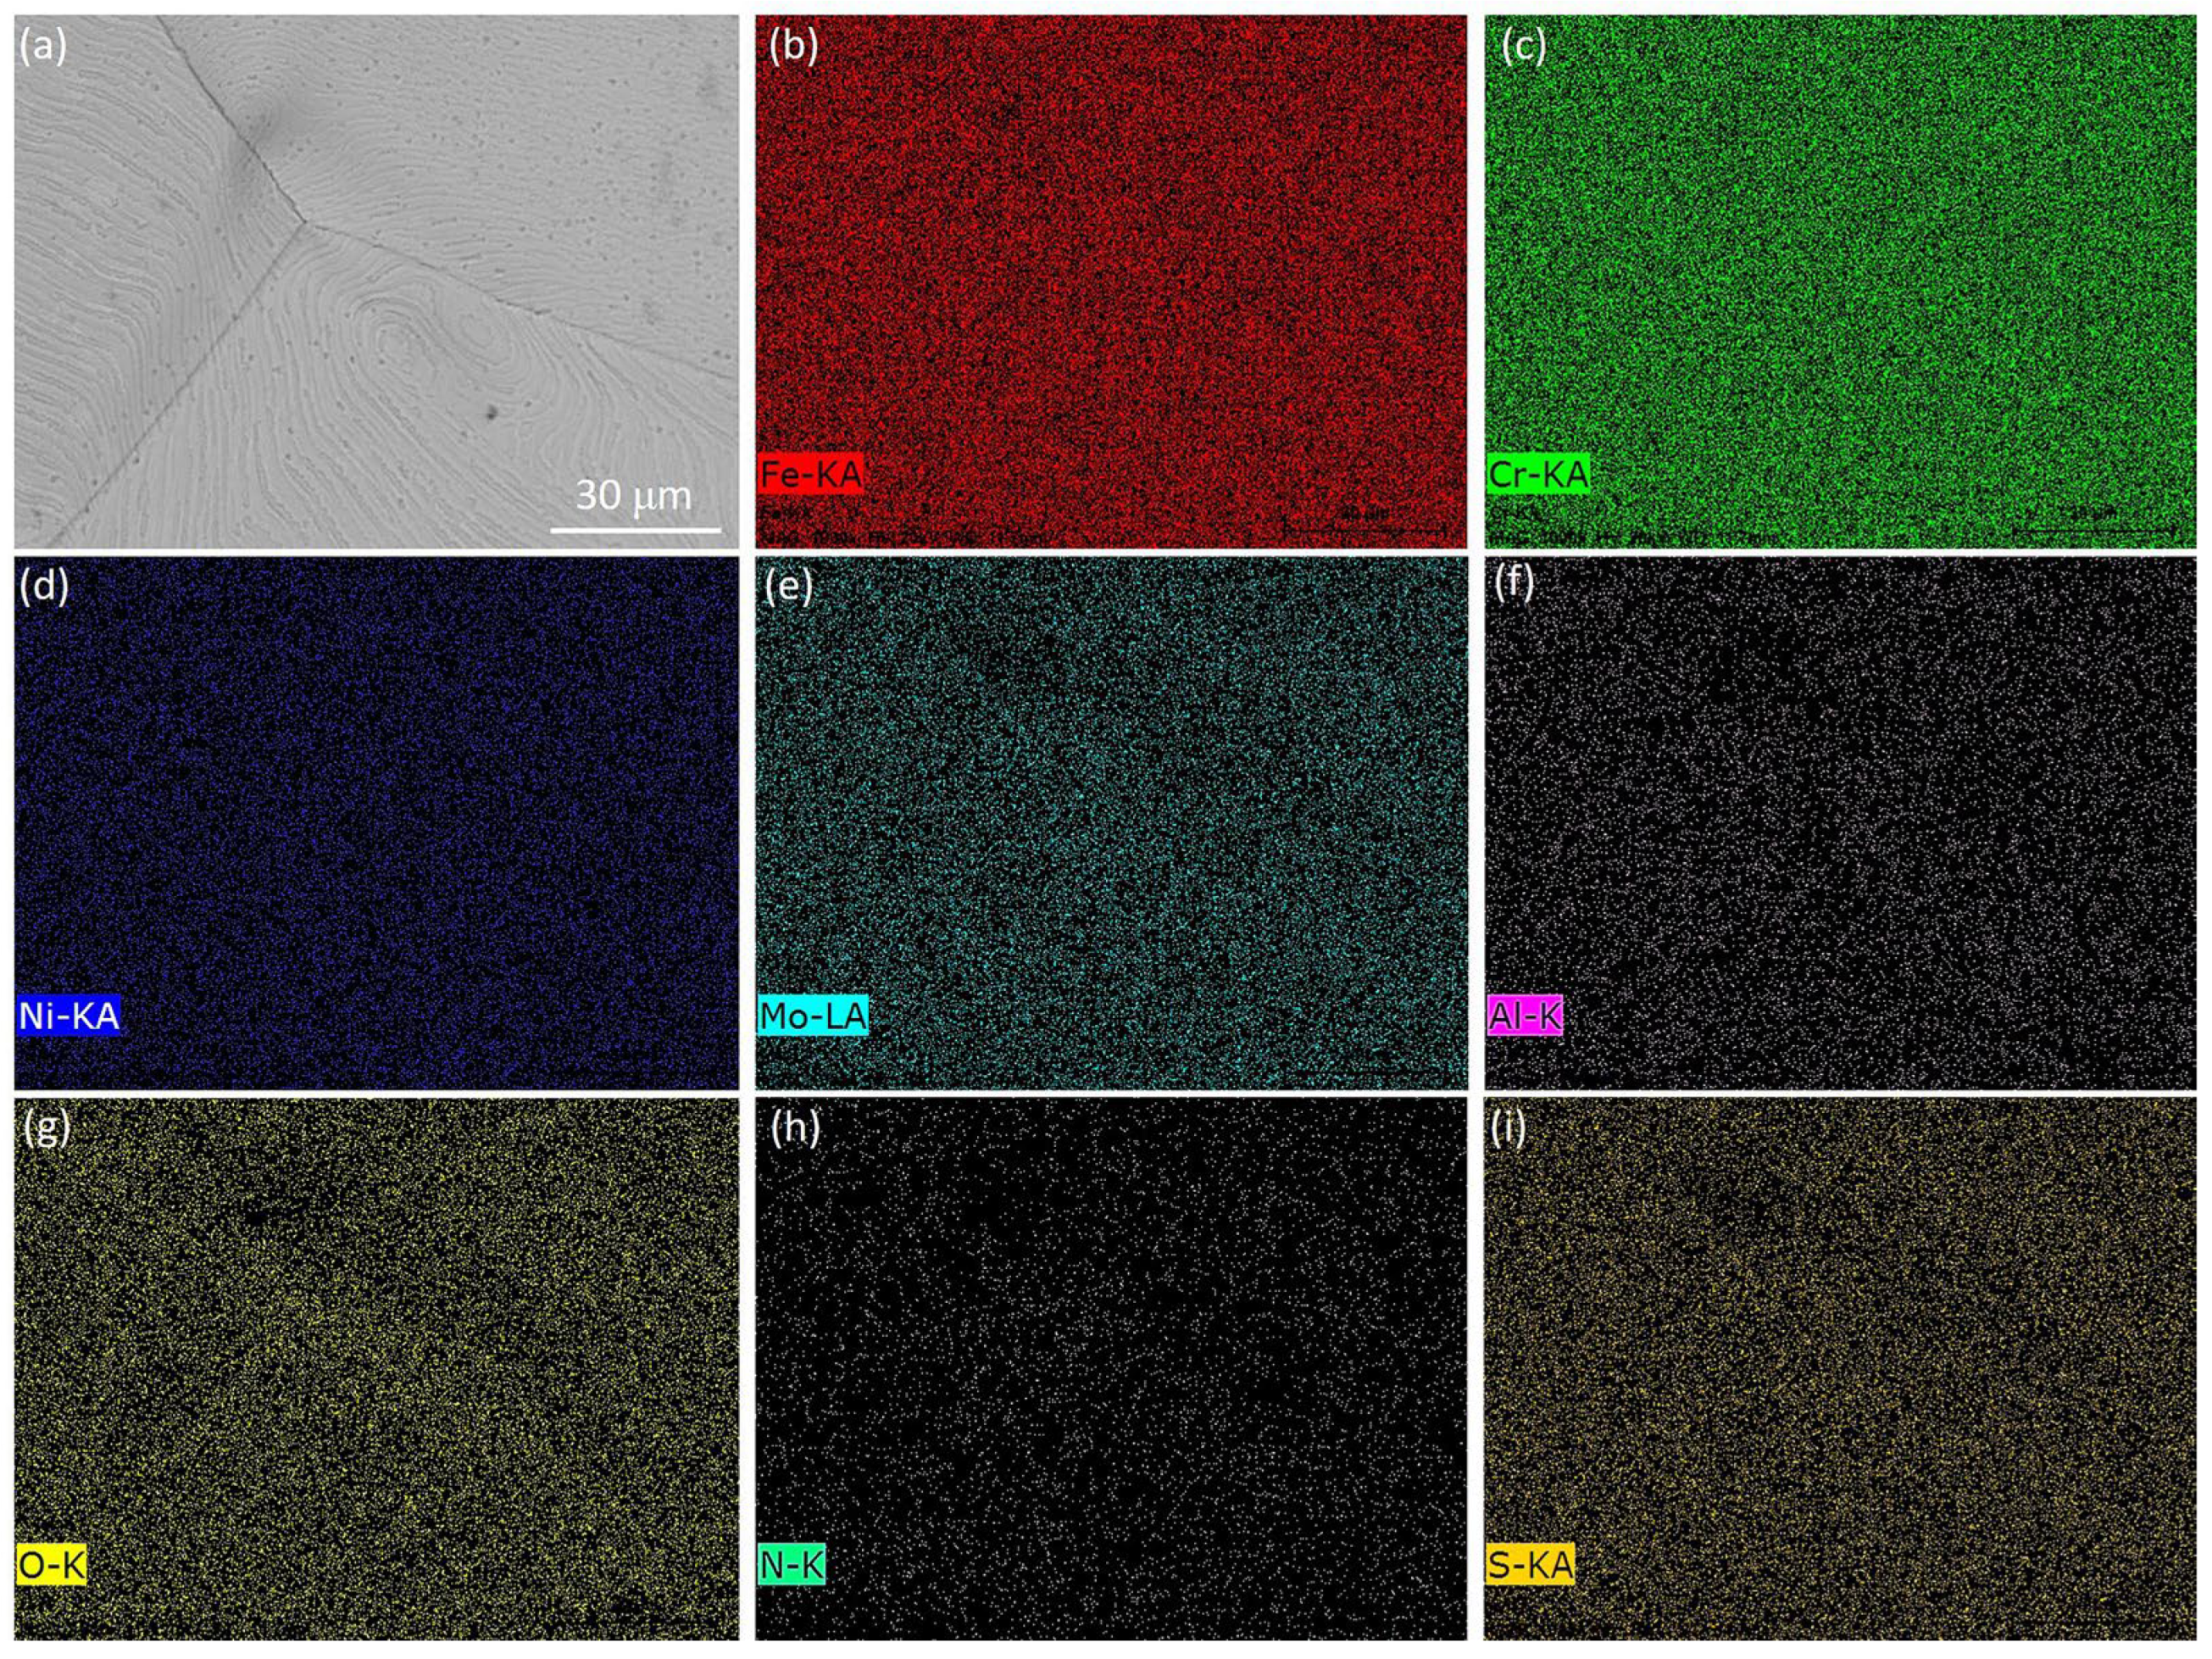
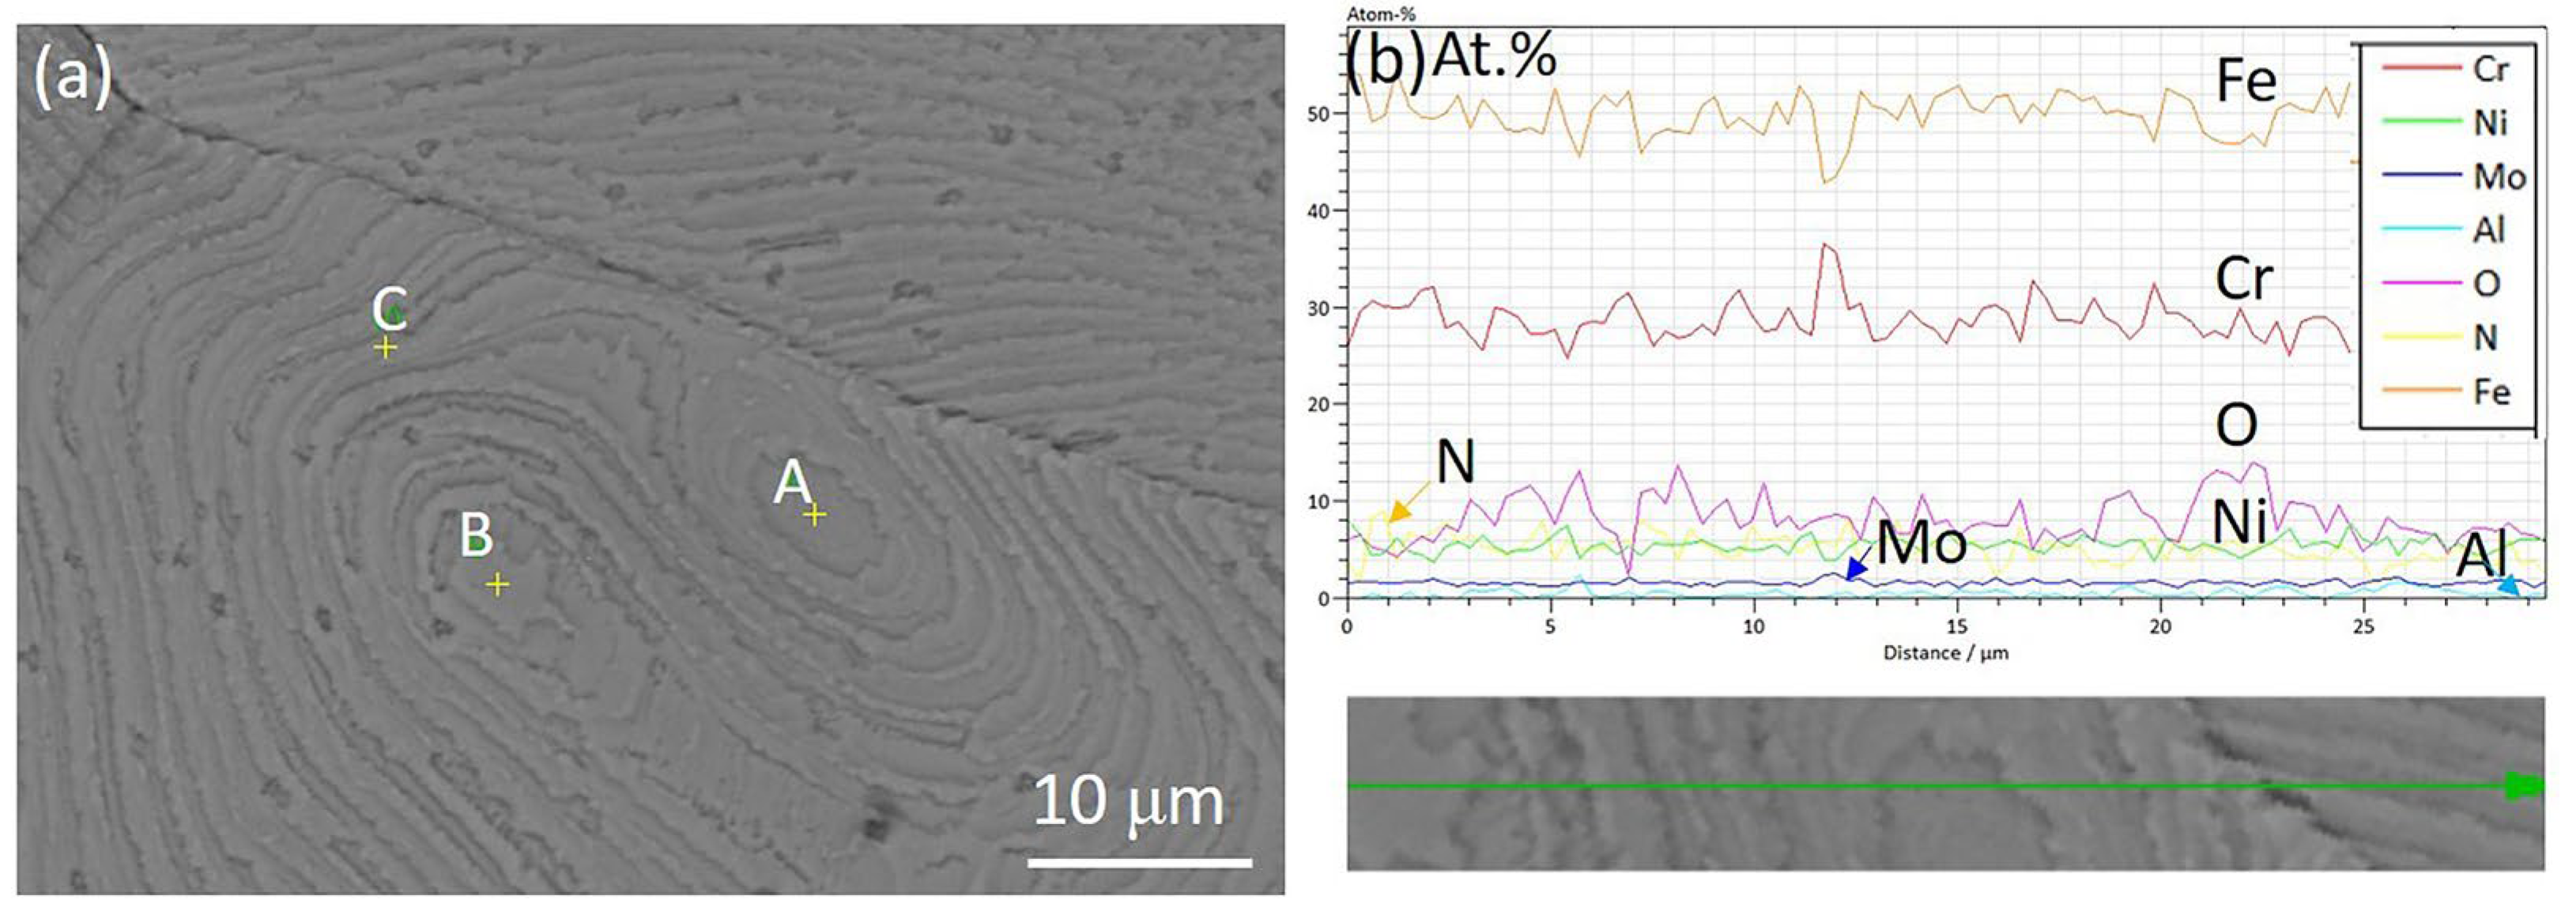
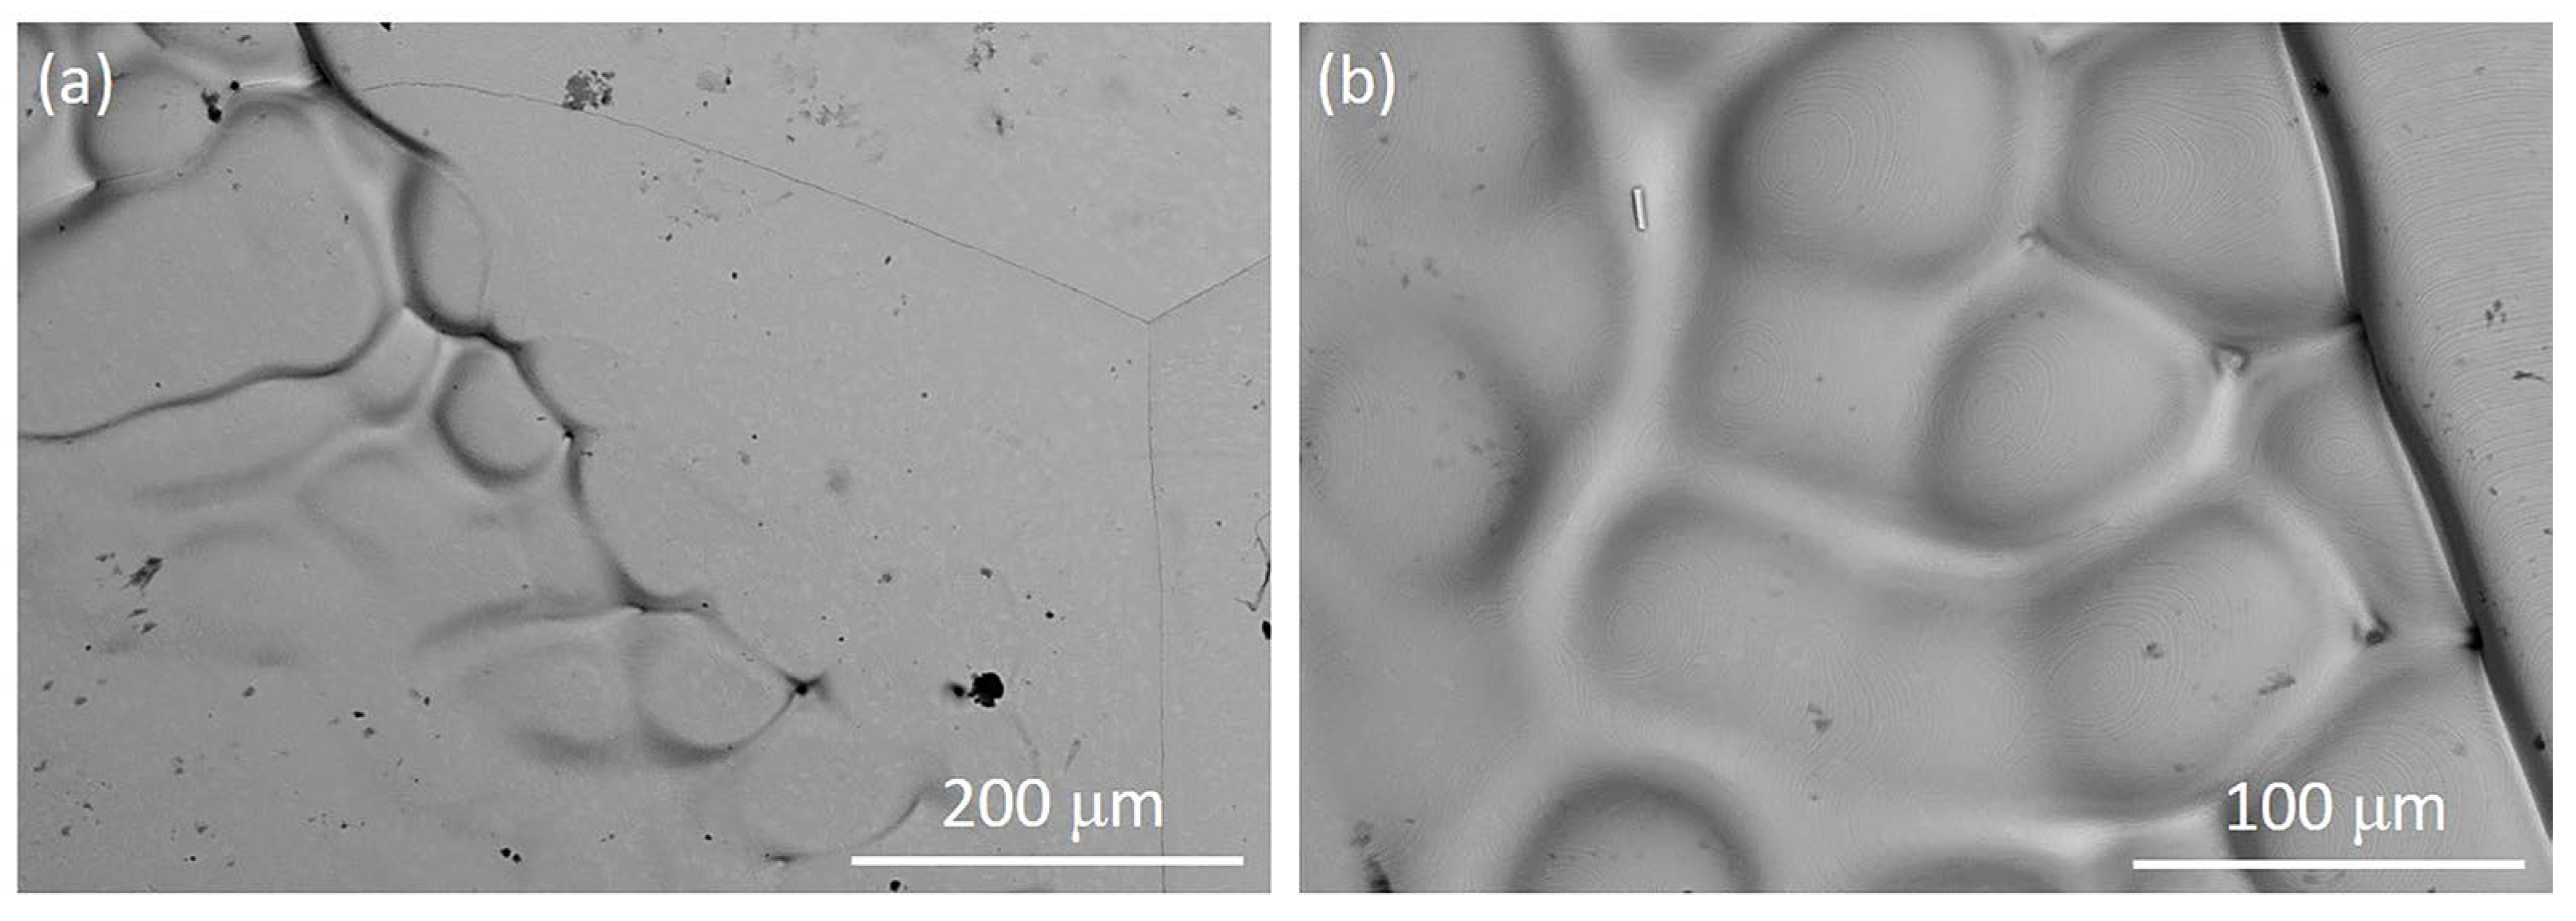
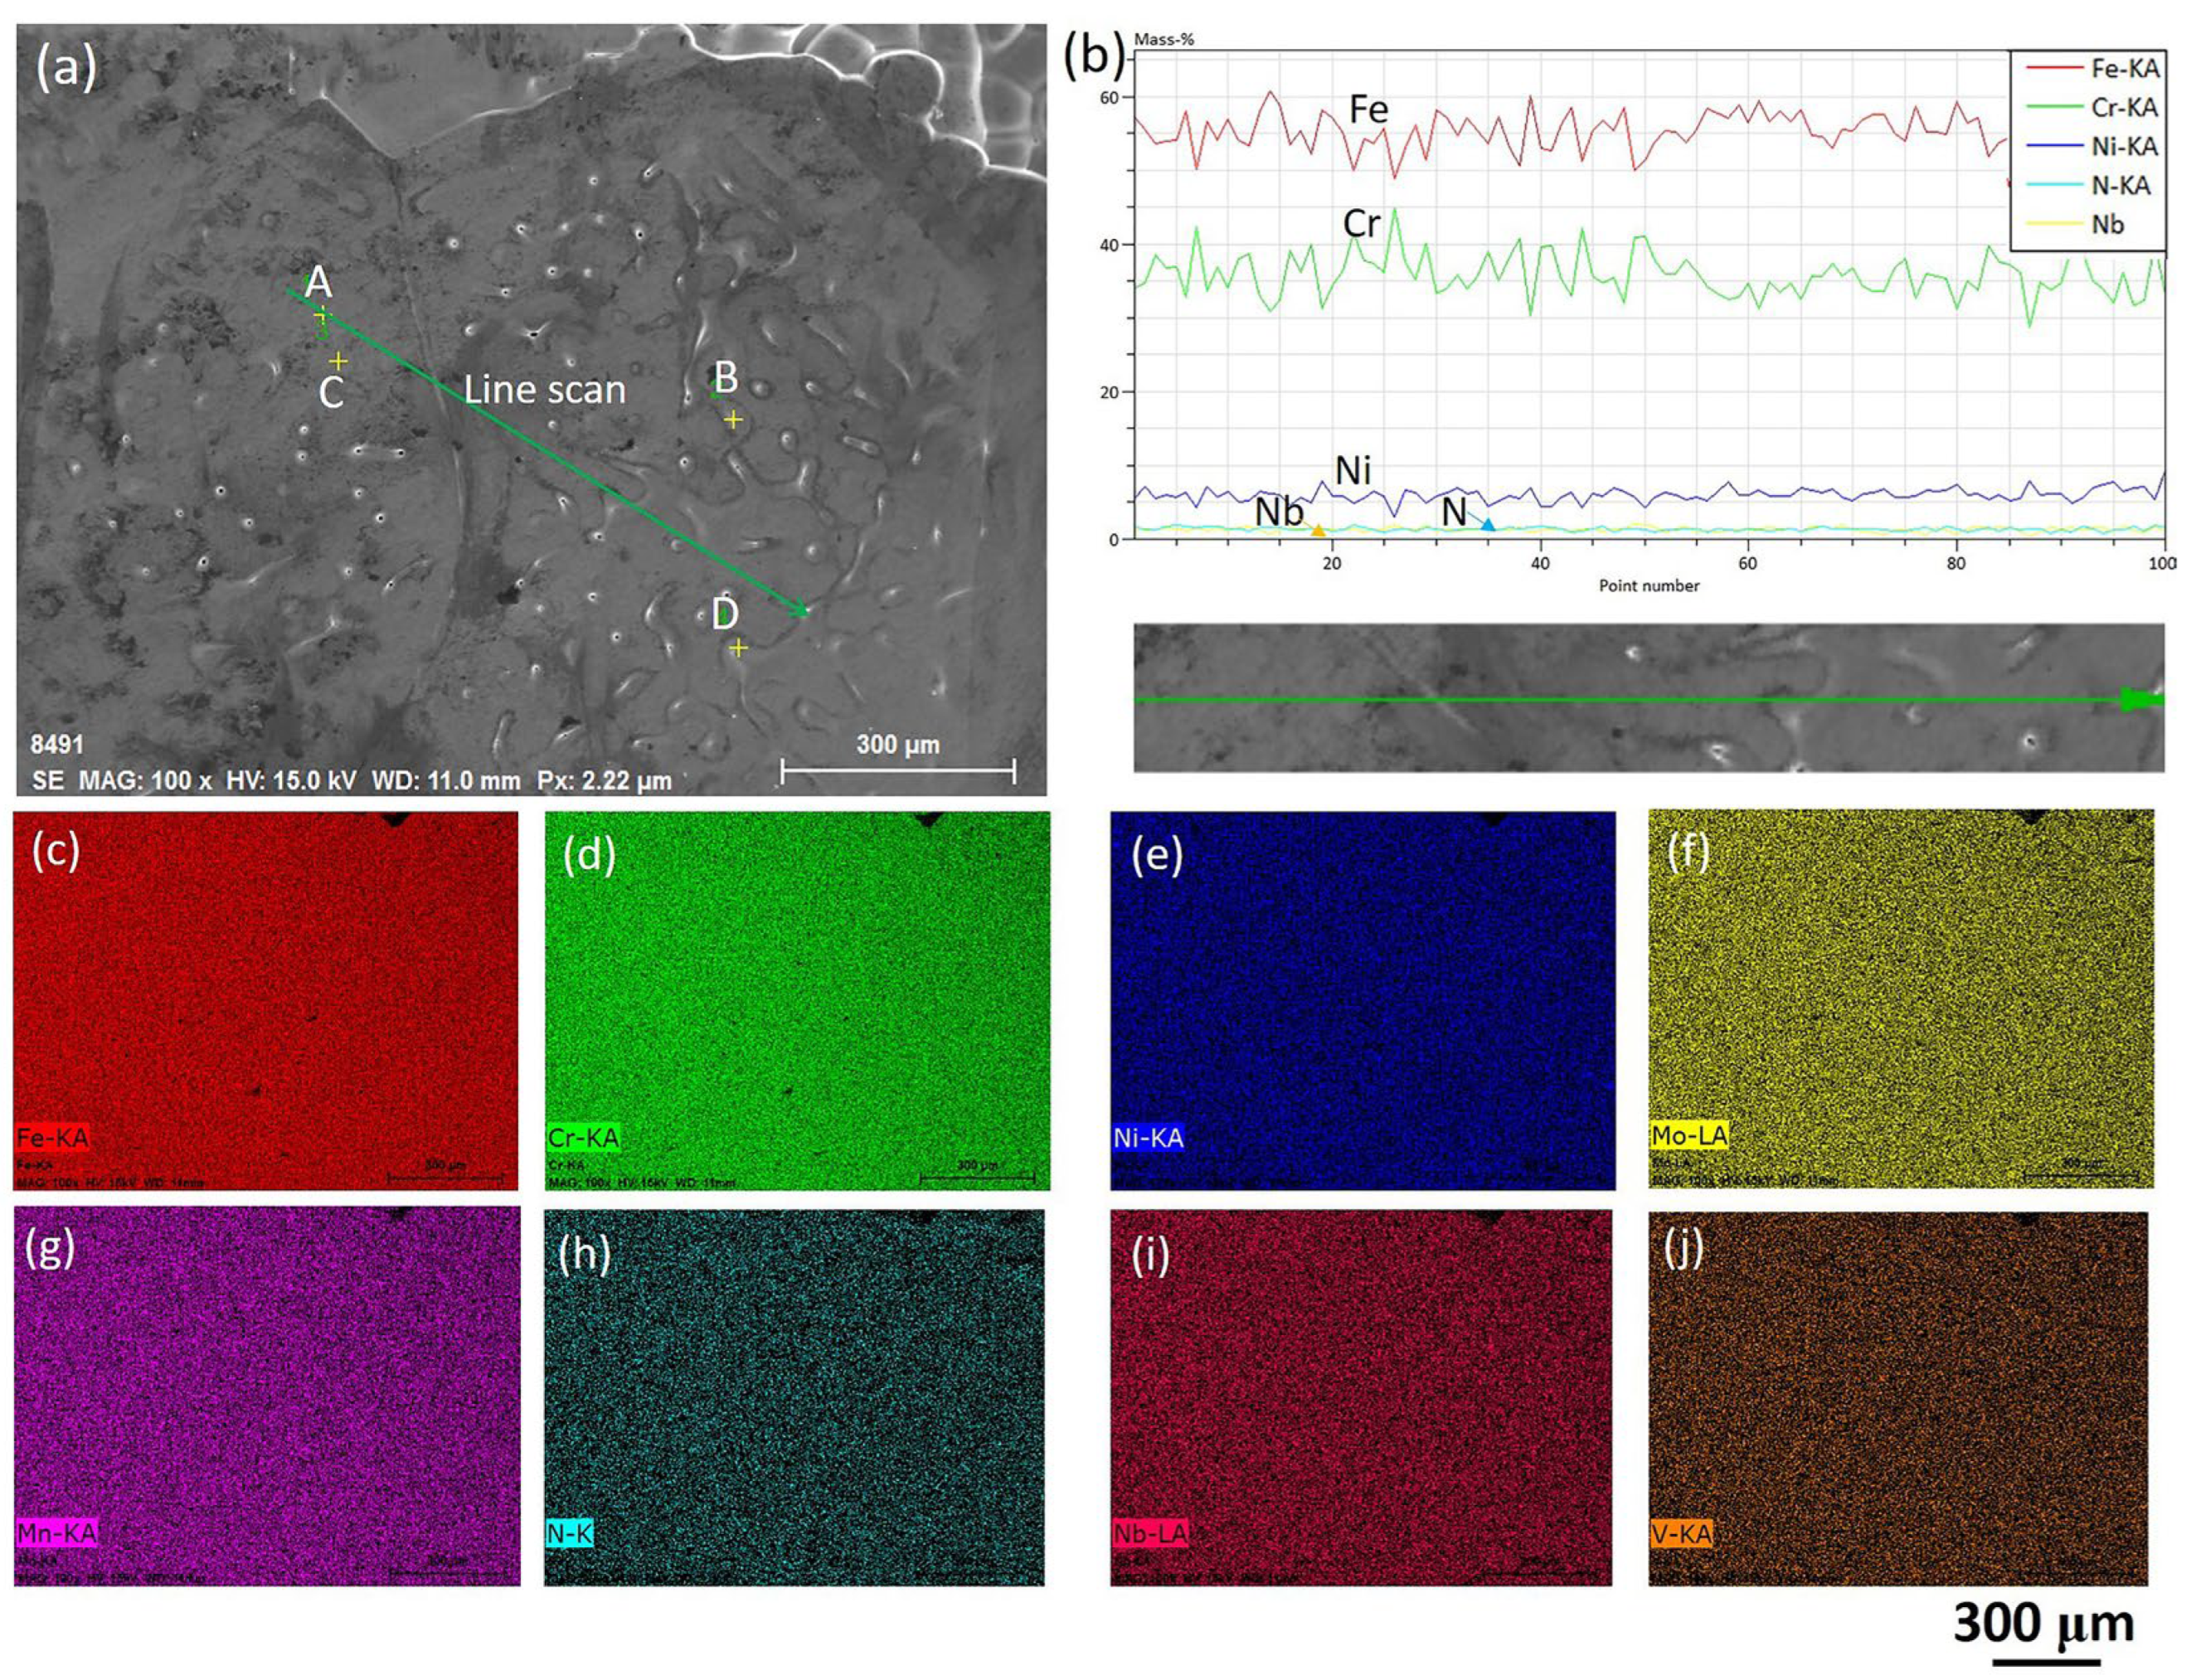
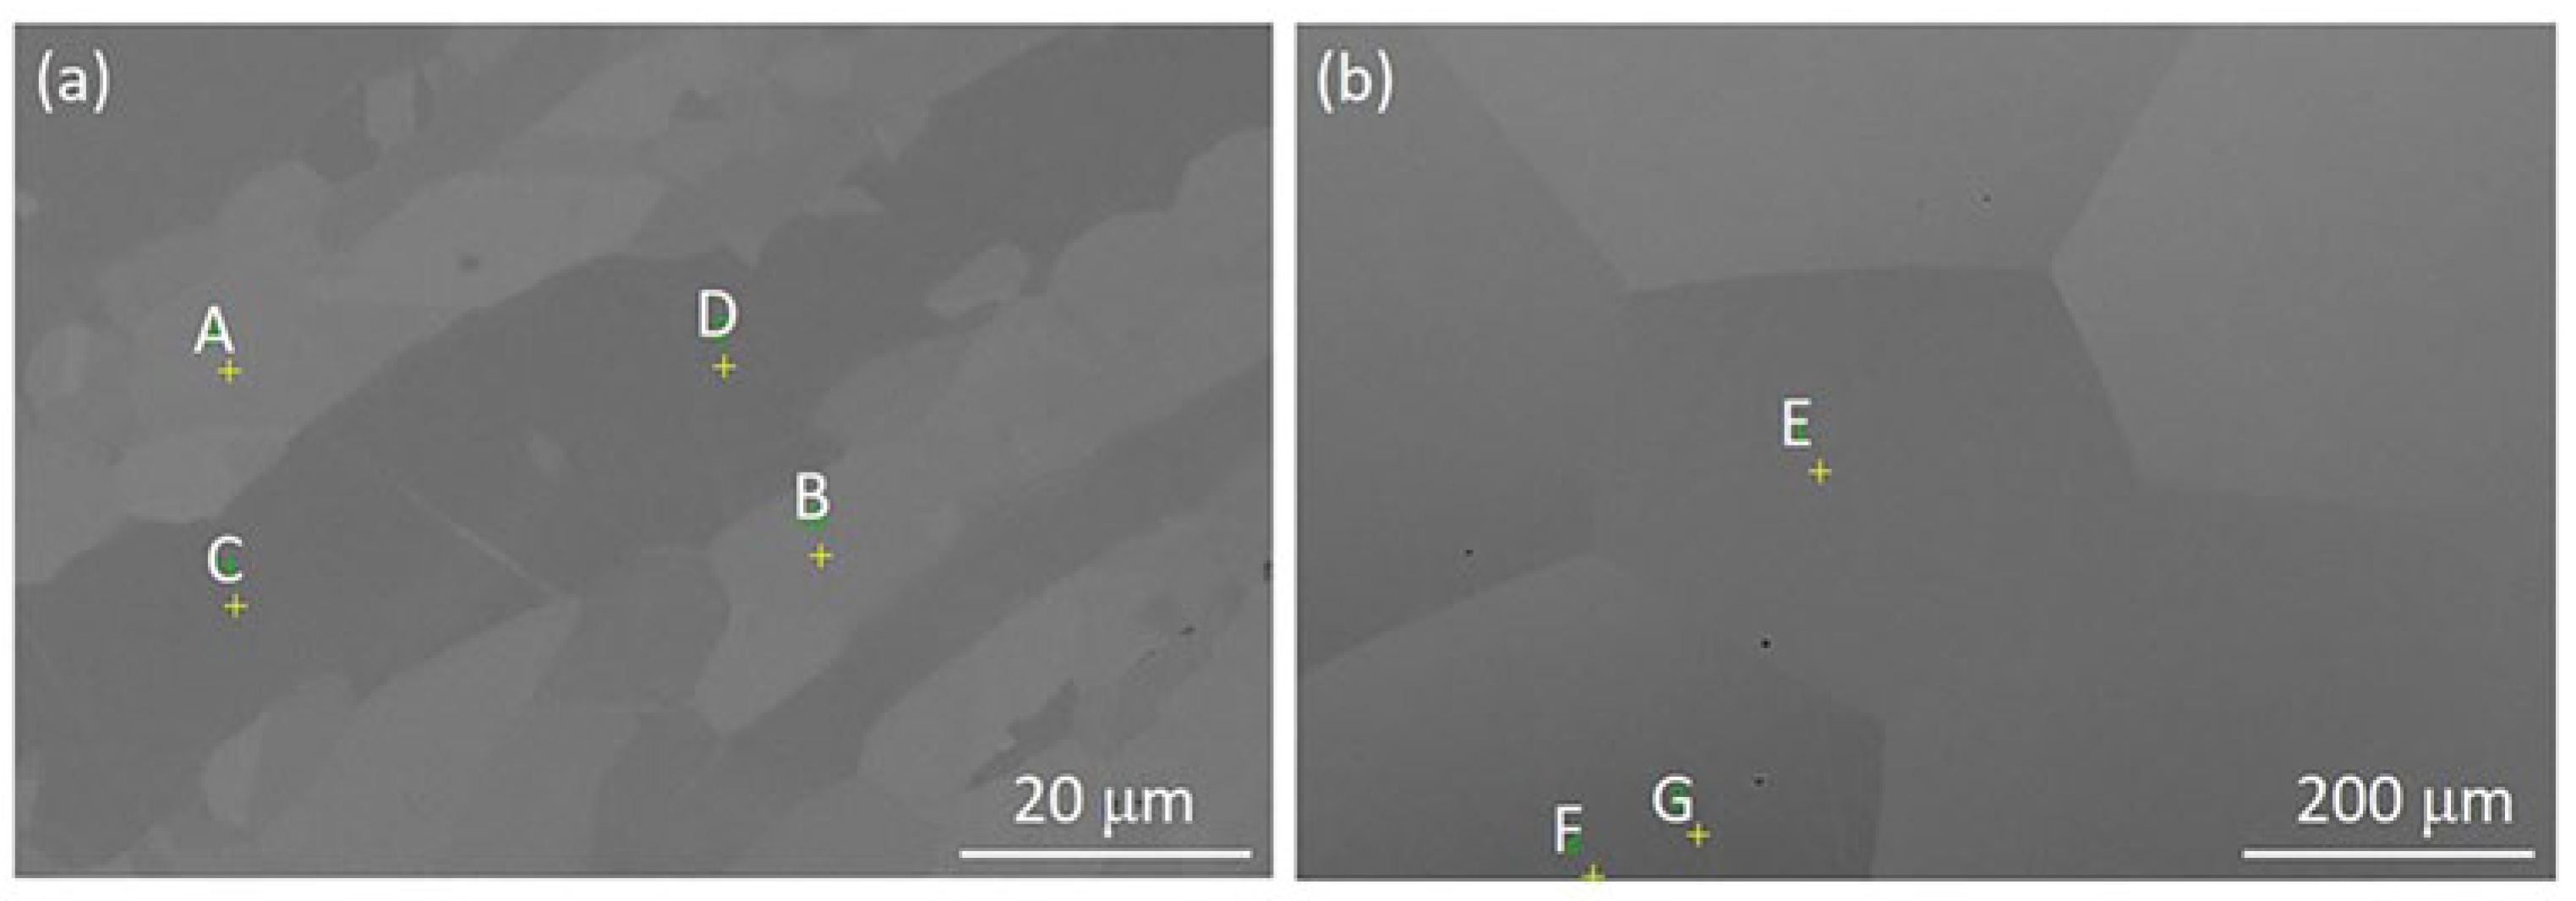
Based on these calculations, it is known that the loss of N in the DSS3207 will lead to a decrease in the austenite fraction in the matrix. A typical microstructure of the as-received and solidified (fast cooling with a 150 °C/min) DSS33207 is displayed Figure 13. In Figure 13a, austenite (points A and B) presents the bright phase while ferrite (points C and D) presents as the dark matrix; the detailed composition of each phase is shown in Table 6. Chemical compositions of N and C are calculated by Thermo-Calc, and the rest was measured using an EDS. It is shown how N and Ni are obviously higher in the austenite phase than that in the ferrite phase, making it easy to identify the FCC structure. Also, a balanced mixture of each phase is shown in Figure 13a. In the solidified microstructure, it is almost the single ferrite phase since the polygonal morphology grain size can be seen, and the austenite can still be recognized due to the contrast difference. According to the unpublished work by the authors, the fraction of austenite in the vertical section of the DSS sample after solidification was around 5%, measured by EBSD. Points E and G represent the ferrite and austenite in the solidified sample. The composition of each phase was almost the same as the one in the as-received sample. Point F seems to be a mixture of both phases since the morphology of the newly formed austenite after solidification seems to resemble a tiny island morphology [25].
The obtained finding regarding the unbalanced microstructure is the normal case when using Ar as the protection gas during solidification. One potential solution to fix this is adding external thermal aging at the austenite temperature to trigger the second austenite formation [2]. Another solution is mixing N2 with Ar to use in the HT-CLSM observation, which will supply the N loss; however, a reverse problem leading to N2 being undertaken may occur. It has been reported that when using N2 as the protection gas, the DSS changes to become an almost single FCC phase steel [32]. In this case, the ratio of mixing N2 with Ar needs to be optimized in future work.

4. Conclusions

In this study, the effects of the cooling rate on the solidification microstructure of the hyper duplex stainless steel S33207 was assessed using a HT-CLSM. The solidification process of S33207 steel and the formation and growth characteristics of the δ-ferrite phase were clarified. The main conclusions are as follows: a higher cooling rate leads to a greater undercooling and lower solidification temperatures of ferrite. As the temperature decreased, the liquid phase first solidified into δ-ferrite, and after solidification is complete, the δ-ferrite would remain for a while and then partially transform into austenite. The area fraction of δ-ferrite during solidification of S33207 steels at a cooling rate of 4 °C/min can be expressed as f δ , slow = 1 exp ( 7.4 × 10 8 × t 3.4 ) , while a cooling rate of 150 °C/min can be expressed as f δ , fast = 1 exp ( 1.2 × 10 3 × t 1.9 ) , respectively. A slow cooling rate favored the growth of δ-ferrite, whereas a high cooling rate favored the nucleation of δ-ferrite. These findings could provide guidelines for the solidification control of advanced hyper duplex stainless steel production. In addition, the microstructure evolution after solidification was briefly mentioned, and suggestions to increase the fraction of austenite have been provided.

Author Contributions

Conceptualization, W.M.; data curation, Y.W.; methodology, investigation, preparation for the original draft, Y.W. and W.M.; manuscript review, revision and editing, funding acquisition, project administration and submission, W.M. All authors have read and agreed to the published version of the manuscript.

Funding

W.M. would like to acknowledge the Swedish Foundation for International Cooperation in Research and Higher Education (STINT, Project No. PT2017-7330 & IB2022-9228), VINNOVA (No. 2022-01216), SSF Strategic Mobility Grant (SM22-0039), the Swedish Steel Producers’ Association (Jernkontoret), and in particular, Axel Ax:-son Johnsons forskningsfond, Prytziska fonden nr 2, and Gerhard von Hofstens Stiftelse för Metallurgisk forskning for the financial support. Y. Wang would like to acknowledge the National Natural Science Foundation of China (No. U21A20113 and 52074198) and the Japan Society for the Promotion of Science (JSPS) for supporting his research.

Data Availability Statement

The data presented in this study are available on request from the corresponding author.

Acknowledgments

Hiroyuki Shibata and Sohei Sukenaga from IMRAM, Tohoku University (Japan) are acknowledged for supporting the HT-CLSM measurement.

Conflicts of Interest

The authors declare no conflict of interest.

References

  1. Qu, H.; Hou, H.; Li, P.; Li, S.; Ren, X. The effect of thermal cycling in superplastic diffusion bonding of heterogeneous duplex stainless steel. Mater. Des. 2016, 96, 499–505. [Google Scholar]
  2. Pettersson, N.; Wessman, S.; Hertzman, S.; Studer, A. High-temperature phase equilibria of duplex stainless steels assessed with a novel in-situ neutron scattering approach. Metall. Mater. Trans. A 2017, 48, 1562–1571. [Google Scholar] [CrossRef]
  3. Tucker, J.; Miller, M.K.; Young, G.A. Assessment of thermal embrittlement in duplex stainless steels 2003 and 2205 for nuclear power applications. Acta Mater. 2015, 87, 15–24. [Google Scholar]
  4. Karahan, T.; Emre, H.E.; Tümer, M.; Kacar, R. Strengthening of AISI 2205 duplex stainless steel by strain ageing. Mater. Des. 2014, 55, 250–256. [Google Scholar] [CrossRef]
  5. Gholami, M.; Hoseinpoor, M.; Moayed, M.H. A statistical study on the effect of annealing temperature on pitting corrosion resistance of 2205 duplex stainless steel. Corros. Sci. 2015, 94, 156–164. [Google Scholar]
  6. Pan, J. Studying the passivity and breakdown of duplex stainless steels at micrometer and nanometer scales–the influence of microstructure. Front. Mater. 2020, 7, 133. [Google Scholar]
  7. Gopal, M.; Gutema, E.M. Factors affecting and optimization methods used in machining duplex stainless steel-a critical review. J. Eng. Sci. Technol. Rev. 2021, 14, 119–135. [Google Scholar] [CrossRef]
  8. Kazakov, A.A.; Zhitenev, A.I.; Fedorov, A.S.; Fomina, O.V. Development of duplex stainless steels Compositions. CIS Iron Steel Rev. 2019, 18, 20–26. [Google Scholar]
  9. Xu, X.Q.; Zhao, M.; Feng, Y.R.; Li, F.G.; Zhang, X. A Comparative Study of Critical Pitting Temperature (CPT) of Super Duplex Stainless Steel S32707 in NaCl Solution. Int. J. Electrochem. Sci 2018, 13, 4298–4308. [Google Scholar]
  10. Nilsson, J.O. Super duplex stainless steels. Mater. Sci. Technol. 1992, 8, 685–700. [Google Scholar]
  11. Petrovič, D.S.; Pirnat, M.; Klančnik, G.; Mrvar, P.; Medved, J. The effect of cooling rate on the solidification and microstructure evolution in duplex stainless steel: A DSC study. J. Therm. Anal. Calorim. 2012, 109, 1185–1191. [Google Scholar] [CrossRef]
  12. Chen, L.; Tan, H.; Wang, Z.; Li, J.; Jiang, Y. Influence of cooling rate on microstructure evolution and pitting corrosion resistance in the simulated heat-affected zone of 2304 duplex stainless steels. Corros. Sci. 2012, 58, 168–174. [Google Scholar] [CrossRef]
  13. Cronemberger, M.E.R.; Nakamatsu, S.; Della Rovere, C.A.; Kuri, S.E.; Mariano, N.A. Effect of cooling rate on the corrosion behavior of as-cast SAF 2205 duplex stainless steel after solution annealing treatment. Mater. Res. 2015, 18, 138–142. [Google Scholar] [CrossRef] [Green Version]
  14. Zhu, C.; Zeng, J.; Wang, W.; Chang, S.; Lu, C. Mechanism of δ→ δ+ γ phase transformation and hardening behavior of duplex stainless steel via sub-rapid solidification process. Mater. Charact. 2020, 170, 110679. [Google Scholar] [CrossRef]
  15. Mu, W.; Mao, H.; Jönsson, P.G.; Nakajima, K. Effect of carbon content on the potency of the intragranular ferrite formation. Steel Res. Int. 2016, 87, 311–319. [Google Scholar] [CrossRef]
  16. Shibata, H.; Arai, Y.; Suzuki, M.; Emi, T. Kinetics of peritectic reaction and transformation in Fe-C alloys. Metall. Mater. Trans. B 2000, 31, 981–991. [Google Scholar] [CrossRef]
  17. Wang, Y.; Wang, Q.; Mu, W. In Situ Observation of Solidification and Crystallization of Low-Alloy Steels: A Review. Metals 2023, 13, 517. [Google Scholar]
  18. Wu, C.; Li, S.; Zhang, C.; Wang, X. Microstructural evolution in 316LN austenitic stainless steel during solidification process under different cooling rates. J. Mater. Sci. 2016, 51, 2529–2539. [Google Scholar] [CrossRef] [Green Version]
  19. Li, X.; Gao, F.; Jiao, J.; Cao, G.; Wang, Y.; Liu, Z. Influences of cooling rates on delta ferrite of nuclear power 316H austenitic stainless steel. Mater. Charact. 2021, 174, 111029. [Google Scholar] [CrossRef]
  20. Li, Y.; Zou, D.; Chen, W.; Zhang, Y.; Zhang, W.; Xu, F. Effect of cooling rate on solidification and segregation characteristics of 904L super austenitic stainless steel. Met. Mater. Int. 2022, 28, 1907–1918. [Google Scholar] [CrossRef]
  21. Sun, Y.; Zhao, Y.; Li, X.; Jiao, S. Effects of heating and cooling rates on δ↔ γ phase transformations in duplex stainless steel by in situ observation. Ironmak. Steelmak. 2019, 46, 277–284. [Google Scholar] [CrossRef]
  22. Wang, T. The Effects of Cooling Rate and Alloying Elements on the Solidification Behaviour of Continuously Cast Super-Austenitic and Duplex Stainless Steels. Master’s Thesis, University of Wollongong, Wollongong, Australia, 2019. [Google Scholar]
  23. Zhao, Y.; Sun, Y.; Li, X.; Song, F. In-situ observation of δ↔ γ phase transformations in duplex stainless steel containing different nitrogen contents. ISIJ Int. 2017, 57, 1637–1644. [Google Scholar] [CrossRef] [Green Version]
  24. Shin, B.H.; Park, J.; Jeon, J.; Heo, S.B.; Chung, W. Effect of cooling rate after heat treatment on pitting corrosion of super duplex stainless steel UNS S 32750. Anti-Corros. Methods Mater. 2018, 65, 492–498. [Google Scholar] [CrossRef]
  25. Wang, Y.; Sukenaga, S.; Shibata, H.; Wang, Q.; Mu, W. Combination of in-situ confocal microscopy and calorimetry to investigate solidification of super and hyper duplex stainless steels. Steel Res. Int. 2023, in press. [Google Scholar]
  26. Mu, W.; Shibata, H.; Hedström, P.; Jönsson, P.G.; Nakajima, K. Combination of in situ microscopy and calorimetry to study austenite decomposition in inclusion engineered steels. Steel Res. Int. 2016, 87, 10–14. [Google Scholar] [CrossRef]
  27. Shi, X.; Duan, S.C.; Yang, W.S.; Guo, H.J.; Guo, J. Effect of cooling rate on microsegregation during solidification of superalloy INCONEL 718 under slow-cooled conditions. Metall. Mater. Trans. B 2018, 49, 1883–1897. [Google Scholar] [CrossRef]
  28. Liang, G.; Wan, C.; Wu, J.; Zhu, G.; Yu, Y.; Fang, Y. In situ observation of growth behavior and morphology of delta-ferrite as function of solidification rate in an AISI304 stainless steel. Acta Metall. Sin. 2006, 19, 441–448. [Google Scholar] [CrossRef]
  29. Wang, T.; Wexler, D.; Guo, L.; Wang, Y.; Li, H. In situ observation and phase-field simulation framework of duplex stainless-steel slab during solidification. Materials 2022, 15, 5517. [Google Scholar] [CrossRef] [PubMed]
  30. Christian, J.W. The Theory of Transformations in Metals and Alloys; Newnes: Oxford, UK, 2002. [Google Scholar]
  31. Bruna, P.; Crespo, D.; González-Cinca, R.; Pineda, E. On the validity of Avrami formalism in primary crystallization. J. Appl. Phys. 2006, 100, 054907. [Google Scholar] [CrossRef] [Green Version]
  32. Wang, T.; Phelan, D.; Wexler, D.; Qiu, Z.; Cui, S.; Franklin, M.; Guo, L.; Li, H. New insights of the nucleation and subsequent phase transformation in duplex stainless steel. Mater. Char. 2023, 203, 113115. [Google Scholar] [CrossRef]
Figure 1. (a) Scheil solidification and (b) equilibrium calculations of the phase formations under different temperatures in the S33207 steel.
Crystals 13 01114 g001
Figure 2. DTA results of the DSS33207 with the solidification rate of (a) 4 °C/min and (b) 150 °C/min, respectively.
Crystals 13 01114 g002
Figure 3. Growth process and characteristics of the δ-ferrite phase at a cooling rate of 4 °C/min at different temperatures of (a) 1481.8 °C, (b) 1479.5 °C, (c) 1478.5 °C, (d) 1477.9 °C, (e) 1477.3 °C, and (f) 1475.5 °.
Crystals 13 01114 g003
Figure 4. Growth process and characteristics of the δ phase at a cooling rate of 150 °C/min at different temperatures of (a) 1484.4 °C, (b) 1461.9 °C, (c) 1445.6 °C, (d) 1427.6 °C, (e) 1319.1 °C, and (f) 1052.3 °C.
Crystals 13 01114 g004
Figure 5. Relationships between the area fraction of δ-ferrite with the time (a) and temperature (b), relationships between the average and maximum diameters of δ-ferrite with time (c), and relationships between the number density of nucleation sites with time (d). The experimental data of the slow cooling condition in (a) to (c) were taken and adapted from Ref. [25].
Crystals 13 01114 g005
Figure 6. Typical morphology and chemical element maps of the S33207 steel after solidification with a cooling rate of 4 °C/min, (a) SEM images, and (bi) chemical maps of the Fe, Cr, Ni, Mo, Mn, Al, O, N, and S elements, respectively.
Crystals 13 01114 g006
Figure 7. SEM image and line scan of the S33207 steel after solidification with a cooling rate of 4 °C/min, (a) morphology image, and (b) line scan of the Fe, Cr, Ni, Mo, Mn, Al, O, and N elements, respectively, A, B and C represent different selected locations for point analysis.
Crystals 13 01114 g007
Figure 8. SEM image and the line scan of local particles on the S33207 steel surface with a cooling rate of 4 °C/min. (a) Morphology image. (b) Line scan of the Fe, Cr, Ni, Mo, Mn, Al, O, and N elements, respectively. Yellow and green arrows represent line scan area and direction.
Crystals 13 01114 g008
Figure 9. Typical morphology of S33207 after solidification with a cooling rate of 150 °C/min, with (b) displaying a magnification of a local place in (a).
Crystals 13 01114 g009
Figure 10. Typical morphology and chemical analysis of S33207 steel after solidification with a cooling rate of 150 °C/min. (a) SEM images. (b) Line scan result. (cj) Chemical maps of the Fe, Cr, Ni, Mo, Mn, N, Nb, and V elements, respectively. The green arrow represents the line scan area and direction.
Crystals 13 01114 g010
Figure 11. Phase diagram of DSS3207 with different N contents.
Crystals 13 01114 g011
Figure 12. Driving force of austenite formation from the ferrite matrix at (a) 1000 °C and (b) 1200 °C, respectively.
Crystals 13 01114 g012
Figure 13. SEM images of the cross-section of the (a) as-received and (b) solidified DSS33207. Points A to G represent the different locations which are checked by point analysis.
Crystals 13 01114 g013
Table 1. Chemical compositions of the S33207 steel samples (mass percent, %).
SteelCSiMnSCrNiMoCuNTiNbAlVOFe
S332070.0150.2500.7000.00131.2007.0003.4600.2000.4700.0100.0100.0100.0700.004Bal.
Table 2. Phase transition temperatures during the heating and cooling processes.
SpecimenHeatingCooling
Tsol. (°C)Tliq. (°C)Ton.Soli. (°C)TPeak.Soli. (°C)
Slow cooling1445 148414691466
Fast cooling1442148414521402
Table 3. Chemical compositions of the different locations of the S33207 samples with a 4 °C/min cooling rate.
Point in Figure 7aChemical Elements (mass %)
O *AlSiCrNiMoFe
A1.400.200.2229.307.032.94Bal.
B1.650.040.5430.856.023.08Bal.
C1.930.060.2229.696.712.96Bal.
Mean value1.660.100.3329.956.592.99Bal.
Sigma0.260.090.190.810.520.08-
Sigma mean0.150.050.110.470.300.04-
* Light elements of O was measured using an EDS and was conducted as a quantitative analysis to confirm the identification of the phase including oxygen. The composition of the rest light elements e.g. N is not listed here.
Table 4. Chemical compositions (mass %) of the different locations of the S33207 samples after solidification.
Point in Figure 10aChemical Elements (mass %) *
AlSiTiVCrMnFeNiNbMo
A0.020.270.020.0332.510.34Bal.6.430.103.22
B0.030.130.020.1541.830.54Bal.5.590.063.99
C0.070.240.010.0235.550.46Bal.5.570.093.41
D0.120.390.010.0330.180.37Bal.6.930.163.00
Mean value0.060.260.010.0635.020.43Bal.6.130.103.41
Sigma0.050.110.010.065.050.09-0.670.040.42
Sigma mean0.020.0500.032.520.05-0.330.020.21
* Light element of N cannot be detected quantitatively using an EDS, and so was not listed here.
Table 5. Nitrogen content analysis in the specimens before and after solidification.
ConditionOriginalSolidification with a CR of 4 °C/minSolidification with a CR of 150 °C/min
N mass %0.4700.0120.131
Table 6. Chemical analysis of austenite and ferrite in the as-received and solidified DSS33207.
PointsPhaseChemical Elements (mass %)
N *C *SiCrNiMoFe
AFCC0.8310.0230.2830.497.932.54Bal.
BFCC0.5530.268.172.18Bal.
Mean value-0.8310.0230.2630.378.052.36Bal.
Sigma---0.020.160.170.25Bal.
Sigma mean---0.020.120.120.18Bal.
CBCC0.1050.0080.3131.025.913.60Bal.
DBCC0.2930.596.023.25Bal.
Mean value-0.1050.0080.3030.805.963.42Bal.
Sigma---0.010.310.080.24Bal.
Sigma mean---0.010.220.060.17Bal.
EBCC0.1050.0080.2631.456.222.66Bal.
FMixed--0.3230.307.053.34Bal.
GFCC0.8310.0230.2530.068.202.90Bal.
Mean value---0.2730.067.162.97Bal.
Sigma---0.040.740.990.35Bal.
Sigma mean---0.020.430.570.20Bal.
* Content calculated by Thermo-Calc.
Disclaimer/Publisher’s Note: The statements, opinions and data contained in all publications are solely those of the individual author(s) and contributor(s) and not of MDPI and/or the editor(s). MDPI and/or the editor(s) disclaim responsibility for any injury to people or property resulting from any ideas, methods, instructions or products referred to in the content.

