Article

A Dual-Core Surface Plasmon Resonance-Based Photonic Crystal Fiber Sensor for Simultaneously Measuring the Refractive Index and Temperature

1
Bell Honors School, Nanjing University of Posts and Telecommunications, Nanjing 210023, China
2
Portland Institute, Nanjing University of Posts and Telecommunications, Nanjing 210023, China
3
College of Electronic and Optical Engineering, College of Flexible Electronics (Future Technology), Nanjing University of Posts and Telecommunications, Nanjing 210023, China
*
Author to whom correspondence should be addressed.
Crystals 2023, 13(6), 972; https://doi.org/10.3390/cryst13060972
Submission received: 22 May 2023 / Revised: 15 June 2023 / Accepted: 16 June 2023 / Published: 19 June 2023
(This article belongs to the Special Issue Recent Advances in Photonic Crystal and Optical Devices)

Abstract

:
In this correspondence, a new photonic crystal fiber biosensor structure on the basis of surface plasmon resonance is proposed for the measurement of the refractive index (RI) and TSM temperature simultaneously. In this design, the central and external surface of the biosensor structure are coated with thin gold film. A hole adjacent to the inner gold film is filled with temperature-sensitive material (TSM). With the implementation of internal and external gold coatings along with TSM, the biosensor achieves the measurement of the RI and temperature with two disjoint wavelength coverage. Numerical simulations and calculation results illustrate that the average wavelength sensitivity of the biosensor structure, respectively, achieves 7080 nm/RIU and 3.36 nm/°C with RI coverage from 1.36 to 1.41 and temperature coverage from 0 to 60 °C. Moreover, benefiting from realization of different wavelength regions in RI and temperature sensing, it is believed that the proposed biosensor structure for the measurement of the RI and temperature will have range applications in the fields of medical diagnostics and environmental assessments.

1. Introduction

Surface plasmon resonance (SPR) is a collective oscillation of conduction band electrons which are interacting with the oscillating electric field of the incident light to cause resonance [1]. It is an optical effect wherein the incident light with an appropriate incidence angle brings photons to the surface of metal and plasmonic materials, resulting in the surface-located electrons being interacted and excited. Then, the electrons propagate parallel to the surface and produce energetic plasmon electrons through non-radiative excitation [2,3]. When the effect happens, a minuscule change in the reflective index (RI) or other variables of the background medium or multi-scale system will alter the phase-matching condition and further hinder the occurrence of the excitation of the SPR effect, which makes it feasible for the measurement of analyte RI or other objects in the field of sensing, especially medical testing services in the context of the coronavirus disease [4,5,6]. In recent years, with extensive studies and applications on photonic crystal fibers (PCFs) [7], the findings have concluded that PCFs are a satisfactory environment for the SPR effect to be excited due to its distinctive optical properties and a designable structure with a variety of geometrical topologies and plasmonic materials to choose from [8,9,10,11]. A significant number of works have been dedicated to propose SPR-based PCF sensors to achieve favorable results in multiphysics measurement, such as analyte RI [12], TSM temperature [13], magnetic density [14], structure strain [15], etc.
With development of structural design and fabrication technologies, a multitude of works have focused on various geometry topologies and fabrication materials of the sensor structure. In 2020, Islam et al. proffered a superior RI sensing performance by introducing a circular air hole array with a strategic pattern method in the fiber structure. In this work, a maximum wavelength sensitivity ( S n ) of about 41,500 nm/RIU along with a maximum amplitude sensitivity ( S a ) of about 5060 RIU 1 were achieved with a coverage for analyte RI sensing from 1.32 to 1.43 [16]. During the same period, Wang et al. obtained a novel fiber sensor structure by applying a symmetrical geometry, which had an ultra-wide coverage for the detection of analyte RI from 1.29 to 1.49 for both x and y polarized modes. The S n value was, respectively, found to be −4156.82 nm/RIU and −3703.64 nm/RIU [17]. In 2022, Fu et al. achieved a fiber structure consisting of two cladding layers along with square-arranged holes filled with gold and temperature-sensitive material (TSM) chloroform, which resulted in a maximum and average temperature sensitivity ( S T ) of −10.4 nm/°C and −8.25 nm/°C, respectively [18].
However, in complicated scenarios, the measurement of a single parameter cannot meet the requirements in operational applications. Moreover, the optimization of a single parameter cannot achieve the optimal outcome. Furthermore, the measurement of a single parameter in the sensor implies a serious cross-talk problem between the correlated parameters in a complex system. For that reason, a number of multi-scale sensors have been proposed to efficiently address the issue to break through the bottleneck in the contemporary research. In 2019, Liu et al. achieved a RI and temperature measurement sensor which was polished into a D shape for high polarization-maintaining. The research results demonstrated the corresponding maximum sensitivity, respectively, to be of 44,850 nm/RIU with a coverage for RI detection from 1.43 to 1.50 and −16.875 nm/°C with a coverage for temperature measurement from 36 to 86 °C. A coverage of the operating wavelength for the RI and temperature detection ranged from 0.9 to 2.2 μ m and from 1.0 to 1.6 μ m, respectively. Seemingly, it is incapable of achieving the measurement of analyte RI and temperature in two distant wavelength regions simultaneously [19].
In contemporary research, some of the studies have achieved the measurement of different parameters with the same coverage of wavelength simultaneously by applying orthogonal polarization states of two modes. In 2022, Zhang et al. achieved a thin polarization-maintaining fiber (TPMF) with simultaneous temperature and strain measurement. In the work, it was revealed that the temperature and strain sensitivity reached adequate levels of 91.84 pm/°C and −2.37 pm/ μ ϵ , respectively. Meanwhile, the resolution of the structure achieved 0.41 °C and 0.07 μ ϵ . Furthermore, the maximum measurable value of strain was concluded as 8000 μ ϵ [20]. In the same year, An et al. obtained a flat polished sensor structure for temperature and RI measurement by utilizing a fiber coated with gold films, while some air holes were filled with TSM toluene. The research results illustrated that the S n and S T value, respectively, achieved 17,000 nm/RIU and −5 nm/°C along with a coverage of analyte RI from 1.32 to 1.41 and a coverage of temperature from −30 to 40 °C [21]. Previous works have reached multi-parameters measurement but still cannot guarantee the disjoint wavelength regions when applied in different parameters. Therefore, a sensor structure for the measurement of multi-parameters simultaneously with disjoint coverage of operating wavelengths for each variable in the system is urgently sought.
In this work, a new biosensor structure is obtained for the measurement of analyte RI and TSM temperature simultaneously. The sensing performances of the fiber structure are investigated through numerical simulation with the help of the finite element method (FEM). With the utilization of internal and external Au films along with TSM, the biosensor achieves the measurement of the refractive index and temperature with two disjoint wavelength coverage. The numerical simulation and calculation results demonstrate that the average S n and S T values of the biosensor structure can, respectively, reach 7080 nm/RIU and 3.36 nm/°C with a coverage of analyte RI from 1.36 to 1.41 and a coverage of TSM temperature from 0 to 60 °C. It is believed that the proposed biosensor fiber structure will have a range of applications in the fields of medical diagnostics and environmental assessment.

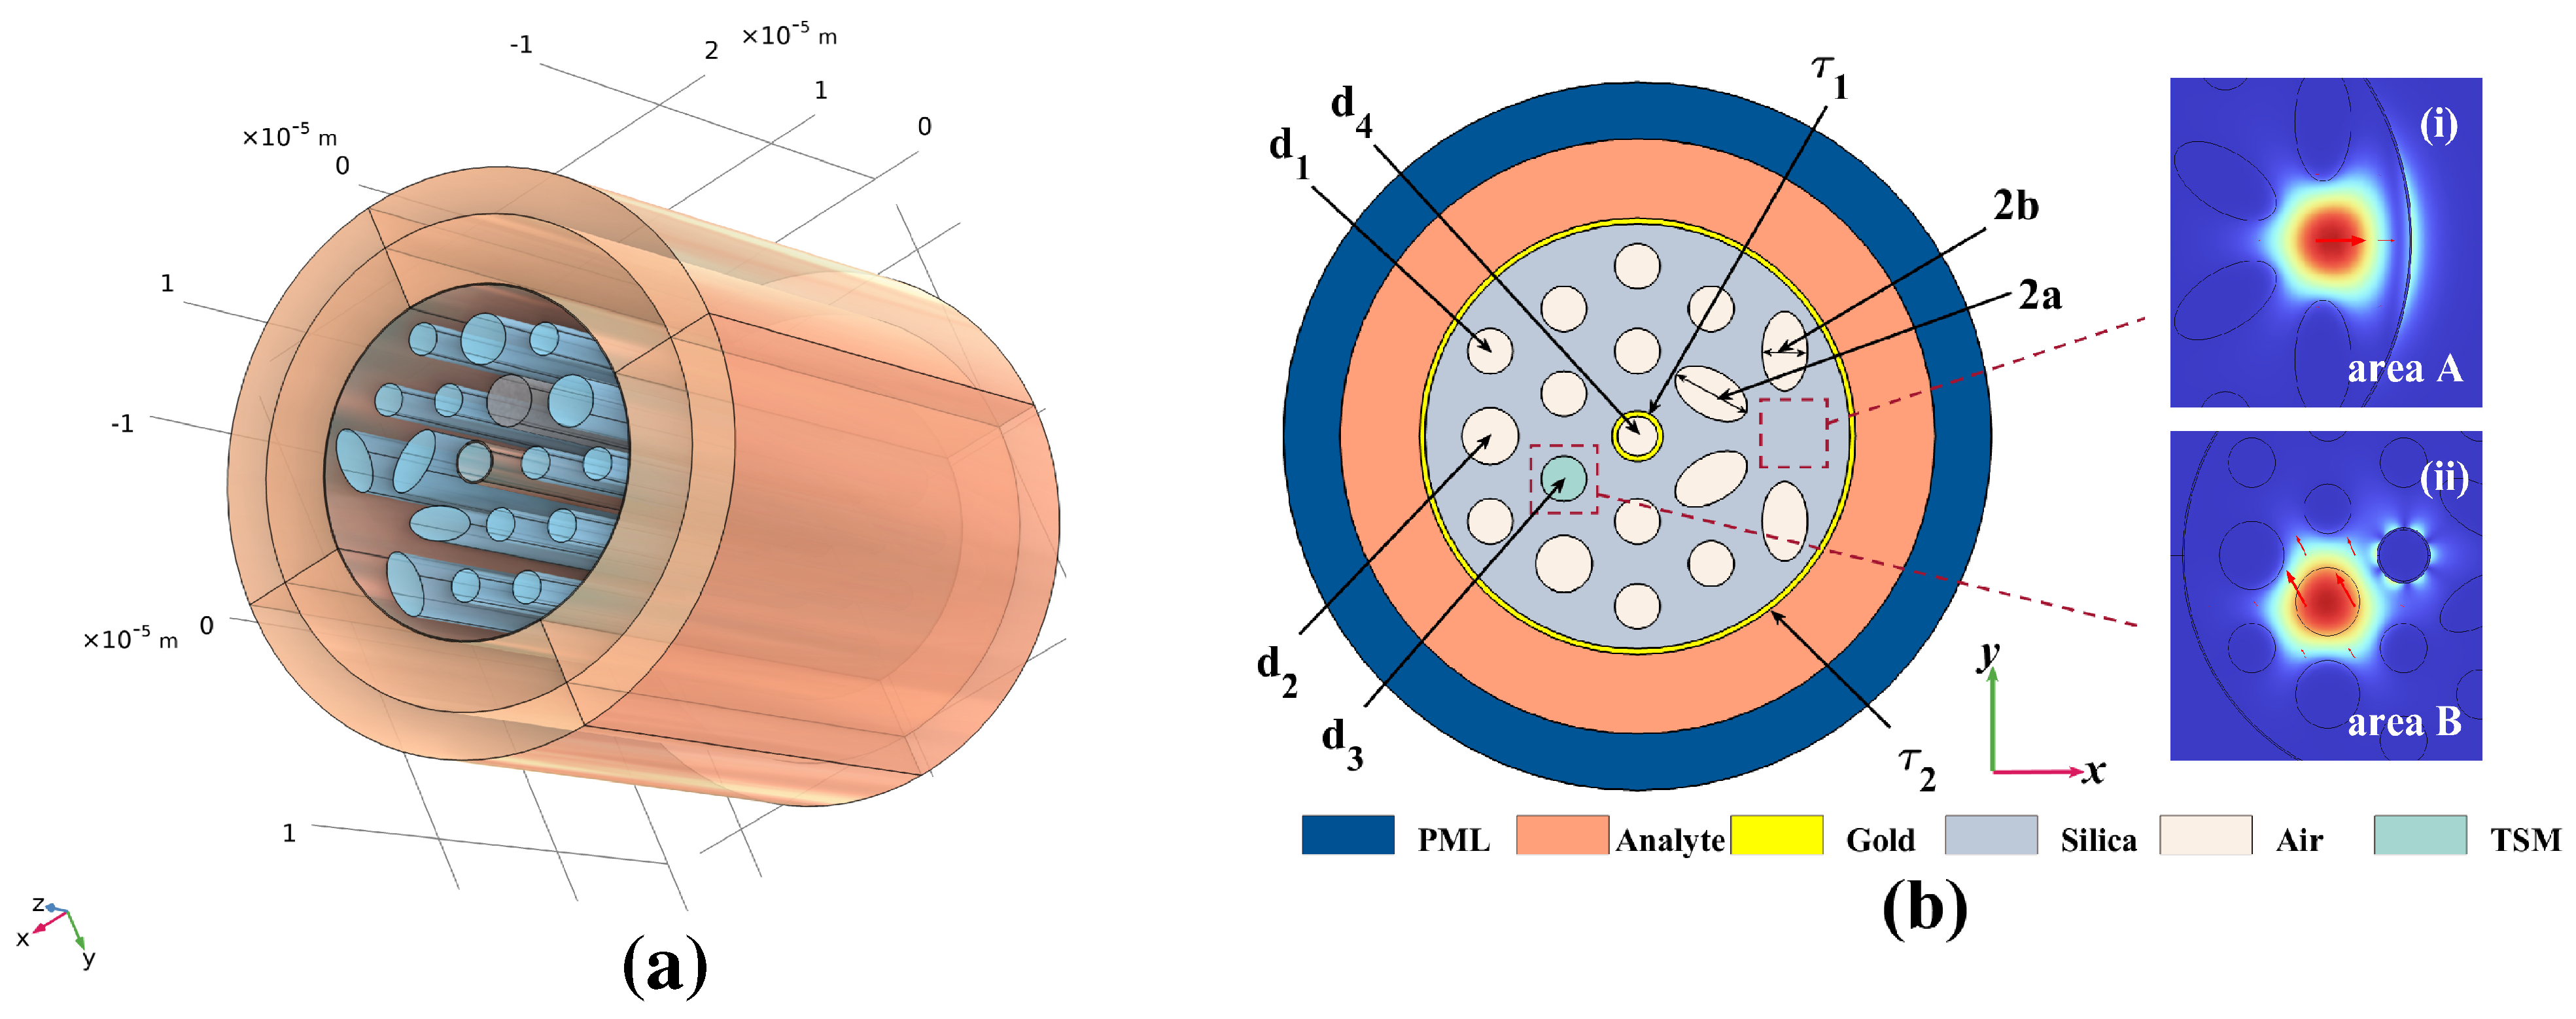
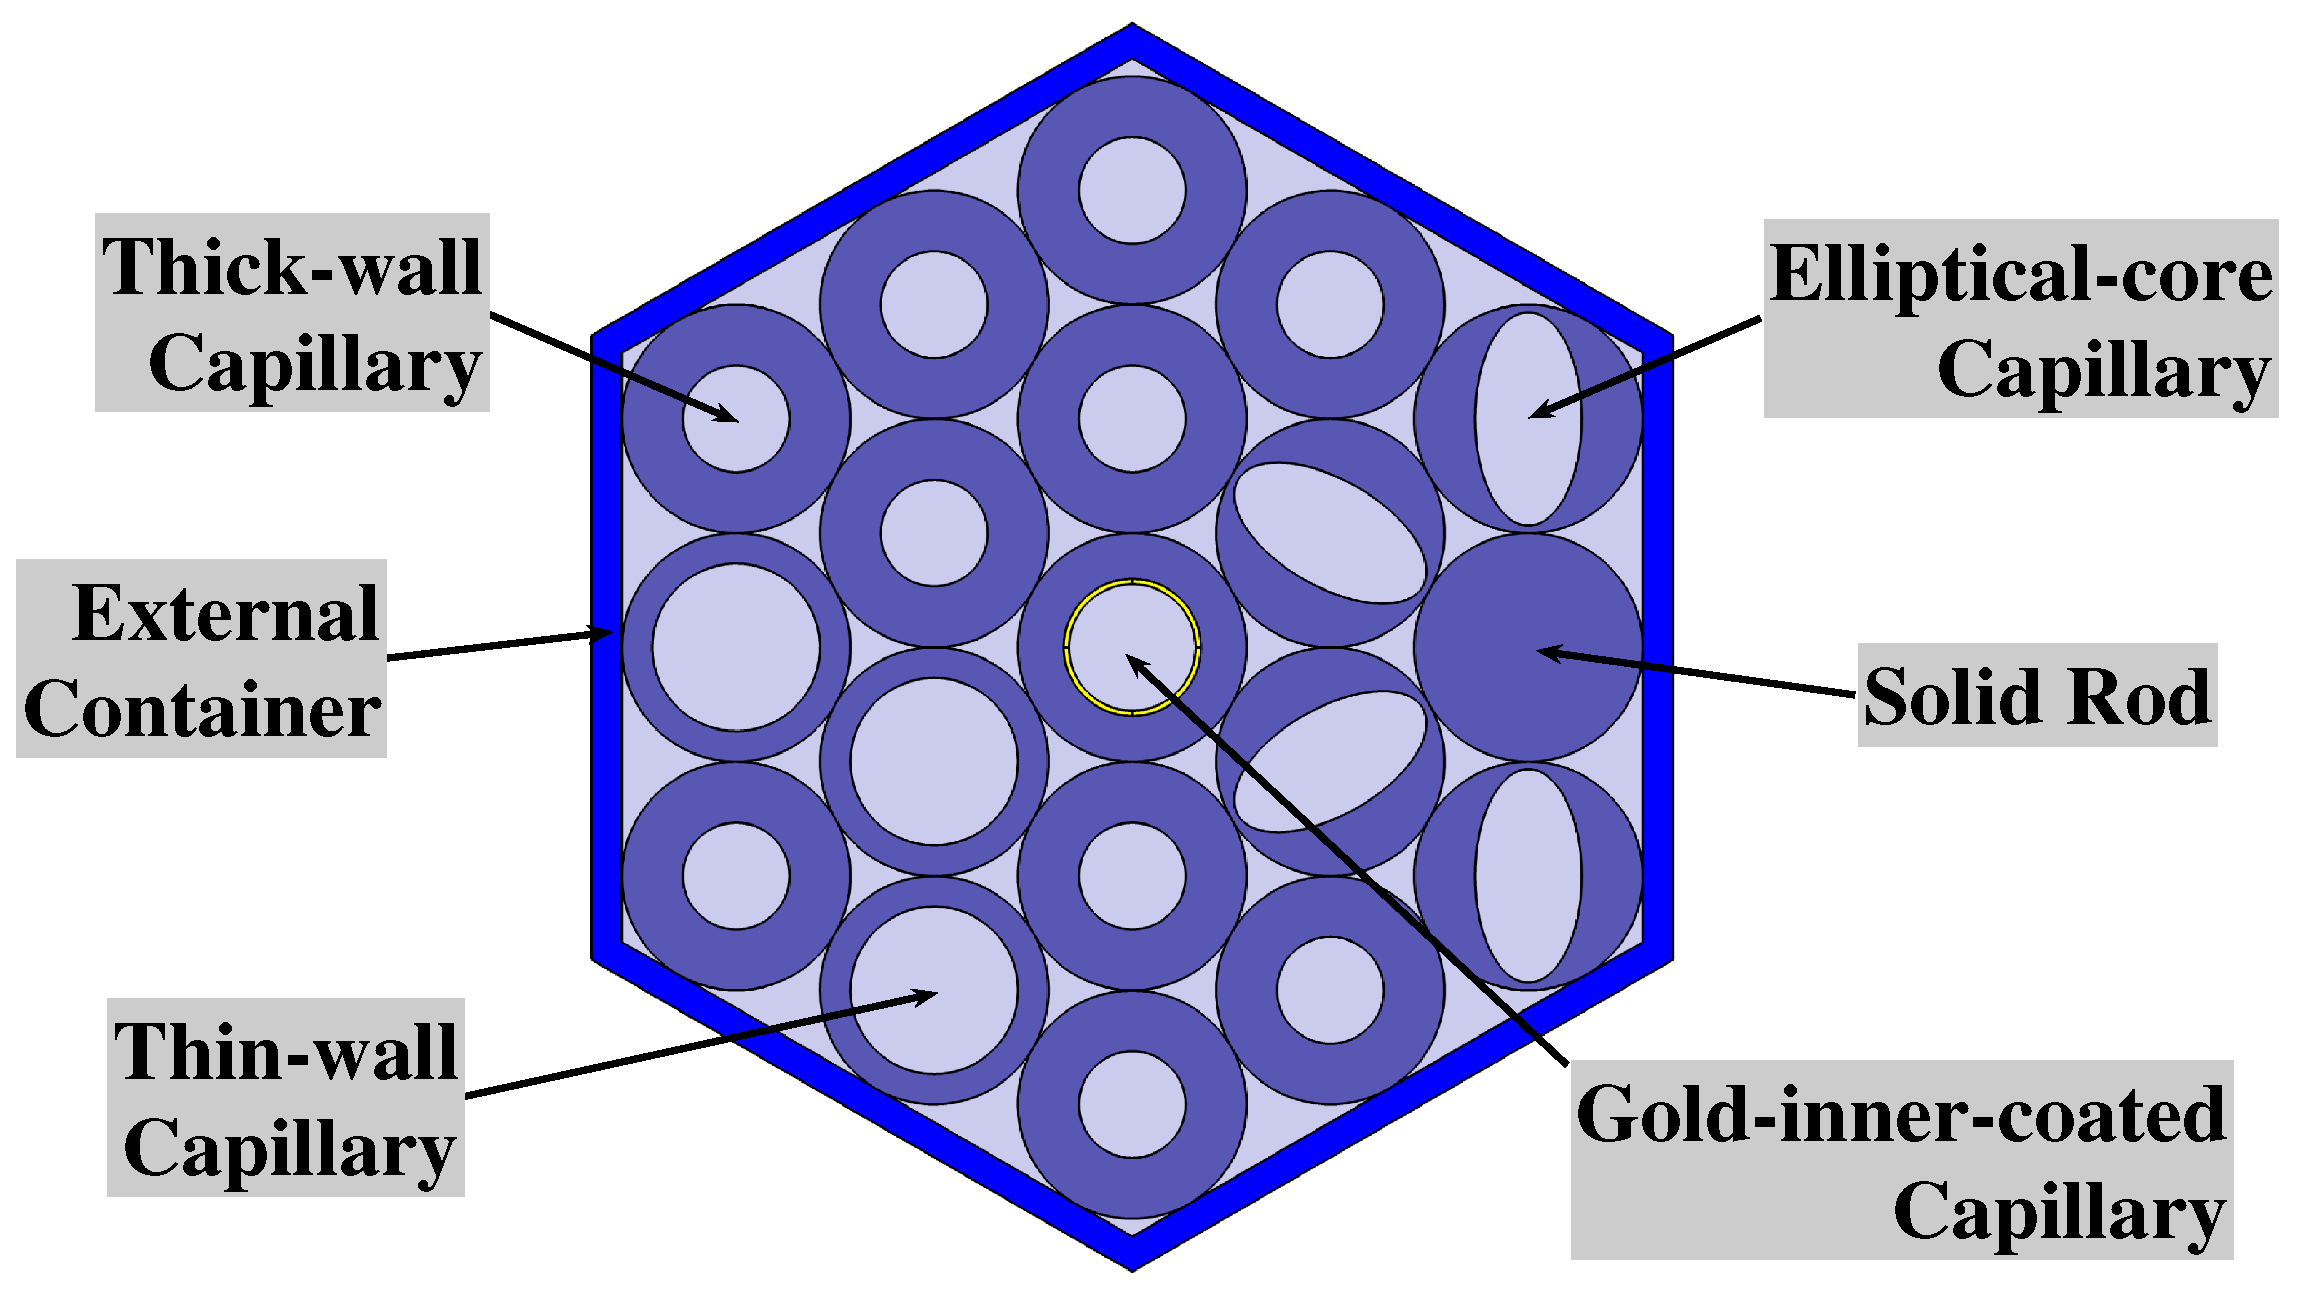
2. Design and Operating Principle of the SPR-Based PCF Sensor

Figure 1a,b, respectively, show a 3D view and the 2D schematic of the proposed biosensor structure. Insert sub figures (i) and (ii) illustrate the mode field distributions of area A and area B, which are, respectively, applied for RI and temperature measurement. The proposed biosensor structure contains an area consisting of an air holes array with two cladding layers. The air hole array has an arrangement of a triangle lattice with a spacing denoted by Λ = 3 μ m. Some air holes are replaced with elliptical holes to strengthen the SPR effect in area A. To ensure that the SPR effect is successfully excited, two thin Au coatings are attached to the internal face of the central air hole and outside of the fiber area. These two coatings are, respectively, described as the inner and outer gold films with a thickness denoted by τ 1 and τ 2 . On the intersection of the right side of the fiber structure and outer gold film, a capillary which forms the air hole is replaced by a solid rod in order to form core area A; while the four adjacent air holes are replaced with elliptical holes pointing to core area A to strengthen the SPR effect, the major and minor semi-axis of those elliptical holes are presented as a and b, respectively. In fabrication, deviation exists when controlling the elliptical air holes to head for core area A, which may influence the sensing performance of the biosensor. The analysis of deviation will be discussed in the next section. Meanwhile, to make the SPR effect of core A fully excited and further strengthen the mode distribution of the evanescent field, the core A area is designed to be close to the outer gold film with an appropriate value. Exceeding a 150 degree angle from the straight forward x-axis, the inner-layer air hole with the diameter denoted by d 3 is filled with TSM in order to construct area B. Adjacent to the core B area, two air holes located at a distance of 3 Λ from the central air hole are increased to a diameter denoted by d 2 to improve the sensing performance. d 4 and d 1 , respectively, stand for the diameter of the central air hole along with other air holes. A layer consisting of liquid analyte with a thickness of 3 μ m is attached to the external part of proposed fiber. This work applies numerical simulations with the help of the finite element method to solve eigenmode problems. Moreover, a perfectly matched layer (PML) is placed outside of the analyte area to truncate the region beyond the biosensor structure and limit the computational area by absorbing all the radiation energy [22,23].
Figure 2 demonstrates the 2D schematic of the proposed biosensor structure in the fabrication process. In the fabrication process, we utilize an external container for gathering different types of capillaries and rods. In this correspondence, thin-wall, thick-wall, elliptical-core, and gold-inner-coated capillaries are applied to form, respectively, the small hole, big hole, elliptical core, and central hole. A solid rod is used for forming area A. After bringing these capillaries and rods together, liquid silica infiltrates the space among these structures and the biosensor structure is thereby made.
Fused silica is applied as the material of the fiber for its superior performance and properties with a material RI, which can be calculated applying the following three-order Sellmeier Equation (1) [24,25], where λ is the free-space wavelength:
n S i l i c a 2 = 1 + 0.6961663 λ 2 λ 2 0 . 0684043 2 + 0.4079426 λ 2 λ 2 0 . 1162414 2 + 0.897479 λ 2 λ 2 9 . 896161 2
Gold, just like other metal materials, is applied as the coating for exciting the SPR effect. The dispersion of the inner and outer gold film can be obtained by applying a Lorentz–Drude model, which is represented as the following Equation [26,27]:
ε m = ε ω D 2 ω ( ω j γ D ) Δ ε · Ω L 2 ( ω 2 Ω L 2 ) j Γ L ω
where ε = 5.9673 denotes the dielectric constant with ultra-high frequency, and ω = 2 π c / λ stands for the angular frequency of the light propagating through the PCF fiber. ω D and γ D , respectively, represent the plasma and damping frequency. Δ ε = 1.09 is the weight factor. Ω L , along with Γ L , are the frequency and spectral width of the Lorentz oscillator, respectively, where Ω L / 2 π = 650.07 THz and Γ L / 2 π = 104.86 THz in angular frequency.
TSM is a medium similar to magnetic fluid, the RI of which varies with temperature. The RI of TSM can be calculated through the formula below [28,29]:
n T S M = 1.454 α ( T 25 )
where α and T denote the thermal optical coefficient and the temperature in degrees Celsius, respectively. In this paper, α is chosen as 3.9 × 10 4 / °C.
It is generally acknowledged that the SPR-based PCFs work owing to a mechanism of interactions between electrons on the surface of plasmonic material along with the evanescent field [30,31]. The confinement loss ( C L ) is a good metric which represents the loss in propagation, which can be calculated by Equation (2) [32], where n e f f is the effective RI of the core mode. The unit of C L value is dB/cm.
C L = 8.686 × 2 π λ × I m ( n e f f ) × 10 4
In this article, we select x-polarization for sensing. With the implementation of both inner and outer gold coatings for exciting the SPR effect with variate physical values, the proposed biosensor structure is able to measure the RI and temperature with two disjoint coverage of wavelength.
Figure 3a illustrates the CL curve of the x polarized mode of area A and a real part of the effective RI of core mode and zero-order SPP mode when analyte RI is 1.38. Furthermore, Figure 3b–d show the mode field distributions of the proposed biosensor structure simulated with wavelengths, respectively, chosen as 670, 754, and 890 nm. From Figure 3a, it can be seen that the x polarized mode of area A along with the zero-order SPP mode are coupled together on the area of the outer gold coating with a wavelength coverage from 0.7 to 0.8 μ m. The value of the CL curve is small in those wavelength regions wherein resonance is almost not excited. A reasonable explanation for this phenomenon is that a majority of the energy is limited in the core region of area A when the wavelength is in those non-resonant wavelength regions, which are illustrated in Figure 3b,d. When the SPR effect is fully excited with a resonant wavelength λ S P R , x polarized mode in area A, it is coupled along with a zero-order SPP mode and the energy distributions alter from core area A to the surface outer gold coating, which is demonstrated in Figure 3c. At this moment, the phase-matching condition is satisfied, as shown in the intersection of the blue solid curve and the blue dotted curve in Figure 3a. Meanwhile, the CL value of the x polarized mode of area A reaches a summit.
Figure 4a shows the CL curve of the x polarized mode of area B and a real part of the effective RI of the core mode and second-order SPP mode when the temperature is 40 °C. Furthermore, Figure 4b–d show the mode field distributions of the proposed biosensor structure simulated with wavelengths, respectively, chosen as 1120, 1250, and 1470 nm. From Figure 4a, it can be seen that the x polarized mode of area B along with the second-order SPP mode are coupled together on the area of the inner gold coating with a coverage of wavelengths from 1.2 to 1.3 μ m. The value of the CL curve is small in those wavelength regions wherein resonance is almost not excited. The same reasonable explanation for the CL curve is that a majority of the energy is limited in the core region of area B in those non-resonant wavelength regions, which are demonstrated in Figure 4b,d. When the SPR effect is fully excited with λ S P R , the x polarized mode of area B is coupled with the second-order SPP mode and the mode field distribution is altered from core area B to the inner gold coating, which is illustrated in Figure 4c. At that point, the phase-matching condition is achieved, as shown at the intersection of the blue solid curve and the blue dotted curve in Figure 4a. Moreover, the CL value of the x polarized mode of area B reaches a summit.
Up to now, this work has found that the x polarized mode of area A has a coupling wavelength coverage with a zero-order SPP mode from 0.7 to 0.8 μ m, which is less than 1 μ m. Furthermore, the x polarized mode of area B has a coupling wavelength coverage with a second-order SPP mode from 1.2 to 1.3 μ m, which is more than 1 μ m. This indicates that the CL curve applied for themeasurement of both RI and temperature can be achieved simultaneously with the utilization of a broadband light source. Furthermore, this work makes a comparison between the mode field distributions when the x polarized modes of area A and B, respectively, are coupled with different-order SPP modes on the surface of different gold coating and find no cross-coupling. This result further verifies the feasibility of the proposed biosensor structure in this work.
The variation of analyte RI and temperature do affect the effective RI in the region of the excited SPR effect, which further changes the mode field distributions and the related λ S P R value. Eventually, the CL curve starts to shift and the peak value changes. Seemingly, it is of great significance to find an evaluation scheme to measure the correlation between changing parameters and the affected sensing performance. In this scenario, the correlation is appropriate for measuring the variation in the CL curve along with RI or temperature. Therefore, there are two satisfactory metrics: RI sensitivity S n and temperature sensitivity S T , which are defined as the equations below [33,34], where Δ λ S P R , Δ n a , and Δ T , respectively, represent the value changes in the resonant wavelength, RI, and temperature. The unit of the S n value is nm/ RIU and the unit of the S T value is nm/°C.
S n = Δ λ S P R / Δ n a
S T = Δ λ S P R / Δ T
Furthermore, we use the amplitude sensitivity S a to measure the correlation between the changing parameters and the affected intensity of the sensing curve. The calculating formula is illustrated in Equation (7) [35].
S a = ( Δ C L / Δ n a ) / C L i n i t i a l
where Δ n a is the RI variation. Δ C L represents a change in confinement loss and C L i n i t i a l denotes the initial confinement loss. The unit of the S a value is RIU 1 .

3. Simulation Results and Discussion

In this correspondence, with a structure of four elliptical air holes pointing to core A, it is believed that the parameters of the structure inside and outside of the elliptical air hole region almost have an effect on the related regions. Furthermore, the inner and outer gold film have an effect on core B and core A, respectively. Hence, we analyze the sensing performance of core A, which varies with τ 2 , a , b and the sensing performance of core B, which varies with d 3 , d 4 , τ 1 , d 1 , d 2 separately.

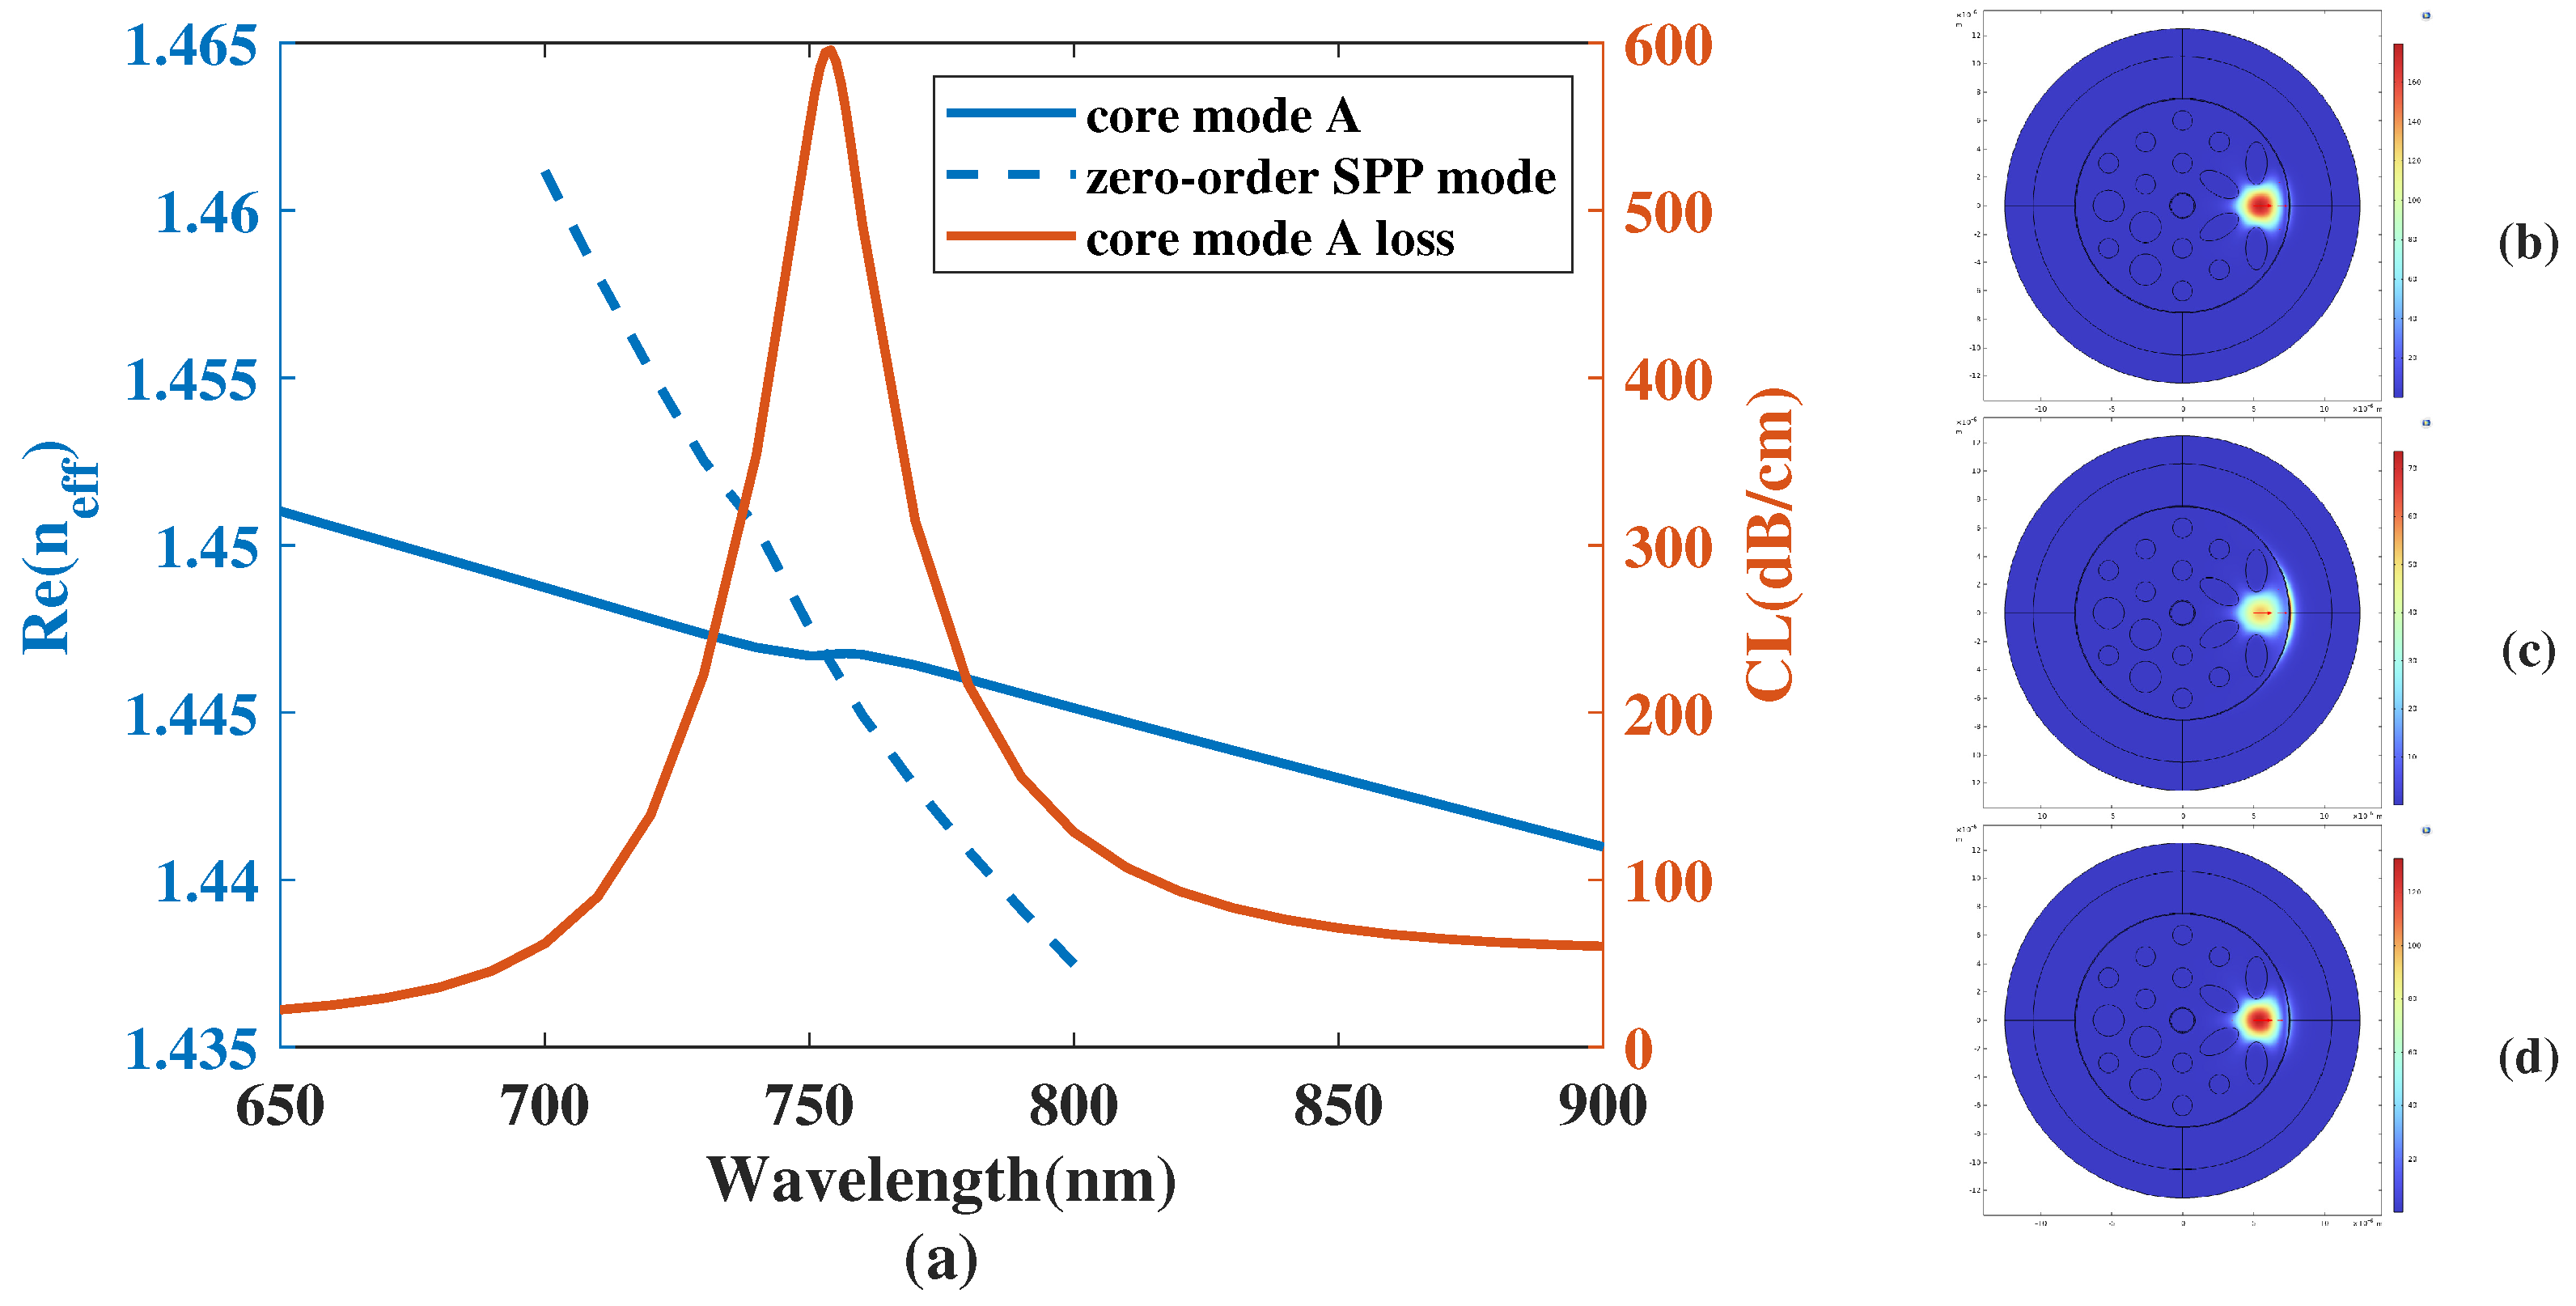
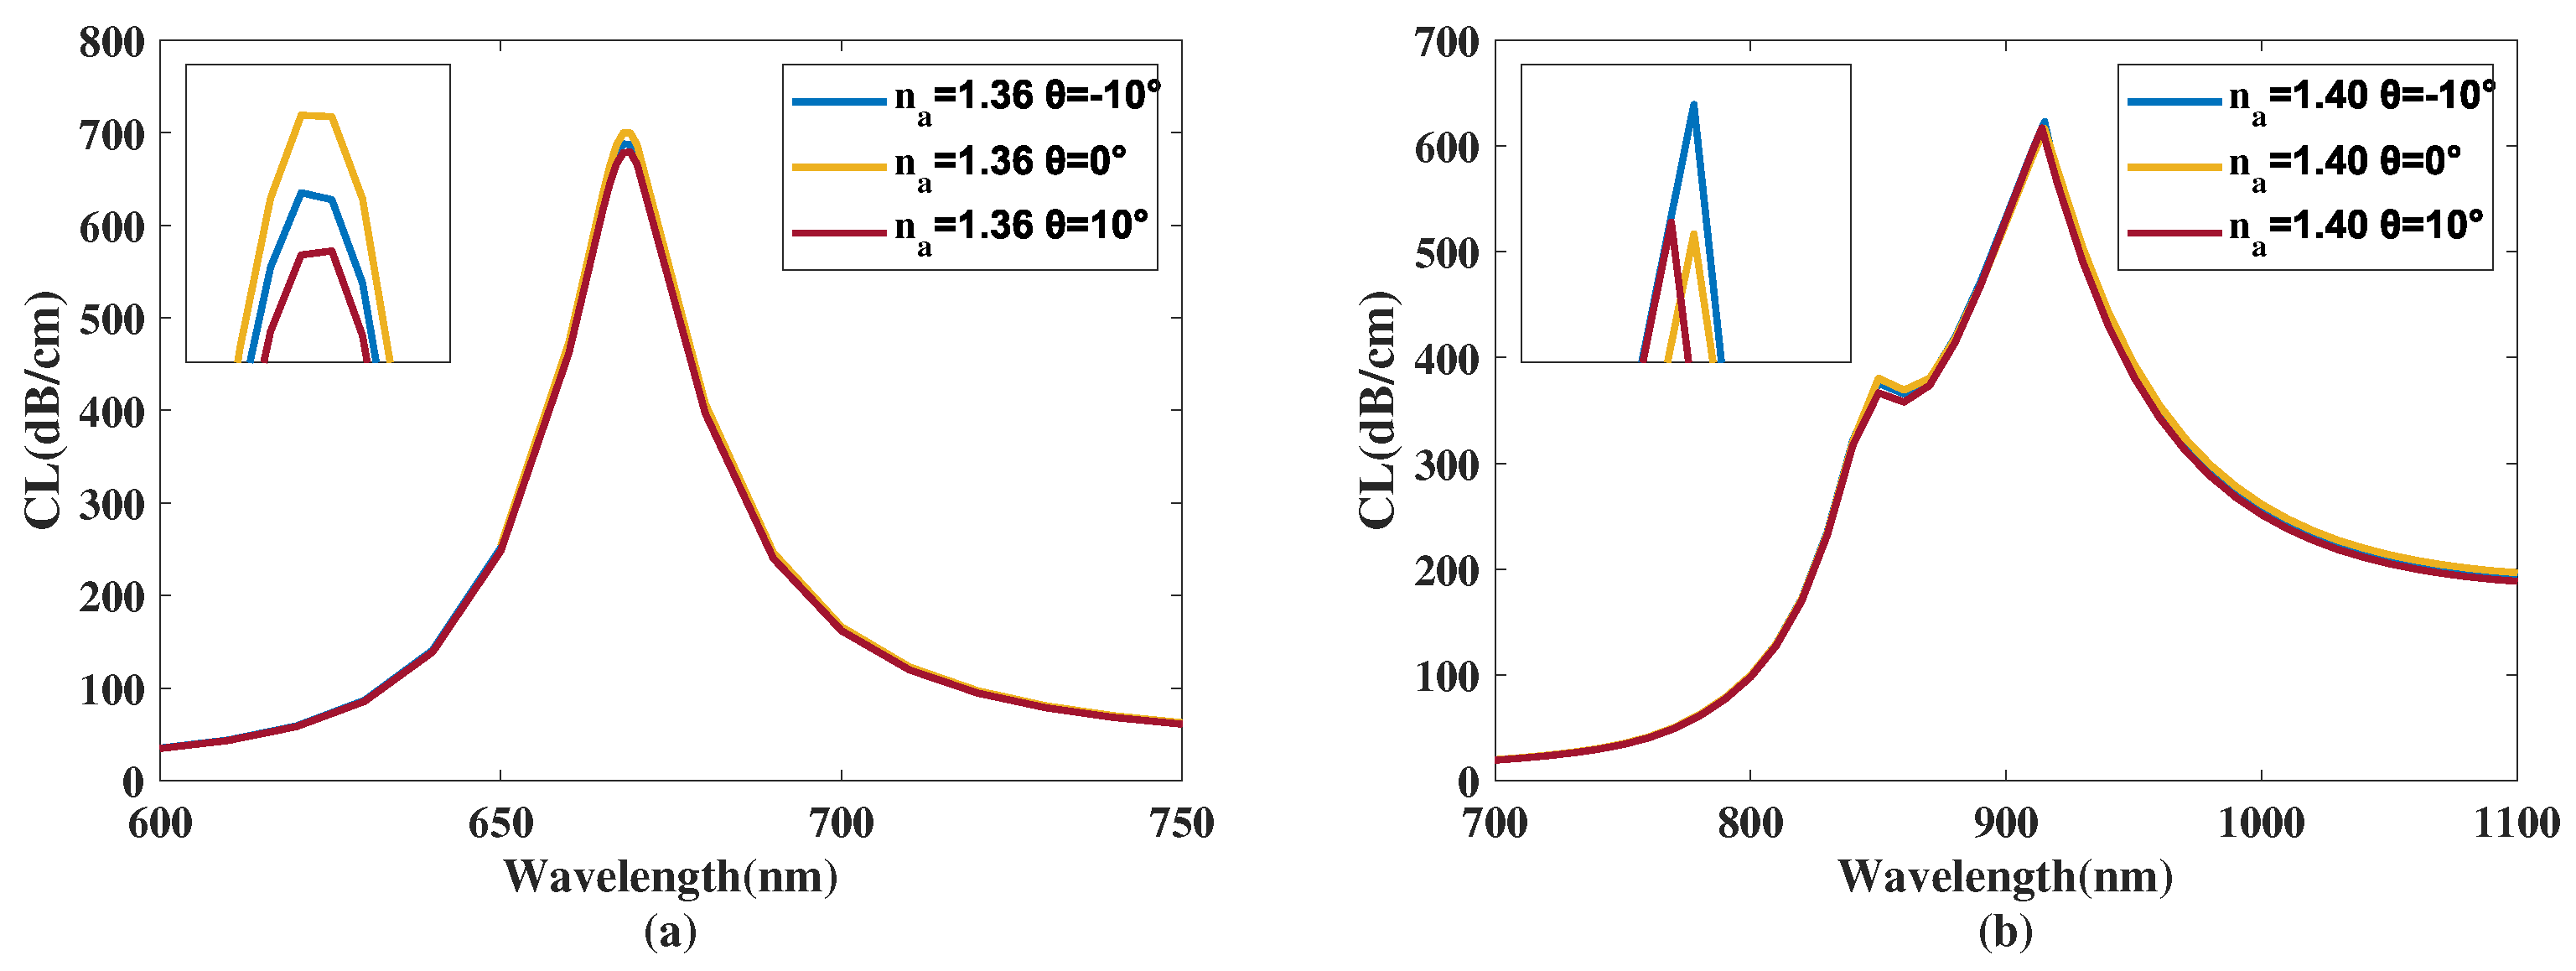
3.1. Effects on Core A

In order to obtain a overall insight into the investigation of the effect of the structure parameters on core A, we set the initial structure parameters as follows: a = 1.4 μ m, b = 0.8 μ m, τ 2 = 50 nm.
Figure 5 shows the CL curve of the x polarized mode of area A with τ 2 respectively chosen as 50, 60, and 70 nm, and the analyte RI is 1.36, 1.39, and 1.40. From Figure 5, it can be seen that, when the analyte RI is set as 1.36 and 1.39 and τ 2 rises from 50 to 70 nm, the λ S P R value of the CL curve has a slight red shift and the peak value of the CL curve has a significant fall. When the analyte RI is set as 1.40, the λ S P R value of the CL curve is almost still and the peak value of the CL curve firstly increases and then decreases. Furthermore, it is demonstrated from Figure 5 that, when the analyte RI is chosen as 1.40, the CL spectra with τ 2 chosen as 50 nm is not smooth, with a distorted peak at about 850 nm. With the increase in τ 2 , the distorted peak is gradually diminished. Furthermore, when making a comparison among those CL peak values and related envelopes, it is apparent that the distribution of the CL peak value results in red-shift visibly with τ 2 increasing from 50 nm to 70 nm. A reasonable explanation for this is considered, according to which when τ 2 is 50 nm, the SPR effect cannot be fully excited, which causes the occurrence of the distorted peak with the analyte RI set as 1.40. When τ 2 increases, the SPR effect is gradually enhanced, which causes the red-shift of the envelope of the CL spectra. In accordance with Equation (5), the average S n value achieves 6087.5, 6100, and 6050 nm/RIU with τ 2 chosen as 50, 60, and 70 nm, respectively, and the maximum RI sensitivity is always 10,700 nm/RIU. The calculation results demonstrate that the average S n value of the proposed structure firstly increases and then decreases, and reaches a summit when τ 2 is about 60 nm. Furthermore, with a variation of τ 2 from 60 to 70 nm, a new peak with an analyte RI of 1.41 appears, which can widen the coverage of the wavelength and further increase the average S n value of the proposed biosensor.
Figure 6 illustrates the CL curve of the x polarized mode of area A with a respectively set as 1.4, 1.5, and 1.6 μ m, and analyte RI is set as 1.36, 1.39, and 1.40.
From Figure 6, when the analyte RI is set as 1.36 and a rises from 1.4 to 1.6 μ m, the λ S P R value of the CL curve with the analyte RI set as 1.36 is almost still and the peak value of the CL curve has a visible increase. The λ S P R value of the CL curve with the analyte RI set as 1.39 has a slight red shift and the peak value of the CL curve almost remains the same. When the analyte RI is 1.40, it is apparent that the distorted peak is significantly enhanced with the increase in a from 1.4 to 1.6 μ m. Moreover, the λ S P R value of the CL spectra with the analyte set as RI 1.40 has a red shift and the peak value of the CL curve rises. Furthermore, when making a comparison among those CL peak values and the related envelopes despite the distorted peak, it is apparent that the distribution of the CL peak value happens to visibly blue-shift and that the wavelength region is widened with a increases from 1.4 μ m to 1.6 μ m. A reasonable explanation for this phenomenon is that, when a increases, the core A area is compressed, which improves the confinement of the energy in core A and further strengthens the SPR effect, which changes the distribution and causes the blue shift of the envelope of the CL spectra. However, the elliptical air holes straight above and below core A area cover too little a region with the outer gold film, which leads to the distorted peak being magnified. In accordance with Equation (5), the average S n value achieves 6125, 6550, and 6475 nm/RIU with a, respectively, chosen as as 1.4, 1.5, and 1.6 μ m and the related maximum S n value is 10,800, 12,500 and 11,500 nm/RIU. The calculation results demonstrate that the maximum and average S n value of the proposed structure firstly increases and then decreases when a increases, and reaches a summit when a is about 1.5 μ m. Furthermore, the already existing distorted peak will be greatly enhanced with a increases from 1.5 to 1.6 μ m.
Figure 7 demonstrates the CL curve of the x polarized mode of area A with b respectively chosen as 0.5, 0.6, and 0.7 μ m, and analyte RI is set as 1.36, 1.39, and 1.40.
From Figure 7, with a variation of b from 0.5 to 0.7 μ m, λ S P R value of CL spectra with RI set as 1.36 is almost still and the peak value of CL curve has a slight boost, λ S P R value of CL spectra with RI set as 1.39 is almost still and the CL peak value firstly rises and then diminishes, λ S P R value of CL spectra with RI set as 1.36 has a slight red shift and the peak value of CL curve decreases. Furthermore, when making a comparison among those CL peak values and related envelopes, it is apparent that the distribution of CL peak value is widen with b set from 0.5 μ m to 0.7 μ m. The main reason considered is that when b is deviating from the center of symmetry in negative direction, more regions which can be used for the SPR are gradually revealed on the intersection of core A area along with the external gold coating, which changes condition of SPR effect and alleviates the peak value of CL curve. When b is deviating from the center of symmetry in positive direction, regions between those elliptical air holes are reduced, which changes mode field distributions in area A. In accordance with Equation (5), the average S n value achieves 5925, 6000, 6075 nm/RIU with b respectively set as 0.5, 0.6, 0.7 μ m and the related maximum RI sensitivity is 10,300, 10,600 and 10,900 nm/RIU. The calculation results illustrate the average and maximum S n value of the proposed structure increases with b increases, which further improves the sensing performance.
Another factor which should be taken into consideration is that, in fabrication processing, those four elliptical air holes may exhibit a deviation from pointing right to area A. In order to simplify the scenario into a symmetry case, we use θ 1 to describe the deviation of the two elliptical air holes directly above and below core A, θ 2 for another two elliptical air holes. The positive and negative θ values denote the anticlockwise and clockwise deviation, respectively.
Figure 8a,b shows the CL curve of the x polarized mode of area A with the analyte RI respectively set as 1.36 and 1.40 and with θ 1 being 10 , 0 , 15 , 30 . From Figure 8a,b, with the θ 1 increases clockwise to the maximum deviation 10 , the resonance wavelength of the CL spectra with the analyte RI set as 1.36 almost stays still and the CL peak value has a noticeable increase. The resonance wavelength of the CL spectra with the analyte RI set as 1.40 witnesses a blue shift and the peak value of the CL curve has a slight increase. Furthermore, when making a comparison among those CL peak values and the related envelopes despite the distorted peak, it is apparent that the wavelength region is widened with θ 1 decreases from 0 to 10 . The main reason considered is that the clockwise deviation compresses the region between those two elliptical air holes and the external gold coating, which further excites the SPR effect and strengthens the couple of x polarized mode of area A along with the SPP mode at the external gold coating with the analyte RI set as 1.36. However, the deviation holistically expands the core A region, which changes the coupling condition with the analyte RI set as 1.40. From Figure 8a,b, with the θ 1 increases anticlockwise to the maximum deviation 30 , the λ S P R value of the CL spectra with the analyte RI set as 1.36 is virtually unchanged and the peak value of the CL curve decreases. The λ S P R value of the CL curve with the analyte RI set as 1.40 has a blue shift and the peak value of the CL curve has a slight boost. A reasonable explanation for this is that the anticlockwise deviation causes the expansion of the region between those two elliptical air holes and the external gold coating, which further diminishes the SPR effect and lessens the couple of x polarized modes of area A along with the SPP mode at the external gold coating when the analyte RI has a low value. However, the deviation holistically expands the core A region, which changes the coupling condition with the analyte RI set as 1.40. In accordance with Equation (5), the average S n value achieves 6125, 6162.5, 6050, and 5812.5 nm/RIU when θ 1 is, respectively, set as 10 , 0 , 15 , and 30 . The calculation results illustrate that the S n of the proposed structure increases with the elliptical air holes pointing directly to core A. Furthermore, the small deviation of θ 1 has a negligible effect on the RI sensitivity of the proposed structure, which tempers the harshness of fabrication.
Figure 9a,b illustrate the CL curve of the x polarized mode of area A when the analyte RI is respectively set as 1.36 and 1.40 and the θ 2 is chosen as 10 , 0 , and 10 . From Figure 9a,b it can be seen that, with the θ 2 increases clockwise to the maximum deviation 10 , the resonance wavelength of the CL spectra with the analyte RI set as 1.36 is almost still and the peak value of the CL curve decreases. The λ S P R value of the CL curve with the analyte RI set as 1.40 is almost still and the peak value of the CL curve has a clear rise. A reasonable explanation for the phenomenon is that the clockwise deviation expands the region of area A, which further weakens the SPR effect with an analyte RI set as 1.36. However, the deviation holistically enhances the coupling with the analyte RI set as 1.40. From Figure 9a,b, it can be seen that when θ 2 increases anticlockwise to the maximum deviation 10 , the resonance wavelength of the CL spectra with the analyte RI set as 1.36 is virtually unchanged and the peak value of the CL curve alleviates. The λ S P R value of the CL spectra with the analyte RI set as 1.40 starts to blue-shift and the peak value of the CL curve has a slight increase. A reasonable explanation for this phenomenon is that the anticlockwise deviation expands the region of core A, which further diminishes the SPR effect and lessens the couple of x polarized modes of area A along with the SPP mode at the external gold coating with the analyte RI set as 1.36. However, the anticlockwise deviation expands the redundant region between those two elliptical air holes, and hence slightly changes the coupling condition. In accordance with Equation (5), the average S n value achieves 6162.5, 6162.5, and 6137.5 nm/RIU with θ 2 , respectively set as 10 , 0 , and 10 . The calculation results demonstrate that the average S n value of the proposed structure increases with the elliptical air holes pointing directly to core A. Moreover, the minuscule deviation of the θ 2 has a small effect on the RI sensitivity of the proposed structure, which reduces the requirements in the manufacturing process.
For the biosensor structure in this correspondence, the effects of the structural parameters on the sensing performance of the x polarized mode of area A is summarized in Table 1 as follows.

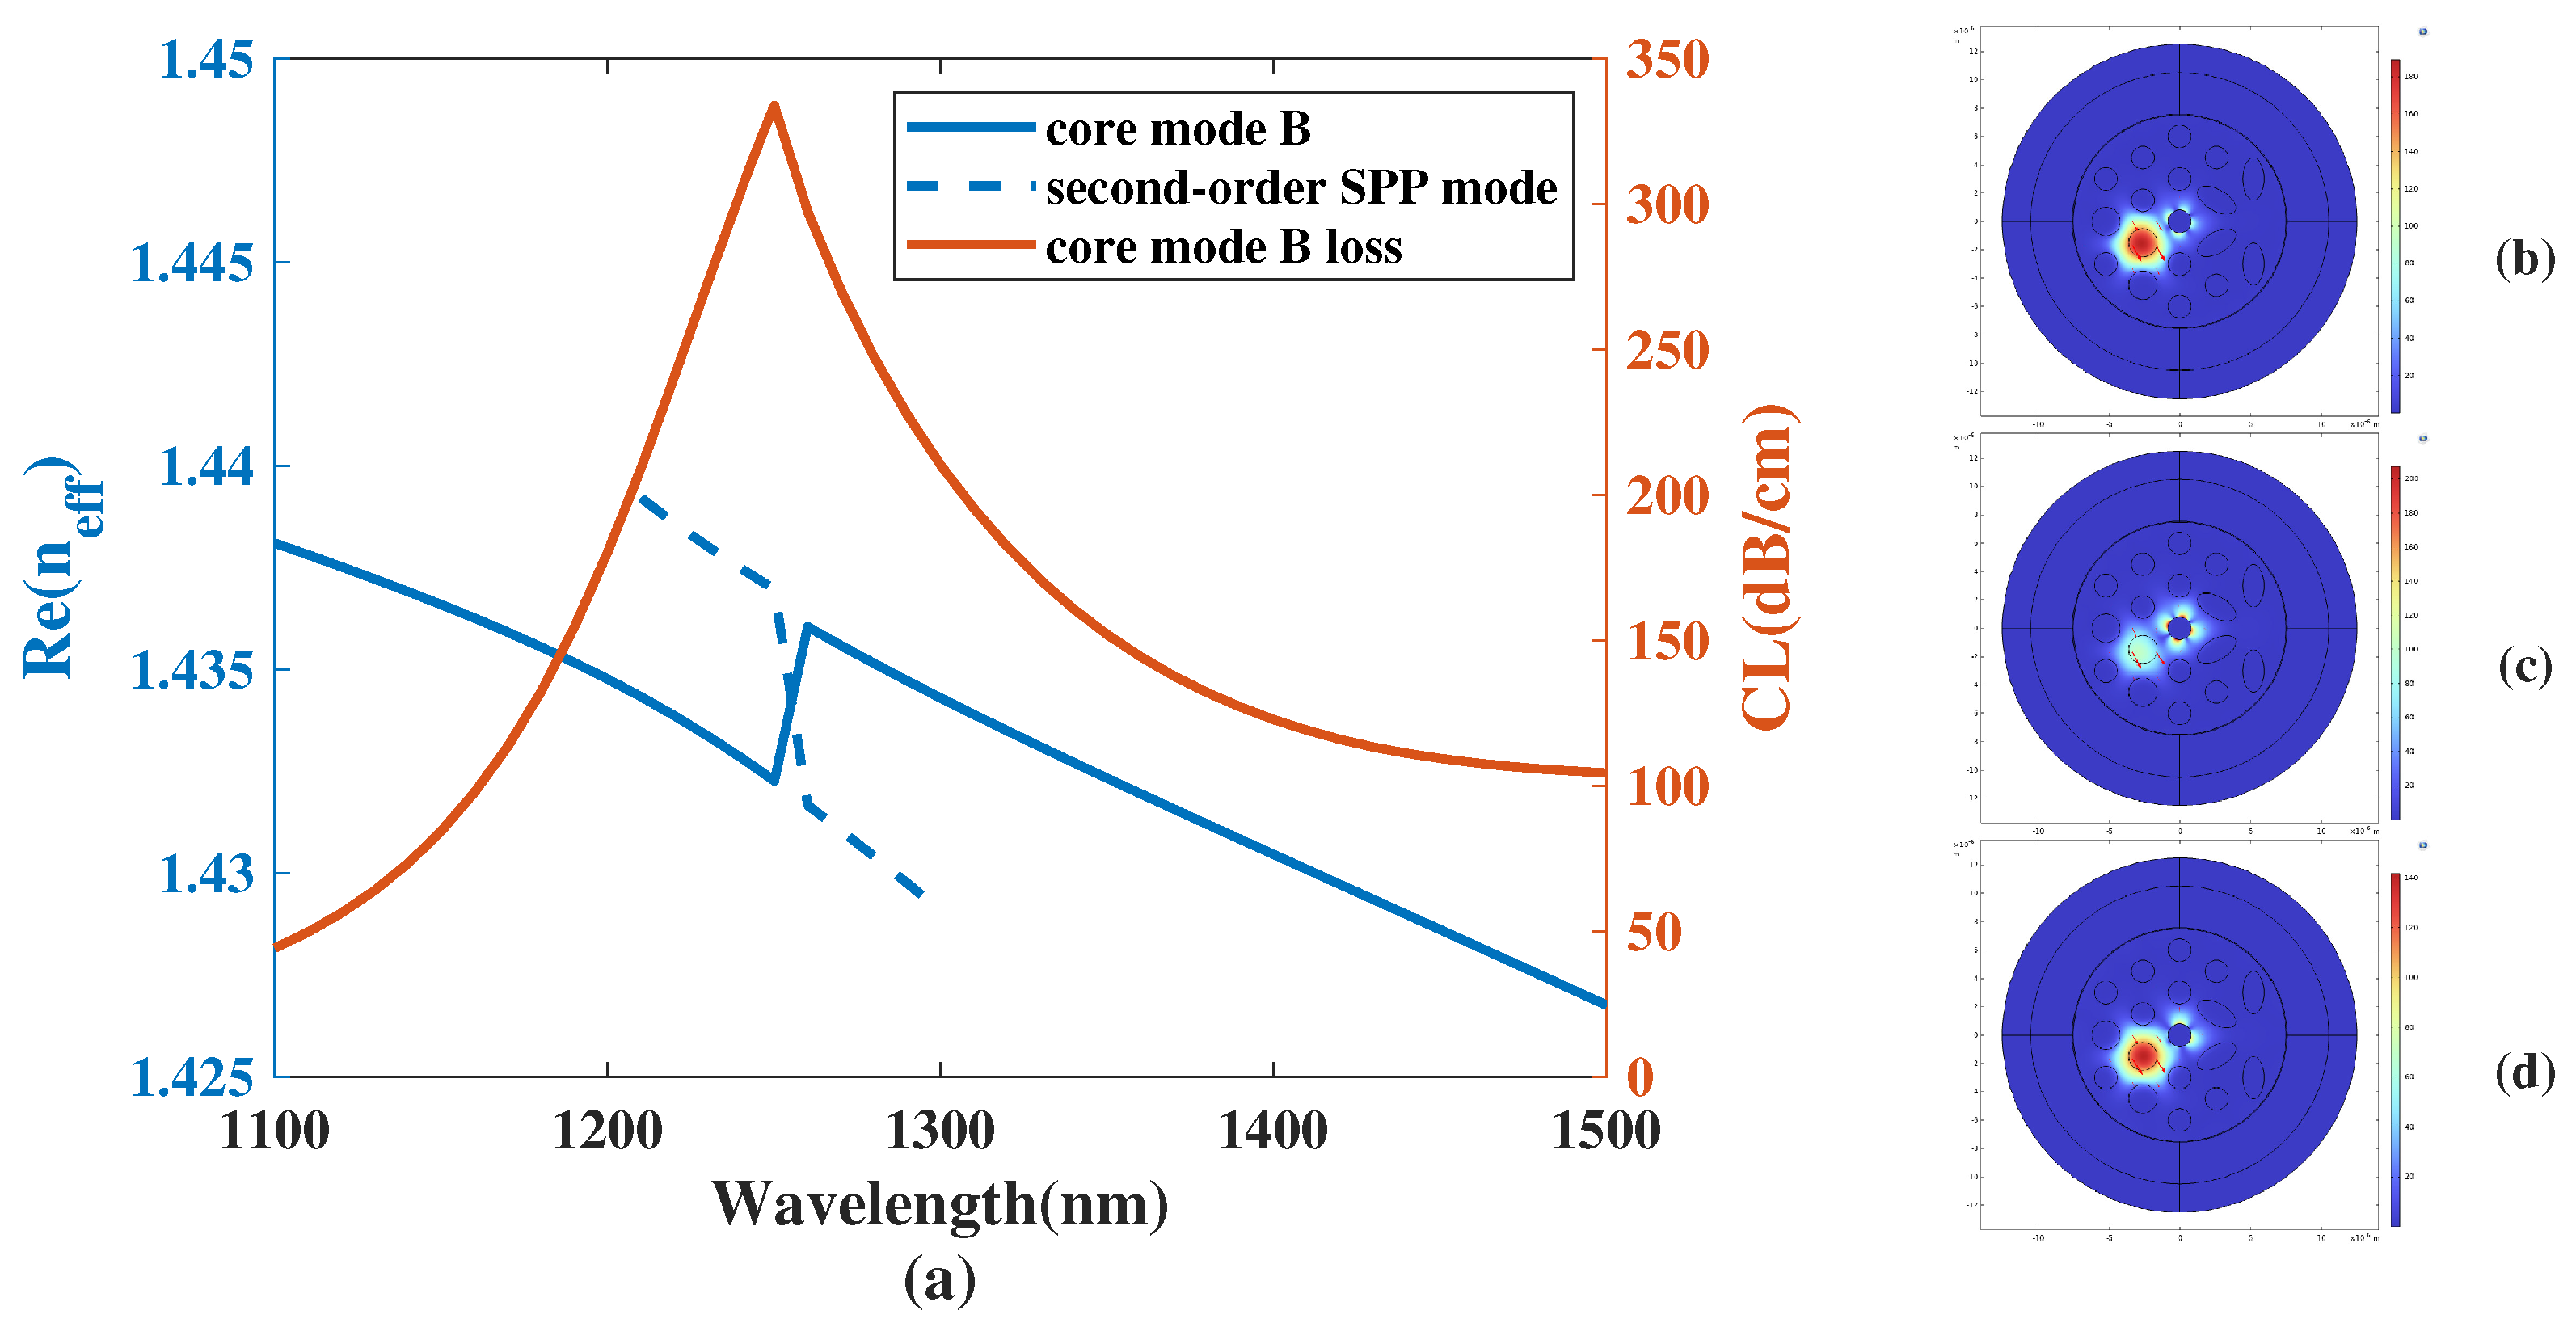
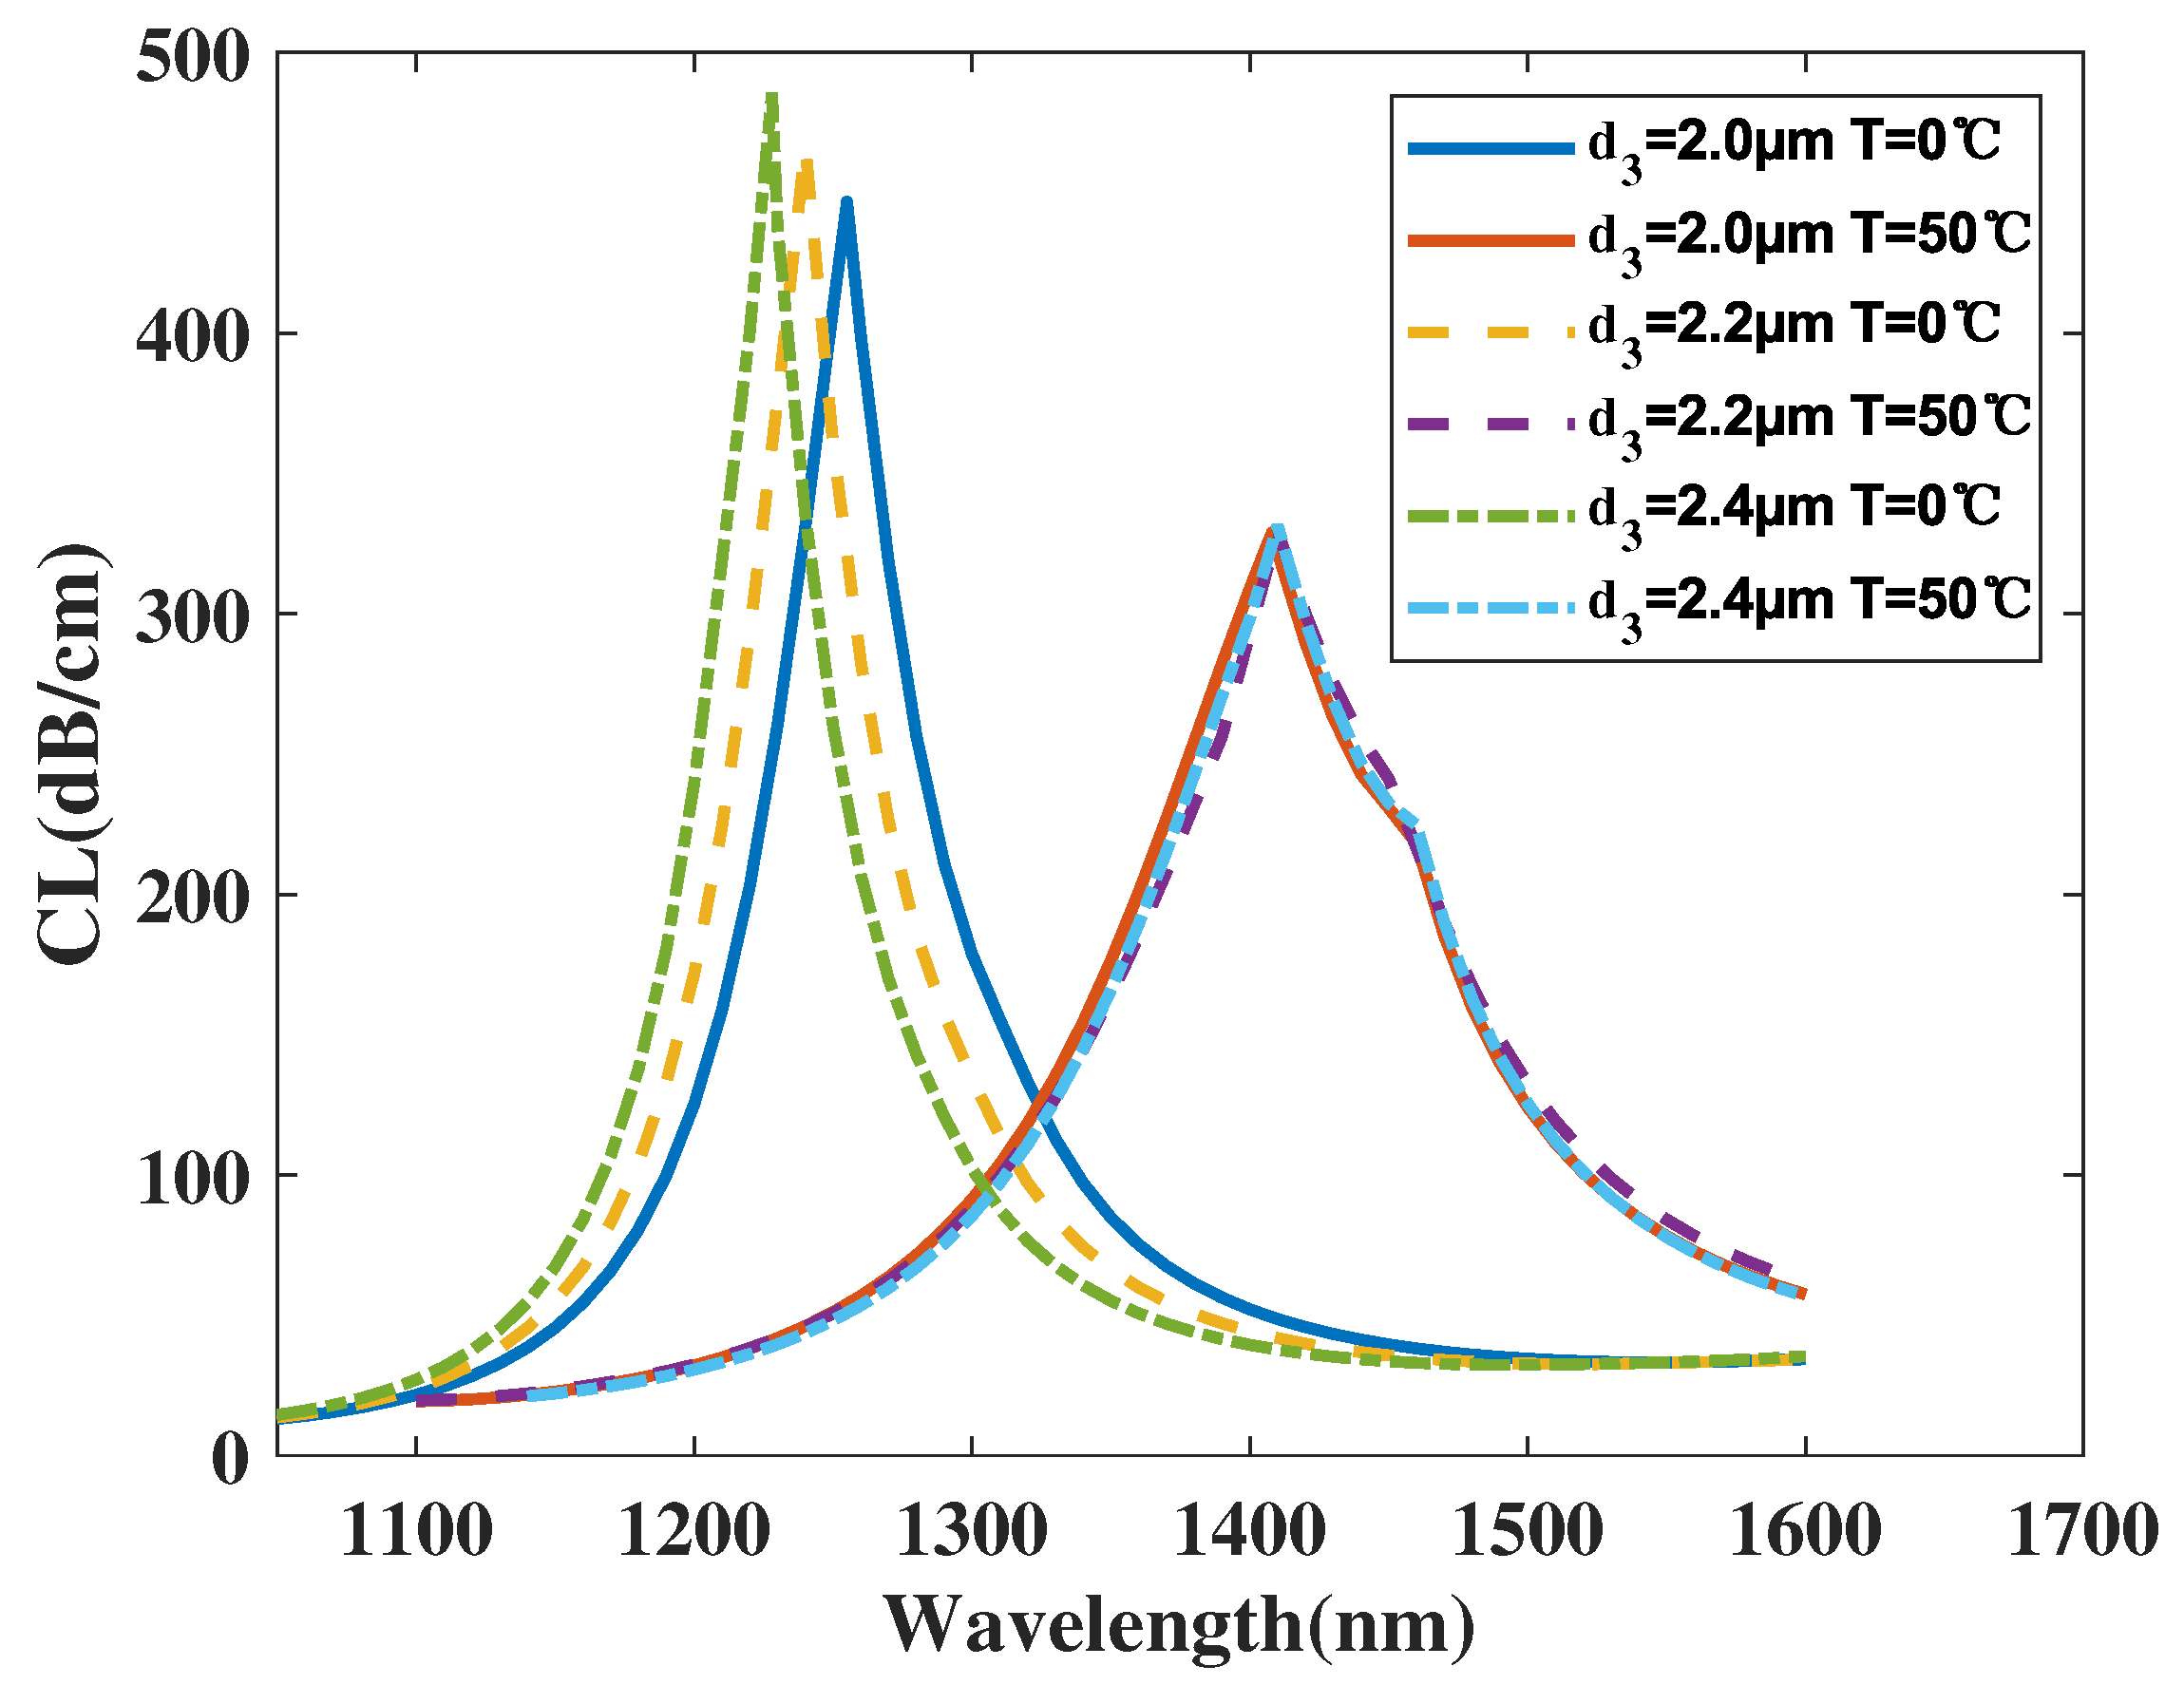
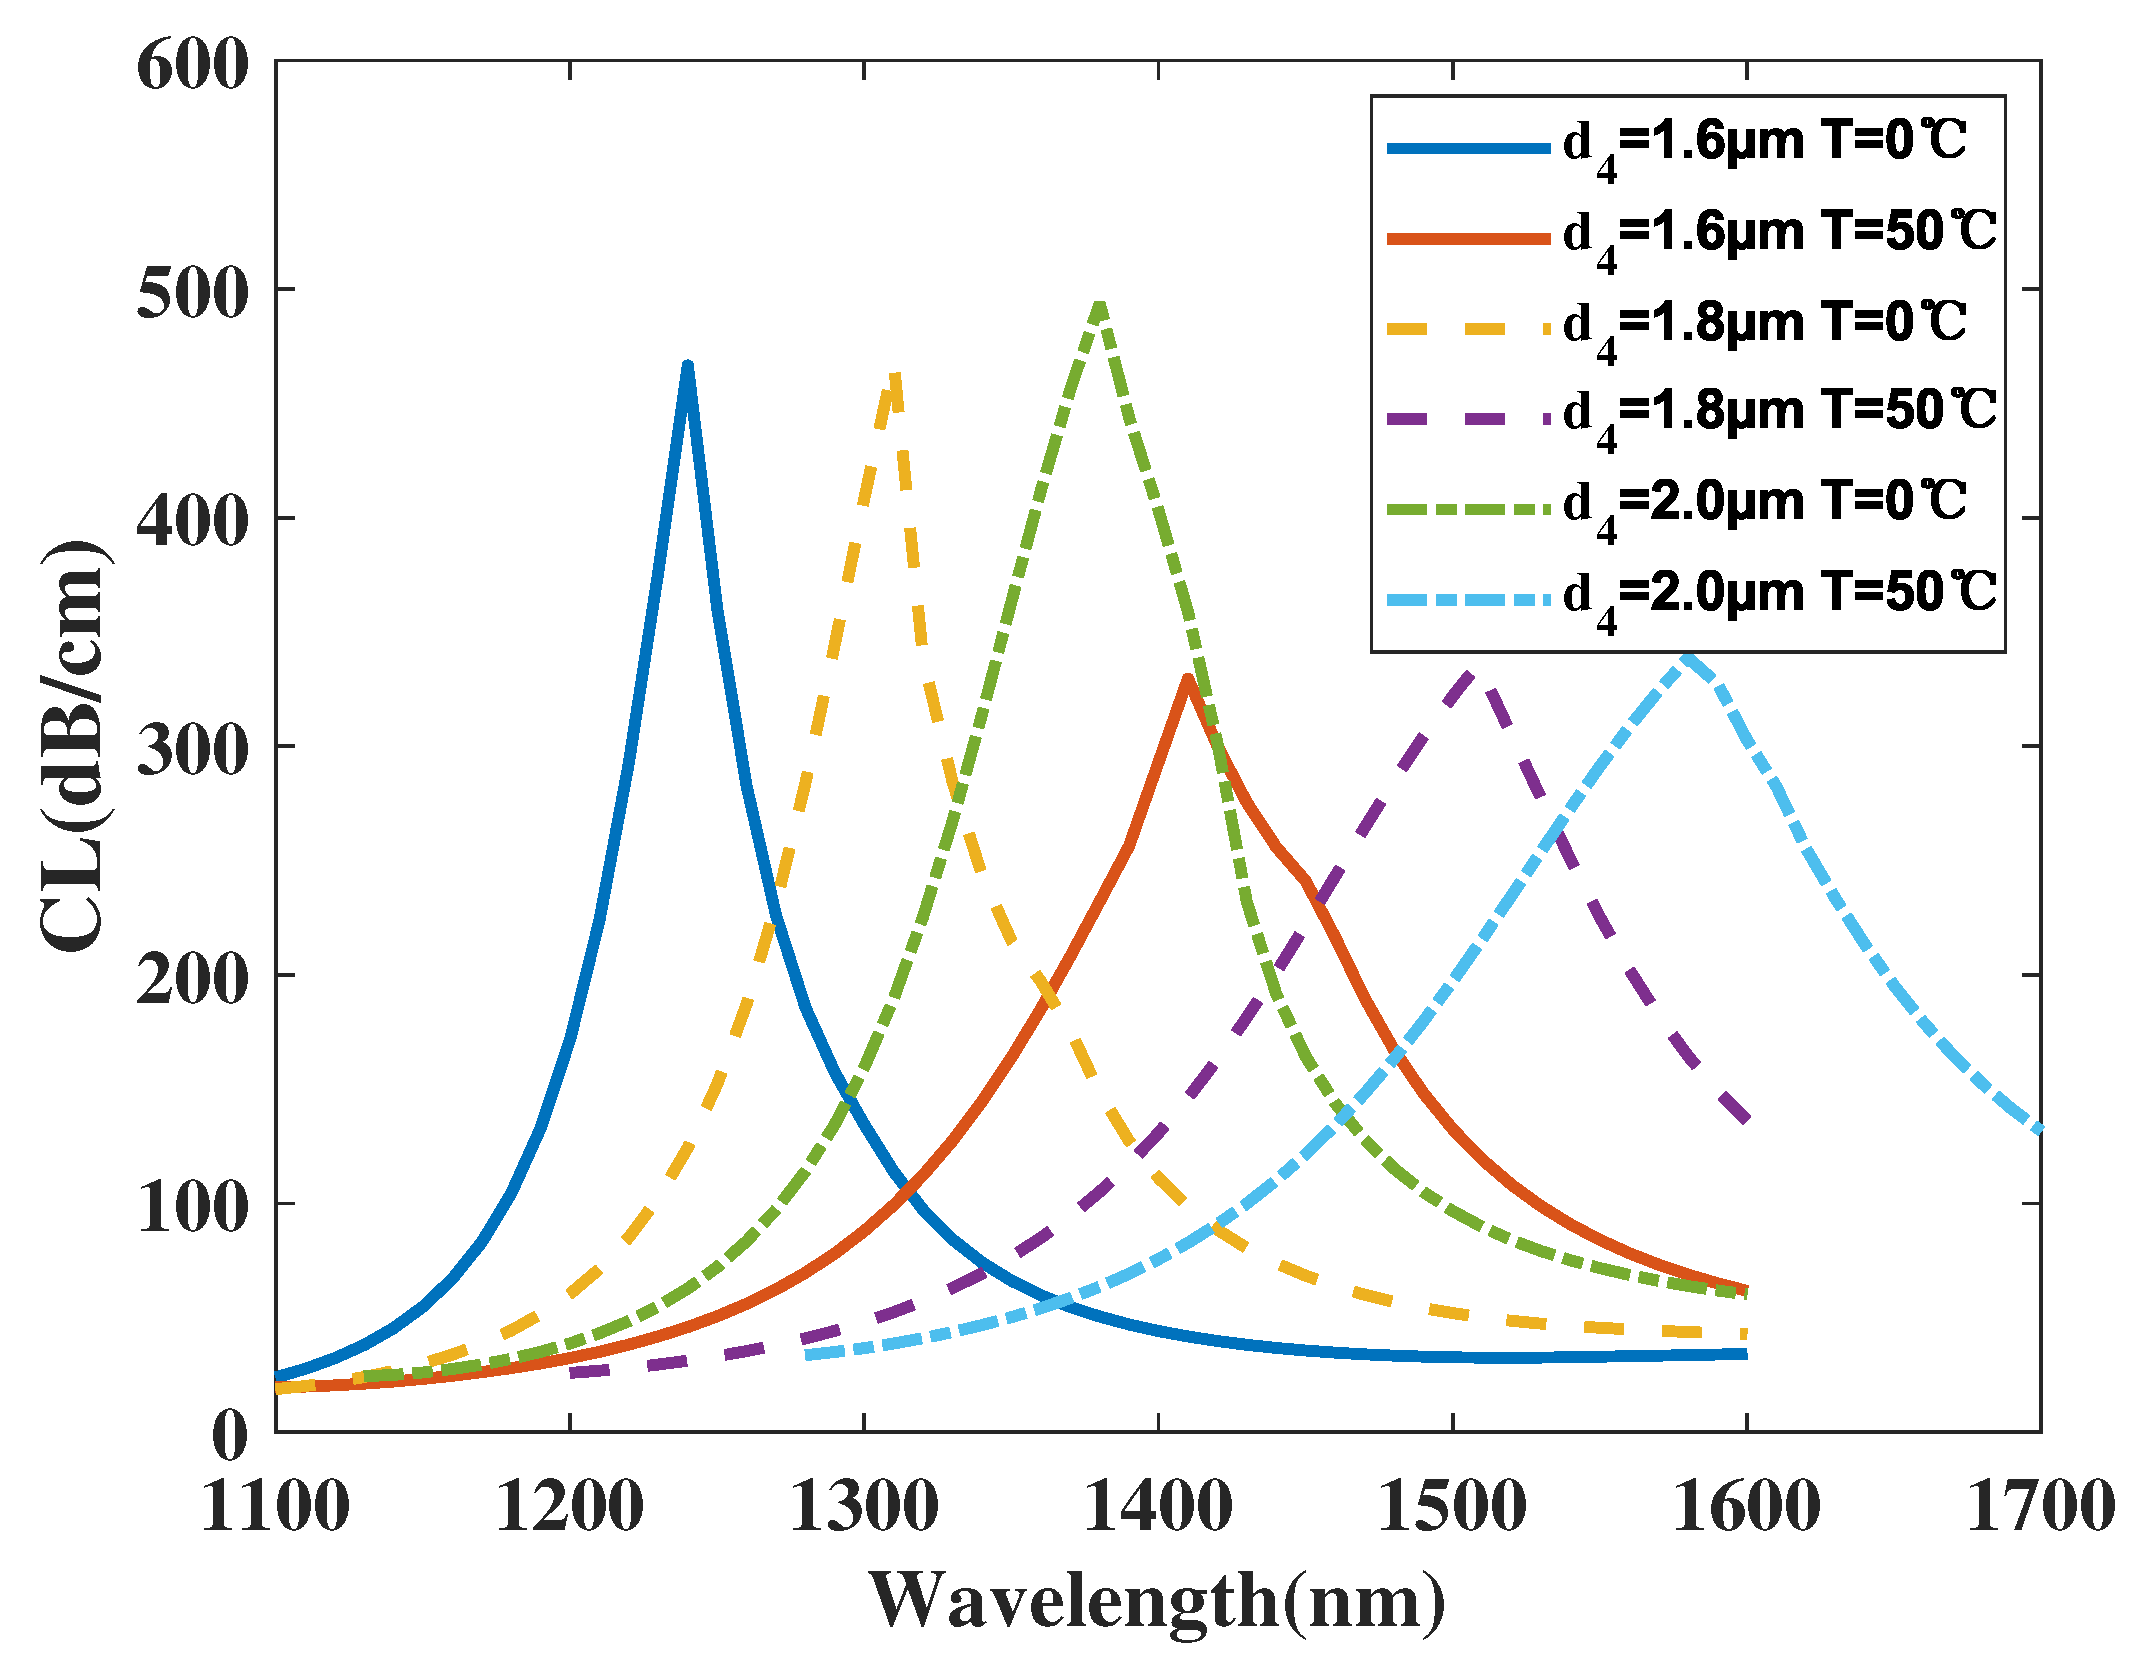
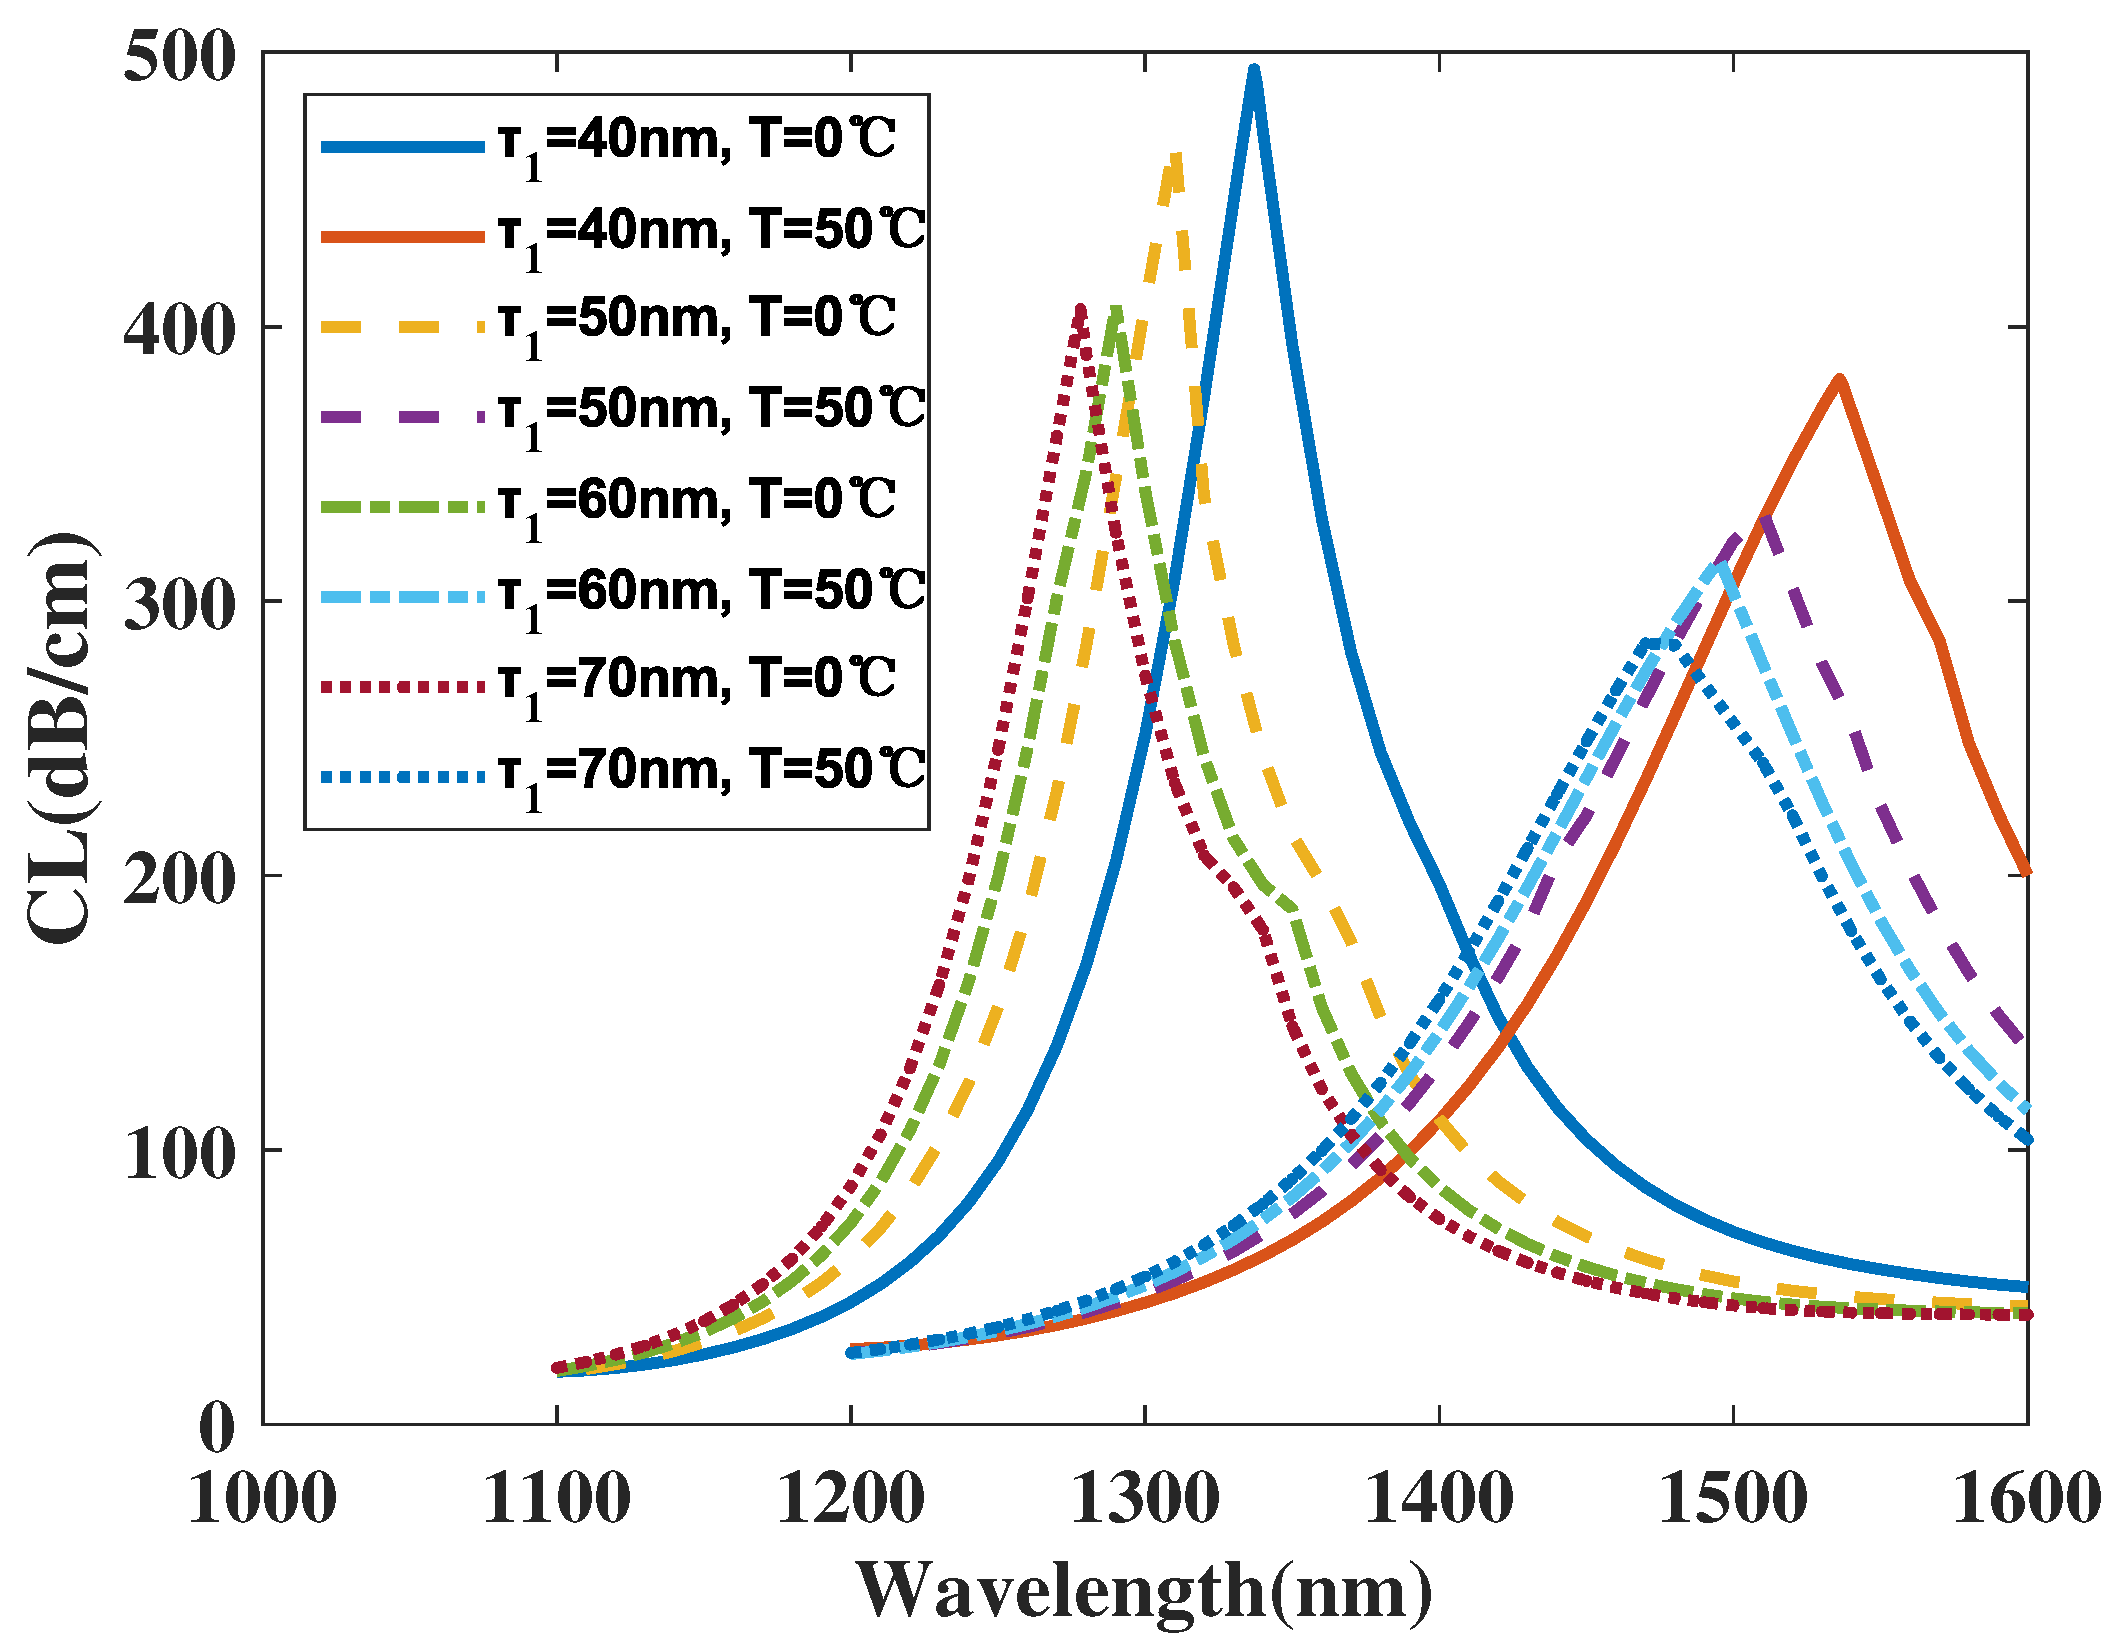
3.2. Effects on the Core B

Figure 10 demonstrates the CL curve of the x polarized mode of area B with d 3 respectively chosen as 2.0, 2.2, and 2.4 μ m, and temperature T is set as 0 and 50 °C. From Figure 10, it can be seen that, with a variation in d 3 and from 2.0 to 2.4 μ m, λ S P R the value of the CL curve with T set as 0 °C witnesses a blue shift and the peak value of the CL curve has an increase, while the λ S P R value of the CL curve with T set as 50 °C has a slight red shift and the peak value of the CL curve remains the same. Furthermore, when making a comparison among those CL peak values and related envelopes, it is apparent that the distribution of the CL peak value happens to visibly blue-shift and that the wavelength region is widened with a variation of d 3 from 2.0 to 2.4 μ m. A reasonable explanation for this is that, when d 3 increases, there is more TSM in the filled air hole, which leads to the SPR effect being further excited and the CL peak value increased. However, meanwhile, with d 3 gradually increasing, the energy cannot be fully confined in core B, which also leads to the coupling condition being changed and the SPR effect being weakened as well as the peak value of the CL curve being decreased with a large d 3 value. In accordance with Equation (6), the average S T value achieves 3.06, 3.40, and 3.64 nm/°C with d 3 , respectively, set as 2.0, 2.2, and 2.4 μ m. The calculation results illustrate that the average S T value of the proposed structure increases with d 3 increases. Furthermore, the sensor has its effective working wavelength range from 1100 to 1600 nm and above when it is applied for temperature detection, which proves that the sensor can be simultaneously used for RI and temperature detection with two far disjoint wavelength regions.
Figure 11 shows the CL curve of the x polarized mode of area B with d 4 respectively chosen as 1.6, 1.8, and 2.0 μ m, and T is 0 and 50 °C. From Figure 11, it can be seen that, with a variation in d 4 from 1.6 to 2.0 μ m, the λ S P R value of the CL spectra with T set as 0 °C has a drastically red shift and the peak value of the CL curve has a slight change. The λ S P R value of the CL curve, with T set as 50 °C, witnesses a dramatically red shift and the peak value of the CL curve has a small change. Furthermore, when making a comparison among those CL peak values and the related envelopes, it is apparent that the distribution of the CL peak value occurs to red-shift significantly with a variation in d 4 from 1.6 to 2.0 μ m. The main reason considered for this is that, when d 4 increases, the space between the inner gold film and the TSM-filled air hole is slightly compressed and the distance from the inner gold coating to the TSM is alleviated, which changes the condition of exciting the SPR effect, and affects the intensity of the CL peak value. According to Equation (6), the average S T value reaches 3.40, 3.98, and 4.00 nm/°C with d 4 respectively chosen as 1.6, 1.8, and 2.0 μ m. The calculation results demonstrate that the average S T value of the proposed structure increases with d 4 increases. Furthermore, the sensor has its effective working wavelength range from 1100 to 1700 nm and above when it is applied for temperature detection, which proves the feasibility of applying the sensor for simultaneously detecting RI and temperature in two far disjoint wavelength regions.
Figure 12 illustrates the CL curve of the x polarized mode of area B with τ 1 respectively chosen as 40, 50, 60, and 70 nm, and temperature T is 0 and 50 °C.
From Figure 12, with a variation in τ 1 from 40 to 70 nm, the λ S P R value of the CL curve with T set as 0 °C happens to visibly blue-shift and the CL peak value decreases, while the resonance wavelength of the CL spectra with T set as 50 °C starts to blue-shift gradually and the peak value of the CL curve diminishes. Furthermore, when making a comparison among those CL peak values and related envelopes, it is apparent that the distribution of the CL peak value has a blue shift and the related intensity of the CL curve falls visibly with a variation in τ 1 from 40 to 70 nm. A reasonable explanation for this is that, when τ 1 increases, though the distance from the TSM-filled hole to the inner gold film is almost unchanged, the central hole is compressed with the thickening gold film, which changes the SPR exciting condition and further causes the blue shift of the CL curve. Moreover, the intensity of the CL peak value is affected by the compressed area. In accordance with Equation (6), the average S T value reaches 3.98, 4.00, 4.10, and 3.98 nm/°C with τ 1 respectively chosen as 40, 50, 60, and 70 nm. The calculation results demonstrate that the average S T value of the proposed structure firstly increases and then decreases with τ 1 increases. Furthermore, the sensor has its effective working wavelength range from 1100 to 1600 nm and above when it is applied for temperature detection, which proves the feasibility of two wavelength regions which do not overlap when applied for RI and temperature sensing simultaneously.
Figure 13 demonstrates the CL curve of the x polarized mode of area B with d 1 respectively chosen as 1.4, 1.6, and 1.8 μ m, and T is 0 and 50 °C. From Figure 13, it can be seen that, with a variation in d 1 from 1.4 to 1.8 μ m, the λ S P R value of the CL curve with T set as 0 °C has a subtle blue shift and the peak value of the CL curve has a slight increase, while the resonance wavelength of the CL spectra with T set as 50 °C has a blue shift and the peak value of the CL curve witnesses a small increase. Furthermore, when making a comparison among those CL peak values and the related envelopes, it is apparent that the distribution of the CL peak value is almost unchanged and has a slight blue shift with d 1 set from 1.4 μ m to 1.8 μ m. The main reason considered for this is that, when d 1 increases, the space between the inner gold film and the TSM is compressed, which leads to the intensity of the CL peak value being enhanced. However, the distance from the TSM-filled hole to the adjacent holes decreases too, which offsets the influence from the compressed area between the TSM hole and the gold film, leading to the SPR condition being almost unchanged. In accordance with Equation (6), the average S T value reaches 4.02, 4.02, and 4.08 nm/°C with d 1 respectively chosen as 1.4, 1.6, and 1.8 μ m. The calculation results illustrate that the average S T value of the proposed structure increases with d 1 maximized. Furthermore, the sensor has its effective working wavelength range from 1100 to 1600 nm and above when it is applied for temperature detection, which proves the separation in wavelength regions applies for analyte RI sensing.
Figure 14 shows the CL curve of the x polarized mode of area B with d 2 respectively chosen as 1.8, 2.0, and 2.2 μ m, and T is 0 and 50 °C. From Figure 14, it can be seen that, with a variation in d s from 1.8 to 2.2 μ m, the λ S P R value of the CL curve with T set as 0 °C witnesses a slight red shift and the peak value of the CL curve has a decrease, while the resonance wavelength of the CL spectra with T set as 50 °C witnesses a red shift and the peak value of the CL curve first increases and then decreases. Furthermore, when making a comparison among those CL peak values and the related envelopes, it is apparent that the distribution of the peak value of the CL curve has a red shift with d 2 set from 1.8 μ m to 2.2 μ m. A reasonable explanation for this is that, when d 2 increases, the energy cannot be fully confined in the center of the TSM hole, which alleviates the peak value of the CL curve. Furthermore, the area adjacent to the TSM-filled hole is compressed, which changes the coupling condition and causes the shift of the CL curve. In accordance with Equation (6), the average S T value reaches 3.88, 3.96, and 4.24 nm/°C with d 2 respectively chosen as 1.8, 2.0, and 2.2 μ m. The calculation results demonstrate that the average S T value of the proposed structure increases when the d 2 value rises. Furthermore, the sensor has its effective working wavelength range from 1100 to 1600 nm and above when it is applied for temperature detection, which proves the reliability of detecting temperature using a wavelength region far from the wavelength region applied for analyte RI sensing.
For the biosensor structure in this correspondence, the effects of the structural parameters on the sensing performance of the x polarized mode of area B are summarized in Table 2 as follows.

4. Sensor Structure Parameters Optimization

After analyzing the effects of the structural parameters on sensing performance, we have achieved the conclusions shown in Table 1 and Table 2 above. In this section, we use two distinct methods to optimize the parameters of the proposed structure.

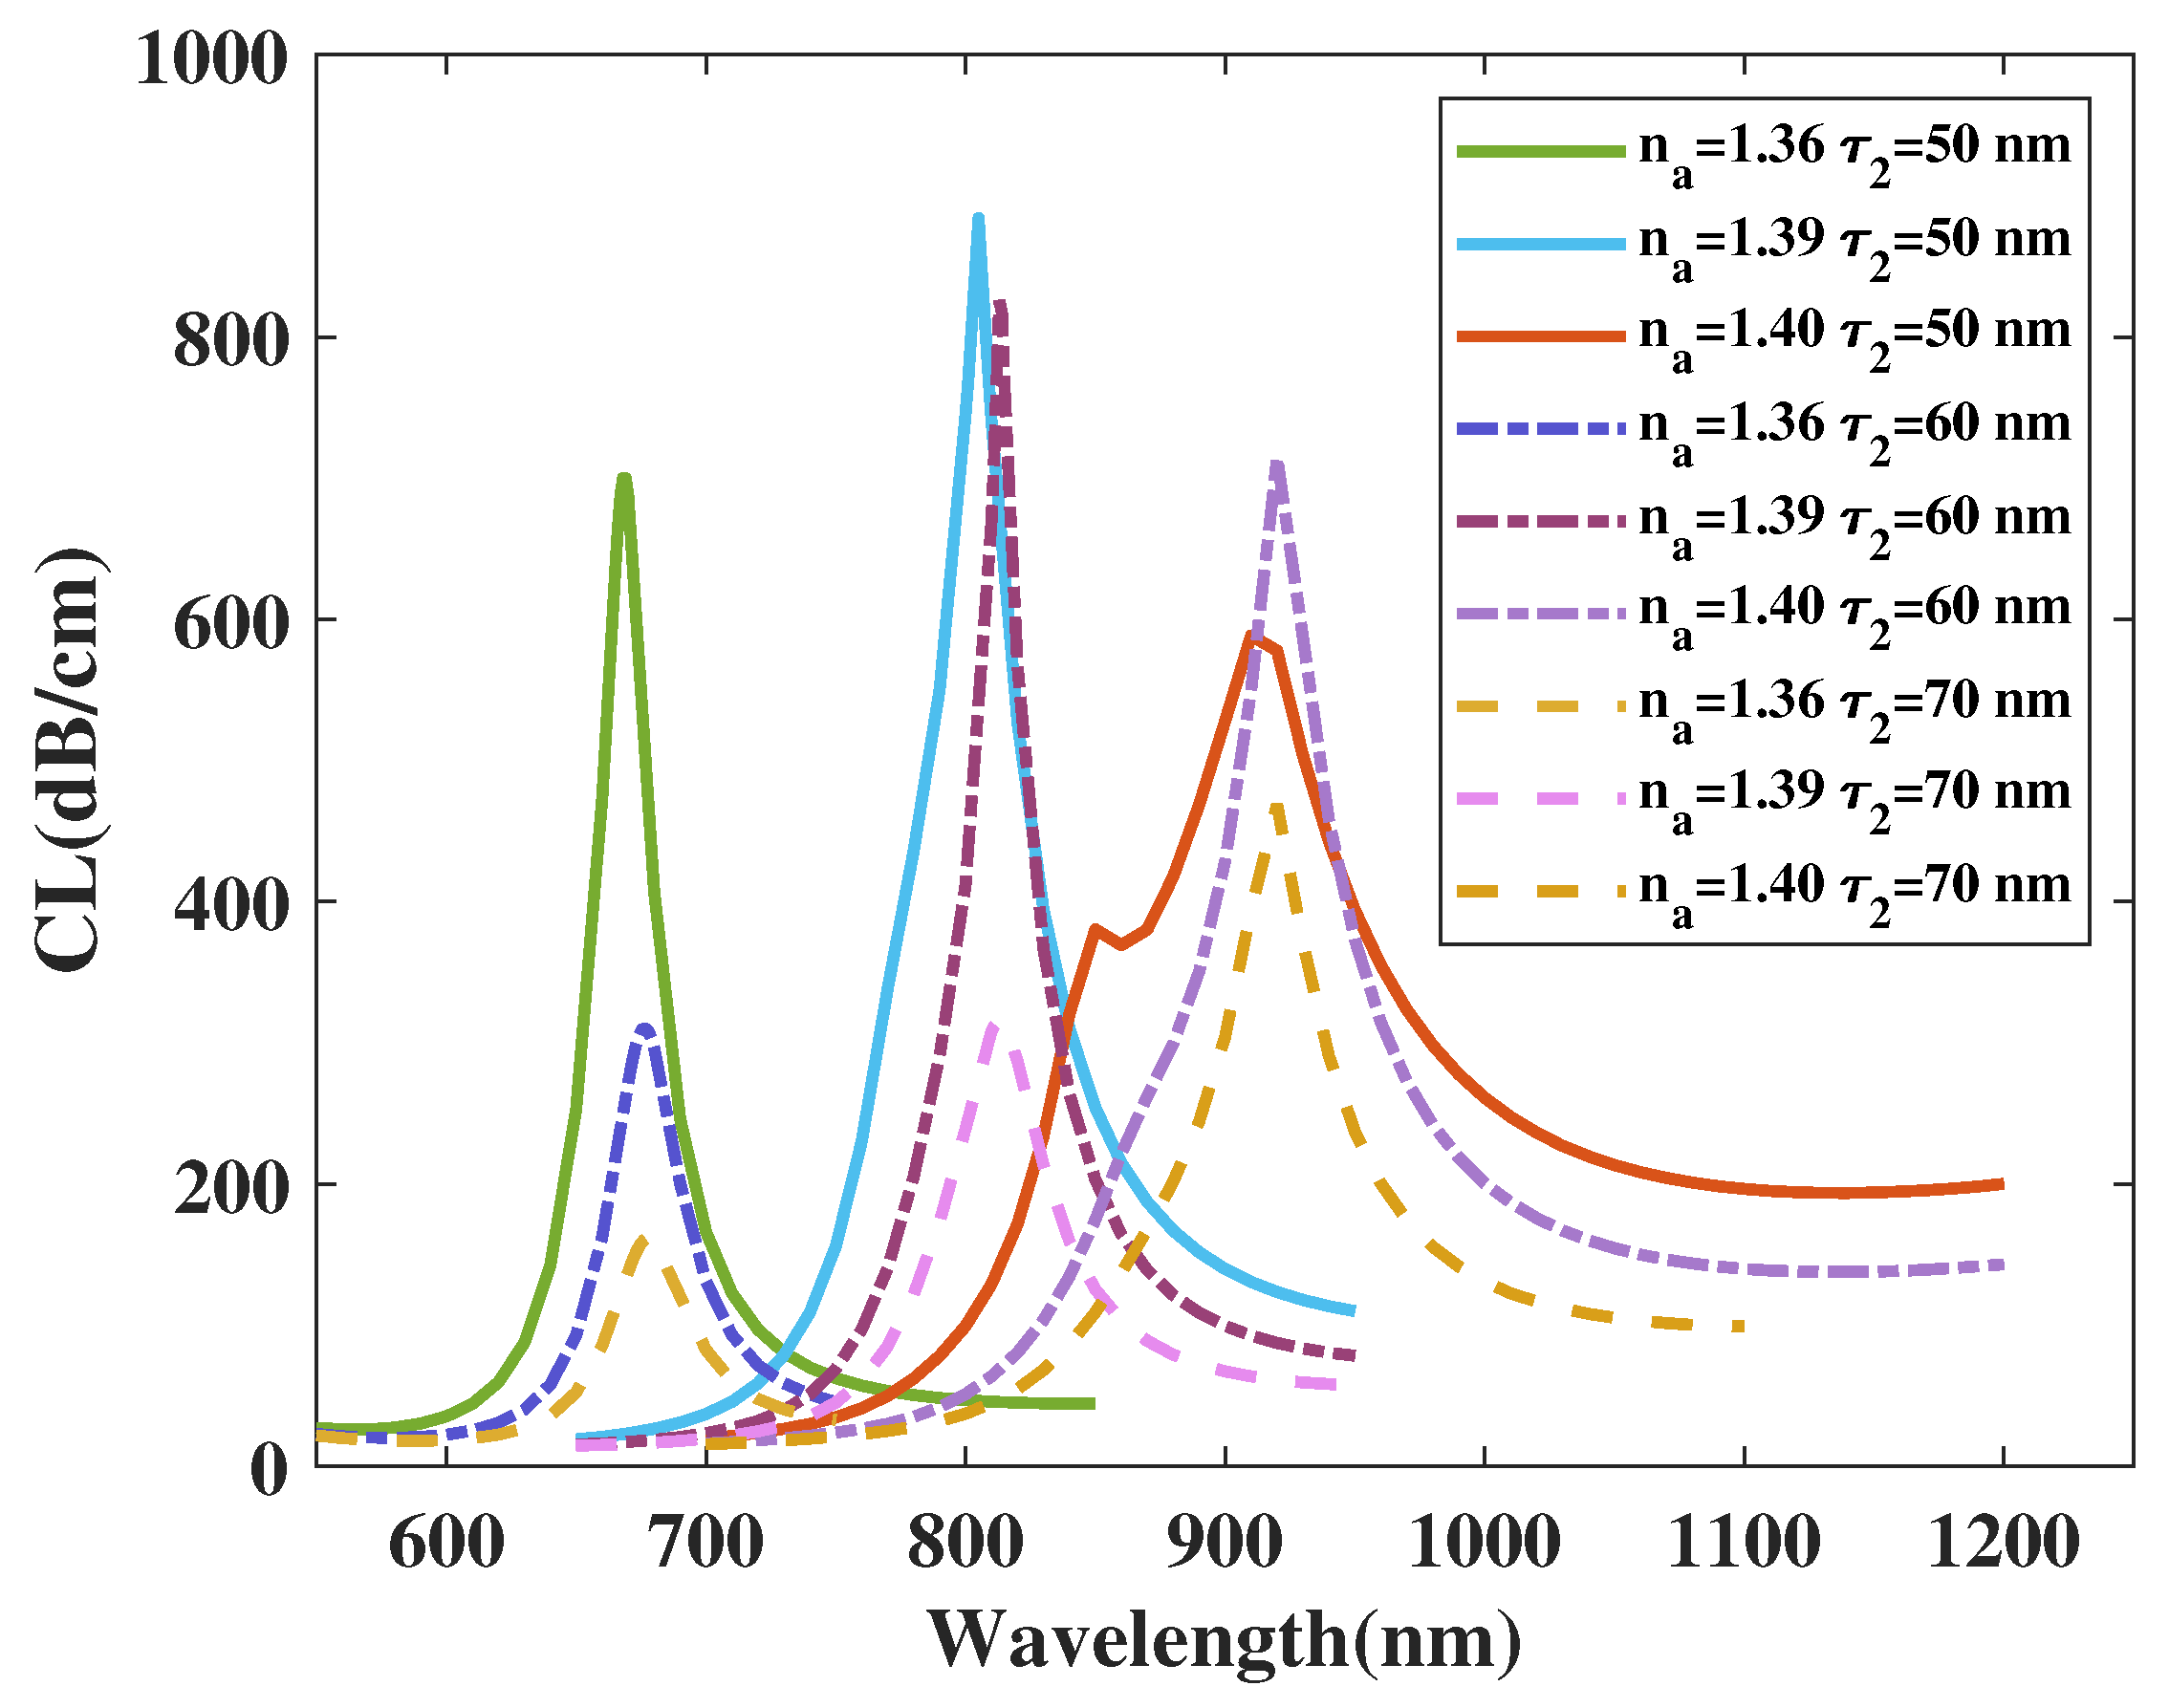
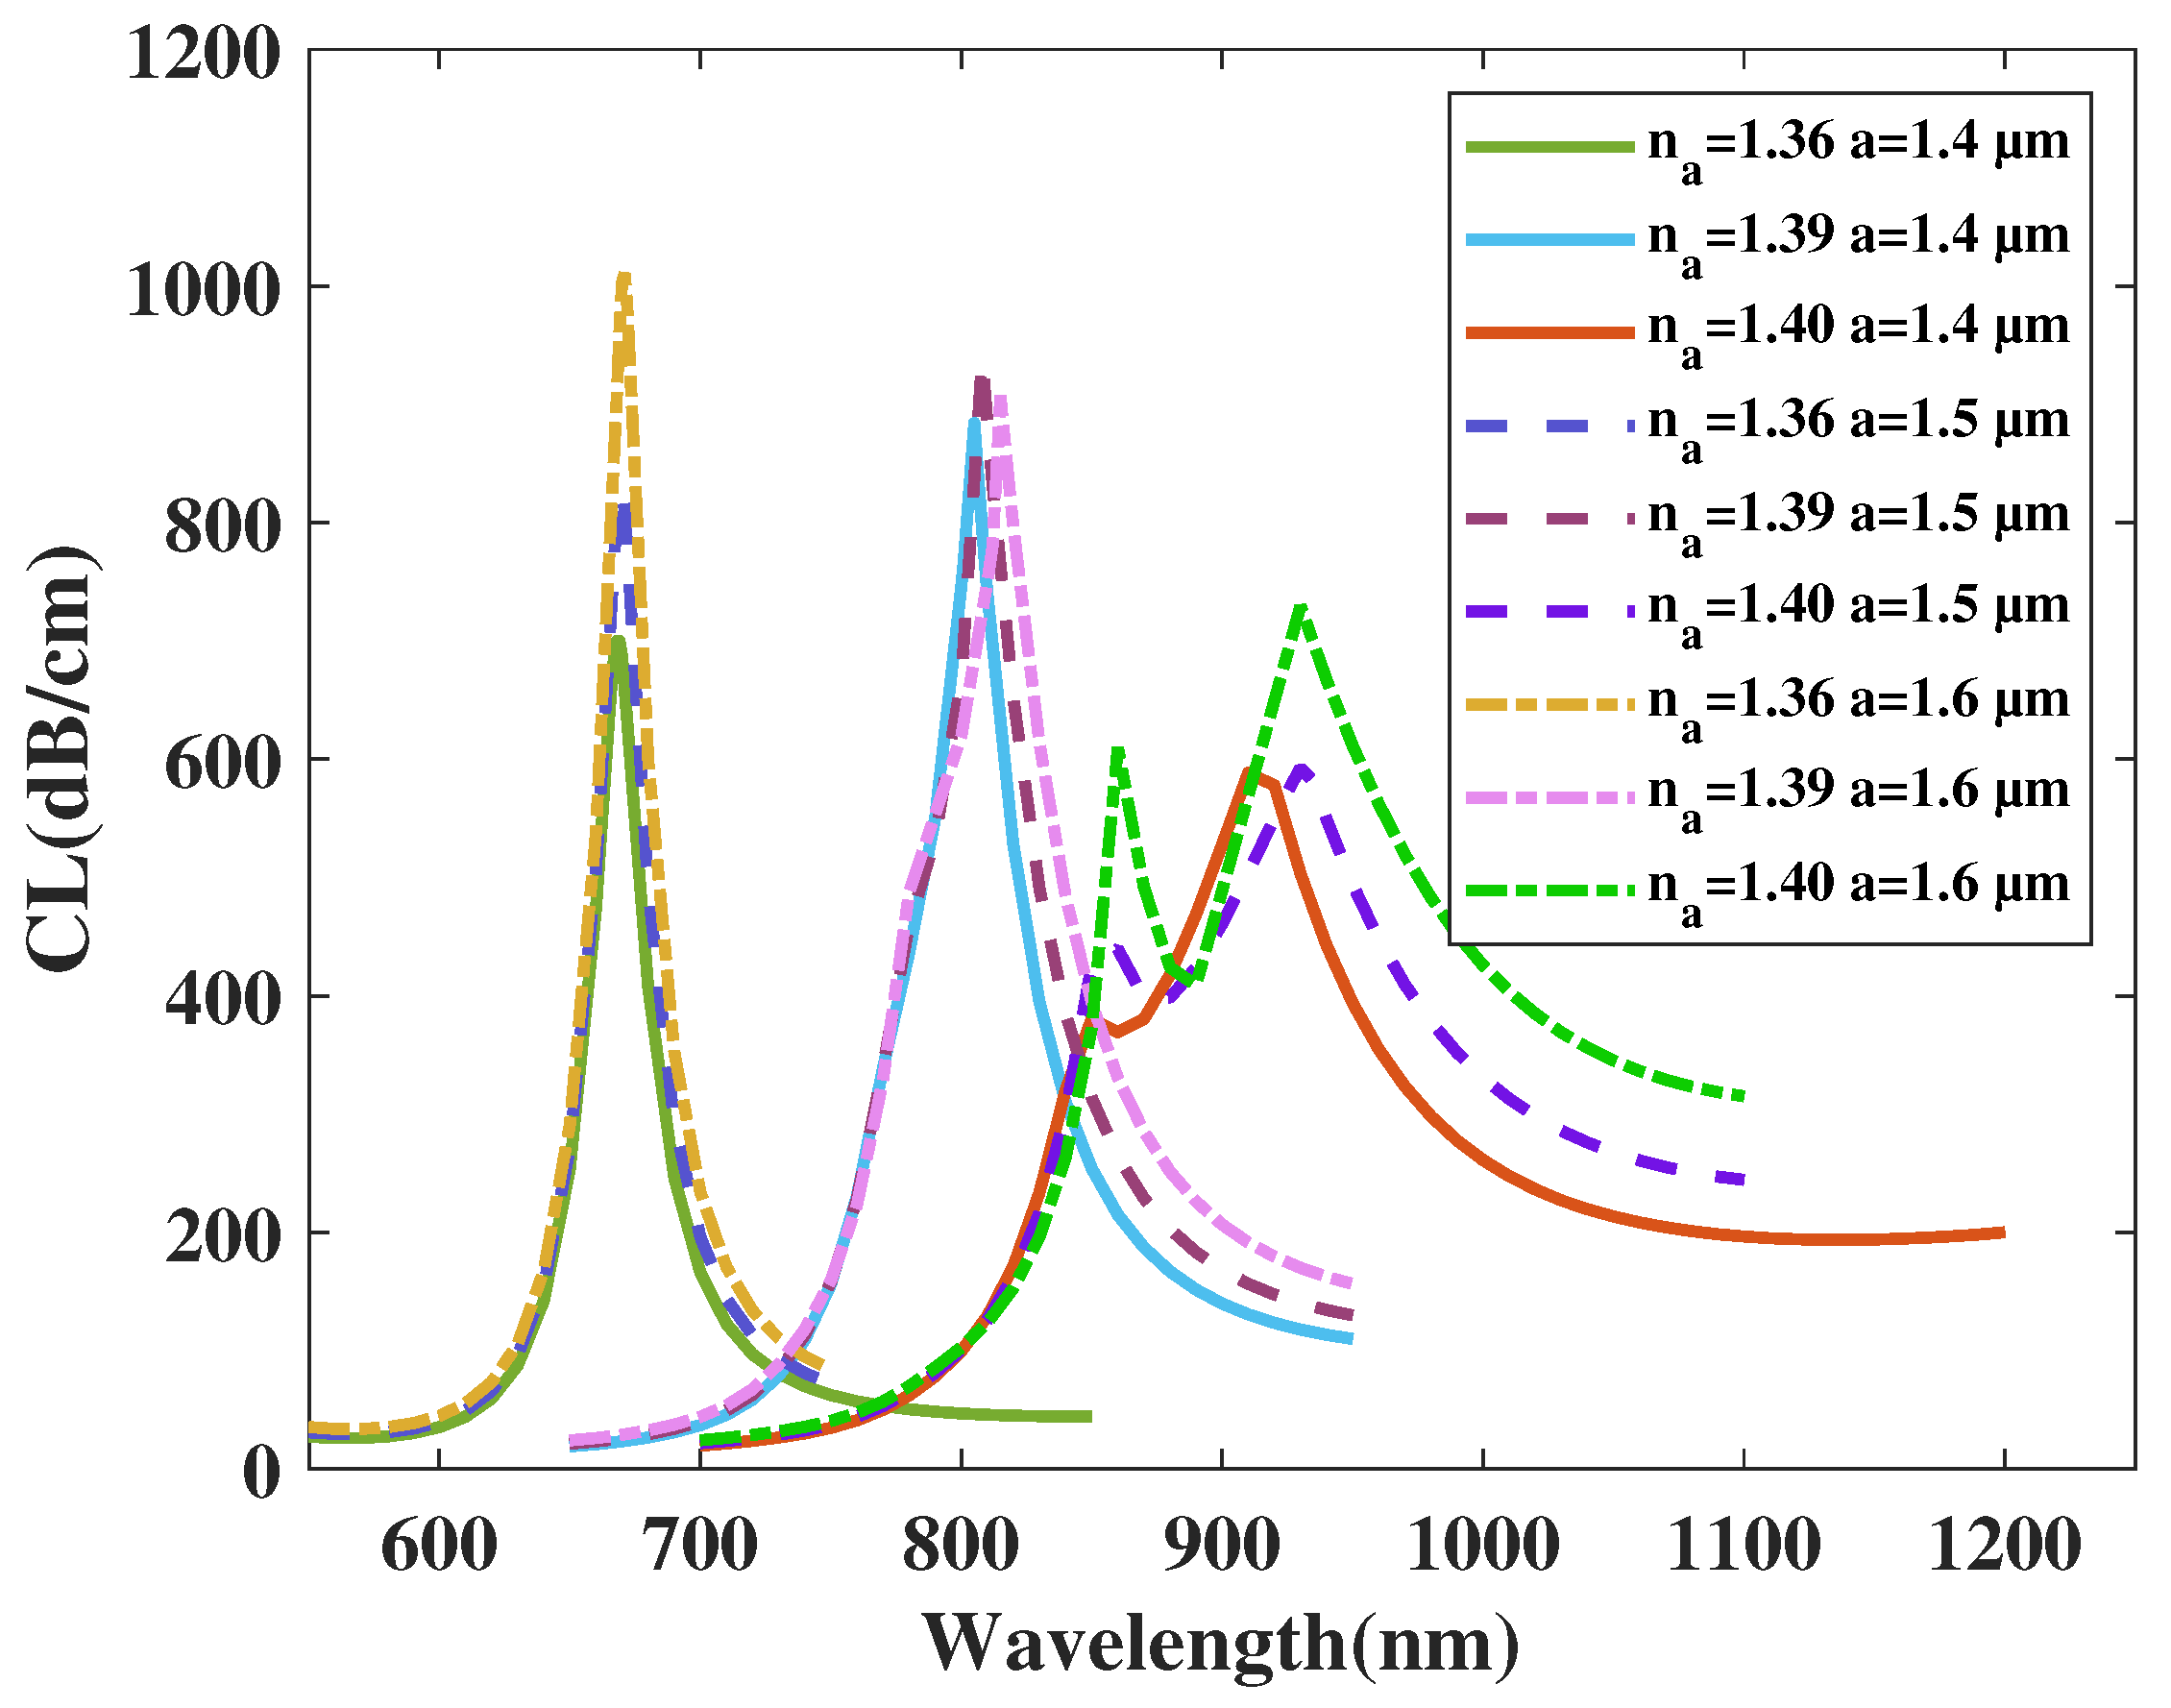
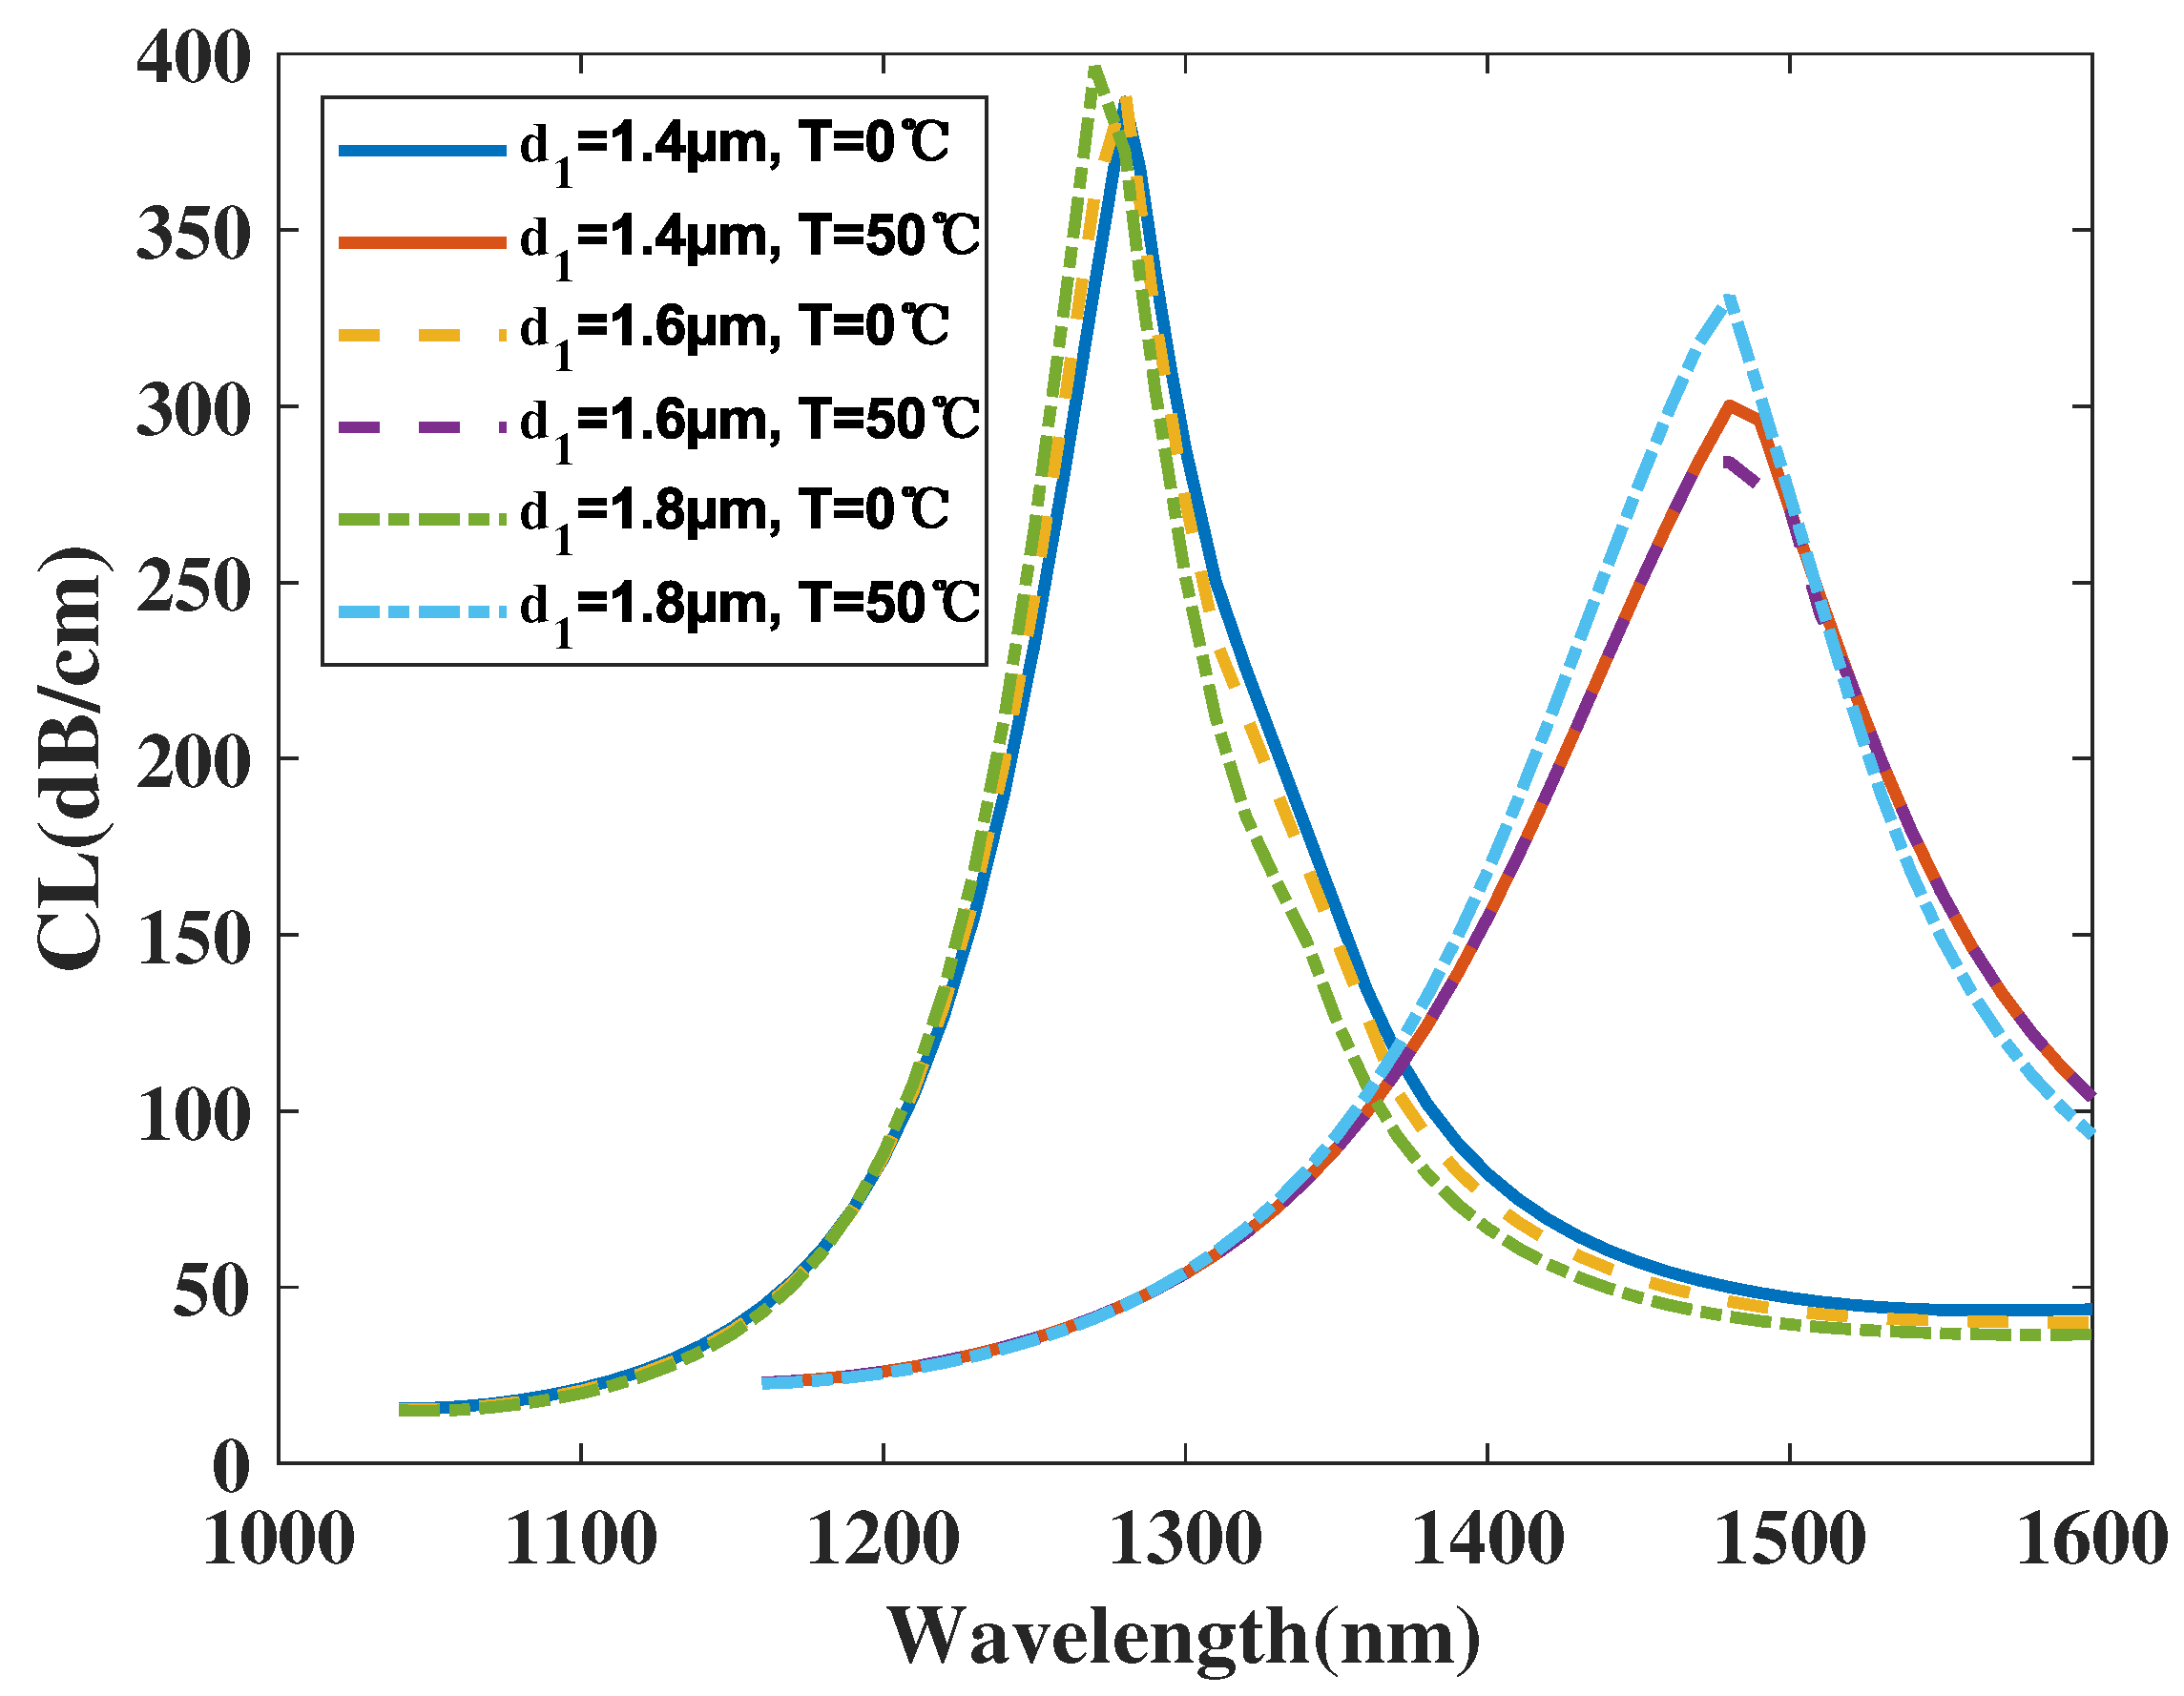
4.1. Optimization of Core A

Section 3.1 and Table 1 have illustrated the effects of structural parameters τ 2 , a, b, θ 1 , and θ 2 on the sensing performance of core A. In these five parameters, θ 1 and θ 2 are not considered, for we analyze them only to verify that they have a trivial effect on the sensing performance of core A when some deviation occurs in the fabrication process and when those elliptical air holes are not pointing to the core A area, which lowers the difficulty of the manufacturing process.
For τ 2 , it is clear that, when it varies from 50 nm to 60 nm, the distorted peak with the analyte RI set as 1.40 disappears. When it is set from 70 nm to 60 nm, the CL peak value increases, which also enlarges the AS value. Moreover, core A can achieve the largest average S n value of 6100 nm/RIU and the maximum S n value of 10,800 nm/RIU, which also brings the best resolution value. In conclusion, the optimal value of parameter τ 2 is set as 60 nm.
For a, it is evident that, when it changes close to 1.6 μ m, the average and maximum RI sensitivity reach the summit and the intensity of the CL peak value is maintained at a relatively high value, which enlarges the AS value. Moreover, the distorted peak is significantly enhanced with a variation in the parameter from 1.5 to 1.6 μ m. In pursuit of a sensing performance with high sensitivity and with a minimally distorted peak, parameter a is set as 1.5 μ m as its optimal value.
After optimizing τ 2 and a to optimal values of 60 nm and 1.5 μ m, respectively, we find that the effect of parameter b on the sensing performance results in a red shift, which means that the optimal value is increased from the initial estimation value b = 0.6 μ m. Figure 15 illustrates the CL curve of the x polarized mode of area A with b respectively chosen as as 0.75, 0.78 μ m, and τ 2 and a set as 60 nm and 1.5 μ m, with the analyte RI set as 1.36, 1.39, and 1.40. From Figure 15, we can obtain the maximum S n value as 11,700 nm and the average S n value as 7100 nm/RIU when considering the proposed sensor with a coverage of RI measurement from 1.36 to 1.41. In conclusion, the optimal value of the parameter b is set as 0.75 μ m.

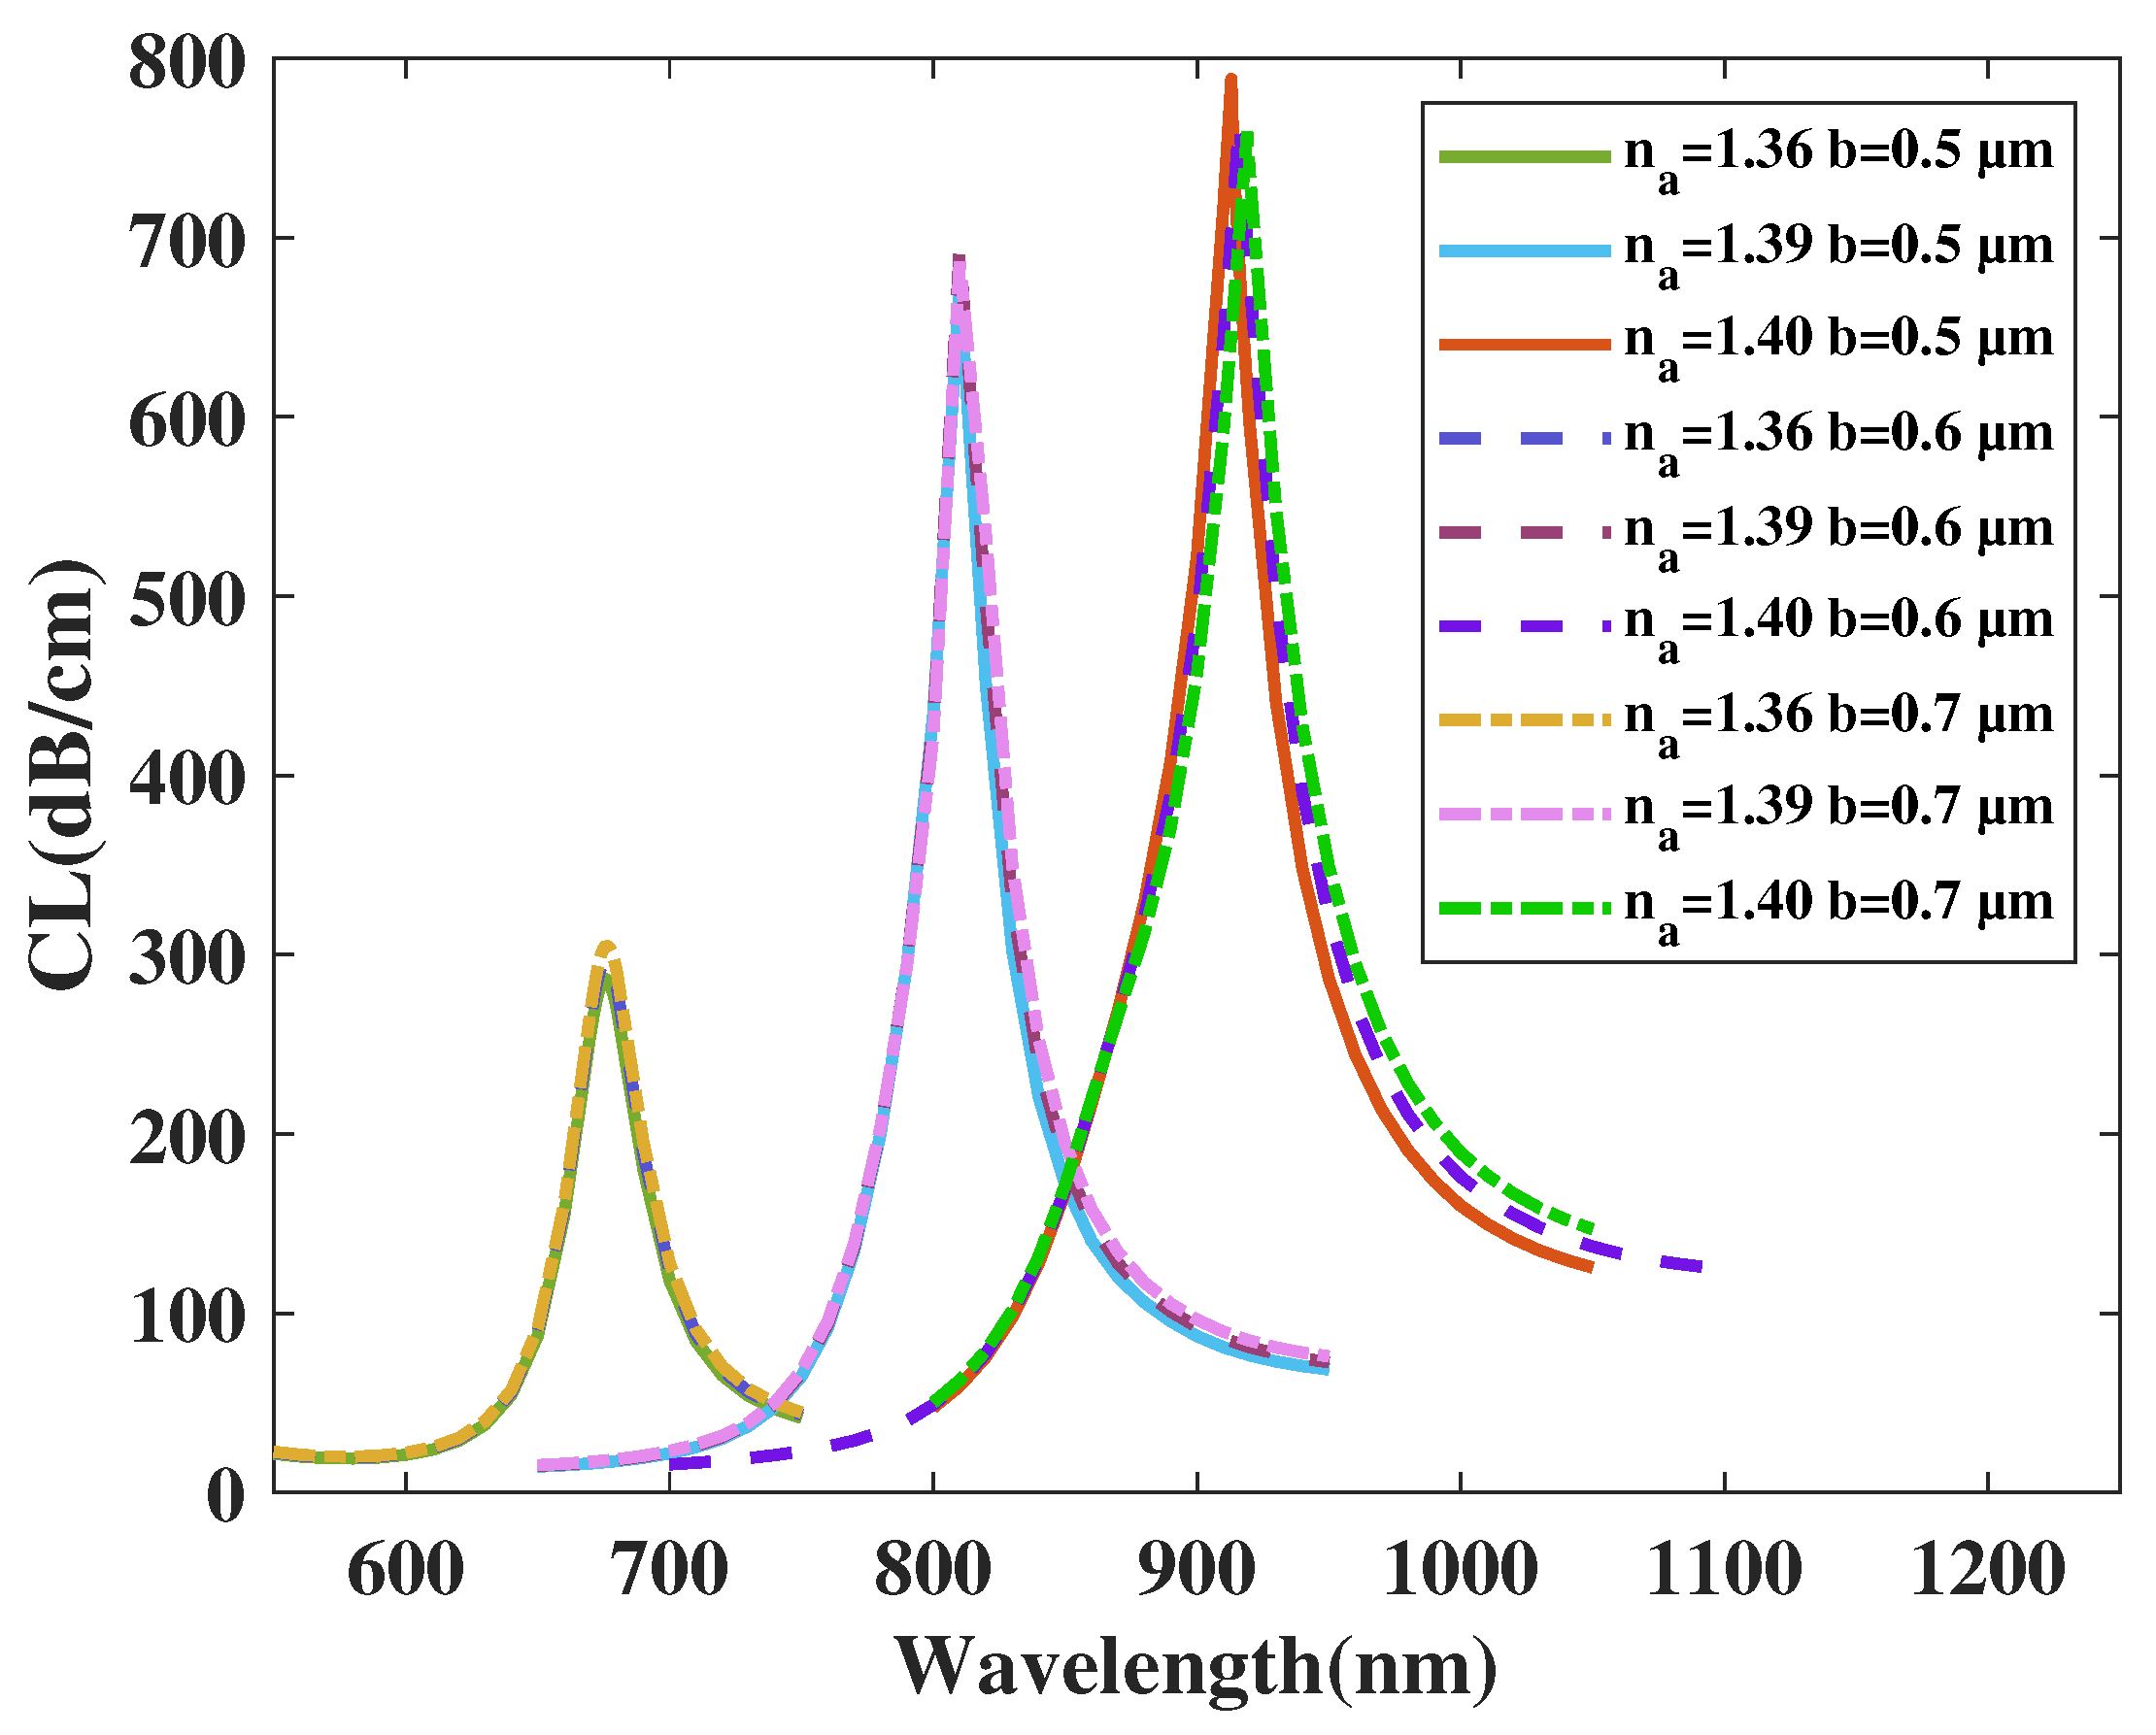
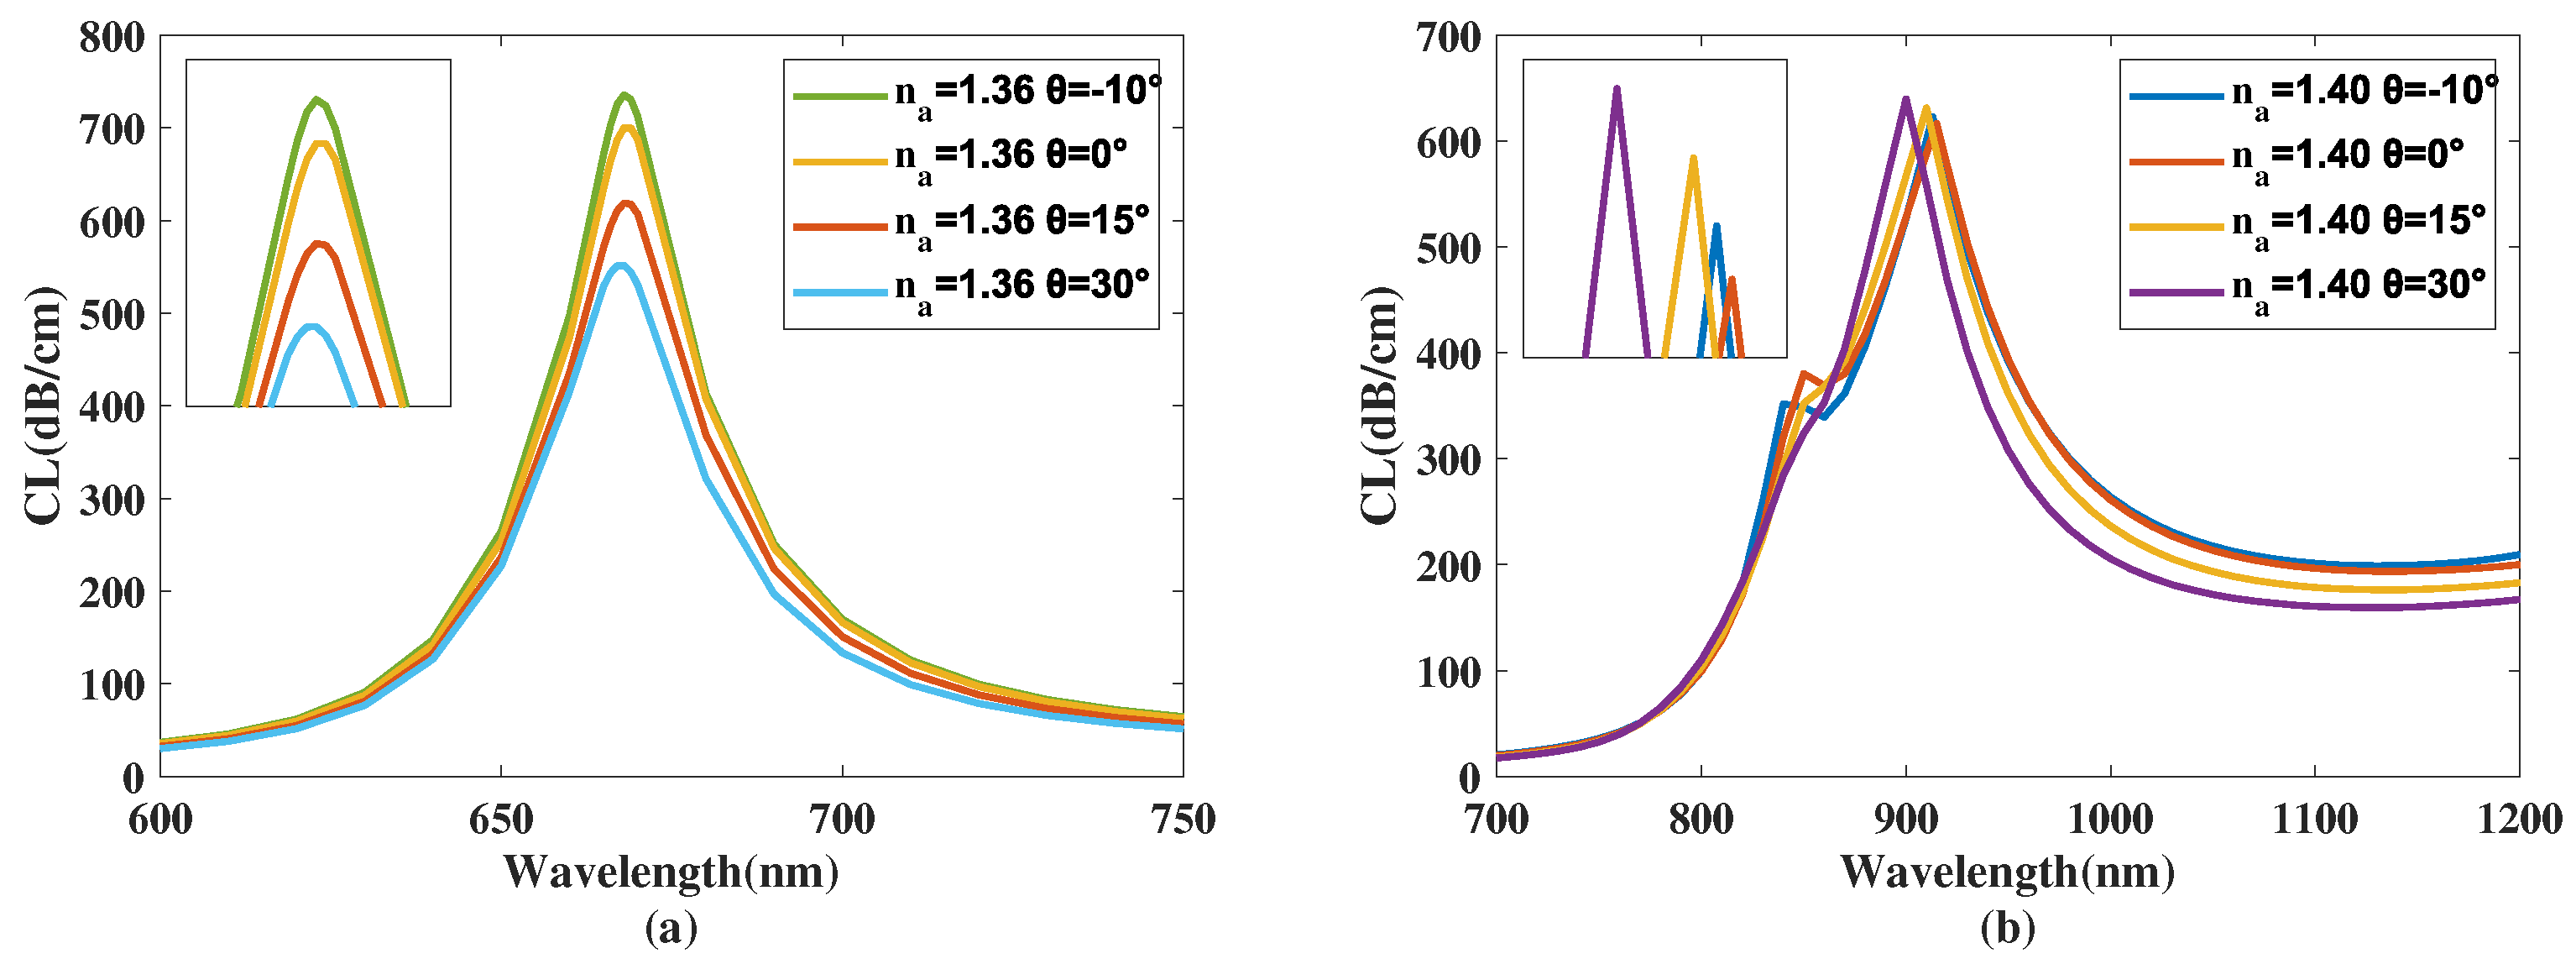
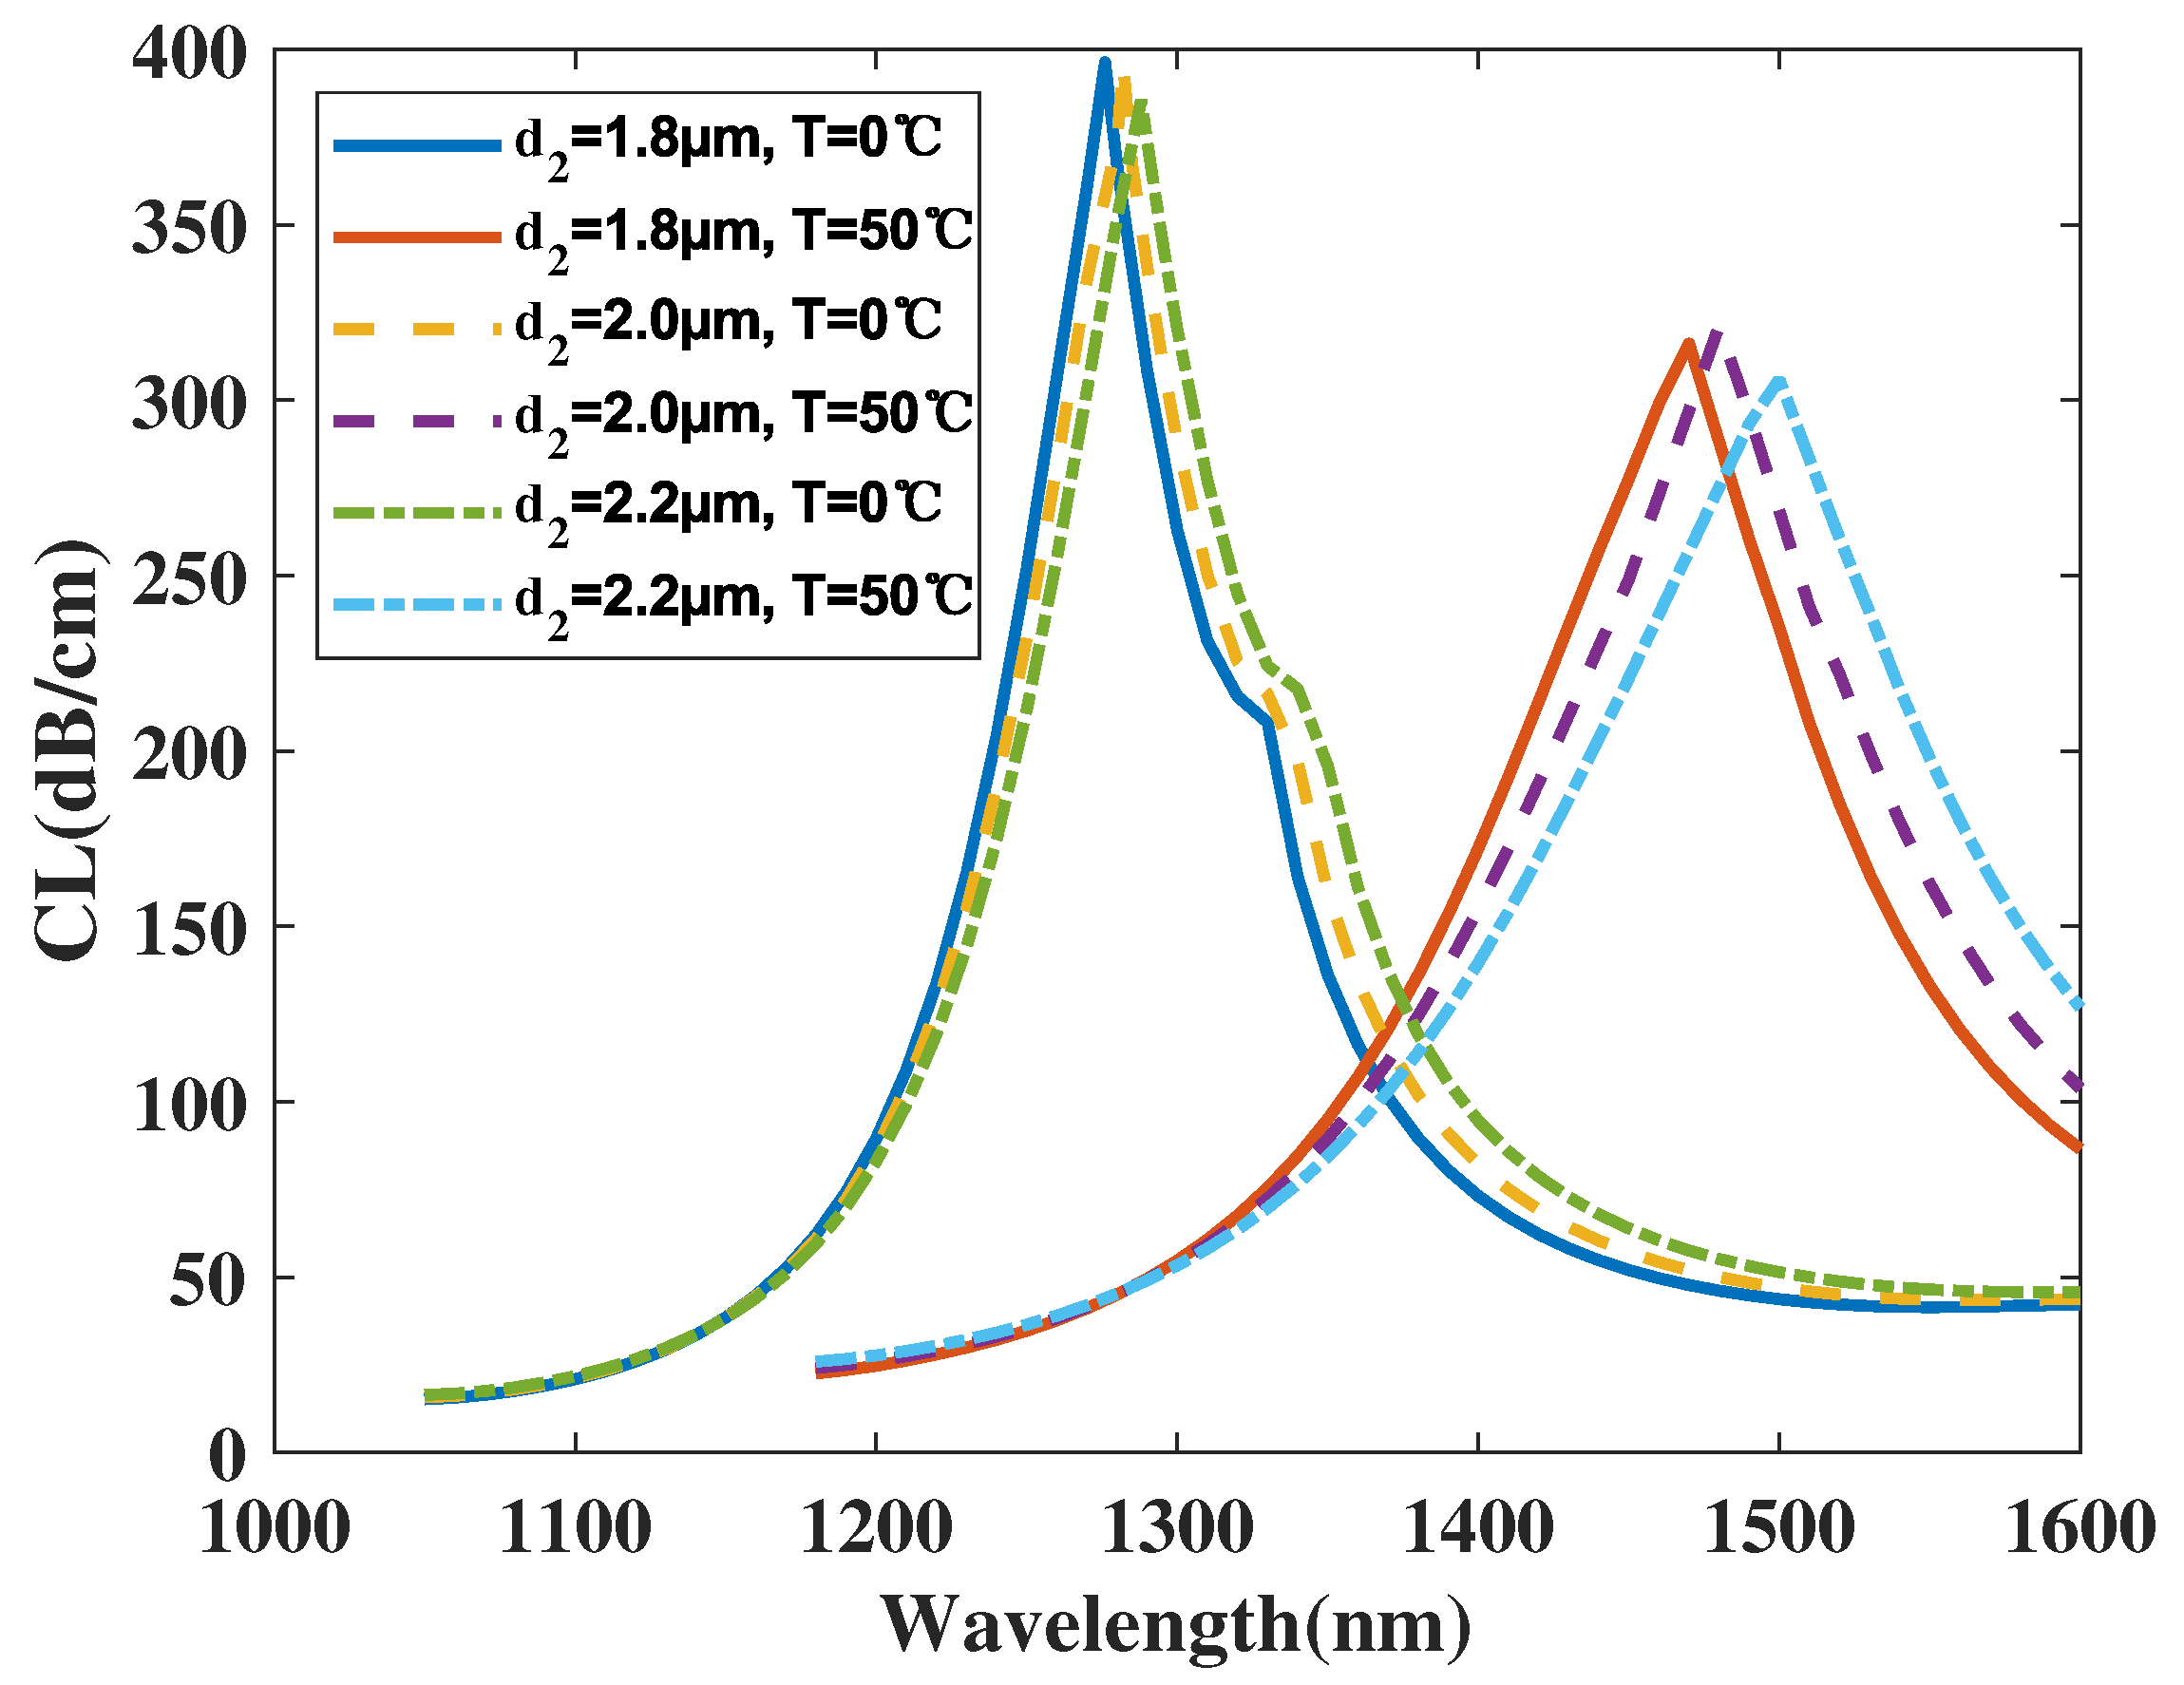
4.2. Optimization of Core B

Section 3.2 and Table 2 have demonstrated the effects of the structural parameters d 3 , d 4 , τ 1 , d 1 , and d 2 on the sensing performance of core B. We choose a new step-by-step algorithm for optimizing the parameters of core B. First, we evaluate the priority of the effect of those structural parameters in accordance with Section 3.2 and Table 2. Then, we conclude the parameter sequence to optimize. After we have the optimal value of the first parameter, we use it as the new initial structural condition to continue optimizing the other parameters. From Section 3.2, it is clear that the parameters d 1 and d 2 have little effect on the sensing performance. Therefore, we put them last for optimization. The remaining three parameters have changing values in the temperature sensitivity sorted as d 3 , d 4 , and τ 1 , from largest to smallest. In conclusion, the optimization sequence is determined as d 3 , d 4 , τ 1 , d 1 , and d 2 .
For d 3 , it is certain that, when it is set from 2.0 μ m to 2.4 μ m, core B can achieve the largest average temperature sensitivity of 3.64 nm/°C, which also brings the optimal resolution. Moreover, the intensity of the CL peak value achieves a high value, which also enlarges the AS value. In conclusion, the optimal value of parameter d 3 is set as 2.4 μ m.
For d 4 , it is evident that with a variation from 1.6 to 2.0 μ m, core B can achieve the largest average S T value as 4.00 nm/°C. Thus, for metric S T , the biosensor structure achieves the highest resolution value. Moreover, the intensity of the CL peak value is maintained at a high value, which also enlarges the AS value. In conclusion, an optimal value of parameter d 4 is set as 2.0 μ m.
For τ 1 , it can be observed that, when it is set from 40 nm to 70 nm, core B can achieve the largest average S T value as 4.10 nm/°C when τ 1 is set between 40 nm and 70 nm. Thus, for metric S T , the biosensor structure achieves an ideal resolution value. However, the CL peak value decreases, which reduces the AS value. After weighing the pros and cons, parameter τ 1 achieves an optimal value at 60 nm.
For d 1 , it is known that, when it is set from 1.4 μ m to 1.8 μ m, core B can achieve the largest average S T value as 4.08 nm/°C, which also brings the best resolution. Moreover, the CL peak value rises, which also enlarges the AS value. In conclusion, the optimal value of parameter d 1 is set as 1.8 μ m.
For d 2 , it can be seen that when it is set from 1.8 μ m to 2.2 μ m, core B can achieve the largest average temperature sensitivity of 4.24 nm/°C. However, the CL peak value slightly decreases, which also marginally reduces the AS value. After weighing the pros and cons, the optimal value of parameter d 2 is chosen as 2.2 μ m.

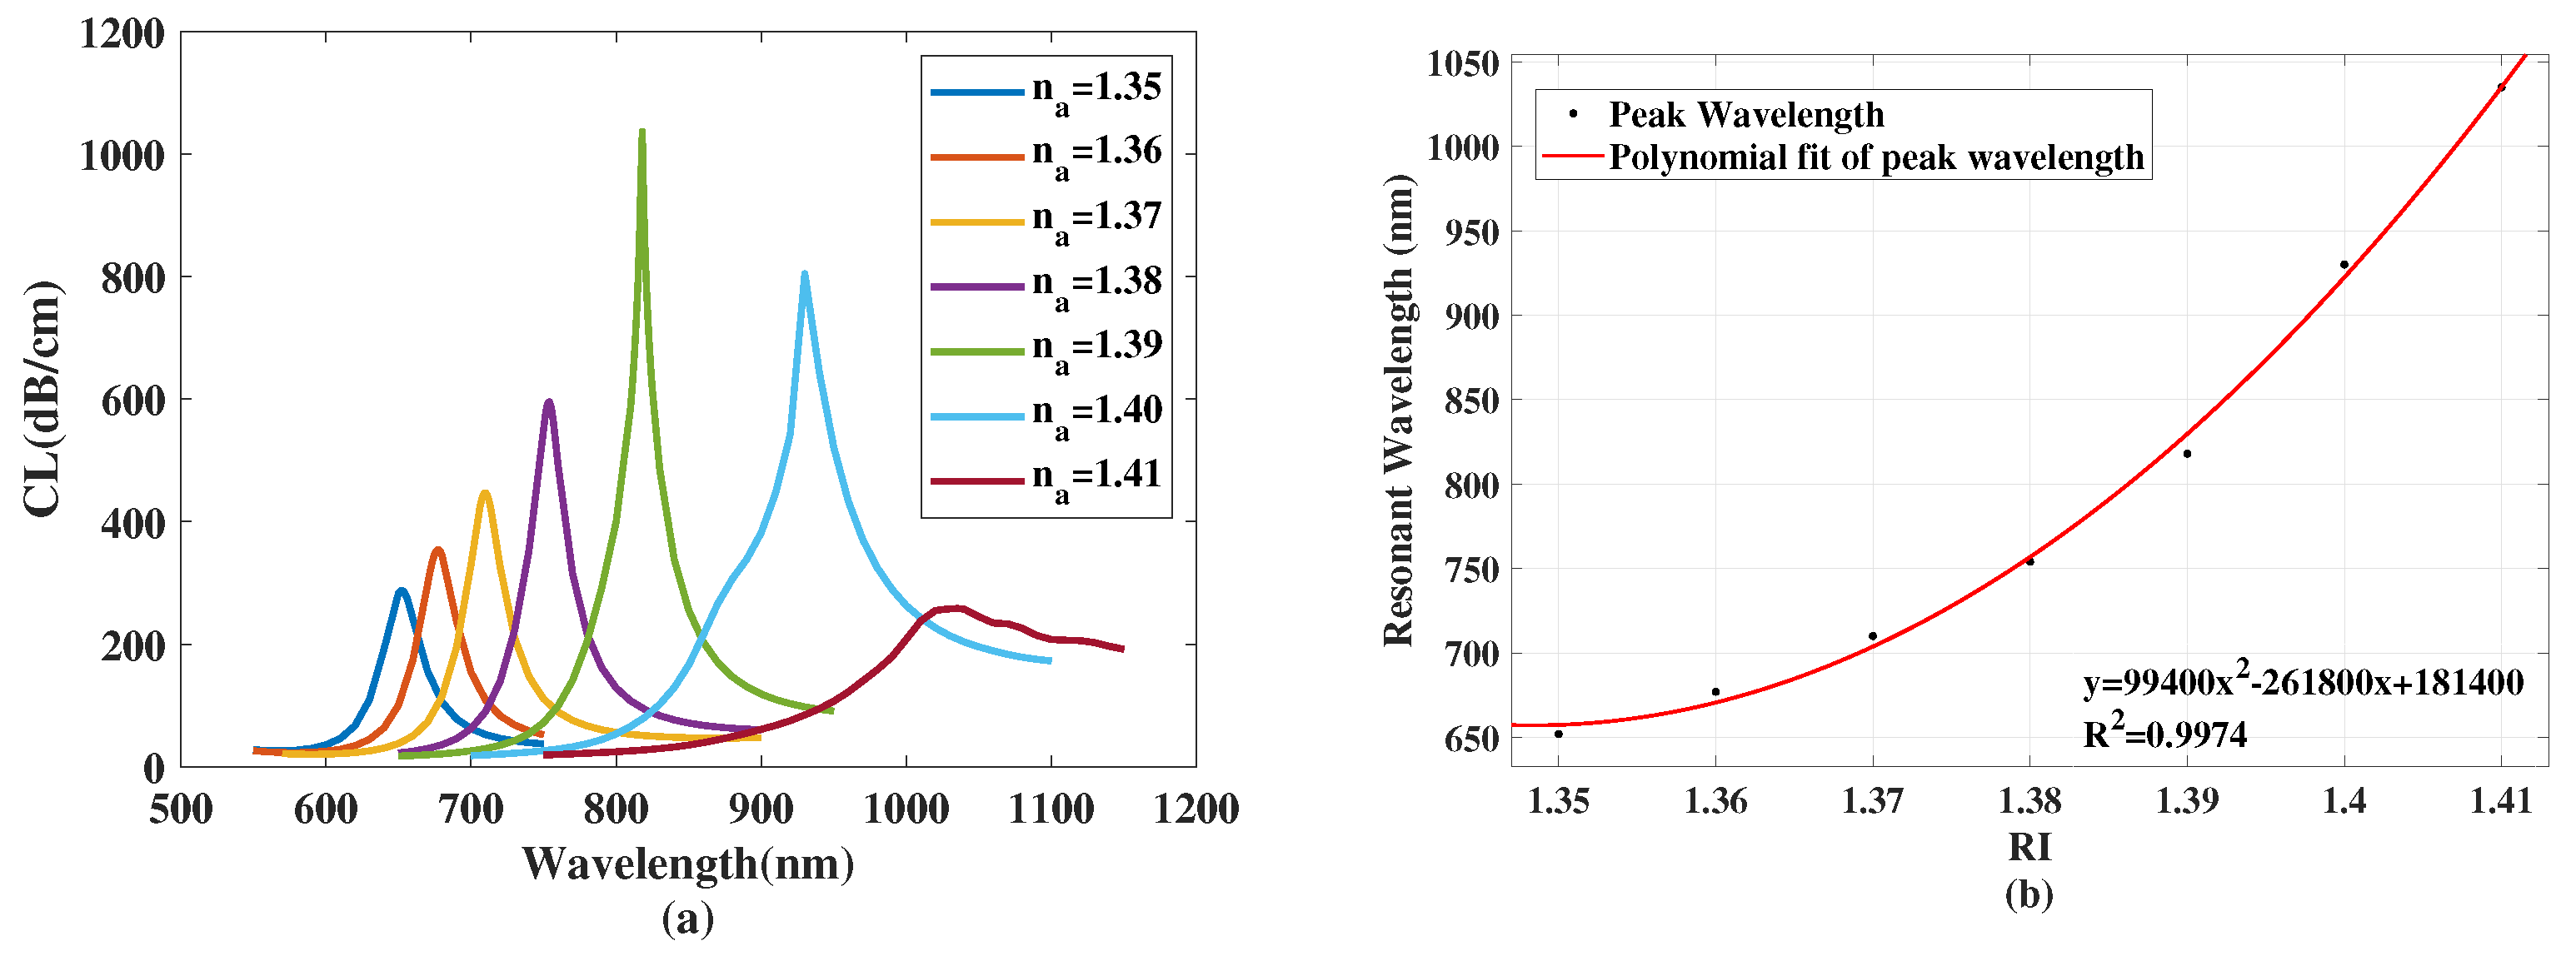
5. Sensing Performance

By optimizing the parameters of the proposed biosensor structure, we conclude that the parameters of the final biosensor structure are as follows: τ 1 = 60 nm, τ 2 = 60 nm, a = 1.5 μ m, b = 0.75 μ m, d 1 = 1.8 μ m, d 2 = 2.2 μ m, d 3 = 2.4 μ m, and d 4 = 2.0 μ m. In this section, we will discuss the sensing performance of the proposed biosensor structure.
Figure 16a demonstrates the CL curve of the x polarized mode of area A with a variation in the RI from from 1.35 to 1.41.
From Figure 16a, with a variation in the RI, the CL curve of the x polarized mode of area A witnesses a red shift, with the corresponding peak value of the CL curve increasing first and then decreasing significantly with the rising wavelength value. Figure 16b illustrates the variation in the λ S P R value of the x polarized mode of area A corresponding to RI and a fitting result. From Figure 16b, the fitting result of the λ S P R value and the RI is y = 99 , 400 x 2 261 , 800 x + 181 , 400 . The λ S P R value has the following variation sequence: 652, 677, 710, 754, 818, 930, and 1035 nm with the following changing sequence for the RI: 1.35, 1.36, 1.37, 1.38, 1.39, 1.40, and 1.41. In accordance with Equation (5), the corresponding S n values are, respectively, calculated as 2500, 3300, 4400, 6400, 12,000, and 10,500 nm/RIU with a coverage of wavelength from 1.35 to 1.41. Thus, for metrics S n , the biosensor structure achieves the maximum resolution value as 8.333 × 10 6 RIU . Moreover, the average S n value can be calculated as 6383 nm/RIU.
Figure 17a illustrates the CL curve of the x polarized mode of area B with a variation in T from 0 to 60 °C. From Figure 17a, it can be seen that, with temperature increases, the CL curve of the x polarized mode of area B has a remarkable red shift, with the corresponding peak value of the CL curve gradually decreasing with wavelength increases. Figure 17b illustrates the variation in the λ S P R value of the x polarized mode of area B with temperature and a fitting result. From Figure 17b, it can be seen that the fitting result of the λ S P R value and the RI is y = 40 x + 1300 with a good linearity. The λ S P R value has the following changing sequence: 1300, 1340, 1380, 1420, 1460, 1500, and 1540 nm with the following variation sequence in temperature: 0, 10, 20, 30, 40, 50, and 60 °C. In accordance with Equation (6), the corresponding S T values are, respectively, calculated as 4.0, 4.0, 4.0, 4.0, 4.0, and 4.0 nm/°C with a coverage of temperature from 0 to 60 °C. Moreover, the average S T value can be calculated as 4.0 nm/°C.
In related works, the coupling of the core mode and different-order SPP modes along with different polarized states are applied for the measurement of RI and temperature. In this correspondence, the proposed biosensor structure is capable of measuring the RI and temperature simultaneously with two disjoint coverage of wavelength, which further achieves the simultaneous measurement of these two parameters. Table 3 demonstrates the comparison results of the S n value of the proposed biosensor structure with related works. Table 4 illustrates the comparison results of the S T value of the proposed biosensor structure with related works.

6. Conclusions

In summary, an easily manufactured photonic crystal fiber biosensor structure on the basis of surface plasmon resonance with the realization of simultaneous measurement of analyte RI and TSM temperature is proposed. With an internal and external gold coating attached to the structure and one film-adjacent hole filled with TSM, the proposed biosensor structure achieves the measurement of both the RI and temperature simultaneously with two disjoint coverage of wavelength. The simulation and calculation results illustrate that the average and maximum S n values of the proposed structure reach 6383 nm/RIU and 12,000 nm/RIU with a coverage of RI from 1.35 to 1.41. Moreover, the S T value of the proposed structure achieves 4.00 nm/°C with a coverage of temperature from 0 to 60 °C. The proposed biosensor structure is expected to have a wide range of applications in the fields of medical diagnostics and environmental assessment.

Author Contributions

Conceptualization, W.L.; methodology, H.Z.; software, W.L.; validation, M.J.; formal analysis, W.L. and J.X.; investigation, Y.C.; resources, W.L. and M.J.; data curation, W.L. and J.X.; writing—original draft preparation, W.L.; writing—review and editing, W.L. and H.Z.; visualization, W.L. and Y.C.; supervision, H.Z.; project administration, H.Z. All authors have read and agreed to the published version of the manuscript.

Funding

This research received no external funding.

Data Availability Statement

The datasets generated during the current study are available from the corresponding author upon reasonable request.

Conflicts of Interest

The authors declare no conflict of interest.

Abbreviations

The following abbreviations are used in this manuscript:
SPRSurface Plasmon Resonance
PCFPhotonic Crystal Fiber
RIRefractive Index
WSWavelength Sensitivity
ASAmplitude Sensitivity
FEMFinite Element Method
CLConfinement Loss
TSMTemperature-Sensitive Materials

References

  1. Li, H.; Zhang, L. Photocatalytic performance of different exposed crystal facets of BiOCl. Curr. Opin. Green Sustain. Chem. 2017, 6, 48–56. [Google Scholar] [CrossRef]
  2. Zhu, X.; Gao, T. Chapter 10—Spectrometry. In Nano-Inspired Biosensors for Protein Assay with Clinical Applications; Li, G., Ed.; Elsevier: Amsterdam, The Netherlands, 2019; pp. 237–264. [Google Scholar] [CrossRef]
  3. Homola, J.; Koudela, I.; Yee, S.S. Surface plasmon resonance sensors based on diffraction gratings and prism couplers: Sensitivity comparison. Sens. Actuators B Chem. 1999, 54, 16–24. [Google Scholar] [CrossRef]
  4. Shafkat, A.; Rashed, A.N.Z.; El-Hageen, H.M.; Alatwi, A.M. Design and analysis of a single elliptical channel photonic crystal fiber sensor for potential malaria detection. J. Sol-Gel Sci. Technol. 2021, 98, 202–211. [Google Scholar] [CrossRef]
  5. Mittal, S.; Saharia, A.; Ismail, Y.; Petruccione, F.; Bourdine, A.V.; Morozov, O.G.; Demidov, V.V.; Yin, J.; Singh, G.; Tiwari, M. Spiral Shaped Photonic Crystal Fiber-Based Surface Plasmon Resonance Biosensor for Cancer Cell Detection. Photonics 2023, 10, 230. [Google Scholar] [CrossRef]
  6. Gupta, A.; Singh, T.; Singh, R.K.; Tiwari, A. Numerical Analysis of Coronavirus Detection Using Photonic Crystal Fibre–Based SPR Sensor. Plasmonics 2023, 18, 577–585. [Google Scholar] [CrossRef]
  7. Markos, C.; Travers, J.C.; Abdolvand, A.; Eggleton, B.J.; Bang, O. Hybrid photonic-crystal fiber. Rev. Mod. Phys. 2017, 89, 045003. [Google Scholar] [CrossRef] [Green Version]
  8. Prabowo, B.A.; Purwidyantri, A.; Liu, K.C. Surface Plasmon Resonance Optical Sensor: A Review on Light Source Technology. Biosensors 2018, 8, 80. [Google Scholar] [CrossRef] [Green Version]
  9. Mittal, S.; Sharma, T.; Tiwari, M. Surface plasmon resonance based photonic crystal fiber biosensors: A review. Mater. Today Proc. 2021, 43, 3071–3074. [Google Scholar] [CrossRef]
  10. Rifat, A.A.; Ahmed, R.; Yetisen, A.K.; Butt, H.; Sabouri, A.; Mahdiraji, G.A.; Yun, S.H.; Adikan, F.M. Photonic crystal fiber based plasmonic sensors. Sens. Actuators B Chem. 2017, 243, 311–325. [Google Scholar] [CrossRef]
  11. Liu, C.; Lü, J.; Liu, W.; Wang, F.; Chu, P.K. Overview of refractive index sensors comprising photonic crystal fibers based on the surface plasmon resonance effect. Chin. Opt. Lett. 2021, 19, 102202. [Google Scholar] [CrossRef]
  12. Chen, X.; Xia, L.; Li, C. Surface Plasmon Resonance Sensor Based on a Novel D-Shaped Photonic Crystal Fiber for Low Refractive Index Detection. IEEE Photonics J. 2018, 10, 1–9. [Google Scholar] [CrossRef]
  13. Mollah, M.A.; Islam, S.R.; Yousufali, M.; Abdulrazak, L.F.; Hossain, M.B.; Amiri, I. Plasmonic temperature sensor using D-shaped photonic crystal fiber. Results Phys. 2020, 16, 102966. [Google Scholar] [CrossRef]
  14. Huang, H.; Zhang, Z.; Yu, Y.; Zhou, L.; Tao, Y.; Li, G.; Yang, J. A Highly Magnetic Field Sensitive Photonic Crystal Fiber Based on Surface Plasmon Resonance. Sensors 2020, 20, 5193. [Google Scholar] [CrossRef]
  15. Wei, Y.; Shi, C.; Zhao, X.; Liu, C.; Li, L.; Wang, R.; Liu, C.; Zhu, D.; Zhang, Y.; Liu, Z. S-type fiber surface plasmon resonance strain sensor. Appl. Opt. 2022, 61, 7912–7916. [Google Scholar] [CrossRef]
  16. Rakibul Islam, M.; Khan, M.M.I.; Mehjabin, F.; Alam Chowdhury, J.; Islam, M. Design of a fabrication friendly & highly sensitive surface plasmon resonance-based photonic crystal fiber biosensor. Results Phys. 2020, 19, 103501. [Google Scholar] [CrossRef]
  17. Wang, G.; Lu, Y.; Duan, L.; Yao, J. A Refractive Index Sensor Based on PCF with Ultra-Wide Detection Range. IEEE J. Sel. Top. Quantum Electron. 2021, 27, 1–8. [Google Scholar] [CrossRef]
  18. Fu, Y.; Liu, M.; Shum, P.; Qin, Y. PCF based surface plasmon resonance temperature sensor with ultrahigh sensitivity. Optik 2022, 250, 168345. [Google Scholar] [CrossRef]
  19. Liu, Y.; Li, S.; Chen, H.; Li, J.; Zhang, W.; Wang, M. Surface Plasmon Resonance Induced High Sensitivity Temperature and Refractive Index Sensor Based on Evanescent Field Enhanced Photonic Crystal Fiber. J. Light. Technol. 2020, 38, 919–928. [Google Scholar] [CrossRef]
  20. Zhang, G.; Ge, Q.; Wang, H.; Wu, X.; Yu, B. Stress applying TPMF based sensor for simultaneous temperature and strain measurement. Optik 2022, 254, 168636. [Google Scholar] [CrossRef]
  21. An, W.; Li, C.; Wang, D.; Chen, W.; Guo, S.; Gao, S.; Zhang, C. Flat Photonic Crystal Fiber Plasmonic Sensor for Simultaneous Measurement of Temperature and Refractive Index with High Sensitivity. Sensors 2022, 22, 9028. [Google Scholar] [CrossRef]
  22. Pardo, D.; Matuszyk, P.J.; Puzyrev, V.; Torres-Verdín, C.; Nam, M.J.; Calo, V.M. Chapter 7—Absorbing boundary conditions. In Modeling of Resistivity and Acoustic Borehole Logging Measurements Using Finite Element Methods; Pardo, D., Matuszyk, P.J., Puzyrev, V., Torres-Verdín, C., Nam, M.J., Calo, V.M., Eds.; Elsevier: Amsterdam, The Netherlands, 2021; pp. 219–246. [Google Scholar] [CrossRef]
  23. Ping, P.; Zhang, Y.; Xu, Y. A multiaxial perfectly matched layer (M-PML) for the long-time simulation of elastic wave propagation in the second-order equations. J. Appl. Geophys. 2014, 101, 124–135. [Google Scholar] [CrossRef]
  24. Tong, K.; Cai, Z.; Wang, J.; Liu, Y. D-type photonic crystal fiber sensor based on metal nanowire array. Optik 2020, 218, 165010. [Google Scholar] [CrossRef]
  25. Akowuah, E.K.; Gorman, T.; Ademgil, H.; Haxha, S.; Robinson, G.K.; Oliver, J.V. Numerical Analysis of a Photonic Crystal Fiber for Biosensing Applications. IEEE J. Quantum Electron. 2012, 48, 1403–1410. [Google Scholar] [CrossRef]
  26. Vial, A.; Grimault, A.S.; Macías, D.; Barchiesi, D.; de la Chapelle, M.L. Improved analytical fit of gold dispersion: Application to the modeling of extinction spectra with a finite-difference time-domain method. Phys. Rev. B 2005, 71, 085416. [Google Scholar] [CrossRef]
  27. Liu, Q.; Li, S.; Chen, H.; Li, J.; Fan, Z. High-sensitivity plasmonic temperature sensor based on photonic crystal fiber coated with nanoscale gold film. Appl. Phys. Express 2015, 8, 046701. [Google Scholar] [CrossRef]
  28. Yan, X.; Wang, Y.; Cheng, T.; Li, S. Photonic Crystal Fiber SPR Liquid Sensor Based on Elliptical Detective Channel. Micromachines 2021, 12, 408. [Google Scholar] [CrossRef]
  29. Namihira, Y.; Liu, J.; Koga, T.; Begum, F.; Hossain, M.A.; Zou, N.; Kaijage, S.; Hirako, Y.; Higa, H.; Islam, M. Design of highly nonlinear octagonal photonic crystal fiber with near-zero flattened dispersion at 1.31 um waveband. Opt. Rev. 2011, 18, 436–440. [Google Scholar] [CrossRef]
  30. Lopez, G.; Estevez, M.C.; Soler, M.; Lechuga, L. Recent advances in nanoplasmonic biosensors: Applications and lab-on-a-chip integration. Nanophotonics 2016, 6, 123–136. [Google Scholar] [CrossRef] [Green Version]
  31. Ekgasit, S.; Thammacharoen, C.; Yu, F. Evanescent Field in Surface Plasmon Resonance and Surface Plasmon Field-Enhanced Fluorescence Spectroscopies. Anal. Chem. 2004, 76, 2210–2219. [Google Scholar] [CrossRef] [PubMed]
  32. Mitu, S.; Ahmed, K.; Hossain, M.; Paul, B.K.; Nguyen, T.; Dhasarathan, V. Design of Magnetic Fluid Sensor Using Elliptically Hole Assisted Photonic Crystal Fiber (PCF). J. Supercond. Nov. Magn. 2020, 33, 2189–2198. [Google Scholar] [CrossRef]
  33. Wang, Y.; Li, S.; Wang, M.; Yu, P. Refractive index sensing and filtering characteristics of side-polished and gold-coated photonic crystal fiber with a offset core. Opt. Laser Technol. 2021, 136, 106759. [Google Scholar] [CrossRef]
  34. Wang, M.; Chen, H.; Jing, X.; Li, S.; Ma, M.; Zhang, W.; Zhang, Y. Temperature sensor based on modes coupling effect in a liquid crystal-filled microstructured optical fiber. Optik 2020, 219, 165044. [Google Scholar] [CrossRef]
  35. Liao, J.; Ding, Z.; Xie, Y.; Wang, X.; Zeng, Z.; Huang, T. Ultra-broadband and highly sensitive surface plasmon resonance sensor based on four-core photonic crystal fibers. Opt. Fiber Technol. 2020, 60, 102316. [Google Scholar] [CrossRef]
  36. Yin, Z.; Jing, X.; Bai, G.; Wang, C.; Liu, C.; Gao, Z.; Li, K. A broadband SPR dual-channel sensor based on a PCF coated with sodium-silver for refractive index and temperature measurement. Results Phys. 2022, 41, 105943. [Google Scholar] [CrossRef]
  37. Guo, Y.; Li, J.; Li, S.; Liu, Y.; Meng, X.; Bi, W.; Lu, H.; Cheng, T.; Hao, R. Amphibious sensor of temperature and refractive index based on D-shaped photonic crystal fibre filled with liquid crystal. Liq. Cryst. 2020, 47, 882–894. [Google Scholar] [CrossRef]
  38. Zhang, J.; Yuan, J.; Qu, Y.; Qiu, S.; Mei, C.; Zhou, X.; Yan, B.; Wu, Q.; Wang, K.; Sang, X.; et al. A Surface Plasmon Resonance-Based Photonic Crystal Fiber Sensor for Simultaneously Measuring the Refractive Index and Temperature. Polymers 2022, 14, 3893. [Google Scholar] [CrossRef]
Figure 1. (a) A 3D view of the proposed structure. (b) The 2D schematic of the proposed structure. Insert sub figures (i) and (ii), respectively, show the mode field distribution of area A and area B.
Crystals 13 00972 g001
Figure 2. The 2D schematic of the biosensor structure in the fabrication process.
Crystals 13 00972 g002
Figure 3. (a) The CL curve of the x polarized mode of area A, and the real part of the effective RI of the core mode and zero-order SPP mode when analyte RI is 1.38. (bd) The mode field distributions of the proposed biosensor structure simulated with wavelengths, respectively, chosen as 670, 754, and 890 nm.
Crystals 13 00972 g003
Figure 4. (a) The CL curve of the x polarized mode of area B, and a real part of the effective RI of the core mode and second-order SPP mode when the temperature is 40 °C. (bd) The mode field distributions of the proposed biosensor structure simulated with wavelengths, respectively, chosen as 1120, 1250, and 1470 nm.
Crystals 13 00972 g004
Figure 5. The CL curve of the x polarized mode of area A with τ 2 respectively set as 50, 60, and 70 nm, and analyte RI is 1.36, 1.39, and 1.40.
Crystals 13 00972 g005
Figure 6. The CL curve of the x polarized mode of area A with a respectively chosen as 1.4, 1.5, and 1.6 μ m, and analyte RI is set as 1.36, 1.39, and 1.40.
Crystals 13 00972 g006
Figure 7. The CL curve of the x polarized mode of area A with b respectively set as 0.5, 0.6, and 0.7 μ m, and analyte RI is set as 1.36, 1.39, and 1.40.
Crystals 13 00972 g007
Figure 8. (a) The CL curve of the x polarized mode of area A with the analyte RI set as 1.36 and the θ 1 , respectively, chosen as 10 , 0 , 15 , and 30 . (b) The CL curve of the x polarized mode of area A with the analyte RI set as 1.40 and the θ 1 , respectively, chosen as 10 , 0 , 15 , and 30 .
Crystals 13 00972 g008
Figure 9. (a) The CL curve of the x polarized mode of area A with the analyte RI set as 1.36 and θ 2 , respectively, set as 10 , 0 , and 10 . (b) The CL curve of the x polarized mode of area A with the analyte RI set as 1.40 and θ 2 , respectively, set as 10 , 0 , and 10 .
Crystals 13 00972 g009
Figure 10. The CL curve of the x polarized mode of area B with d 3 respectively chosen as 2.0, 2.2, and 2.4 μ m, and with temperature T is 0 and 50 °C.
Crystals 13 00972 g010
Figure 11. The CL curve of the x polarized mode of area B with d 4 respectively chosen as 1.6, 1.8, and 2.0 μ m, and T is 0 and 50 °C.
Crystals 13 00972 g011
Figure 12. The CL curve of the x polarized mode of area B with τ 1 respectively chosen as 40, 50, 60, and 70 nm, and T is 0 and 50 °C.
Crystals 13 00972 g012
Figure 13. The CL curve of the x polarized mode of area B with d 1 respectively chosen as 1.4, 1.6, and 1.8 μ m, and T is 0 and 50 °C.
Crystals 13 00972 g013
Figure 14. The CL curve of the x polarized mode of area B with d 2 respectively chosen as 1.8, 2.0, and 2.2 μ m, and T is 0 and 50 °C.
Crystals 13 00972 g014
Figure 15. The CL curve of the x polarized mode of area A with b respectively chosen as 0.75 and 0.78 μ m, τ 2 and a set as 60 nm and 1.5 μ m, and analyte RI set as 1.36, 1.39, and 1.40.
Crystals 13 00972 g015
Figure 16. (a) The CL curve of the x polarized mode of area A with a variation in the RI from 1.35 to 1.41. (b) Variation in the λ S P R value of the x polarized mode of area A corresponding to the RI and a fitting result.
Crystals 13 00972 g016
Figure 17. (a) The CL curve of the x polarized mode of area B with a variation in T from 0 to 60 °C. (b) Variation in λ S P R value of the x polarized mode of area B with temperature and a fitting result.
Crystals 13 00972 g017
Table 1. Effects of structural parameters on sensing performance of core A.
Parameter λ SPR   1 Max S n ValueEnvelopeDistortion
τ 2  2Red Shift  3Red ShiftDisappear
a Red Shift Blue Shift, WidenEnhanced
b Red ShiftWidenN/A
1 resonant wavelength; 2 increases; 3 firstly increases and then decreases.
Table 2. Effects of structural parameters on sensing performance of x polarized mode of area B.
Parameter λ SPR   1 Max S T ValueEnvelope
d 3  2Blue ShiftBlue Shift Widen
d 4 Red ShiftRed Shift
τ 1 Blue Shift  3Blue Shift
d 1 Blue ShiftBlue Shift
d 2 Red ShiftRed Shift
1 resonant wavelength; 2 increases; 3 firstly increases and then decreases.
Table 3. Comparison results of the S n value of the proposed biosensor structure with related works.
λ RI S n Refworks
500~10001.35~1.418400 (Max)[36]
700~16001.0~1.62275 (Max)[37]
600~9501.35~1.404520 (Avg) 8100 (Max)[38]
550~11501.35~1.416383 (Avg) 12,000 (Max)This work
Table 4. Comparison results of the S T value of the proposed biosensor structure with related works.
λ T S T Refworks
1000~160010~6010.2 (Max)[36]
700~160015~509.09 (Max)[37]
1200~180020~604.83 (Avg) 5.1 (Max)[38]
1100~17000~604 (Avg)This work
Disclaimer/Publisher’s Note: The statements, opinions and data contained in all publications are solely those of the individual author(s) and contributor(s) and not of MDPI and/or the editor(s). MDPI and/or the editor(s) disclaim responsibility for any injury to people or property resulting from any ideas, methods, instructions or products referred to in the content.

