3.2. Ligation Model Compared to Experimental Co-Crystal Ligation
The ligation product distributions we experimentally obtained should shed light on the stochastic process of ligation. Using a destructive assay, densitometric analysis of electrophoresis results on ssDNA recovered from dissolved crystals, we quantified the population ratio of bands assigned to non-modified DNA blocks as well as fused 2-mer, 3-mer, etc. For selected gels, we also obtained TapeStation results (Figure S1). The relative population of the end-product distribution was fairly consistent for gel band populations measured with TBE-urea gels in ImageJ compared to the automated TapeStation analysis (Figure S1).
Next, we sought to calculate a global performance metric for the ligation yield,
PLIG, as the fraction of all possible DNA–DNA nick sites throughout a crystal that were ligated. To quantify the ligation yield throughout an entire crystal, we analyzed the implications of the final DNA product distribution recovered after the crystal is dissolved and the protein components are removed. If we count the number of DNA oligos of each length (
) that were present in the crystal, and we ignore edge effects, we can estimate the total number of single-stranded breaks (SSB) as
. For the same crystal, the estimated total number of original single-strand breaks (regardless of final ligation status) would be
. For example, adding a single fused 3-mer to the crystal increases the SSB tally by one, but increases the tally of all possible junctions by three. Then, to compute the total probability of encountering SSB, we calculate:
In the final equation,
is the mole fraction for
-mer oligos. Therefore, to estimate the
, we can use estimated mole fractions from electrophoresis and densitometry (Figure S2 and
Figure 4 and
Table 4). Accurately calculating
does require including the small mole fractions for higher-order products (Table S3) since longer products contribute proportionally more to
. To estimate the uncertainty in each
, we used 500 numerical trials in which random noise was added to
to mimic the densitometry measurement error. We used noise comparable to
for the highest-order ligation products (normal variate with standard deviation 0.03), such that the smallest
values would regularly fall to 0 after the addition of random noise.
Given the probability of encountering a single-stranded break in the crystal (PSSB), it is trivial to calculate the probability of each terminal phosphate having undergone ligation (PLIG), since PLIG = 1 − PSSB. In the context of the random ligation model (RLM), ligation events throughout the crystal are independent and occur with equal probability at all nick sites. This is a physically plausible model if the intra-crystal transport rate for EDC exceeds the rate of reaction. Therefore, the incidence of double-stranded breaks within the crystal should occur with the joint probability of independent events, PDSB = (PSSB)2.
Table 4.
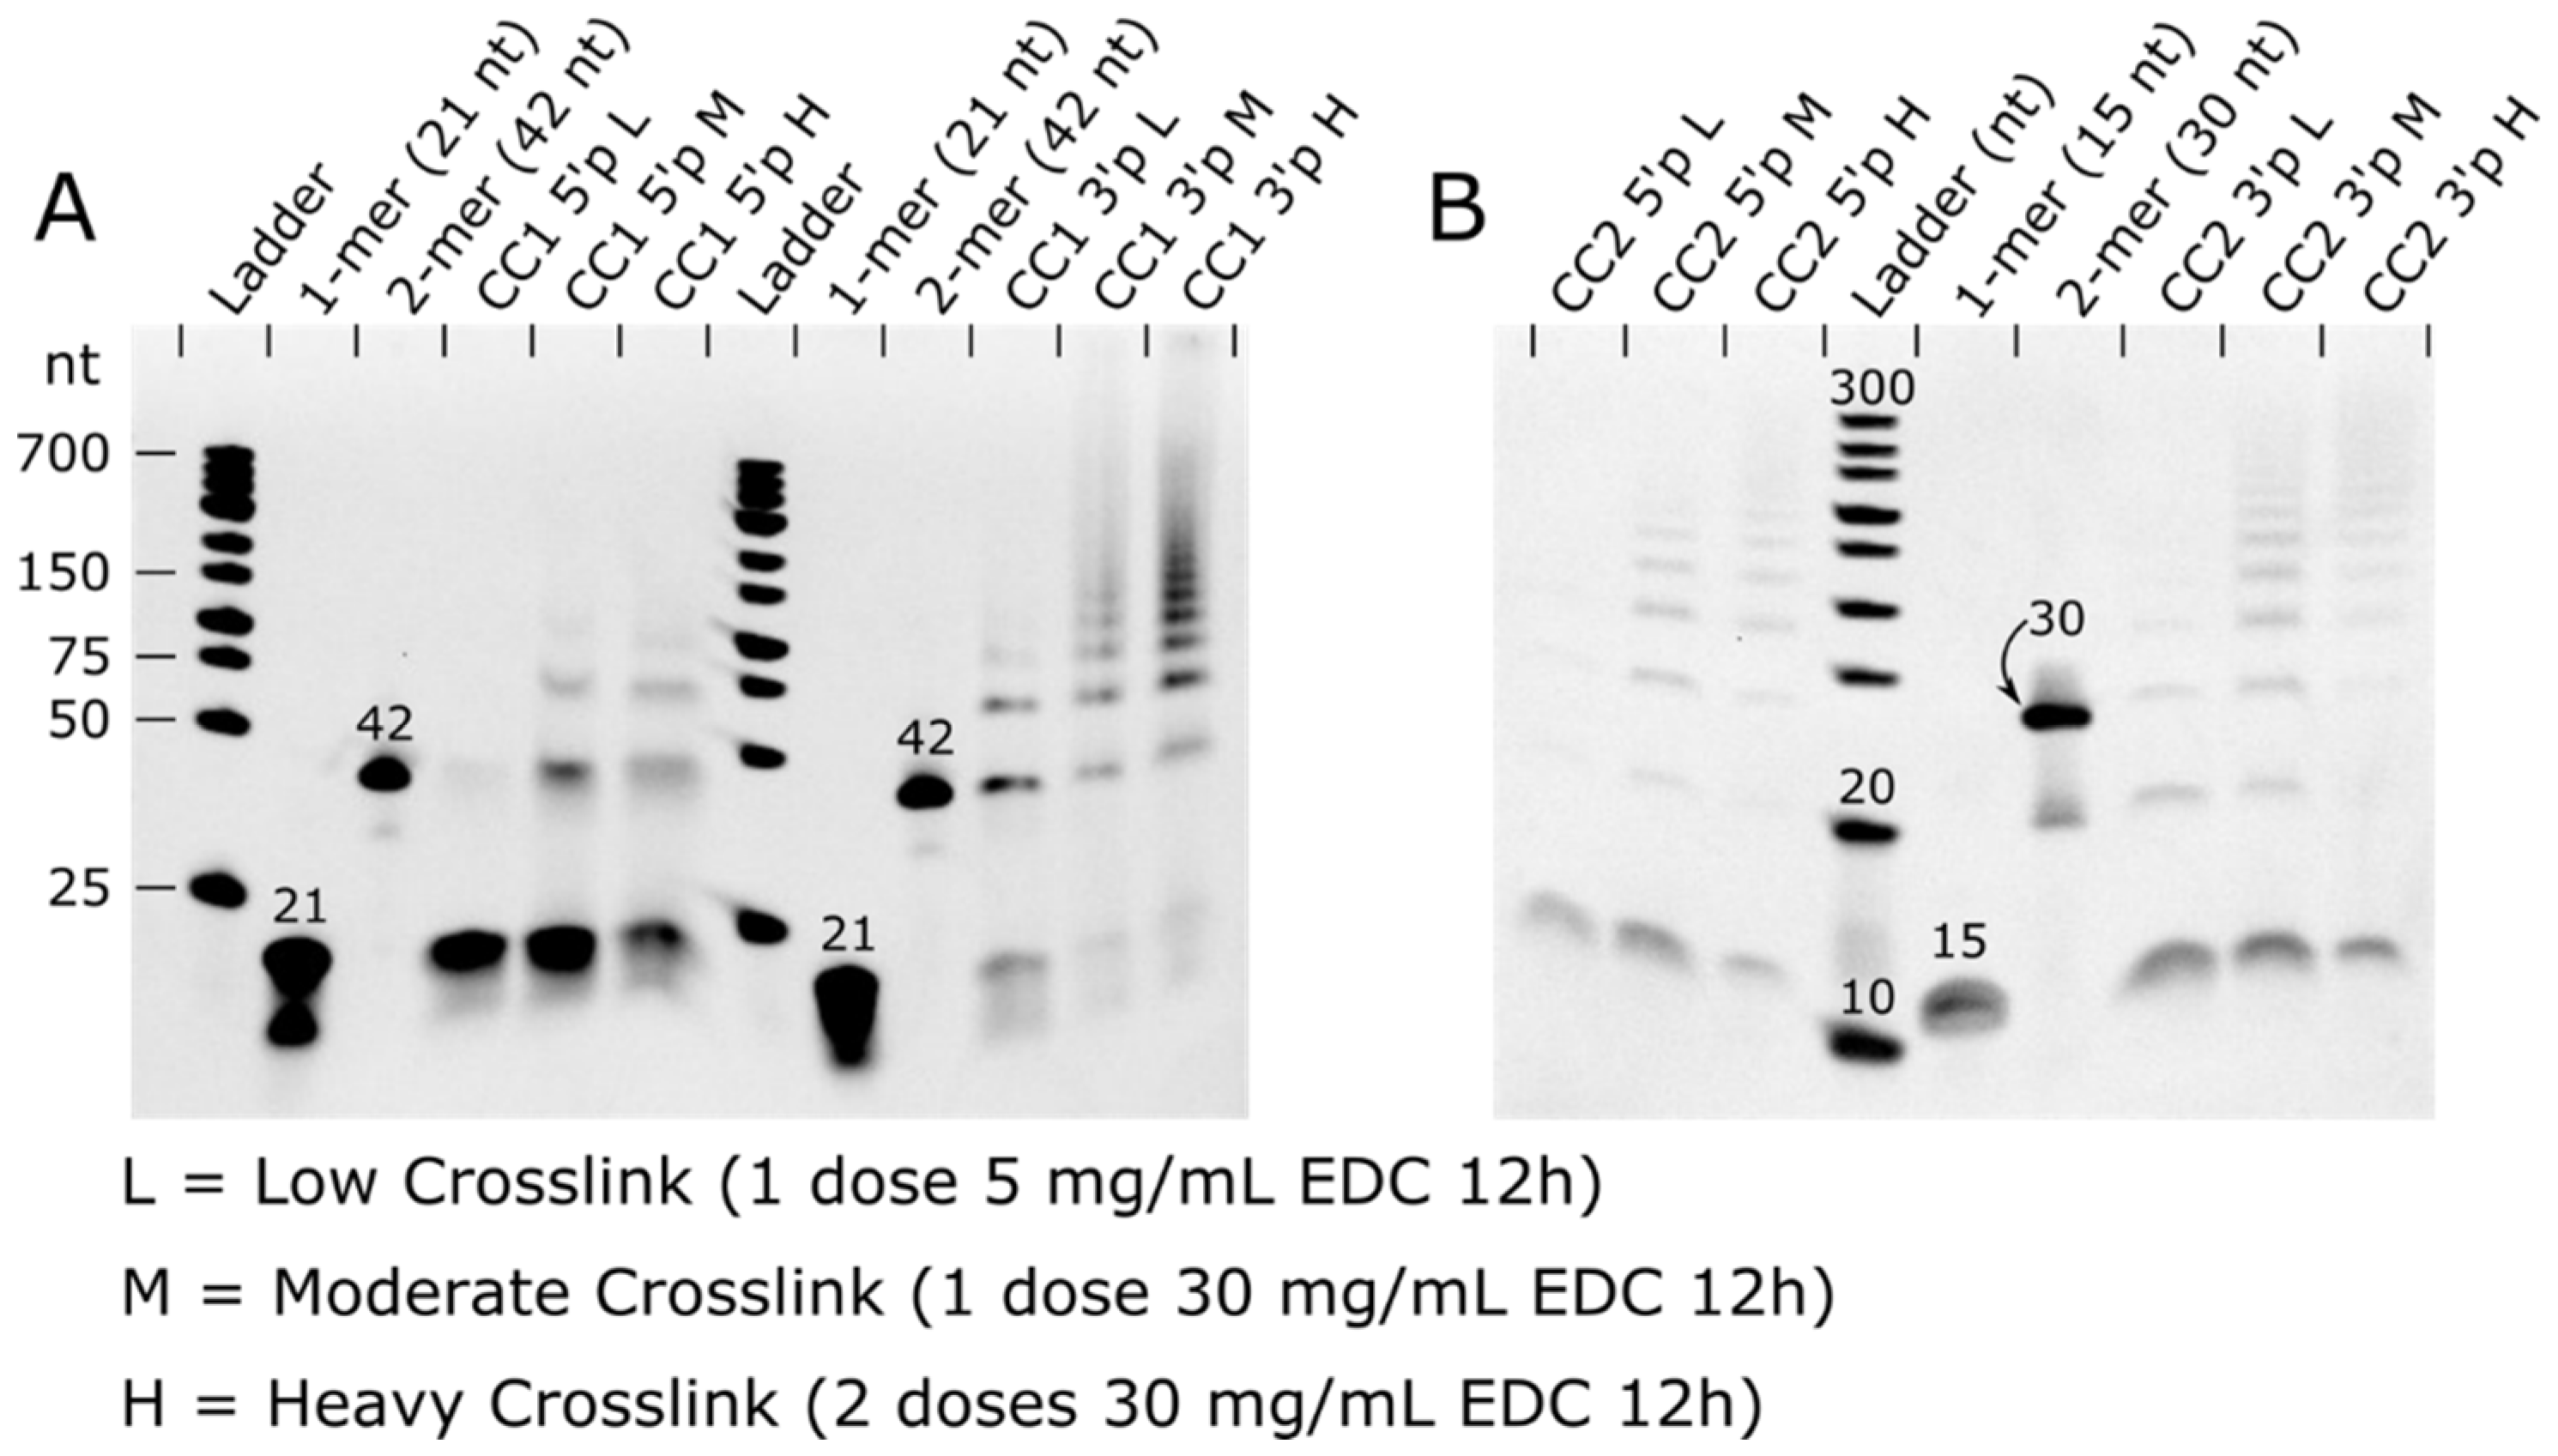
Distribution of DNA block sizes as a function of crosslinking protocol and 3′ vs. 5′ terminal phosphates. The data shown correspond with the gel lanes in
Figure 4. The crosslinking protocols low, medium, and high were 1 dose of 5 mg/mL EDC for 12 h, 1 dose of 30 mg/mL EDC for 12 h, and 2 doses of 30 mg/mL EDC for 12 h each, respectively. The values in this table are weighted so that the DNA length and dye intensity contributes to the final value. Unweighted values are found in Table S2. The full table, including estimated mole fractions for higher-order products, is found in Table S3.
PSSB,
PLIG, and
PDSB were calculated for each crosslinked crystal sample. Uncertainties are standard deviations in derived quantities after 500 trials in which noise (standard deviation 0.03) is introduced into relative band intensities.
Table 4.
Distribution of DNA block sizes as a function of crosslinking protocol and 3′ vs. 5′ terminal phosphates. The data shown correspond with the gel lanes in
Figure 4. The crosslinking protocols low, medium, and high were 1 dose of 5 mg/mL EDC for 12 h, 1 dose of 30 mg/mL EDC for 12 h, and 2 doses of 30 mg/mL EDC for 12 h each, respectively. The values in this table are weighted so that the DNA length and dye intensity contributes to the final value. Unweighted values are found in Table S2. The full table, including estimated mole fractions for higher-order products, is found in Table S3.
PSSB,
PLIG, and
PDSB were calculated for each crosslinked crystal sample. Uncertainties are standard deviations in derived quantities after 500 trials in which noise (standard deviation 0.03) is introduced into relative band intensities.
| Parent Crystal | CC1-3′P | CC1-3′P | CC1-3′P | CC1-5′P | CC1-5′P | CC1-5′P |
|---|
| Crosslinking Protocol | low | medium | high | low | medium | high |
| DNA block size | [%] | [%] | [%] | [%] | [%] | [%] |
| 1 | 58.7 | 30.0 | 24.9 | 98.6 | 91.6 | 82.1 |
| 2 | 18.7 | 16.8 | 14.9 | 1.4 | 7.3 | 9.9 |
| 3 | 15.2 | 15.3 | 15.6 | | 1.0 | 6.3 |
| 4 | 5.0 | 11.0 | 11.0 | | 0.2 | 1.5 |
| 5 | 2.4 | 6.3 | 8.4 | | | 0.2 |
| 6 | | 6.5 | 6.9 | | | |
| 7 | | 4.4 | 5.8 | | | |
| 8 and above | | 9.7 | 12.5 | | | |
| * | 0.58 ± 0.01 | 0.28 ± 0.01 | 0.25 ± 0.01 | 0.99 ± 0.01 | 0.91 ± 0.02 | 0.78 ± 0.02 |
| 0.42 ± 0.01 | 0.72 ± 0.01 | 0.75 ± 0.01 | 0.01 ± 0.01 | 0.09 ± 0.02 | 0.22 ± 0.02 |
| 0.33 ± 0.01 | 0.08 ± 0.01 | 0.06 ± 0.005 | 0.97 ± 0.02 | 0.83 ± 0.04 | 0.61 ± 0.03 |
| Parent Crystal | CC2-3′P | CC2-3′P | CC2-3′P | CC2-5′P | CC2-5′P | CC2-5′P |
| Crosslinking Protocol | low | medium | high | low | medium | high |
| DNA block size | [%] | [%] | [%] | [%] | [%] | [%] |
| 1 | 94.4 | 80.3 | 74.4 | 96.9 | 84.8 | 72.2 |
| 2 | 2.6 | 4.8 | 3.3 | 1.2 | 5.6 | 3.1 |
| 3 | 1.5 | 4.5 | 4.4 | 1.9 | 4.9 | 7.7 |
| 4 | 0.8 | 3.6 | 3.7 | | 2.6 | 5.2 |
| 5 | 0.7 | 2.5 | 2.9 | | 1.1 | 2.9 |
| 6 | | 1.3 | 2.9 | | 1.0 | 2.7 |
| 7 | | 1.3 | 2.3 | | | 1.9 |
| 8 and above | | 1.7 | 6.1 | | | 4.3 |
| * | 0.90 ± 0.03 | 0.61 ± 0.03 | 0.45 ± 0.02 | 0.95 ± 0.02 | 0.75 ± 0.02 | 0.48 ± 0.01 |
| 0.10 ± 0.03 | 0.39 ± 0.03 | 0.55 ± 0.02 | 0.05 ± 0.02 | 0.25 ± 0.02 | 0.52 ± 0.01 |
| 0.82 ± 0.05 | 0.37 ± 0.05 | 0.20 ± 0.02 | 0.91 ± 0.04 | 0.57 ± 0.03 | 0.23 ± 0.01 |
This analysis of the electrophoresis experiments suggests that ~75% of the terminal phosphates within the most thoroughly crosslinked CC1-3′P crystal have undergone ligation. Furthermore, ~94% of the DNA–DNA junctions in this crystal had at least one ligated chain. The similarity in ligation yield for the medium- and high-dose cases leads to an important question. What factors are limiting the yield? Incomplete ligation could result if a random population of terminal phosphates are missing, or otherwise incapable of on-target ligation. We used simulations to verify that the predicted RLM product ratio did not change when we postulated that a random subset of nick sites is incapable of ligation. This makes sense because junctions that are randomly selected to be incapable of ligation are functionally equivalent to sites that are randomly selected to be ligated last.
It may also be possible that ligating one phosphate at a DNA–DNA junction would negatively affect neighboring ligation probabilities. However, evidence for such allostery is lacking. Instead, the observed product distributions for CC1 ligation outcomes (
Table 4), were close to the distributions predicted by the RLM (Figure S12). One small but consistent deviation from the RLM was a lower 2-mer, and higher 3-mer population than predicted. This observation seems to preclude the simplest negative allostery scenario (where one ligation event would reduce the probability at flanking sites). We cannot rule out the possibility that this discrepancy is an artifact associated with the gel electrophoresis densitometry.
The CC2 ligation outcomes (
Table 4) were significantly less consistent with distributions predicted by the RLM. Once more, the 3-mer population was often higher than expected, frequently exceeding the 2-mer population (which never happens in the RLM). This effect also seemed to extend to anomalously common 4-mers. A more striking divergence from the RLM prediction was the high population of non-ligated 1-mer blocks. Regardless of the RLM fit, the significant difference between the 1-mer mole fractions and the
PSSB values obtained from all the mole fractions strongly implicates that the RLM is lacking.
To investigate, we tested biased ligation model simulations. One possible explanation is that the ligation outcomes were driven partially by kinetics and molecular transport phenomena. Hypothetically, ligation sites near the crystal exterior might be more likely to be ligated than possible sites near the crystal center since reactive molecules must traverse the outer layers to react the interior. To determine the likely implications of this scenario, we conducted biased random ligation simulations (Protocol S3) that increased the probability of ligation events near the surface, decreased the probability at the center, and terminated the random ligation process at a set PSSB threshold. Perhaps counterintuitively, this spatial bias increased the predicted 1-mer mole fraction. A high 1-mer fraction is partially consistent with the observed product distribution for CC2. The overall lower ligation yield achieved for CC2 crystals compared to CC1 is also consistent with the hypothesis that the CC2 crystal interior is systematically under-ligated. Alternately, it could be the case that one of the two symmetry-distinct nick sites in the CC2 lattice has a significantly lower ligation yield, and therefore one of the two DNA oligos will be over-represented in the 1-mer population.


