Next Article in Journal
Rietveld Refinement and X-ray Absorption Study on the Bonding States of Lanthanum-Based Perovskite-Type Oxides La1−xCexCoO3
Next Article in Special Issue
Structure-Based Modeling of the Mechanical Behavior of Cross-Linked Enzyme Crystals
Previous Article in Journal
The Influence of Grain Boundaries on Crystal Structure and Tensile Mechanical Properties of Al0.1CoCrFeNi High-Entropy Alloys Studied by Molecular Dynamics Method
Previous Article in Special Issue
A New L-Proline Amide Hydrolase with Potential Application within the Amidase Process
 
 
Correction published on 14 April 2023, see Crystals 2023, 13(4), 675.
Article

Stabilizing DNA–Protein Co-Crystals via Intra-Crystal Chemical Ligation of the DNA

by
Abigail R. Orun
1,
Sara Dmytriw
2,
Ananya Vajapayajula
2 and
Christopher D. Snow
1,2,*
1
Department of Chemistry, Colorado State University, 1301 Center Ave, Fort Collins, CO 80523, USA
2
Department of Chemical and Biological Engineering, Colorado State University, 1370 Campus Delivery, Fort Collins, CO 80523, USA
*
Author to whom correspondence should be addressed.
Crystals 2022, 12(1), 49; https://doi.org/10.3390/cryst12010049
Submission received: 5 December 2021 / Revised: 19 December 2021 / Accepted: 21 December 2021 / Published: 30 December 2021 / Corrected: 14 April 2023
(This article belongs to the Special Issue State-of-the-Art Research in Biomolecular Crystals)

Abstract

:
Protein and DNA co-crystals are most commonly prepared to reveal structural and functional details of DNA-binding proteins when subjected to X-ray diffraction. However, biomolecular crystals are notoriously unstable in solution conditions other than their native growth solution. To achieve greater application utility beyond structural biology, biomolecular crystals should be made robust against harsh conditions. To overcome this challenge, we optimized chemical DNA ligation within a co-crystal. Co-crystals from two distinct DNA-binding proteins underwent DNA ligation with the carbodiimide crosslinking agent 1-ethyl-3-(3-dimethylaminopropyl)carbodiimide (EDC) under various optimization conditions: 5′ vs. 3′ terminal phosphate, EDC concentration, EDC incubation time, and repeated EDC dose. This crosslinking and DNA ligation route did not destroy crystal diffraction. In fact, the ligation of DNA across the DNA–DNA junctions was clearly revealed via X-ray diffraction structure determination. Furthermore, crystal macrostructure was fortified. Neither the loss of counterions in pure water, nor incubation in blood serum, nor incubation at low pH (2.0 or 4.5) led to apparent crystal degradation. These findings motivate the use of crosslinked biomolecular co-crystals for purposes beyond structural biology, including biomedical applications.

1. Introduction

Beyond serving as the fundamental components of life, proteins and DNA are also key building blocks for nanoscale self-assemblies. Biomolecular assemblies, ranging from 2D arrays to 3D crystals, are useful tools for structural biology, bio-catalysis, and biomedical applications [1,2,3]. Porous biomolecular crystals can even act as macromolecular scaffolds [4], providing structural details to guest macromolecules [5]. However, downstream applications of interest, including X-ray diffraction, are hindered by crystal fragility and intolerance to solvent conditions other than the crystal growth solution. In this study, we establish a protocol for the chemical ligation of DNA inside of crystals and we demonstrate structural resilience of crosslinked co-crystals which may further their application utility.
DNA assembly stability is a limiting factor for DNA nanotechnology and DNA crystals. While coding DNA sticky base overhangs can drive self-assembly, the non-covalent DNA base stacking interactions and Watson–Crick hydrogen bonds that stabilize the junctions are only stable under specific conditions. For example, crystallization conditions for DNA crystals typically feature high concentrations of divalent cations such as Mg(II) to balance the negative phosphate backbone of DNA [6]. DNA–protein co-crystals may be similarly reliant on counterions, particularly if counterions stabilize the DNA–protein binding event [7]. Crystal forms that bring DNA building blocks into close proximity are very sensitive to the counterion environment, and often dissolve or convert into a disordered aggregate when placed in water. To maximize application versatility, DNA structures should ideally be robust to solution variations, not just ionic strength but also temperature and pH [1]. Introducing covalent bonds across DNA–DNA interfaces has the potential to dramatically improve crystal macro-structure stability and could also improve X-ray diffraction.
Bioconjugation, or crosslinking, is a well-established strategy to improve the structural integrity of protein and DNA crystals [8]. The protein–protein interfaces found within protein crystals tend to be rich in primary amines and carboxylic acids. If all neighboring building blocks can be covalently linked, the resulting covalent organic framework can be a robust material. In traditional protein X-ray crystallography, glutaraldehyde, a highly reactive crosslinker, can increase crystal stability in varying solution conditions, and can even improve diffraction resolution [9,10]. In our previous work on protein crystals, we have found that glyoxal offers an effective alternative to glutaraldehyde [11,12]. Chemical crosslinking and photo-crosslinking methods for DNA crystals are also established in the literature [13,14,15]; however, we wanted to focus on a protocol in which the crosslinking does not require a specific sequence of DNA and does not add atoms to the structure (a zero-length crosslink).
Arguably the most natural form of sequence-independent DNA crosslinking is ligation, where the nicks dividing stacked dsDNA blocks are removed to generate longer contiguous DNA strands. For example, Li et al. used T4 DNA Ligase to ligate the DNA junctions within highly porous DNA crystals [16]. This elegant approach is limited to crystals that have large enough solvent channels for enzyme ingress. Here, we sought to optimize a chemical ligation alternative to the use of ligase that would be applicable to crystals with both large and small pores.
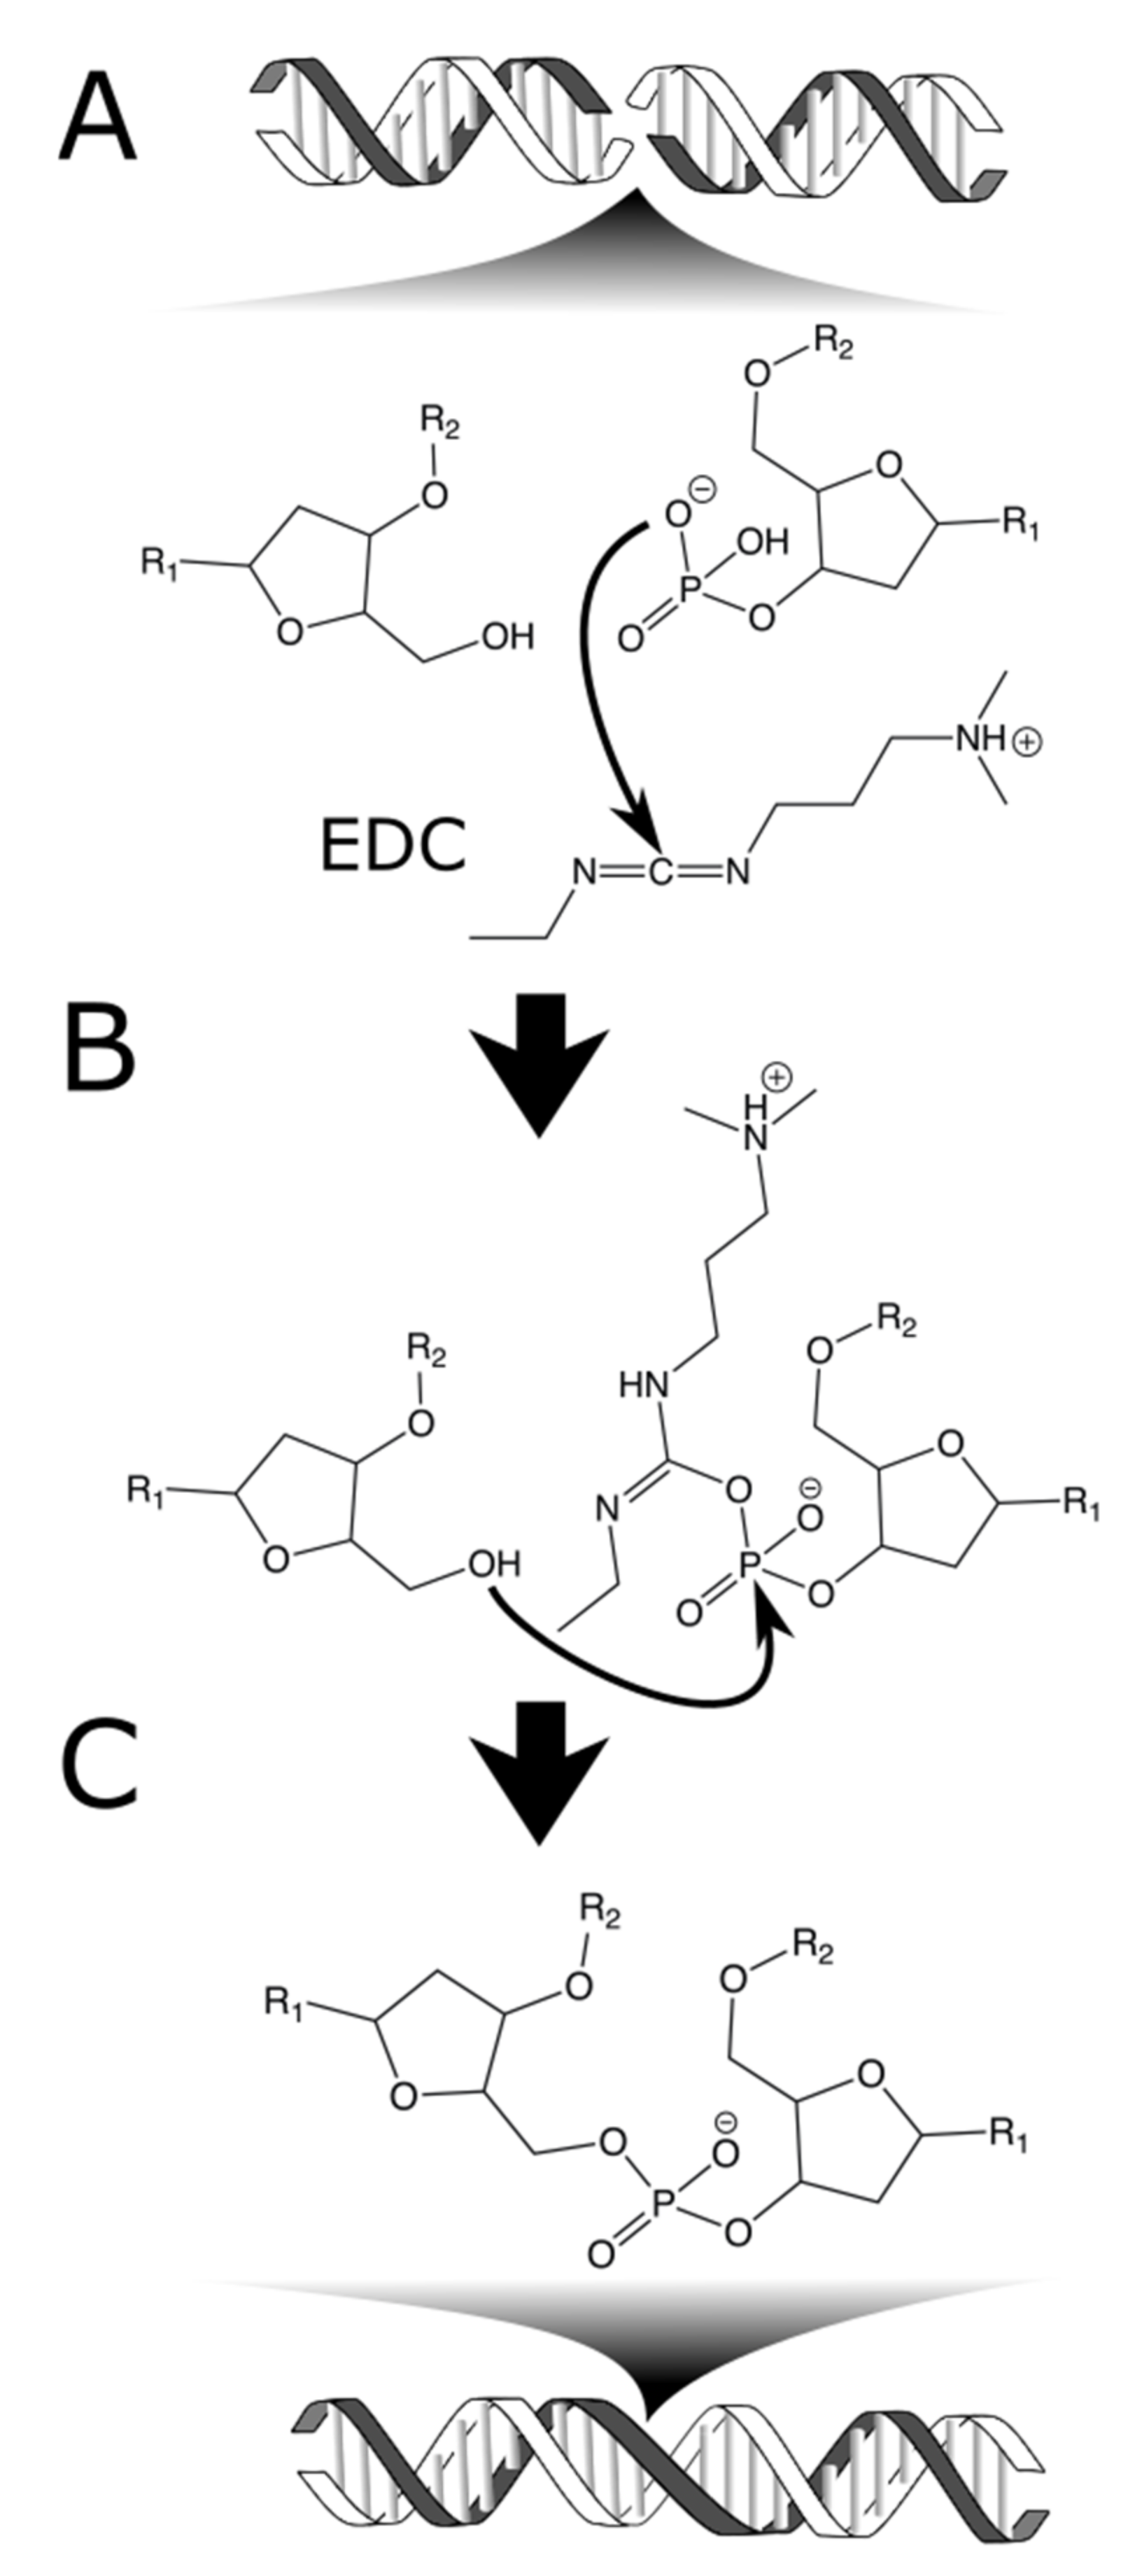
Our chemical ligation chemistry relies on 1-ethyl-3-(3-dimethylaminopropyl)carbodiimide (EDC), a water-soluble carbodiimide [8]. EDC is widely used, especially in protein conjugation, to crosslink primary amines to carboxylic acids. A less common chemistry for EDC is the activation of a terminal phosphate such that a suitably placed nucleophile can displace the leaving group [17]. When that nucleophile is the hydroxyl of a neighboring DNA strand, this chemistry results in a zero-length crosslink: a scar-less chemical ligation of DNA (Figure 1). EDC has been used to ligate dsDNA hairpins in solution [17], to link the phosphate backbone of stacked DNA in liquid crystals [18] and to stabilize a 600 nucleotide DNA origami structure [19]. Our work represents the first ligation via EDC of co-crystals containing protein and DNA. We show that EDC crosslinking dramatically increases crystal stability at the macroscale and does not prevent destroy the crystal nanostructure (i.e., treated crystals are still suitable for study via X-ray diffraction).
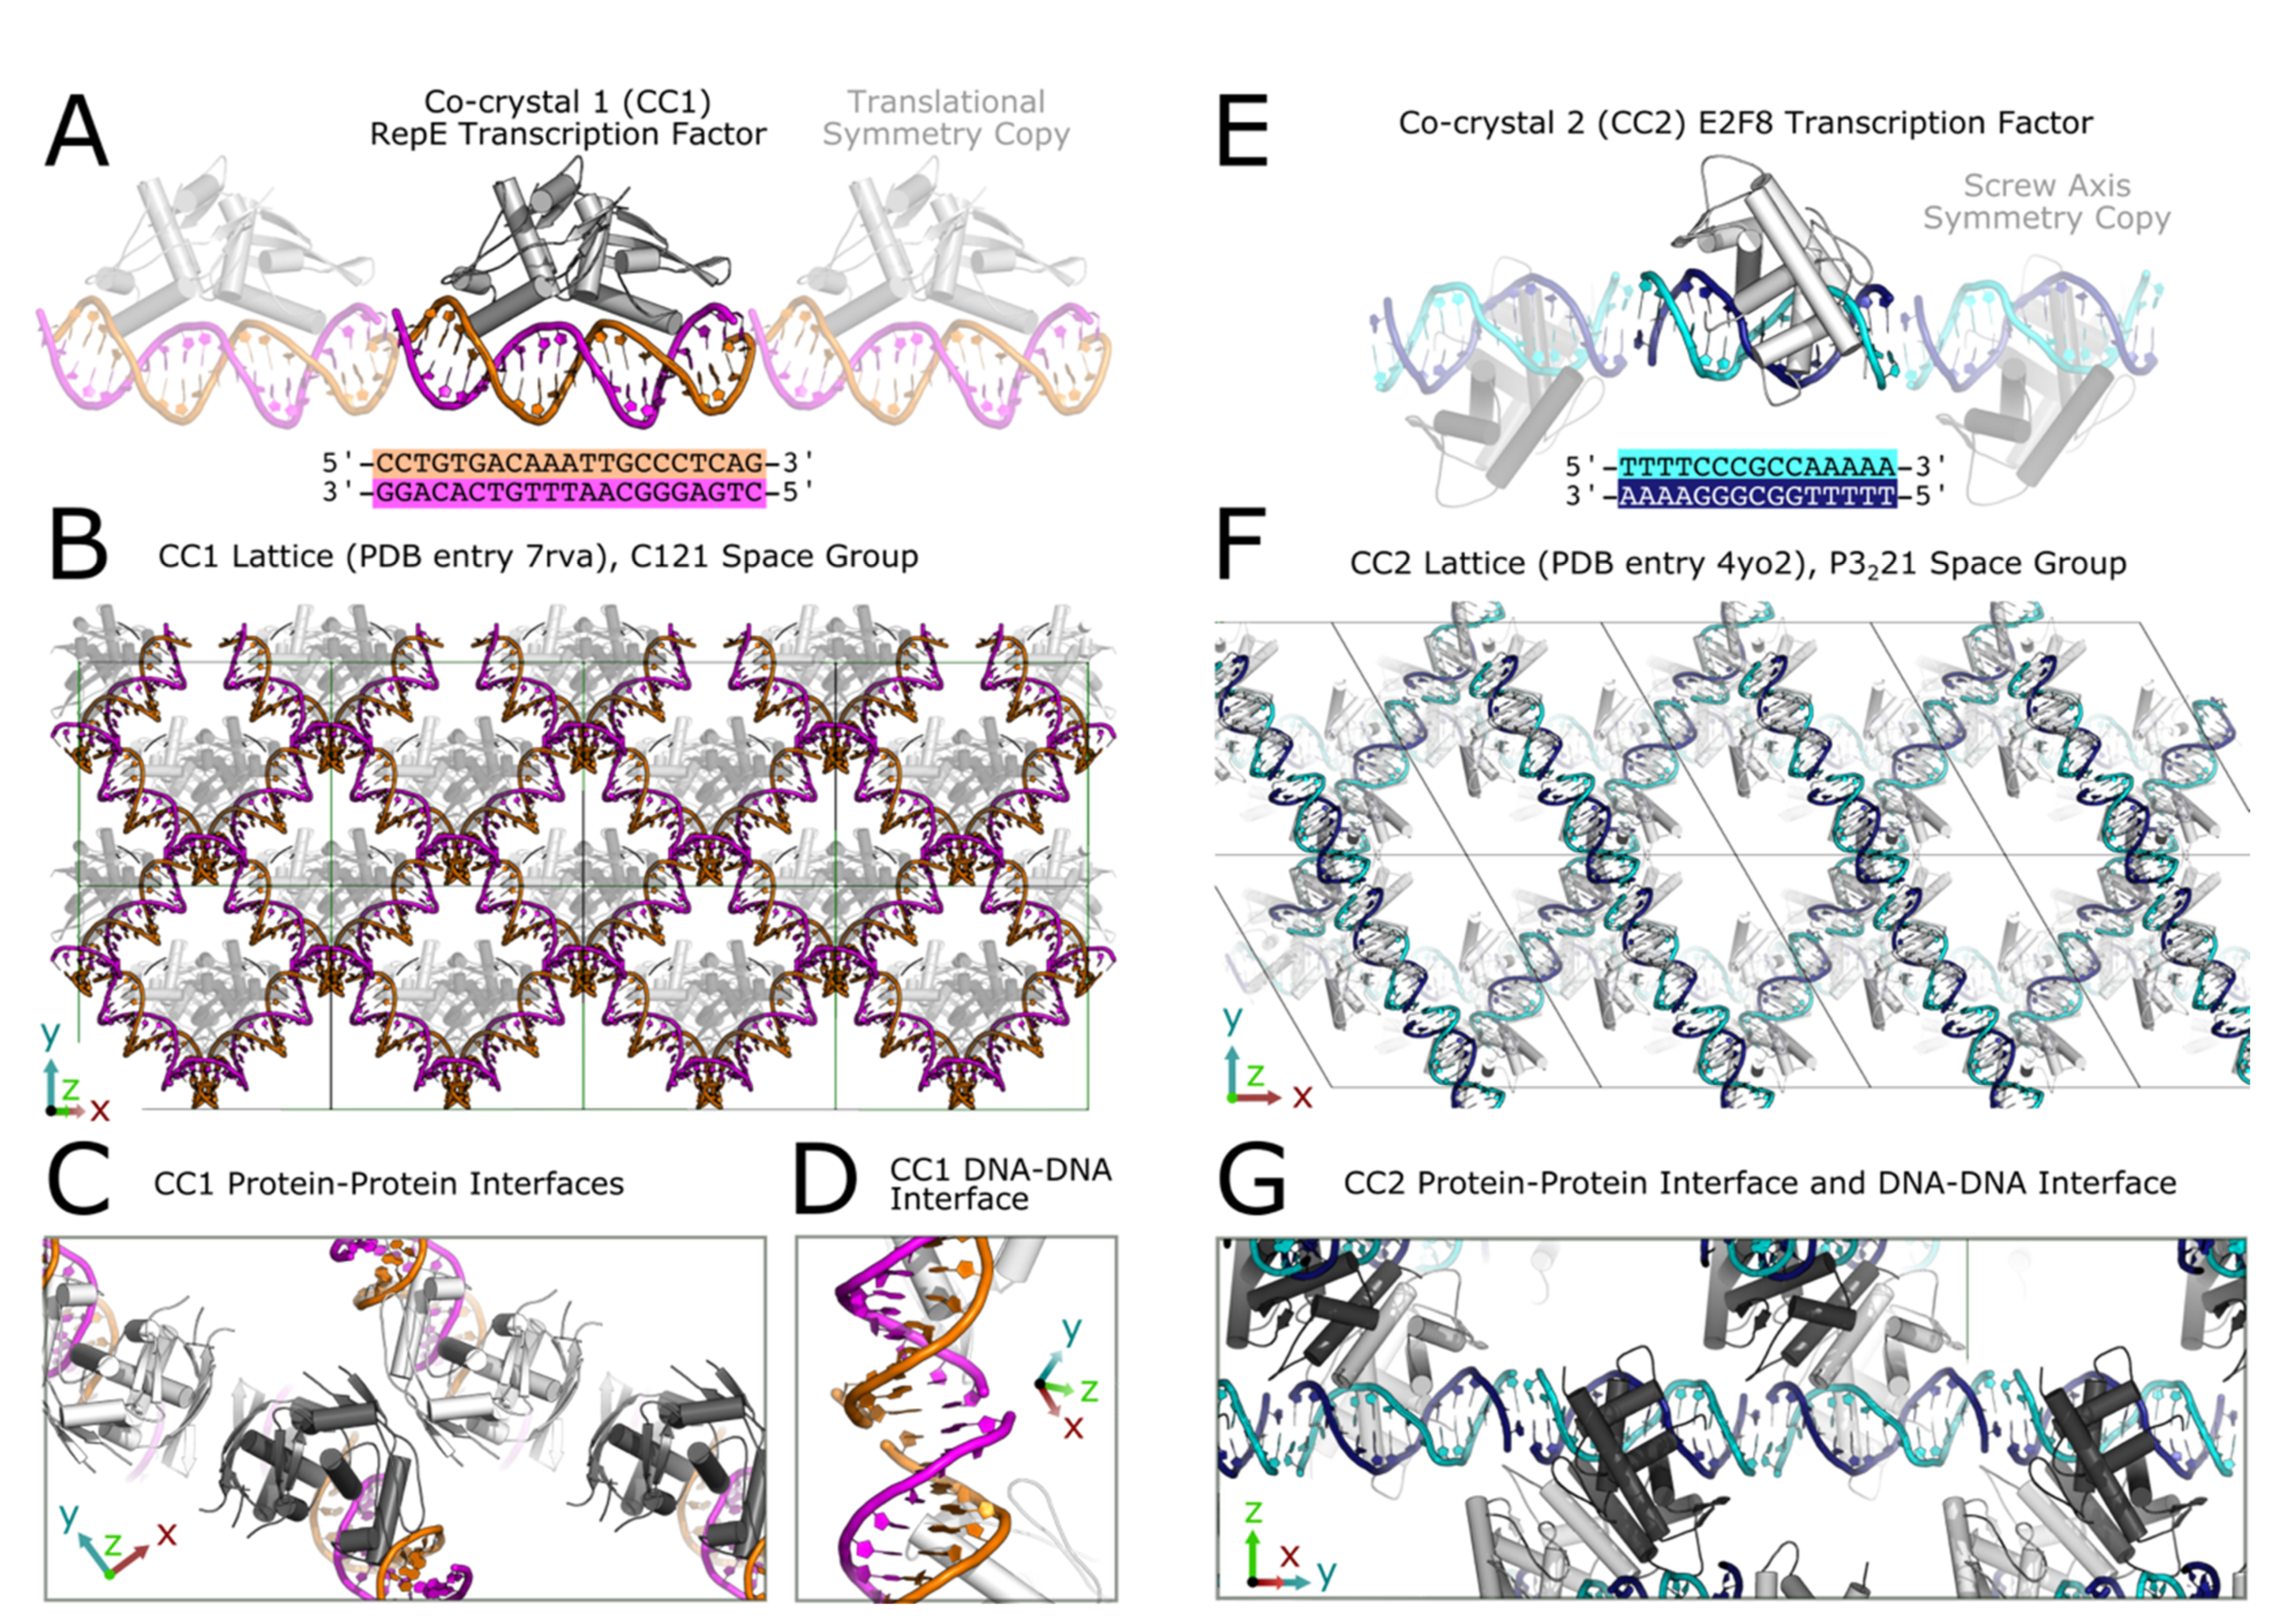
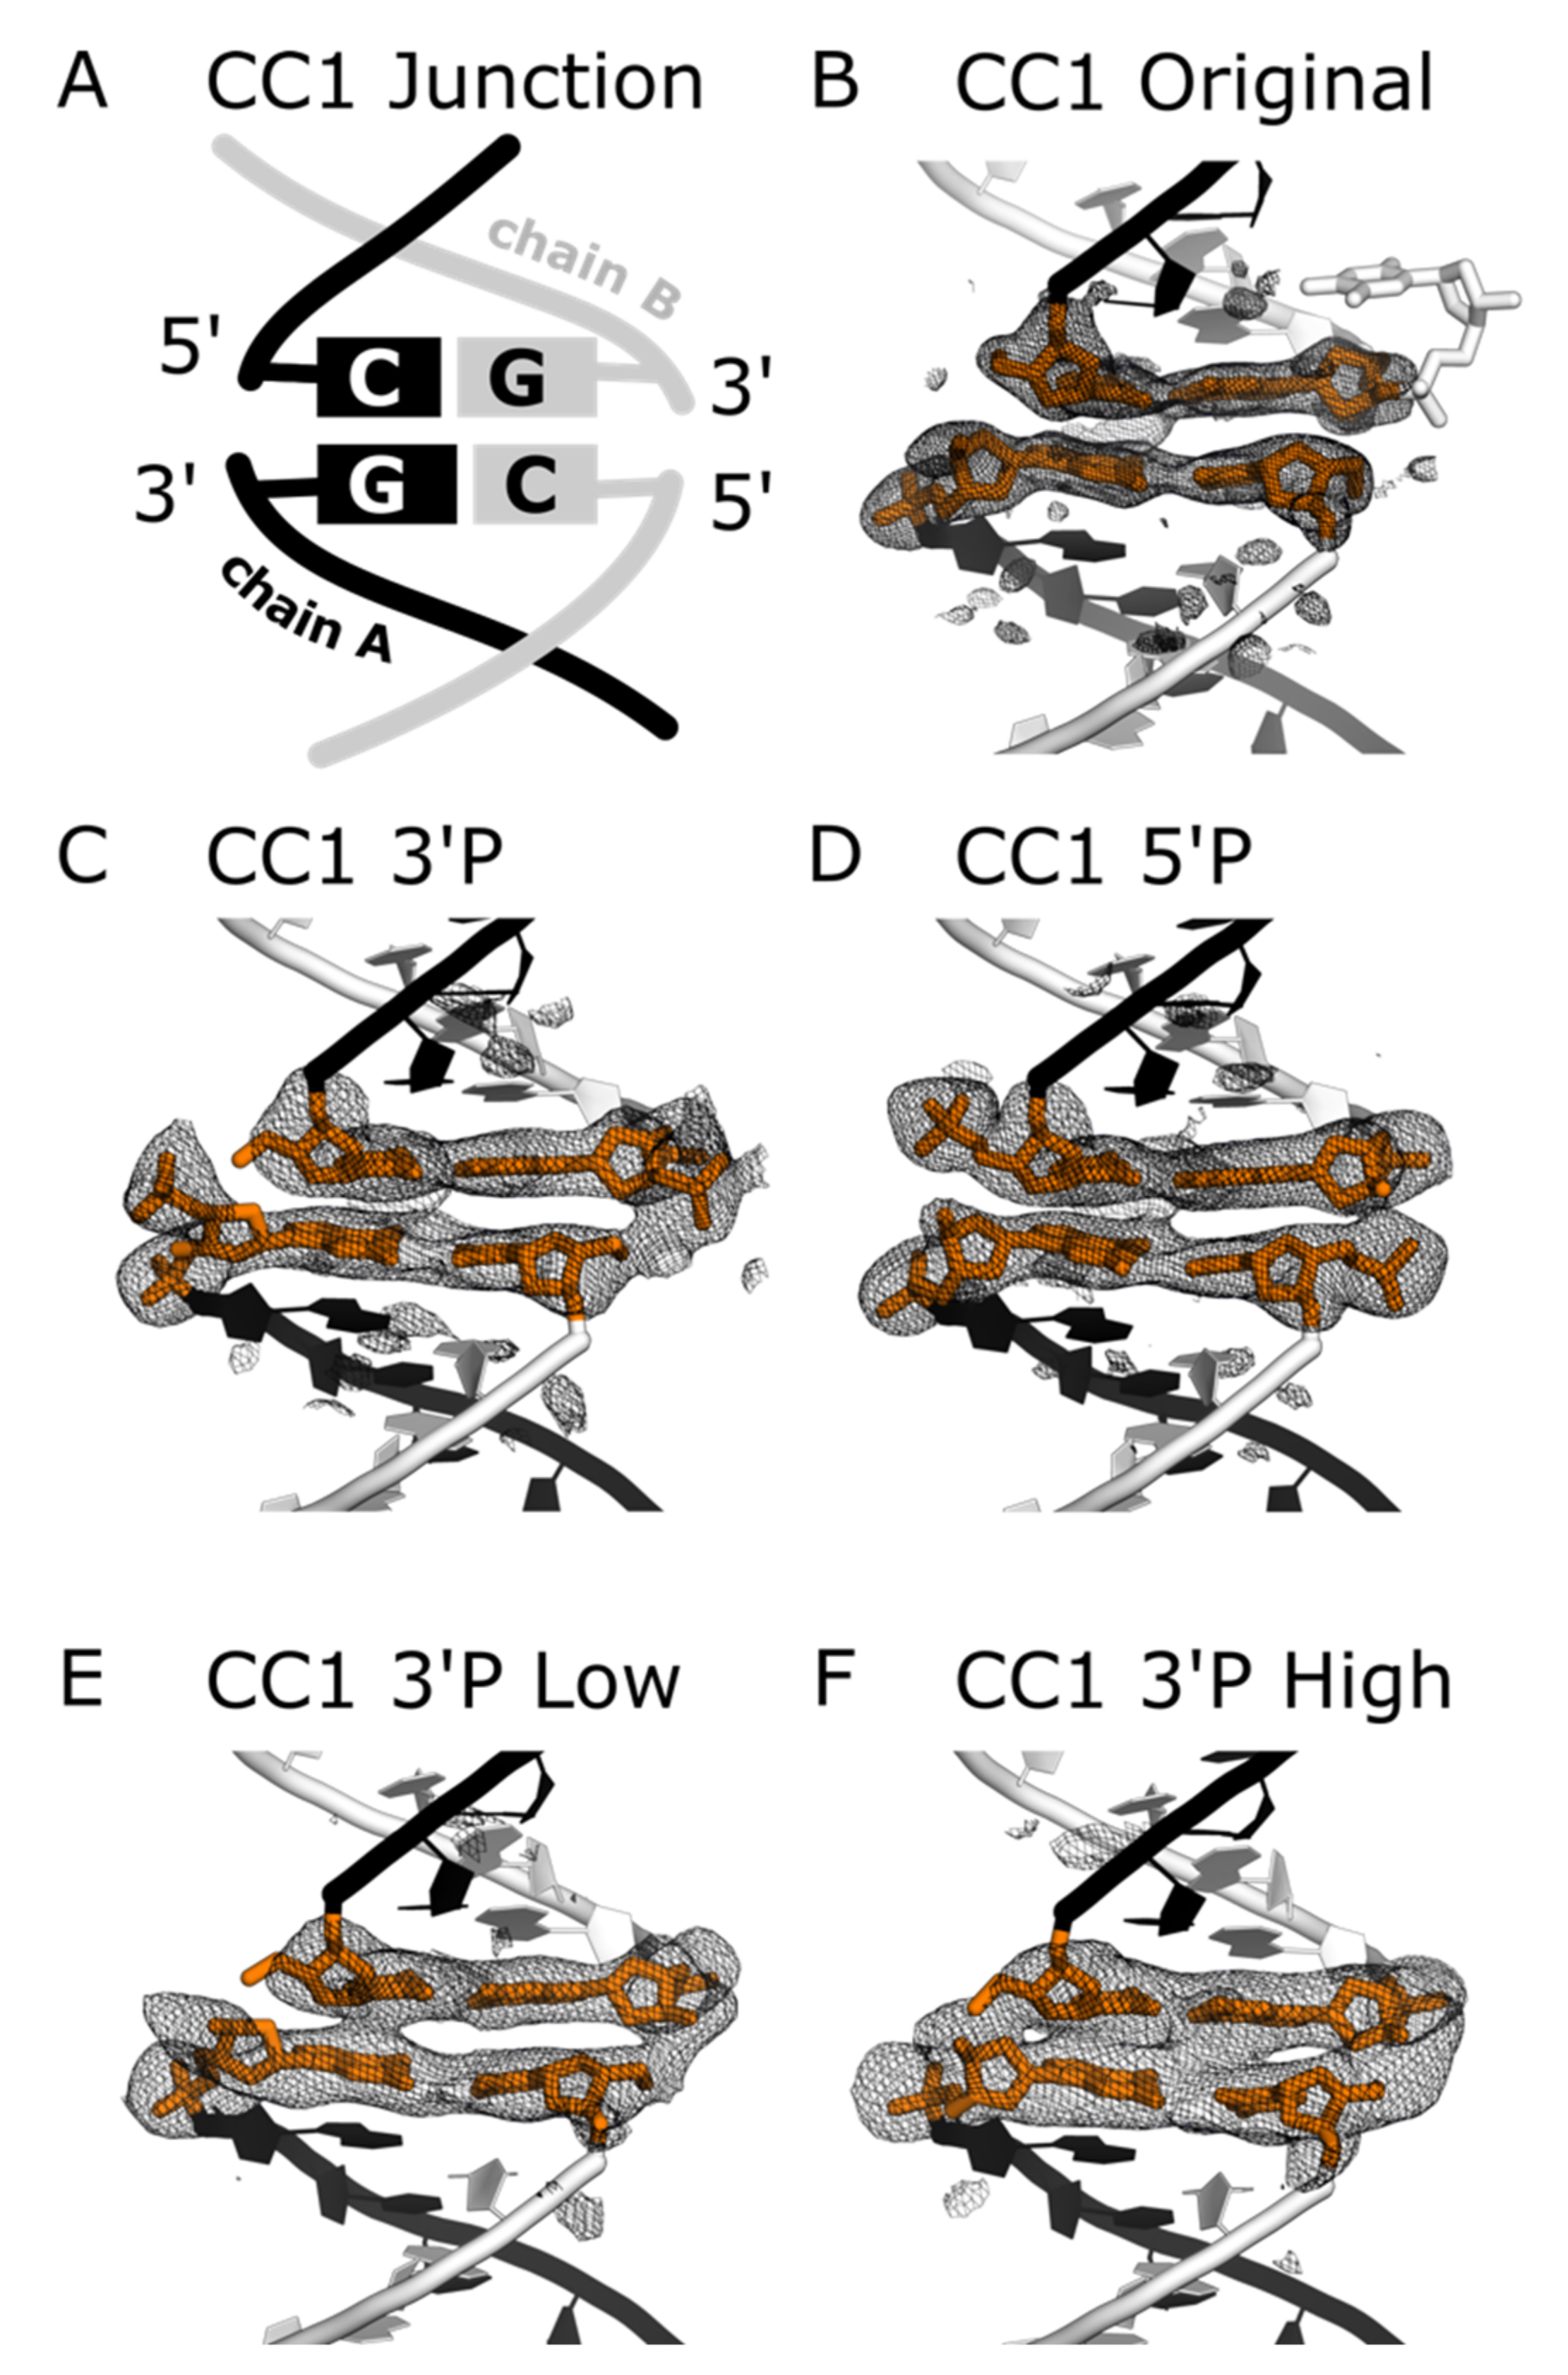
To demonstrate generality, we chemically ligate two different co-crystals of DNA-binding proteins containing stacked DNA–DNA interfaces (Figure 2). For convenience, we will refer to crystals of the RepE54 transcription factor bound to cognate 21-mer dsDNA as Co-Crystal One (CC1) (Figure 2A–D) and we will refer to crystals of the E2F8 transcription factor bound to cognate 15-mer dsDNA as Co-Crystal Two (CC2) (Figure 2E–G). The asymmetric unit for each co-crystal consists of a DNA-binding protein and short, cognate DNA duplex. Both co-crystals have existing models in the Protein Data Bank (PDB). CC1 is closely related to existing PDB entry 1rep, though the 1rep model corresponds to a crystal with differing DNA at the junction (Table S1). CC2 is identical to existing PDB entry 4yo2. The CC1 and CC2 crystals used in this study consist of dsDNA that is either blunt-ended or carries terminal 5′ or 3′ phosphates (Figure 3). In each co-crystal system, the crosslinking variables tested were terminal 5′ vs. 3′ phosphates, crosslinking time, EDC concentration, and repeated EDC dose. After EDC crosslinking, co-crystals had dramatically increased structural integrity with respect to changes in the solution condition.
To show foundational feasibility for biomedical applications, we demonstrated that crosslinked co-crystals remain robust in aqueous environments, blood serum, and at pH values found in the stomach (pH 2.0) or lysosomes (pH 4.5). Therefore, the EDC crosslinking results provided here may justify further investigation of chemically ligated co-crystals or pure DNA crystals as biomaterials. For scaffold-assisted crystallography [3] it is also important to note that the crosslinked co-crystals still diffracted X-rays. The crosslinked crystals tested here diffracted nearly as well as non-crosslinked crystals (anecdotally, a typical ~0.3 Å resolution difference). Additionally, we showed that this chemical ligation method is independent of the DNA sequence at the DNA–DNA junction. For example, despite differing DNA sequences at the junctions of CC1 and CC2, chemical ligation was effective in both cases. In summary, EDC ligation is a practical approach for crosslinking DNA inside of crystals and the optimized chemical crosslinking shown can provide the stability needed for diverse downstream applications.

2. Materials and Methods

2.1. Protein Cloning, Expression, and Purification

The protein sequence (Protocol S1) of RepE54 transcription factor (CC1 protein) from PDB code 1rep was cloned into a PSB3 vector with a N-terminal 6-Histag [20,21]. The Histone Source at Colorado State University expressed and purified CC1 protein as follows. E. coli CodonPlus RIPL competent cells were transformed with the CC1 protein expression plasmid and grown at 37 °C to a density of OD600 0.6 in 2xYT broth containing Ampicillin (100 mg/L) and Chloramphenicol (25 mg/L). Isopropyl-β-D-thiogalactoside (IPTG) was added at 0.4 mM and the culture was continually shaken at 37 °C for 3 h. Cells were harvested by centrifugation and resuspended in PBS buffer supplemented with 300 mM NaCl, 0.2 mM AEBSF, and 5 mM B-mercaptoethanol and were homogenized by sonication at 50% output (10 cycles of 45 s on, 120 s off). Lysate was recovered by centrifugation at 27,000× g for 25 min. The supernatant was loaded onto Ni Excel Sepharose resins (CV = 15 mL, Cytiva), washed and eluted by a linear gradient of 0–500 mM imidazole in resuspension buffer. The fractions containing CC1 protein were pooled, concentrated using Amicon Ultra-15 10 kDa MWCO centrifugal filter unit (EMD Millipore) and loaded onto a size-exclusion HiLoad Superdex 200 PG column (Cytiva) equilibrated with sodium citrate buffer (100 mM Sodium citrate pH 6.2, 100 mM KCl, 10 mM MgCl2 and 10% glycerol). Fractions containing CC1 protein were collected, concentrated to 15 mg/mL, and stored at −80 °C after freezing with liquid nitrogen.
The E2F8 transcription factor (CC2 protein) plasmid was graciously donated by the Taipale Lab (Protocol S1). The protein was expressed and purified based on previous guidelines [22]. CC2 protein with a TEV protease-cleavable N-terminal thioredoxin tag was expressed with a T7 promoter in E. coli BL21(DE3) cells. Upon addition of 0.5 mM IPTG, the cells were outgrown at 25 °C for 20 h. The cell pellets were sonicated in lysis buffer and applied to HisTrap (HisPur™ Ni-NTA Resin) equilibrated with HisTrap buffer (500 mM NaCl, 100 mM HEPES, 10 mM imidazole, 10% glycerol, 0.5 mM TCEP, pH 7.5). The protein was eluted with 200 mM imidazole in HisTrap buffer. CC2 protein was TEV cleaved from thioredoxin during dialysis using Snakeskin MWCO 10 kDa into HisTrap buffer. The cleaved product was separated from thioredoxin and TEV Protease by HisTrap, eluting with addition of HisTrap buffer. The CC2 protein was purified further with Nuvia™ cPrime™ Hydrophobic Cation Exchange Media, equilibrated with cation exchange buffer (50 mM NaCl, 100 mM HEPES, 10% glycerol, 0.5 mM TCEP, pH 7.5), and eluted with 100 mM NaCl in cation exchange buffer. The fractions containing CC2 protein were pooled, concentrated using Amicon Ultra-15 10 kDa MWCO centrifugal filter unit (EMD Millipore) and loaded onto a size-exclusion HiLoad Superdex 200 PG column (Cytiva) equilibrated with CC2 storage buffer (150 mM NaCl, 20 mM HEPES, 5% glycerol, 0.5 mM TCEP, pH 7.5). Size exclusion was completed at CSU’s Histone Source. Fractions containing CC2 protein were collected, concentrated to 10 mg/mL, and stored at −80 °C after flash freezing with liquid nitrogen.
All protein sample purification was analyzed with SDS-PAGE (NuPAGE™ 4–12% Bis-Tris Gel) with MES SDS running buffer. Gels were stained with Imperial™ Protein stain. Protein concentrations were determined with Bradford Assay using Coomassie Plus™ Protein Assay Reagent.

2.2. DNA Duplex Annealing

DNA duplex sequences are given in Figure 2 and Table S1. The RepE54 co-crystal oligomers were designed from the original 22-mer in PDB code 1rep [20]. All sequences contained the 19 bp iteron sequence for DNA–protein binding, but the original duplex was truncated from a 22-mer to a 21-mer to eliminate an unresolved dangling base and to give a blunt ended DNA interaction for crosslinking. The E2F8 transcription factor co-crystal oligomers were the original duplex found in PDB code 4yo2 [22]. The CC1 and CC2 oligomers were synthesized and HPLC purified by Integrated DNA Technologies with termini containing no phosphates, 5′ phosphates, or 3′ phosphates. The oligomers were resuspended: CC1 oligomers in 50 mM Tris HCl, 100 mM KCl pH 7.0 and CC2 oligomers in 10 mM Tris base, 150 mM NaCl, 1 mM EDTA pH 7.5. The DNA duplexes were annealed by combining cognate ssDNA oligomers in a 1:1 molar ratio, heating to 94 °C for 2 min then slowly cooling to room temperature over approximately 60 min. The final concentration of CC1 and CC2 duplexes were 4 mM and 1 mM, respectively. DNA stocks were quantified with a Qubit4 (Qubit™ 1× dsDNA HS Assay Kit).

2.3. DNA–Protein Complex Co-Crystallization

All co-crystals were grown via sitting drop vapor diffusion. At 30 min prior to crystal plate setup, the protein and DNA were incubated at a 1:1.2 molar ratio. The DNA–protein complexes were kept on ice for 30 min prior to use. CC1, RepE54 transcription factor co-crystal, crystallization conditions were 30–120 mM MgCl2, 2–16% PEG 400 and 100–220 mM Tris HCl pH 8.0. CC2, E2F8 transcription factor co-crystal, crystallization conditions were 40–300 mM ammonium sulfate, 5% PEG 400, 5–20% PEG 3350, and 80 mM HEPES pH 7.1. Crystals grew to a size of 50–150 μm3 in a range of 24 h to 7 days.

2.4. EDC Crosslinking Co-Crystals

Co-crystals were washed in conditions similar to crystal growth conditions where growth buffer components that interfere with crosslinking were substituted (i.e., primary amines, carboxylic acids, and divalent cations). The CC1 wash solution consisted of 30–120 mM NaCl (substituting for MgCl2), 2–16% PEG 400 and 100–220 mM MES pH 6.0 (substituting for Tris HCl pH 8.0). The CC2 wash solution consisted of 20–300 mM lithium sulfate (substituting for ammonium sulfate), 5% PEG 400, 10–30% PEG 3350 (an increase of 10% PEG 3350 compared to the growth solution), and 80 mM MES pH 6.0 (substituting for HEPES pH 7.1). The 10% additional PEG 3350 for CC2 appeared to prevent the crystals from degrading upon addition of the wash. The co-crystals were washed in 9-well glass plates (Hampton) to remove additional protein and DNA monomers and unwanted buffer components. 1-Ethyl-3-(3-dimethylaminopropyl)carbodiimide (EDC) (Advanced Chemtech CAS#:25952-53-8) was resuspended in the wash solution to final concentration values ranging from 5 to 80 mg/mL and used immediately. The co-crystals were crosslinked in a 200 μL EDC solution volume for varying time points. The co-crystal crosslinking reaction was quenched by moving crystals to 1× Tris-Borate-EDTA (TBE) buffer pH 8.3 containing 3.5 M urea.

2.5. DNA Gel Electrophoresis and Densitometry

Crosslinked co-crystals were dissolved in 3.5M Urea in 1× TBE supplemented with Proteinase K and incubated at 50 °C overnight. When crystals were too robust to dissolve under these harsh conditions, the crystals were heated to 94 °C for 1 h and glass crystal crushers (Hampton) were used to crush the crystals prior to chemical and enzymatic attack. The crystals were analyzed with 10% or 15% Novex™ TBE-Urea Polyacrylamide Gel Electrophoresis (PAGE) with 1× TBE running buffer. DNA ladders were GeneRuler Low Range DNA Ladder (Thermo Scientific, Houston, USA) for CC1 gels and Ultra Low Range DNA Ladder (Invitrogen) for CC2 gels. The control lanes included 1-mer dsDNA and 2-mer dsDNA, prepared by annealing oligos as mentioned in Section 2.3 (Table S1 Duplex IDs 1.1, 1.4, 2.1, and 2.4). Gels were incubated with 3 × GelRed™ Nucleic Acid Gel Stain and imaged with a UVP Bioimaging System on the Ethidium Bromide setting. For further validation, selected ligation products for CC1 were also analyzed with a TapeStation D1000 ScreenTape assay (Agilent) (Figure S1) at CSU’s Next Generation Sequencing Core. The gels and TapeStation were analyzed via densitometry.

2.6. DNA Gels and Densitometry

For densitometry, we used ImageJ (1.52 k) to obtain raw x,y,intensity values for the gels shown in Section 3.1. We averaged these data over x values and used custom Python scripts (within “cocrystal_ligation_scripts.zip” hosted on Zenodo [23]) as well as the lmfit module [24] to obtain non-linear best fits of the gel intensity. Specifically, we modeled peaks using Gaussian functions. We also modeled the background using diffuse Gaussian functions. Crystals with more crosslinking produced overlapping gel bands for higher-order ligation products. One of the benefits of using a mathematical curve fitting framework is our ability to fit (albeit approximately) these populations. Specifically, we fit the peak position trend using the well-separated gel bands corresponding to smaller ligation products. Then, we fit the highly overlapping region using extrapolated peak positions with fitting parameter restrictions implemented via lmfit. Inspection of the fitting results (Figure S2) gave us confidence that higher-order band intensity fit was reasonable.
In principle, longer DNA ligation products can adsorb a greater number of GelRed fluorophores, proportionally with the DNA length. Ignoring this effect might cause us to overestimate the ligation yield. Accordingly, we proceeded to normalize the estimated molar ratio of the ligation products (Section 3.2) by dividing each band intensity by the assigned DNA block size (divide by N for N-mer DNA blocks). The raw band intensity fits are provided in Table S2.

2.7. Random Ligation Model

As exemplified in Section 3.2, the densitometry data could be interpreted in terms of the relative population of unfused DNA, ligated 2-mer, ligated 3-mer, etc. We sought to interpret these data in terms of the likely percentage of the dsDNA-dsDNA interfaces that have gained at least one covalent bond via EDC ligation. First, we used the estimated molar ratio of products from gel densitometry to estimate the fraction of potential ligation sites that were ligated. Second, to compute the expected distribution of fused DNA blocks of varying length, we implemented a simple 1D simulation in Python (Protocol S2, also within “cocrystal_ligation_scripts.zip” [23]) in which all 85712 nicks between DNA blocks in a 1D stack of 42,857 blocks (a 300 micron stack) were equally likely to be randomly removed in each unit of time. This “random ligation model” is arguably the least complex theoretical model for the crosslinking process, ignoring transport phenomena and assuming that all possible ligation sites throughout the crystal undergo ligation randomly with equal probability per unit of time. We also developed a biased ligation model in which sites near the crystal interior are less likely to be ligated than sites near the crystal surface (Protocol S3, also within “cocrystal_ligation_scripts.zip” [23]).

2.8. X-ray Diffraction Data Collection, Refinement and Omit Maps

Single-crystal X-ray diffraction (XRD) data were collected for CC1 crystals containing 5′ and 3′ terminal phosphates. Crosslinked crystals with 3′ terminal phosphates were also analyzed via XRD. Crystals were briefly swished through cryo-protectant solution (300 mM MgCl2, 30% PEG 400, and 100 mM Tris HCl pH 8.0) and flash-frozen in liquid nitrogen. Frozen crystals were stored in Rigaku ACTOR Magazines (Mitegen) and shipped to the Advance Light Source Beamline 4.2.2 for data collection. Full datasets were collected on a CMOS detector from 0 to 180 degrees with an omega delta of 0.2° and an exposure time of 0.3 s. Data were processed with XDS [25] and molecular replacement and refinement within PHENIX [26] and COOT [27]. As a result, the original co-crystal for RepE54 transcription factor (2.60 Å PDB code 1rep) was updated with a higher-resolution structure (1.89 Å PDB code 7rva). The updated structure was solved with molecular replacement using the PDB code 1rep. CC1 crystal structures containing 5′ or 3′ terminal phosphates were solved via molecular replacement in PHENIX using the updated original CC1 as a starter model. For all structures, the same R-free flags were used during refinement in PHENIX and COOT. Structure factor data were truncated using I/sigma(I) >1.5 as a cutoff. The resulting structures were of: CC1 with terminal 5′ phosphates (PDB code: 7sgc), CC1 with terminal 3′ phosphates (PDB code: 7sdp), low EDC crosslinked (5 mg/mL EDC, 12 h) CC1 with terminal 3′ phosphates (PDB code: 7soz), and heavy EDC crosslinked (30 mg/mL EDC, 12 h, two doses) CC1 with terminal 3′ phosphates (PDB code: 7spm). Standard X-ray diffraction data quality statistics are provided in Table 1 and Table 2.
Omit maps were generated for each structure, shown in Section 3.3. To prevent bias of the electron density at the junctions in crosslinked structures, discovery and omit maps were generated with structures containing no terminal phosphates. After generating discovery and omit maps, the terminal phosphates were added to the structures and refined for submission to the PDB. In the final PHENIX refine of heavy crosslinked CC1 terminal 3′ phosphates, a custom geometry bond restraint was added because the electron density indicated ligation at both junctions. The terminal 3′P and flanking 5′OH were given a bond length restraint of 1.59 Å, the ideal length of the phosphate-oxygen bond in the DNA backbone [28].

2.9. Stability Assays

Crystals were crosslinked using the Section 2.4 protocol, with 15 mg/mL EDC for 20 h. The EDC reaction was quenched in 50 mM Tris base pH 8.0 for 30 min. The crystals were equilibrated in crosslinking wash solution for 30 min prior to looping to stringent conditions. The stability test buffers used were as follows: molecular biology grade water (CORNING), very low pH 2.0 0.01 M HCl buffer (to mimic stomach acid), a moderately low pH 4.5 citrate buffer (46 mM sodium citrate, 54.1 mM citric acid to mimic lysosomal fluid pH), and blood serum (HyClone, bovine calf serum). Pictures for each trial are in Figures S3–S6. Crystal pictures were obtained with a Moticam 3.0 MP camera attached to a Motic SMZ-168 stereozoom microscope and crystal measurements were performed in Motic Images Plus 2.0 (Figure S4 and Protocol S4).

3. Results

3.1. Chemical Ligation in Co-Crystals

Within our two co-crystal families (CC1 and CC2), we observed clear evidence of chemical ligation of stacked DNA duplexes. Both co-crystals demonstrated broadly similar ligation results, emphasizing the generality of this ligation method to co-crystals in which blunt-ended DNA blocks are suitably positioned to resemble contiguous DNA. As shown in Table 3, the PDB entries for the parent structures of both CC1 (7rva) and CC2 (4yo2) have junction step geometry that is reasonably comparable to contiguous B-DNA as calculated using x3DNA [29]. Except for the twist and roll across the CC2 junction (as seen in PDB entry 4yo2), all step geometry parameters are within 2 standard deviations of the B-DNA mean. It is possible that other co-crystals in which the DNA–DNA junctions have a geometry less like contiguous DNA would resist ligation. Additionally, in the preliminary crosslinking tests shown here, the crosslinking was successfully independent of the sequence at the DNA ends. CC1 has GC/CG flanking ends while CC2 has AT/TA flanking ends. The sequence independence of this ligation strategy is advantageous for DNA structure design projects where the junction sequence may be constrained for functional reasons. Table 3 also reports an interesting asymmetry between the two nick sites at the DNA–DNA junctions within the CC1 family of structures. We report the distance between C5′ and O3′ to avoid relying on the less certain O5′ position. For calibration, an idealized B-DNA model from x3dna had C5′ to O3′ distances of 2.73 Å for contiguous bases, but this span is variable (2.99 ± 0.17 Å) elsewhere within the dsDNA of PDB entry 7rva. One of the two CC1 nick sites, chain B, was invariably closer than chain A (e.g., 3.75 Å rather than 4.22 Å in CC1-3′P), and electron density suggested that this shorter gap (chain B) was more readily ligated.
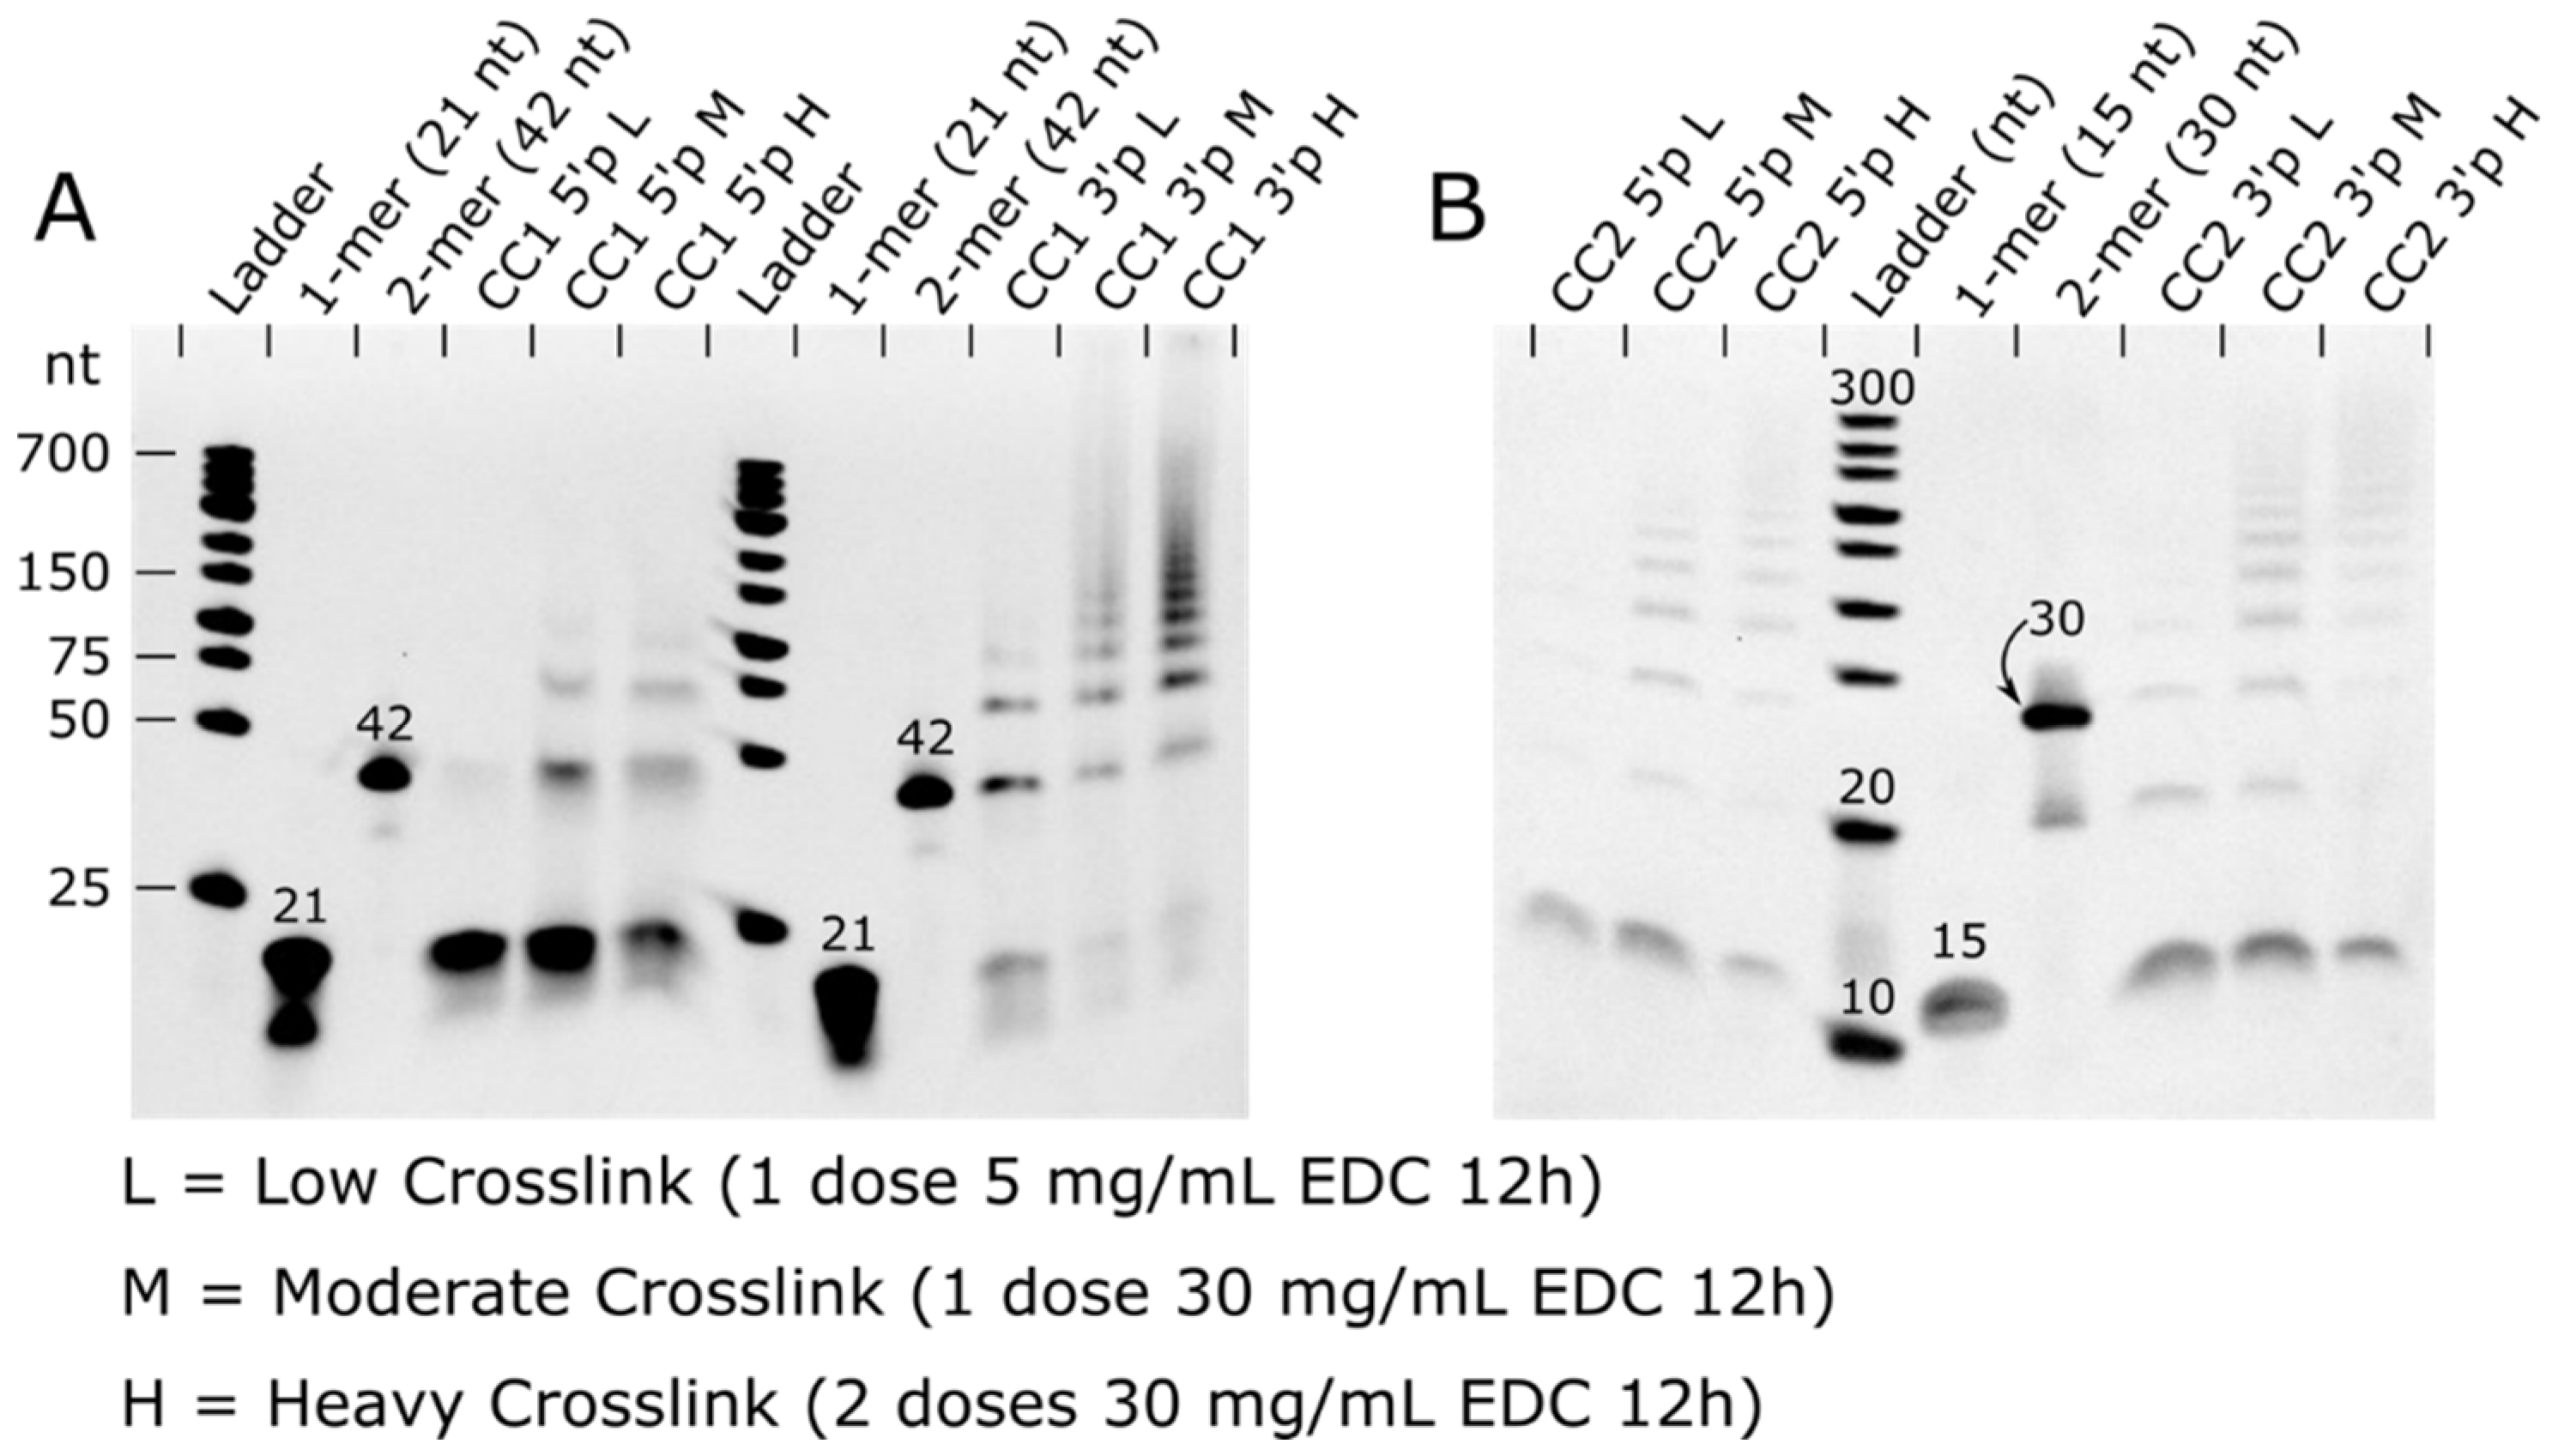
EDC crosslinking was tested for both 5′ and 3′ phosphate laden crystals. For CC1, the 3′ phosphate resulted in superior ligation yield than the 5′ phosphate in each trial (Figure 4 and Figures S7–S11). On the other hand, CC2 ligation yields had a modest difference in the ligation yield for 3′ and 5′ phosphates. Given the limited dataset, it is premature to conclude that 3′ phosphates will typically give a higher ligation yield within co-crystals.
In both systems, DNA ligation was dependent on the presence of the terminal phosphates as well as on the crystal template; control crystals lacking terminal phosphates yielded no observable ligation products (Figure S10). Additionally, freely diffusing DNA blocks carrying terminal phosphates (but lacking the co-crystal scaffold) also yielded no observable ligation products when exposed to EDC (Figure S10). This second control demonstrated that the scaffold was necessary for ensuring efficient ligation of blunt-ended DNA blocks. The absence of observable ligation for building blocks in the absence of the crystal “scaffold”, precludes a systematic study of the effects of precursor ligation on crystal growth. Future work will determine, as a function of sticky overhang length, the extent to which blocks with sticky overhangs can be ligated within crystals and in solution.
Crosslinking reaction time was clearly and directly related to ligation reaction yield during the first 12 h (Figure S7). It was less clear if reaction yield was further improved by incubation beyond 12 h. Therefore, 12 h crosslinking incubations were used for the subsequent ligation optimization trials.
In the next series of experiments, we optimized EDC concentration for maximum ligation yield. We assayed the ligation product distribution as a function of concentration from 5 mg/mL EDC to 80 mg/mL EDC. As hypothesized, increasing the concentration of EDC increases the ligation of DNA duplexes in the co-crystals (Figure 4 and Figure S8). In CC1 trials, we did not see a noticeable increase in ligation beyond 30 mg/mL. However, in CC2 trials, there was improved ligation at 60 mg/mL. We also subjected the co-crystals to multiple fresh doses of EDC (30 mg/mL) to determine if we could achieve near 100% ligation. For both co-crystal systems, multiple doses of EDC did increase ligation yields (Figure S9) but did not approach 100% ligation yields.
Reaction buffer components were critical for successful ligation. We observed, at the outset of this project, that the presence of magnesium chloride in the crosslinking buffer appeared to interfere with the crosslinking reaction. This was problematic because the CC1 crystal growth conditions contain a significant amount of magnesium chloride. In our crystallization trials, 30–120 mM magnesium chloride was required for growth [21]. Additionally, there is a structural Mg(II) at the DNA–protein interface coordinated by Glu77 and Asp81. To circumvent the apparent deleterious role of Mg(II) on CC1 crosslinking, we replaced magnesium chloride with sodium chloride in the wash solution for all CC1 crosslinking trials. At the conclusion of the project, we again confirmed that Mg(II) was deleterious to ligation by adding Mg(II) to the optimized ligation protocol. Specifically, we verified that supplementing the crosslinking incubation buffer with 90 mM or 110 mM MgCl2 noticeably reduced the ligation yield (Figure S11). The exact role of Mg(II) in inhibiting the ligation reaction is not clear, but might involve reduced availability of the nucleophilic phosphate groups.

3.2. Ligation Model Compared to Experimental Co-Crystal Ligation

The ligation product distributions we experimentally obtained should shed light on the stochastic process of ligation. Using a destructive assay, densitometric analysis of electrophoresis results on ssDNA recovered from dissolved crystals, we quantified the population ratio of bands assigned to non-modified DNA blocks as well as fused 2-mer, 3-mer, etc. For selected gels, we also obtained TapeStation results (Figure S1). The relative population of the end-product distribution was fairly consistent for gel band populations measured with TBE-urea gels in ImageJ compared to the automated TapeStation analysis (Figure S1).
Next, we sought to calculate a global performance metric for the ligation yield, PLIG, as the fraction of all possible DNA–DNA nick sites throughout a crystal that were ligated. To quantify the ligation yield throughout an entire crystal, we analyzed the implications of the final DNA product distribution recovered after the crystal is dissolved and the protein components are removed. If we count the number of DNA oligos of each length ( n i ) that were present in the crystal, and we ignore edge effects, we can estimate the total number of single-stranded breaks (SSB) as N S S B = i n i . For the same crystal, the estimated total number of original single-strand breaks (regardless of final ligation status) would be N J X N = i i · n i . For example, adding a single fused 3-mer to the crystal increases the SSB tally by one, but increases the tally of all possible junctions by three. Then, to compute the total probability of encountering SSB, we calculate:
P S S B = N S S B N J X N = i n i   i i · n i =   i n i i n i i i · n i i n i = 1 i i · x i
In the final equation, x i is the mole fraction for i -mer oligos. Therefore, to estimate the P S S B , we can use estimated mole fractions from electrophoresis and densitometry (Figure S2 and Figure 4 and Table 4). Accurately calculating P S S B does require including the small mole fractions for higher-order products (Table S3) since longer products contribute proportionally more to i i · x i . To estimate the uncertainty in each P S S B , we used 500 numerical trials in which random noise was added to i · x i to mimic the densitometry measurement error. We used noise comparable to i · x i for the highest-order ligation products (normal variate with standard deviation 0.03), such that the smallest i · x i values would regularly fall to 0 after the addition of random noise.
Given the probability of encountering a single-stranded break in the crystal (PSSB), it is trivial to calculate the probability of each terminal phosphate having undergone ligation (PLIG), since PLIG = 1 − PSSB. In the context of the random ligation model (RLM), ligation events throughout the crystal are independent and occur with equal probability at all nick sites. This is a physically plausible model if the intra-crystal transport rate for EDC exceeds the rate of reaction. Therefore, the incidence of double-stranded breaks within the crystal should occur with the joint probability of independent events, PDSB = (PSSB)2.
This analysis of the electrophoresis experiments suggests that ~75% of the terminal phosphates within the most thoroughly crosslinked CC1-3′P crystal have undergone ligation. Furthermore, ~94% of the DNA–DNA junctions in this crystal had at least one ligated chain. The similarity in ligation yield for the medium- and high-dose cases leads to an important question. What factors are limiting the yield? Incomplete ligation could result if a random population of terminal phosphates are missing, or otherwise incapable of on-target ligation. We used simulations to verify that the predicted RLM product ratio did not change when we postulated that a random subset of nick sites is incapable of ligation. This makes sense because junctions that are randomly selected to be incapable of ligation are functionally equivalent to sites that are randomly selected to be ligated last.
It may also be possible that ligating one phosphate at a DNA–DNA junction would negatively affect neighboring ligation probabilities. However, evidence for such allostery is lacking. Instead, the observed product distributions for CC1 ligation outcomes (Table 4), were close to the distributions predicted by the RLM (Figure S12). One small but consistent deviation from the RLM was a lower 2-mer, and higher 3-mer population than predicted. This observation seems to preclude the simplest negative allostery scenario (where one ligation event would reduce the probability at flanking sites). We cannot rule out the possibility that this discrepancy is an artifact associated with the gel electrophoresis densitometry.
The CC2 ligation outcomes (Table 4) were significantly less consistent with distributions predicted by the RLM. Once more, the 3-mer population was often higher than expected, frequently exceeding the 2-mer population (which never happens in the RLM). This effect also seemed to extend to anomalously common 4-mers. A more striking divergence from the RLM prediction was the high population of non-ligated 1-mer blocks. Regardless of the RLM fit, the significant difference between the 1-mer mole fractions and the PSSB values obtained from all the mole fractions strongly implicates that the RLM is lacking.
To investigate, we tested biased ligation model simulations. One possible explanation is that the ligation outcomes were driven partially by kinetics and molecular transport phenomena. Hypothetically, ligation sites near the crystal exterior might be more likely to be ligated than possible sites near the crystal center since reactive molecules must traverse the outer layers to react the interior. To determine the likely implications of this scenario, we conducted biased random ligation simulations (Protocol S3) that increased the probability of ligation events near the surface, decreased the probability at the center, and terminated the random ligation process at a set PSSB threshold. Perhaps counterintuitively, this spatial bias increased the predicted 1-mer mole fraction. A high 1-mer fraction is partially consistent with the observed product distribution for CC2. The overall lower ligation yield achieved for CC2 crystals compared to CC1 is also consistent with the hypothesis that the CC2 crystal interior is systematically under-ligated. Alternately, it could be the case that one of the two symmetry-distinct nick sites in the CC2 lattice has a significantly lower ligation yield, and therefore one of the two DNA oligos will be over-represented in the 1-mer population.

3.3. Ligation Structural Details

Co-crystal structural details were revealed with X-ray diffraction at the Advanced Light Source beamline 4.2.2. Electrophoresis data (Figure 4) suggest that the CC2 DNA is stacked as intended. However, while high-resolution diffraction for CC2 crystals should be possible (3.07 Å reported by Morgunova et al. (22)), our CC2 crystals have, to date, yielded poor diffraction (>10 Å). Therefore, we chose to focus on the CC1 crystals as the model crystals to observe ligation via X-ray diffraction”.
Here, we report five new crystal structures for CC1. We obtained a 1.89 Å dataset for the original co-crystal, which revealed additional details beyond the original model (PDB code: 1rep, 2.60 Å). Komori et al. varied the DNA building block to optimize resolution (20), finding that dangling Ts resulted in the best data. Our updated structure provides a rationale for this empirical observation. Specifically, one of the dangling T bases is resolved, and participates in a crystallographic contact. Removing the dangling Ts decreased the resolution of our native structures from 1.9 Å to 2.7 Å (CC1-5′p) or 3.01 Å (CC1-3′p). Once crystals were crosslinked with low (15 mg/mL 12 h) and heavy (2 doses 30 mg/mL 12 h) EDC, the crystals maintained diffraction, albeit with a moderate loss in diffraction (3.14 Å and 3.28 Å, respectively).
Models were refined with PHENIX [26] and COOT [27]. The electron density for the heavily ligated DNA junction was consistent with contiguous DNA, despite omitting the terminal phosphate throughout prior refinement calculations. Figure 5 shows omit maps where any terminal phosphates are omitted, along with the bases flanking the junctions. The potential for overlapping electron density contributions from non-ligated and ligated phosphates makes it difficult to quantify occupancy. Nonetheless, we observed clear trends. Prior to ligation, the positions of 3′ phosphates (Figure 5C) or 5′ phosphates (Figure 5D) were reasonably clear.
Consistent with the lower distance between C5′ and O3′ for chain B (Table 3), the electron density was invariably higher for the right hand nick (chain B:chain B). When contoured at 3.0 rmsd, the omit map electron density was even contiguous for the non-ligated CC1 3′P case (Figure 5C). Notably, the maps for crystals subjected to EDC (Figure 5E,F) are discovery maps in the sense that the models were refined in the absence of terminal 3′ phosphates. After light ligation (Figure 5E), the omit map was not clearly changed. However, after heavy ligation (Figure 5F), there was very strong electron density on the right and solid electron density in the left. Phosphates were added prior to submission to the PDB (entry 7spm) and our final refinement calculation for CC1 3′P High included bond length restraints between the model and its symmetry neighbor to ensure a reasonable phosphate geometry.
It is somewhat remarkable that ligation was visible in the electron density trend (Figure 5C–F), despite the incomplete ligation yield suggested by the electrophoresis data (Table 4). In principle, the clarity of the ligation sites in the electron density maps may vary depending on whether the X-ray beam is diffracting from a highly ligated region of the crystal.

3.4. Co-Crystal Stabilization Effects from Ligation and Crosslinking

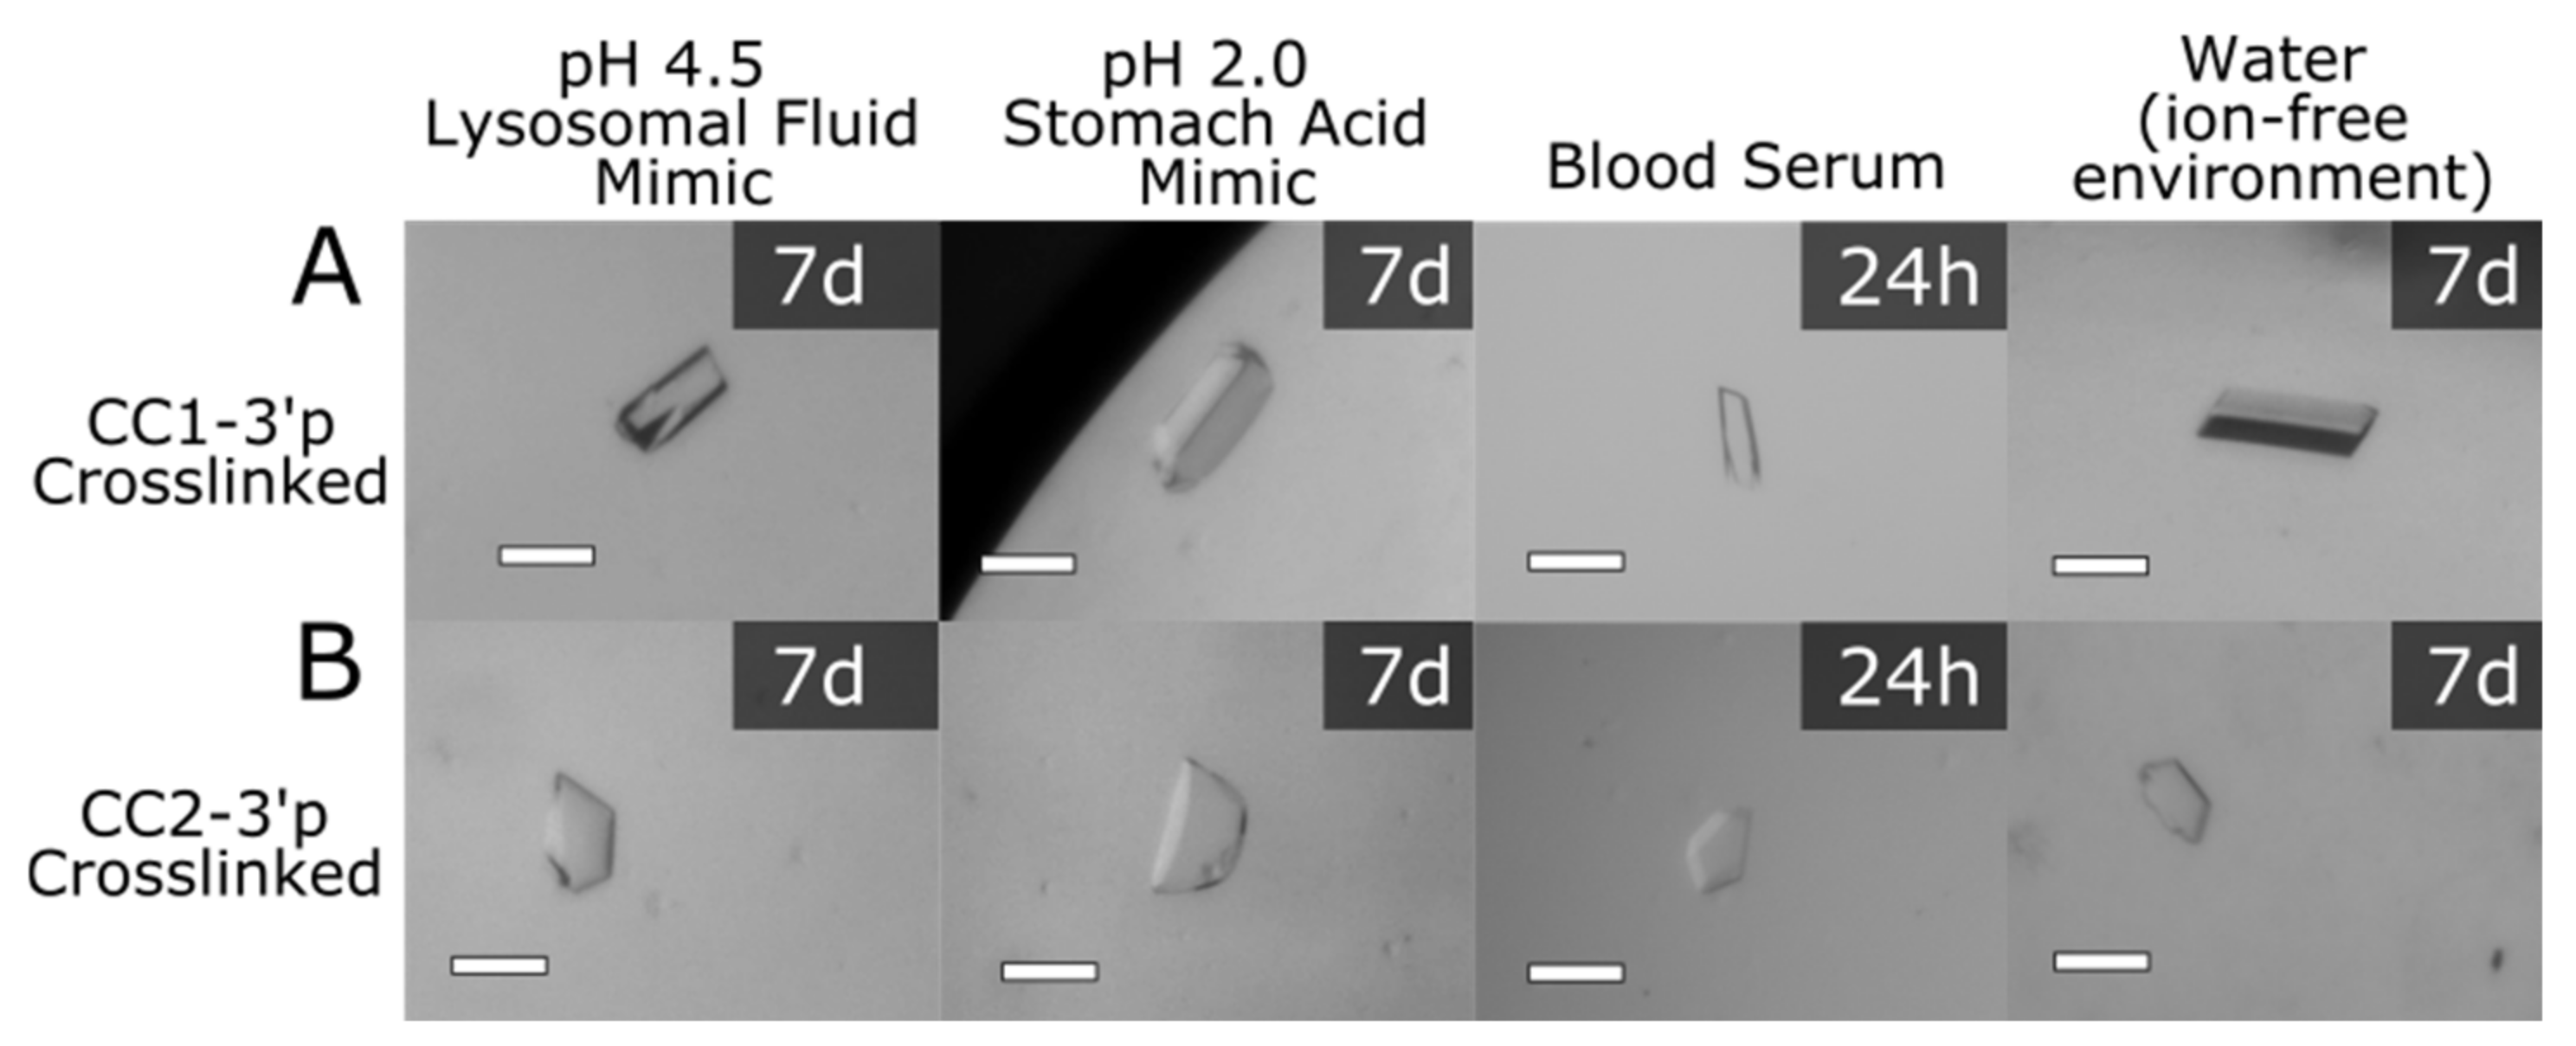
To determine if crosslinked co-crystals may be suitable for various applications, including biomedical applications at physiologically relevant conditions, the co-crystals were crosslinked (20 h, 15 mg/mL EDC) and subjected to a panel of harsh conditions: a stomach acid mimic, a lysosomal fluid mimic, blood serum (bovine calf), and deionized water (Figure 6). The conditions chosen, especially the stomach acid mimic and deionized water, were challenging for native crystals (no crosslink) since DNA-containing crystals typically require stabilizing counterions.
In the stomach acid mimic (0.01 M hydrochloric acid pH 2), the non-crosslinked co-crystals were observed to convert to an aggregate (Figure S4). Remarkably, in the stomach acid solution, the entire set of crosslinked crystals demonstrated enhanced stability, not dissolving even after 7 days. The 3′ phosphate crosslinked crystals did not change macro-structure for at least 5 days in the harshly acidic environment (Figure S4). Co-crystals without phosphates were also crosslinked and these crystals expanded dramatically in the acidic environment after 24 h (~430 ± 70% volume change), demonstrating the importance of the DNA ligation for crystal stability. Crosslinked co-crystals also maintained integrity in a lysosomal mimic buffer (pH 4.5) and blood serum with no measurable changes to the crystal dimensions after 24 and 72 h, respectively (Figures S5 and S6).
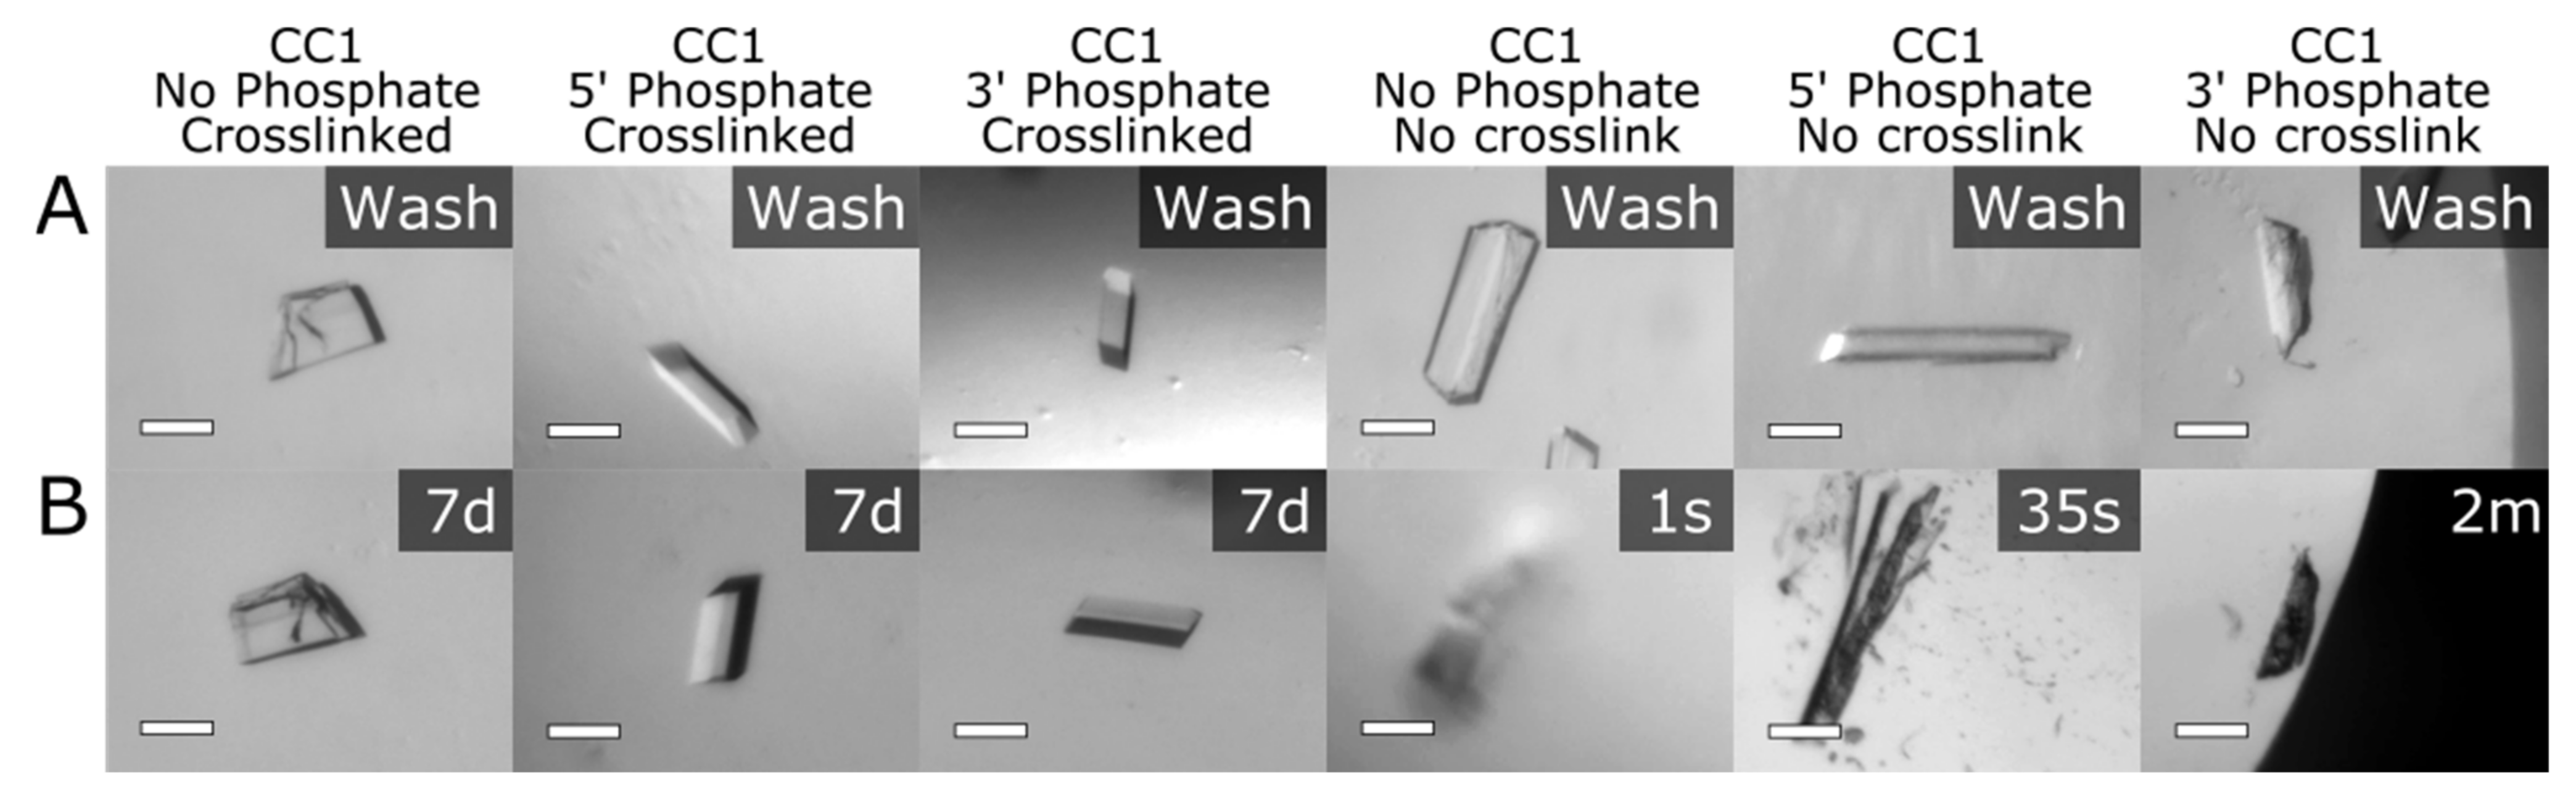
In deionized water, the co-crystal stability resulting from crosslinking was exceptional (Figure 7 and Figure S3). Within one minute of transferring co-crystals to deionized water, non-crosslinked crystals (except for interesting exception CC2-3′P) completely dissolved or were converted to an aggregate. When the co-crystals were crosslinked (20 h, 15 mg/mL EDC), the crystals remained intact and lacked observable changes to their surface quality or dimensions for at least 7 days (Figure 7 and Figure S3). Interestingly, crosslinked co-crystals without terminal phosphates remained unperturbed, just like the 3′ and 5′ phosphorylated crystals. These results indicate that the protein–protein crosslinks created within the co-crystals were sufficient to maintain macroscopic crystal integrity in water. The distinct stability of crosslinked crystals in water confirmed our hypothesis that crystals can be stabilized with new covalent crosslinks. Specifically, the non-covalent interactions that make up crystals can be stabilized with chemical crosslinking and prevent crystals from degrading rapidly in an ion-environment (deionized water).

4. Discussion

Our strategy in this work was to identify an EDC ligation protocol (EDC concentration, incubation time, and repeated dosage regimen) that optimized reaction yield, without chasing diminishing returns. Accordingly, our final protocol uses 30 mg/mL EDC, an incubation time of 12 h, and two repeated doses within reaction sizes of approximately 200 microliters to ligate the DNA present within approximately 500 ng of co-crystals. Under these conditions, stacked DNA within co-crystals was reliably ligated to a significant extent. We used gel densitometry and detailed Gaussian peak fitting to estimate the fraction of the population for each ligated species (Figure S2).
Global analysis of the ligation product distribution suggested that the most thoroughly crosslinked CC1 crystals feature ligation of approximately 75% of all possible ligation sites, covalently linking about 94% of the DNA–DNA junctions through one or more covalent bond. Ligation was corroborated by single-crystal XRD where we could directly observe ligation in electron density omit maps (Figure 5).
Apart from small systematic deviations, the random ligation model (RLM, Protocol S2) was able to fit the ligation product distribution for CC1 (Figure S12). In contrast, the CC2 ligation results could not be fit to the RLM as accurately (Figure S12). In particular, the CC2 crystals appeared to have a 1-mer mole fraction that was significantly larger than the total PDSB, which is inconsistent with the RLM. This could be explained by invoking transport limitations. Specifically, one way to boost the 1-mer mole fraction is if the exterior of the crystal has a higher ligation probability than the interior (Protocol S3).
Previously mentioned in the introduction, EDC ligation of DNA has been reported in the literature in the context of DNA hairpins in solution, liquid DNA crystals, and DNA origami. Notably, there has not been a consensus for whether 5′ or 3′ phosphate placement results in a superior yield. Fraccia et al. used 3′ phosphates for the EDC ligation of liquid DNA crystals (15), whereas Kramer and Richert used 5′ phosphates for the EDC ligation of a DNA origami structure (14). Giving a comparison of 5′ versus 3′ phosphates, Obianyor et al. showed EDC ligation of a hairpin DNA structure and reported 95% ligation yield for DNA with 3′ phosphates whereas the 5′ phosphates yielded 40% ligation [17]. They hypothesized the 3′ phosphate ligation reaction could benefit from a primary alcohol nucleophile (Figure 1B) and the geometry difference of the two phosphate positions could contribute to reaction yields. Our data suggest that 3′ phosphates may be superior in the context of a crystal, though comparison between CC1 and CC2 suggests that the results may be system dependent. Our XRD data (Figure 5) furthermore suggest that the results may vary for different nick sites within the same crystal.
It is not clear why 3′ phosphates were more readily ligated than 5′ phosphates in CC1. Conceivably, the rate limiting step for the ligation reaction may be the attack of the hydroxyl on the activated EDC intermediate. Perhaps the short-arm 3′-EDC intermediate is more accessible to the long-arm 5′ hydroxyl than a long-arm 5′-EDC intermediate is to a short-arm 3′ hydroxyl. Notably, one of the 3′ phosphates in the CC1 lattice (chain B) is close (5.65 Å) to a symmetry copy of itself (Figure S13), whereas the 5′ phosphate is farther (9.29 Å). Therefore, 3′ phosphate ligation might be favored due to the greater reduction in electrostatic repulsion upon ligation. However, the CC2 ligation results were more balanced (albeit still favoring 3′ phosphates), suggesting that the relative efficacy of 3′ or 5′ phosphates will be system dependent.
Analyses via gel electrophoresis showed that the ligation yield increased concomitant with the EDC incubation time, but also that the reaction yield appeared to plateau short of full ligation. The cause is unclear. Transport considerations and EDC conjugation to protein sites complicate reaction modeling. One consideration is that the predicted active half-life for EDC in water at 298 K is sixteen hours [17]. However, the ligation yields also appeared to plateau for repeated EDC dosing. Perhaps incomplete ligation is due to a small fraction of DNA strands lacking the necessary terminal phosphate. Alternately, perhaps some EDC-activated phosphates have been ligated to third-party molecules. Perhaps a small DNA strand population is missing a base. Further investigation may be worthwhile prior to future work that depends on near 100% ligation.
In addition to optimizing conditions for our two co-crystals, we have established a set of generalizable guidelines for DNA ligation within co-crystals regarding optimal reaction conditions, phosphate composition, and concentration of EDC. First, it is imperative to optimize the wash solution for each respective system, eliminating components that could interfere with crosslinking. Reactive amines and carboxylic acids are obvious components to eliminate, to avoid forming off-target species. Additionally, we empirically found that it was important to minimize the concentration of the standard divalent cation Mg(II). Re-introducing 90–110 mM Mg(II) into our optimized protocol, we observed a dramatic reduction in the yield (Figure S11). Second, since we found that the best phosphate for ligation may depend on subtle geometry differences, we recommend testing both 5′ and 3′ phosphates for new co-crystal systems. Finally, the EDC concentration used for ligation of a new co-crystal may need to be optimized. Our co-crystals did not dissolve when introduced to crosslinking agents, with the highest concentration at 80 mg/mL. However, in past experiments, we found that the concentration of EDC in the crosslinking reaction drop can affect the integrity of co-crystals. Biomolecular crystals are typically fragile, and a drastic change in solution conditions can cause crystals to fall apart. Therefore, when working with a new system, we recommend testing a range of EDC concentrations. Dosing experiments may be necessary for systems that need a “gentle”, multistep transition to harsher conditions. These guidelines may apply to crystals composed of only DNA, as well.
With data for two example co-crystals, generalization is difficult. CC1 and CC2 differ in numerous ways (e.g., DNA length of 21 bp vs. 15 bp, crystal space group, different base pairs spanning the DNA–DNA junction, different DNA sequences in general including flanking base pairs) which makes it difficult to determine which variables may be predictive of ligation yield. Given our observation that ligation may be very sensitive to the nick geometry (Table 3 and Figure 5), we hypothesize that several factors will be particularly important due to their influence on the nick geometry. The DNA sequence at the junction, and to a lesser extent the flanking bases, will affect the base pair stacking energy, which would be expected to change the nick geometry probability distribution. Other nick-site ligation yield differences may be driven by the crystallographic symmetry, particularly the presence or absence of neighboring groups in addition to intrinsic geometry differences between the nick site (e.g., a slightly higher nick distance for chain A nick sites in CC1 crystals).
The crystal stability produced after the chemical ligation of stacked DNA within crystals opens the door for downstream applications, especially for DNA nanotechnology efforts. As shown here, even incomplete ligation can result in dramatic stabilization effects with tangible benefits to suitable application targets. No obvious EDC-induced crosslinks were visible at the two distinct protein–protein interfaces in the CC1 system. Further experiments will be needed to specifically seek and identify any EDC-induced protein–protein or DNA–protein conjugation.
It is possible that DNA ligation provided strong stabilizing effects because both CC1 and CC2 are held together by DNA–DNA junctions in two dimensions (Figure 6 and Figure 7). Essentially, by ligating the stacked DNA in these cases we are forming longer “threads” that are woven together. Stabilization of devices or materials is intriguing if this stabilization allows them to provide or preserve functionality in various biomedical contexts (e.g., in the digestive system, the blood stream, or within lysosomes). It may also be useful if crosslinking allows crystals to remain stable and diffract to high resolution under buffer conditions that mimic physiological conditions (e.g., inside the nucleus), thereby allowing XRD structure determination under conditions besides the idiosyncratic conditions that allow for co-crystal growth.
Along the same lines, one traditional concern crystallographers have regarding crosslinking chemistry is that subjecting a crystal to handling, buffer changes, and reactive chemicals, can degrade the diffraction resolution. For example, subjecting crystals to the common crosslinking agent, glutaraldehyde, can rapidly degrade diffraction resolution. However, supplying aldehydes via gentle vapor diffusion [9] can improve outcomes. We have observed that using glyoxal and EDC can likewise result in negligible diffraction loss, particularly if the reactive chemistry is quenched [11,12]. In the case of CC1, we have once again found that carefully optimized crosslinking protocols can maintain diffraction. Another notable benefit of the EDC crosslinking method is that crystals were not “damaged” during the reaction chemistry. For comparison, when crosslinking HEWL crystals with glutaraldehyde, careful optimization was required to avoid forming cracks in the crystals [31].
Future work may determine if the ligation yield differs for sticky overhang junctions compared to the blunt end junctions used in this work. Similarly, yield may also depend on the DNA bases that span the junction. That said, the current work suggests that the method may be sequence independent because the CC1 junction has a GC/CG and the CC2 junction has an AT/TA. In summary, the reported protocol is a reliable crosslinking strategy using the zero-length crosslinking agent EDC to affect DNA ligation at blunt-end DNA–DNA junctions held together by the co-crystal lattice. Post-ligation stability paves the way for biomedical applications.

Supplementary Materials

The following supporting information can be downloaded at: https://www.mdpi.com/article/10.3390/cryst12010049/s1, Figure S1. TapeStation analysis and matching gel electrophoresis, Figure S2. Densitometry results and annotation (corresponds to main text Figure 4), Figure S3. Co-crystal stability test—water, Figure S4. Co-crystal stability test—very low pH 2.0 to mimic stomach acid, Figure S5. Co-crystal stability test—moderately low pH 4.5 to mimic lysosomal fluid, Figure S6. Co-crystal stability test—blood serum, Figure S7. Gel electrophoresis of varied EDC crosslink time, Figure S8. Gel electrophoresis of varied EDC crosslink concentration, Figure S9. Schematic and gel electrophoresis of varied EDC crosslink dose, Figure S10. Schematic and gel electrophoresis of the controls—crystals with no terminal phosphates and duplexes with terminal phosphates in-solution, Figure S11. Magnesium chloride’s effect on the EDC crosslinking of CC1 crystals, Figure S12. Best fits of random ligation model (RLM) to product distribution data, and Figure S13. Terminal phosphates position due to crystallographic symmetry; Table S1. DNA oligonucleotide sequences used in this study, Table S2. Ligation percentages from gel densitometry (unweighted), Table S3. Full version of densitometry output Table 2, and Table S4: Absolute electron density values for the Figure 5 electron density maps; Protocol S1. Protein sequences for cloning and overexpression in E. coli., Protocol S2. Random ligation model: simulation and calculations, Protocol S3. Spatial biased random ligation model, and Protocol S4. Crystal measurements

Author Contributions

Conceptualization, A.R.Q., S.D., A.V. and C.D.S.; data curation, A.R.Q., S.D., A.V. and C.D.S.; formal analysis, A.R.Q., S.D., A.V. and C.D.S.; funding acquisition, A.R.Q. and C.D.S.; investigation, A.R.Q., S.D., A.V. and C.D.S.; methodology, A.R.Q., S.D., A.V. and C.D.S.; project administration, A.R.Q. and C.D.S.; resources, C.D.S.; software, A.R.Q. and C.D.S.; supervision, A.R.Q. and C.D.S.; validation, A.R.Q., S.D., A.V. and C.D.S.; visualization, A.R.Q. and C.D.S.; writing—original draft, A.R.Q. and C.D.S.; writing—review and editing, A.R.Q., S.D., A.V. and C.D.S. All authors have read and agreed to the published version of the manuscript.

Funding

This material is based upon work supported by the National Science Foundation under Grant No. NSF DMR 2003748 and NSF DMR 1506219. The team also gratefully acknowledges support for undergraduate researchers from the Nelson Family Faculty Excellence Award.

Institutional Review Board Statement

Not applicable.

Informed Consent Statement

Not applicable.

Data Availability Statement

The data presented in this study are openly available in Zenodo at https://doi.org/10.5281/ZENODO.7667968 (accessed on 1 March 2023).

Acknowledgments

Hataichanok (Mam) Scherman, Director of the Histone Source at Colorado State University for the expression and purification of the RepE54 transcription factor and the purification of E2F8 transcription factor. Shing Ho for advice and identifying a flaw in the interpretation of an earlier version of our analysis. Mark Stenglein and Mikaela Samsel at the Next Generation Sequencing Facility at Colorado State University for TapeStation analysis. Jay Nix at the ALS Beamline 4.2.2 for extensive support of the XRD data collection. The Taipale Lab for their CC2 protein plasmid donation. Thaddaus Huber for cloning expertise and PSB3 plasmid.

Conflicts of Interest

The authors declare no conflict of interest.

References

  1. Paukstelis, P.J.; Seeman, N.C. 3D DNA Crystals and Nanotechnology. Crystals 2016, 6, 97. [Google Scholar] [CrossRef]
  2. Hartje, L.F.; Snow, C.D. Protein Crystal Based Materials for Nanoscale Applications in Medicine and Biotechnology. Wiley Interdiscip. Rev. Nanomed. Nanobiotechnol. 2018, 11, e1547. [Google Scholar] [CrossRef]
  3. Ward, A.R.; Snow, C.D. Porous Crystals as Scaffolds for Structural Biology. Curr. Opin. Struct. Biol. 2020, 60, 85–92. [Google Scholar] [CrossRef] [PubMed]
  4. Seeman, N.C. Nucleic Acid Junctions and Lattices. J. Theor. Biol. 1982, 99, 237–247. [Google Scholar] [CrossRef]
  5. Maita, N. Crystal Structure Determination of Ubiquitin by Fusion to a Protein That Forms a Highly Porous Crystal Lattice. J. Am. Chem. Soc. 2018, 140, 13546–13549. [Google Scholar] [CrossRef] [PubMed]
  6. Krauss, I.R.; Merlino, A.; Vergara, A.; Sica, F. An Overview of Biological Macromolecule Crystallization. Int. J. Mol. Sci. 2013, 14, 11643–11691. [Google Scholar] [CrossRef] [PubMed]
  7. Hollis, T. Crystallization of Protein-DNA Complexes. In Macromolecular Crystallography Protocols; Humana Press: Totowa, NJ, USA, 2007; Volume 363, pp. 225–237. [Google Scholar] [CrossRef]
  8. Hermanson, G.T. Bioconjugate Techniques; Academic Press: Cambridge, MA, USA, 2013; ISBN 978-0-12-382240-6. [Google Scholar]
  9. Lusty, C.J. A Gentle Vapor-Diffusion Technique for Cross-Linking of Protein Crystals for Cryocrystallography. J. Appl. Crystallogr. 1999, 32, 106–112. [Google Scholar] [CrossRef]
  10. Yan, E.-K.; Cao, H.-L.; Zhang, C.-Y.; Lu, Q.-Q.; Ye, Y.-J.; He, J.; Huang, L.-J.; Yin, D.-C. Cross-Linked Protein Crystals by Glutaraldehyde and Their Applications. RSC Adv. 2015, 5, 26163–26174. [Google Scholar] [CrossRef]
  11. Hartje, L.F.; Bui, H.T.; Andales, D.A.; James, S.P.; Huber, T.R.; Snow, C.D. Characterizing the Cytocompatibility of Various Cross-Linking Chemistries for the Production of Biostable Large-Pore Protein Crystal Materials. ACS Biomater. Sci. Eng. 2018, 4, 826–831. [Google Scholar] [CrossRef]
  12. Huber, T.R.; Hartje, L.F.; McPherson, E.C.; Kowalski, A.E.; Snow, C.D. Programmed Assembly of Host–Guest Protein Crystals. Small 2017, 13, 1602703. [Google Scholar] [CrossRef]
  13. Zhang, D.; Paukstelis, P.J. Enhancing DNA Crystal Durability through Chemical Crosslinking. ChemBioChem 2016, 17, 1163–1170. [Google Scholar] [CrossRef] [PubMed]
  14. Abdallah, H.O.; Ohayon, Y.P.; Chandrasekaran, A.R.; Sha, R.; Fox, K.R.; Brown, T.; Rusling, D.A.; Mao, C.; Seeman, N.C. Stabilisation of Self-Assembled DNA Crystals by Triplex-Directed Photo-Cross-Linking. Chem. Commun. 2016, 52, 8014–8017. [Google Scholar] [CrossRef]
  15. Gerling, T.; Kube, M.; Kick, B.; Dietz, H. Sequence-Programmable Covalent Bonding of Designed DNA Assemblies. Sci. Adv. 2018, 4, eaau1157. [Google Scholar] [CrossRef]
  16. Li, Z.; Liu, L.; Zheng, M.; Zhao, J.; Seeman, N.C.; Mao, C. Making Engineered 3D DNA Crystals Robust. J. Am. Chem. Soc. 2019, 141, 15850–15855. [Google Scholar] [CrossRef]
  17. Obianyor, C.; Newnam, G.; Clifton, B.; Grover, M.A.; Hud, N.V. Impact of Substrate-Template Stability, Temperature, Phosphate Location, and Nick-Site Base Pairs on Non-Enzymatic DNA Ligation: Defining Parameters for Optimization of Ligation Rates and Yields with Carbodiimide Activation. bioRxiv 2019, 821017. [Google Scholar] [CrossRef]
  18. Fraccia, T.P.; Smith, G.P.; Zanchetta, G.; Paraboschi, E.; Yi, Y.; Walba, D.M.; Dieci, G.; Clark, N.A.; Bellini, T. Abiotic Ligation of DNA Oligomers Templated by Their Liquid Crystal Ordering. Nat. Commun. 2015, 6, 6424. [Google Scholar] [CrossRef]
  19. Kramer, M.; Richert, C. Enzyme-Free Ligation of 5′-Phosphorylated Oligodeoxynucleotides in a DNA Nanostructure. Chem. Biodivers. 2017, 14, 1700315. [Google Scholar] [CrossRef]
  20. Komori, H.; Matsunaga, F.; Higuchi, Y.; Ishiai, M.; Wada, C.; Miki, K. Crystal Structure of a Prokaryotic Replication Initiator Protein Bound to DNA at 2.6 A Resolution. EMBO J. 1999, 18, 4597–4607. [Google Scholar] [CrossRef] [PubMed]
  21. Bi, S.; Pollard, A.M.; Yang, Y.; Jin, F.; Sourjik, V. Engineering Hybrid Chemotaxis Receptors in Bacteria. ACS Synth. Biol. 2016, 5, 989–1001. [Google Scholar] [CrossRef] [PubMed]
  22. Morgunova, E.; Yin, Y.; Jolma, A.; Dave, K.; Schmierer, B.; Popov, A.; Eremina, N.; Nilsson, L.; Taipale, J. Structural Insights into the DNA-Binding Specificity of E2F Family Transcription Factors. Nat. Commun. 2015, 6, 10050. [Google Scholar] [CrossRef] [PubMed]
  23. Ward, A.R.; Snow, C.D. Scripts for Modeling Chemical Ligation of DNA Junctions within Biomolecular Crystals; Zenodo: Geneva, Switzerland, 2021. [Google Scholar]
  24. Newville, M.; Stensitzki, T.; Allen, D.B.; Ingargiola, A. LMFIT: Non-Linear Least-Square Minimization and Curve-Fitting for Python; Zenodo: Geneva, Switzerland, 2014. [Google Scholar]
  25. Kabsch, W. XDS. Acta Crystallogr. D Biol. Crystallogr. 2010, 66, 125–132. [Google Scholar] [CrossRef] [PubMed]
  26. Afonine, P.V.; Grosse-Kunstleve, R.W.; Echols, N.; Headd, J.J.; Moriarty, N.W.; Mustyakimov, M.; Terwilliger, T.C.; Urzhumtsev, A.; Zwart, P.H.; Adams, P.D. Towards Automated Crystallographic Structure Refinement with Phenix. Refine. Acta Crystallogr. D Biol. Crystallogr. 2012, 68, 352–367. [Google Scholar] [CrossRef] [PubMed]
  27. Emsley, P.; Lohkamp, B.; Scott, W.G.; Cowtan, K. Features and Development of Coot. Acta Crystallogr. D Biol. Crystallogr. 2010, 66, 486–501. [Google Scholar] [CrossRef] [PubMed]
  28. Gelbin, A.; Schneider, B.; Clowney, L.; Hsieh, S.-H.; Olson, W.K.; Berman, H.M. Geometric Parameters in Nucleic Acids:  Sugar and Phosphate Constituents. J. Am. Chem. Soc. 1996, 118, 519–529. [Google Scholar] [CrossRef]
  29. Lu, X.-J.; Olson, W.K. 3DNA: A Versatile, Integrated Software System for the Analysis, Rebuilding and Visualization of Three-Dimensional Nucleic-Acid Structures. Nat. Protoc. 2008, 3, 1213–1227. [Google Scholar] [CrossRef]
  30. Olson, W.K.; Gorin, A.A.; Lu, X.-J.; Hock, L.M.; Zhurkin, V.B. DNA Sequence-Dependent Deformability Deduced from Protein–DNA Crystal Complexes. Proc. Natl. Acad. Sci. USA 1998, 95, 11163–11168. [Google Scholar] [CrossRef]
  31. Yan, E.-K.; Lu, Q.-Q.; Zhang, C.-Y.; Liu, Y.-L.; He, J.; Chen, D.; Wang, B.; Zhou, R.-B.; Wu, P.; Yin, D.-C. Preparation of Cross-Linked Hen-Egg White Lysozyme Crystals Free of Cracks. Sci. Rep. 2016, 6, 34770. [Google Scholar] [CrossRef]
Figure 1. The mechanism of chemical DNA ligation with EDC. (A) A terminal 5′ hydroxyl and a terminal 3′ phosphate on neighboring DNA chains. The phosphate interacts with EDC to form an intermediate (B) and the hydroxyl displaces the reactive intermediate to form a zero-length crosslink (C) between the two DNA chains. R1 is the nucleobase and R2 is the phosphate backbone.
Crystals 12 00049 g001
Figure 2. (A) The building block for co-crystal 1 (CC1) consists of the RepE54 transcription factor bound to 21-mer cognate DNA (represented here by PDB entry 1rep). (B) A collection of neighboring CC1 unit cells oriented to show the DNA stacks in 2 dimensions, with protein at 50% transparency. (C) The CC1 lattice has C121 symmetry, and all DNA–DNA junctions are symmetry equivalent to (D) the single DNA–DNA junction shown here. (E) The building block for co-crystal 2 (CC2) consists of the E2F8 transcription factor bound to 15-mer cognate DNA (represented here by PDB entry 4yo2). (F) A collection of neighboring CC2 unit cells oriented to show the DNA stacks in two dimensions, with protein at 50% transparency. (G) The CC2 lattice has P3221 symmetry, and all DNA–DNA junctions are symmetry equivalent to the single DNA–DNA junction shown here. Images were generated in PyMOL.
Crystals 12 00049 g002
Figure 3. Examples of six co-crystal variants relative to a 100 micron scale bar. The CC1 crystals have C121 symmetry and tend to grow as monoclinic prisms: (A) CC1 without terminal phosphates, (B) CC1 with terminal 5′ phosphate, and (C) CC1 with terminal 3′ phosphate. In contrast, CC2 crystals have P3221 symmetry and tend to grow as truncated hexagonal prisms: (D) CC2 without terminal phosphates, (E) CC2 with terminal 5′ phosphate, and (F) CC2 with terminal 3′ phosphate.
Crystals 12 00049 g003
Figure 4. TBE-urea gels of: (A) CC1; and (B) CC2 chemical ligation. In both co-crystals, additional ligation was achieved with increased EDC concentration and a second EDC dose. (A) A 10% TBE-urea gel of CC1 illustrating a much-improved ligation product distribution for 3′ vs. 5′ phosphates. (B) A 15% TBE-urea gel of CC2 illustrating a modestly improved ligation product distribution for 3′ vs. 5′ phosphates. Assigned band sizes are given in nt.
Crystals 12 00049 g004
Figure 5. Omit maps for (A) the CC1 DNA–DNA junction. (B) Our updated model for the original structure resolves one of the dangling 5′ terminal bases (white sticks). Prior to ligation, CC1 crystals grow with either (C) terminal 3′ phosphates or (D) terminal 5′ phosphates. Whereas (E) low dose EDC ligation results in minor changes to the electron density for CC1 with 3′ phosphates, (F) high dose EDC ligation results in electron density consistent with ligated DNA. Neighboring protein is hidden for clarity. All meshes are omit maps (mFo-DFc) contoured at 3.0 rmsd. All four bases flanking the junction (orange sticks) were omitted. To faithfully represent COOT contours in PyMOL, we turned off automatic map normalization and instead set the contour level to 3.0 rmsd. Table S4 has the corresponding e/Å3 values.
Crystals 12 00049 g005
Figure 6. A survey of crosslinked crystals (15 mg/mL EDC 20 h) with terminal 3′ phosphates in four stringent solutions. (A) CC1-3′p crosslinked crystals incubated in pH 4.5, pH 2.0 and water for seven days and blood serum for twenty-four hours. (B) CC2-3′p crosslinked crystals incubated in pH 4.5, pH 2.0 and water for seven days and blood serum for twenty-four hours.
Crystals 12 00049 g006
Figure 7. The crystals were crosslinked with 15 mg/mL EDC for 20 h and quenched with Tris base pH 8.2 for 30 min prior to transfer to the wash solution. All scale bars are 100 µm. (A) CC1 crystals in wash solution containing 50 mM NaCl, 14% PEG 400, and 200 mM MES buffer pH 6.0. The concentrations of the wash solution matched the initial crystal growth solutions, but we replaced MgCl2 with NaCl and Tris HCl pH 8.0 with MES buffer pH 6.0. (B) CC1 crystals after transitioning to an ion-free environment (deionized water). The crosslinked crystals (left three panels) remained intact for 7 days. Non-crosslinked control crystals (right three columns) dissolved or converted to an aggregate at various immediate time points.
Crystals 12 00049 g007
Table 1. X-ray diffraction statistics for the updated original CC1 crystal, the CC1 crystal with terminal 5′ phosphates, and the CC1 crystal with terminal 3′ phosphates.
Updated CC1 Original
PDB Code 7rva
CC1 5′p
PDB Code 7sdp
CC1 3′p
PDB Code 7sgc
Data collection
Light sourceSynchrotronSynchrotronSynchrotron
Wavelength (Å)1.01.01.0
Resolution range (Å)33.78–1.89 (1.958–1.89) *34.45–2.7 (2.796–2.7) *37.68–3.01 (3.118–3.01) *
Space groupC 1 2 1C 1 2 1C 1 2 1
Unit cell dimensions
a, b, c (Å)107.578 80.715 73.299109.161 83.051 74.349109.142 83.089 74.593
α, β, γ (°)90 122.63 9090 123.948 9090 122.691 90
Total reflections152,923 (15,187)51,877 (5051)40,979 (3834)
Unique reflections41,778 (2501)14,436 (1425)11,132 (1074)
Multiplicity3.7 (3.6)3.6 (3.5)3.7 (3.5)
Completeness (%)90.98 (59.52)93.97 (92.88)98.37 (94.79)
Mean I/sigma(I)10.77 (1.71)13.56 (1.69)11.45 (1.67)
Wilson B-factor32.2861.157
R-merge0.05735 (0.7813)0.06375 (0.7563)0.1406 (1.383)
R-meas0.06726 (0.9191)0.07496 (0.8954)0.1652 (1.638)
R-pim0.03484 (0.4793)0.03905 (0.4741)0.08579 (0.8663)
CC1/20.998 (0.749)0.997 (0.669)0.993 (0.574)
CC *1 (0.926)0.999 (0.895)0.998 (0.854)
Refinement
Reflections used in refinement38,499 (2501)14,342 (1422)11,060 (1074)
Reflections used for R-free2007 (132)752 (78)586 (55)
R-work0.2074 (0.5745)0.1866 (0.3206)0.1820 (0.3258)
R-free0.2490 (0.5833)0.2457 (0.4038)0.2351 (0.3987)
CC (work)0.972 (0.374)0.968 (0.792)0.973 (0.730)
CC (free)0.937 (0.202)0.964 (0.578)0.929 (0.546)
Number of non-hydrogen atoms297028002825
Macromolecules276627702776
Ligands332
Solvent2012747
Protein residues228230232
RMS (bonds) (Å)0.0090.0110.012
RMS (angles) (°)1.111.31.35
Ramachandran favored (%)98.1495.8595.43
Ramachandran allowed (%)1.864.154.57
Ramachandran outliers (%)000
Rotamer outliers (%)000
Clashscore3.148.458.41
Average B-factor55.7375.3262.28
Macromolecules56.0775.4962.69
Ligands55.1478.1252.05
Solvent51.0857.8538.7
Number of TLS groups101010
* Values in parentheses are for high-resolution shell.
Table 2. X-ray diffraction statistics for the CC1 crystal with terminal 3′ phosphates and low crosslink (5 mg/mL EDC for 12 h) and the CC1 crystal with terminal 3′ phosphates and heavy crosslink (two doses of 30 mg/mL EDC for 12 h).
CC1 3′p
Low EDC Crosslink
5 mg/mL EDC for 12 h
PDB Code 7soz
CC1 3′p
Heavy EDC Crosslink
2 Doses of 30 mg/mL EDC for 12 h
PDB Code 7spm
Data collection
Light sourceSynchrotronSynchrotron
Wavelength (Å)1.01.0
Resolution range (Å)37.05–3.14 (3.252–3.14) *33.78–3.28 (3.397–3.28) *
Space groupC 1 2 1C 1 2 1
Unit cell dimensions
a, b, c (Å)111.993 79.181 74.903110.817 80.174 74.723
α, β, γ (°)90 123.023 9090 122.899 90
Total reflections34,361 (3280)31,305 (3106)
Unique reflections9433 (884)8467 (830)
Multiplicity3.6 (3.6)3.7 (3.7)
Completeness (%)95.82 (90.02)97.95 (93.58)
Mean I/sigma(I)10.37 (2.22)8.42 (2.09)
Wilson B-factor83.3694.48
R-merge0.08469 (0.5434)0.1187 (0.6541)
R-meas0.09971 (0.6391)0.1394 (0.7672)
R-pim0.05208 (0.3334)0.0724 (0.3973)
CC1/20.997 (0.946)0.998 (0.94)
CC *0.999 (0.986)0.999 (0.984)
Refinement
Reflections used in refinement9290 (857)8356 (802)
Reflections used for R-free498 (49)448 (40)
R-work0.1936 (0.3019)0.2010 (0.3183)
R-free0.2637 (0.3575)0.2528 (0.3556)
CC (work)0.982 (0.891)0.985 (0.869)
CC (free)0.915 (0.899)0.987 (0.932)
Number of non-hydrogen atoms26912649
Macromolecules26872641
Ligands11
Solvent37
Protein residues224221
RMS (bonds) (Å)0.0120.015
RMS (angles) (°)1.491.63
Ramachandran favored (%)91.2891.16
Ramachandran allowed (%)8.728.37
Ramachandran outliers (%)00.47
Rotamer outliers (%)00
Clashscore14.3614.92
Average B-factor109.8130.22
Macromolecules109.91130.43
Ligands3038.22
Solvent38.2863.68
Number of TLS groups1010
* Values in parentheses are for high-resolution shell.
Table 3. DNA–DNA junction geometry parameters before and after phosphorylation and ligation. The likelihood of successful chemical ligation for stacked DNA may depend on geometry details across the junction. Here, we compare the geometry of the junction in the parent PDB models for CC1 and CC2, as well as the blunt-ended 5′ or 3′ phosphorylated CC1 crystals, to the geometry of contiguous bases in idealized B-DNA from Olson et al., 1998 [30]. The junctions are not symmetric, and differing distances for the two nicks across the junctions are also shown.
Junction Parameters from x3dnaCC1 CC2B-DNA *CC1-5′PCC1-3′PCC1-3′P EDC
Heavy
PDB code7rva4yo2 7sgc7sdp7spm
Base pair step parametersGC/CGAT/TA GC/CGGC/CGGC/CG
Shift (Å)−0.030.360.0 ± 0.510.100.050.50
Slide (Å)−0.81−1.270.35 ± 0.78−1.00−2.03 −0.52
Rise (Å)3.493.613.32 ± 0.193.78 3.564.02
Tilt (°)1.870.910.0 ± 3.42.510.721.72
Roll (°)1.25−15.84 1.4 ± 5.11.944.032.10
Twist (°)36.6420.95 35.4 ± 6.339.1028.1836.67
Nick distances C5′ to O3′
Chain A: (C for CC2)3.643.712.734.014.223.46
Chain B: (D for CC2)3.453.862.733.393.753.30
* Base pair step parameters from Olson et al. 1998 [30]. C5′ to O3′ distance from x3dna idealized B-DNA. Values differ from B-DNA by more than 2 standard deviations. Values are the distances in the refined “discovery” models prior to addition of the 3′ phosphate (not PDB 7spm).
Table 4. Distribution of DNA block sizes as a function of crosslinking protocol and 3′ vs. 5′ terminal phosphates. The data shown correspond with the gel lanes in Figure 4. The crosslinking protocols low, medium, and high were 1 dose of 5 mg/mL EDC for 12 h, 1 dose of 30 mg/mL EDC for 12 h, and 2 doses of 30 mg/mL EDC for 12 h each, respectively. The values in this table are weighted so that the DNA length and dye intensity contributes to the final value. Unweighted values are found in Table S2. The full table, including estimated mole fractions for higher-order products, is found in Table S3. PSSB, PLIG, and PDSB were calculated for each crosslinked crystal sample. Uncertainties are standard deviations in derived quantities after 500 trials in which noise (standard deviation 0.03) is introduced into relative band intensities.
Parent CrystalCC1-3′P CC1-3′PCC1-3′PCC1-5′PCC1-5′PCC1-5′P
Crosslinking Protocollowmediumhighlowmediumhigh
DNA block size[%][%][%][%][%][%]
158.730.024.998.691.682.1
218.716.814.91.47.39.9
315.215.315.6 1.06.3
45.011.011.0 0.21.5
52.46.38.4 0.2
6 6.56.9
7 4.45.8
8 and above 9.712.5
P S S B   *0.58 ± 0.010.28 ± 0.010.25 ± 0.010.99 ± 0.010.91 ± 0.020.78 ± 0.02
P L I G = 1 P S S B 0.42 ± 0.010.72 ± 0.010.75 ± 0.010.01 ± 0.010.09 ± 0.020.22 ± 0.02
P D S B = ( P S S B ) 2 0.33 ± 0.010.08 ± 0.010.06 ± 0.0050.97 ± 0.020.83 ± 0.040.61 ± 0.03
Parent CrystalCC2-3′PCC2-3′PCC2-3′PCC2-5′PCC2-5′PCC2-5′P
Crosslinking Protocollowmediumhighlowmediumhigh
DNA block size[%][%][%][%][%][%]
194.480.374.496.984.872.2
22.64.83.31.25.63.1
31.54.54.41.94.97.7
40.83.63.7 2.65.2
50.72.52.9 1.12.9
6 1.32.9 1.02.7
7 1.32.3 1.9
8 and above 1.76.1 4.3
P S S B   *0.90 ± 0.030.61 ± 0.030.45 ± 0.020.95 ± 0.020.75 ± 0.020.48 ± 0.01
P L I G = 1 P S S B 0.10 ± 0.030.39 ± 0.030.55 ± 0.020.05 ± 0.020.25 ± 0.020.52 ± 0.01
P D S B = ( P S S B ) 2 0.82 ± 0.050.37 ± 0.050.20 ± 0.020.91 ± 0.040.57 ± 0.030.23 ± 0.01
* Calculated from experimental mole fractions per Equation (1). Other probabilities are calculated using the formulas shown. The double-strand break probability estimate makes the assumption that ligation probability of both nicks at the same DNA–DNA junction are the same and independent. Uncertainty (Δ) propogation: Δ P D S B = ( 2 · P S S B · Δ P S S B ) 2 .
Publisher’s Note: MDPI stays neutral with regard to jurisdictional claims in published maps and institutional affiliations.

