Article

Rietveld Refinement and X-ray Absorption Study on the Bonding States of Lanthanum-Based Perovskite-Type Oxides La1−xCexCoO3

1
Institute of Physics, Academia Sinica, Taipei 115, Taiwan
2
Department of Engineering and System Science, National Tsing Hua University, Hsinchu 30013, Taiwan
3
Institute of Nuclear Engineering and Science, National Tsing Hua University, Hsinchu 30013, Taiwan
*
Authors to whom correspondence should be addressed.
Crystals 2022, 12(1), 50; https://doi.org/10.3390/cryst12010050
Submission received: 6 December 2021 / Revised: 22 December 2021 / Accepted: 27 December 2021 / Published: 30 December 2021

Abstract

:
Metal-oxygen bonding of the Ce-doped LaCoO3 system remains largely unexplored despite extensive studies on its magnetic properties. Here, we investigate the structure and local structure of nanoscale La1−xCexCoO3, with x = 0, 0.2, and 0.4, using the Rietveld refinement and synchrotron X-ray absorption techniques, complemented by topological analysis of experimental electron density and electron energy distribution. The Rietveld refinement results show that LaCoO3 subject to Ce addition is best interpretable by a model of cubic symmetry in contrast to the pristine LaCoO3, conventionally described by either a monoclinic model or a rhombohedral model. Ce4+/Co2+ are more evidently compatible dopants than Ce3+ for insertion into the main lattice. X-ray absorption data evidence the partially filled La 5d-band of the pristine LaCoO3 in accordance with the presence of La–O bonds with the shared-type atomic interaction. With increasing x, the increased Ce spectroscopic valence and enhanced La–O ionic bonding are noticeable. Characterization of the local structures around Co species also provides evidence to support the findings of the Rietveld refinement analysis.

1. Introduction

Lanthanum transition metal perovskites (of chemical formula LaBO3) have recently attracted tremendous attention due to their pivotal importance from both fundamental and practical points of view. The B-site transition metal coordinates with the six nearest O atoms, forming an octahedral environment in the bulk of the perovskite structure. On the surface layer, the BO6 octahedron lacks an apical O atom and exposes the B site. This active site plays an essential role in facilitating a variety of catalytic reactions in heterogeneous catalysis [1] and electro-catalysis [2]. Therefore, it is beneficial to develop fabrication methods for oxide perovskites with increased specific surface areas and abundant active sites [3]. Cobalt ions can adopt some different oxidation states. On that account, lanthanum cobaltite perovskite LaCoO3 (LCO) endows flexibility in regulating the valence distribution of the Co ion by hole doping or electron doping [4]. This perspective has prompted a burgeoning interest in and extensive studies on the tunable electronic structure of LCO. The objective is to scale down the perovskite structures into the nanoscale regime and incorporate rare earth ions with various valences into these structures to enhance their catalytic activity and expand their applications [5].
The physics of pristine LCO and metal-doped counterparts show an abundance of peculiar properties. The interpretation for the crystal structure of LCO has been a rhombohedral R-3c symmetry [6,7], where a Jahn-Teller distortion [8] is absent. A monoclinic symmetry of space group I2/a [7,9] is also possible, of which the spin state of the Co3+ ion is Jahn-Teller active. Accordingly, the rhombohedral lattice preserves one Co–O distance, but the monoclinic structure exhibits a differentiation of Co–O bond lengths [9]. There has long been a discussion on the spin states of these compounds, which also involves a conventional picture with the splitting of t2g and eg orbitals and the double-exchange model with the eg band as the conduction channel [8,10,11,12,13,14,15,16,17]. Rare earth metal substitution that alters the oxidation state of Co can also modulate the occupancy of the eg-like orbitals and thus the nature of the metal-oxygen bond. Earlier research works on hole-doped LCO found a quasi-stable spin state crossing the Fermi level [15] and that the eg states interact with O 2p states, spreading over a wide energy range [18]. These findings elicit the same line of inquiry on cerium doping to understand the changes in the metal-oxygen bonding properties associated with the electron-doped LCO.
Previous studies on the Ce-doped LCO system have mainly explored the magnetic properties but have paid little attention to the metal-oxygen bonding [19,20,21,22]. These works demonstrate that Ce-doping can induce and stabilize the intermediate spin or low-spin high-spin configurations and hint that a high content of dopants may increase the occupancy of the eg-like states. However, up-to-date studies remain scarce on the possible phase transformation of Ce-doped LCO with high Ce contents and the connection with changes in the local structure. In particular, the details of how Ce-doping modifies the atomic interactions of metal-oxygen bonding, especially the La–O bonding, are still largely unexplored.
In this work, we report on the structure and local structure of nanoscale La1−xCexCoO3, where x is the nominal degree of substitution and x = 0, 0.2, and 0.4. We use the Rietveld refinement method to fit various models of the main lattice and valence and fraction of Ce dopants to the experimental X-ray diffraction (XRD) data. For clarity, such notations as La1−sCesCoO3 or La 1 s 3 + Ce s 4 + Co 1 s 3 + Co s 2 + O 3 will refer to the main lattice, depending on the form of Ce dopants. The data do not precisely point out to what extent Ce can be present in the LCO lattice. Nevertheless, we find Ce insertion into the main phase plausible and the Ce4+/Co2+ ions more favorable than Ce3+ ions as dopants. Our estimates of the Ce valence of total Ce species in the sample are achievable based on X-ray absorption near edge structure (XANES) data at Ce L3-edge. We illuminate the noticeable change of XANES spectra at La L3-edge as an effect of Ce-doping by conducting the topological analysis of the experimental electron densities and mapping the corresponding electronic energy distributions. We also present an in-depth investigation on the extended X-ray absorption structure (EXAFS) by fitting to data using the models built from the Rietveld refinement results. Building fitting models to EXAFS spectra of these samples is highly challenging due to three issues: (1) each sample involves two scattering phases, (2) the secondary scattering phase, realized as a Co3O4-like phase, has two inequivalent adsorbing sites, and (3) handling dopants, which is an arcane manipulation. Hence, we needed a sophisticated strategy in EXAFS data analysis, as discussed in the following sections.

2. Experiments

La1−xCexCoO3 perovskites were synthesized via the sol-gel method [23] from metal nitrates, with citric acid as the chelating agent (Carl Roth GmbH, Karlsruhe, Germany). The precursors were dewatered at 80 °C until gel formation, then dried overnight at 100 °C in vacuum, and finally milled and calcined at 700 °C in air for 5 h. Crystal structures of the obtained products were investigated by X-ray diffraction (XRD) using a PANalytical X-Pert Pro Diffractometer (Malvern Panalytical, Malvern, UK) with Cu Kα radiation (λ = 1.540598 Å). The data were collected in the angular range of 19° ≤ 2θ ≤ 80°, with scanning steps of 0.01° and a cumulative time of 15 s/step.
X-ray absorption spectroscopy (XAS) data at the Co K edge (7709 eV), La L3 edge (5483 eV), and Ce L3 edge (5723 eV) were measured at room temperature at the BL-07A and BL-17C [24] beamlines of the Taiwan Light Source. The monochromator was detuned by 20% to suppress higher harmonic radiation. Energy calibration was performed by assigning the position of the first inflection point of the absorption spectrum of a Co foil to 7.709 keV. The same procedure was applied to a V foil for calibrating the initial energy at the V L3 edge to 5.465 keV. Because pure La and Ce metals are oxidized easily, we used this alternative calibration method to prepare for the XAS measurements at La L3 edge and Ce L3 edge. The incident (I0) and the transmitted beam (It) were measured using sealed ion chambers, with a combination of gases for appropriate absorption. The XAS data were recorded up to 16 Å−1 in k-space beyond the absorption edge, with a constant step of Δ k = 0.06 Å−1. The dwell time was adjusted progressively from 4 to 16 s based on how large the scanning energy was compared to the absorption edge. Four scans were collected for each absorption edge of interest.

3. Data Analysis

Quantitative analysis Rietveld refinement of the XRD data was carried out using the Marquardt least-squares algorithm, implemented in the Materials Analysis Using Diffraction (MAUD) software package (Luca Lutterotti, Trento, Italy) [25]. We performed Rietveld full-spectrum fitting for various models to determine backgrounds, unit-cell parameters, weight percentages, and microstructure for the individual phases present in each sample. Regarding the main lattice, we considered six initial models, including three different perovskite structures and two forms of dopants. The three structures are rhombohedral, monoclinic, and cubic, described by the space groups R-3c: R (No. 167) [26], I12/a1 (No. 15) [7], and Pm-3m (No. 221) [27], respectively. The two cases of dopants were Ce3+ and Ce4+. For the case Ce4+, the cobalt ions were set to adopt Co2+ for charge compensation. In addition, we introduced s, the fraction of cerium dopants, into the main lattice as La1−sCesCoO3 or La 1 s 3 + Ce s 4 + Co 1 s 3 + Co s 2 + O 3 and performed a series of fits, altering the value of s from 0 to 1 by an increment of 0.05. We also considered a secondary phase as cubic Co3O4 (space group Fd-3m, No. 227) [28] for the x = 0 sample, and as cubic CeO2 (space group Fm3m, No. 225) [29] for the x = 0.2 and x = 0.4 samples. The quality of Rietveld fits was evaluated based on both the visual inspection of observed and calculated patterns and the comparison of the values of discrepancy indices. The most straightforward index is the weight profile R-factor (Rwp) [30].
X-ray absorption near edge structure (XANES) spectra at the Ce L3-edge of La1−xCexCoO3 were analyzed by the conventional superposition method, as in some earlier works [31,32,33,34]. We performed the first derivative test to find the extremum points. The result gave two local maximum points and one minimum point, corresponding to two component peaks and the valley between them. We also determined an inflection point by inspecting the second derivative. In total, three line-shapes were used in a least-squares fit to the XANES data: two Gaussian line-shape functions to describe the localized final states and an arctangent edge jump function to represent the transition into continuum states.
To explain the observed XANES spectra at the La L3 edge, reported in the next part of this paper, we put forward a comprehensive characterization of La–O bonding in the main lattice phase of three lattice models. First, we reconstructed the crystal electron density directly, based on the results of the Rietveld refinement for the XRD data [35]. The spatial resolution of the model electron density was 0.042 Å. The model electron density provided us with the topological analysis of the intermolecular interactions between La and O. We then calculated the electron energy distribution from the experimental electron density, which is a straightforward way to recognize the atomic interaction type of La–O in the lattice model of interest. The theory of this approach is described in detail in the work of Tsirelson [36]. Utilities of the Visualization for Electronic and Structural Analysis (VESTA) software (Koichi Momma, Ibaraki, Japan) [37] were used for model visualizations and two-dimensional data display.
The EXAFS data at the Co K-edge were analyzed using the Demeter package [38]. We performed XAS data processing in the Athena program. The multi-step procedure resulted in the extracted EXAFS oscillation and Fourier transform for each XAS spectrum, which was then fitted in the Artemis program. Forward Fourier transformations of the EXAFS data were performed in the Δ k range of 3.3–16 Å−1 using the Kaiser-Bessel window.
We conducted an unconventional approach [39,40] to include a mixture of two scattering phases in each sample. Theoretical scattering paths, as listed in Table 1, were generated with the structural parameters obtained from the Rietveld analyses for the XRD data. For the sample with x = 0, we assumed a mixture of a rhombohedral main lattice and a cubic Co3O4-like phase. For both the x = 0.2 and x = 0.4 samples, we considered a combination of a cubic main lattice and a cubic Co3O4-like phase. To interpret the introduced structure of Co3O4 in a manner compatible with the Demeter program, we transformed the non-standard setting Fd-3m:1 [28] into the standard Fd-3m using a shift vector of (1/8, 1/8, 1/8). The list of potentials was complemented with a new potential index and the atomic number for Ce. Changes of La tags to be Ce in the list of atom coordinates were also done in addition to appropriate adjustment of the corresponding potential index before running the FEFF calculation. We aimed to deal with the information-limited problem to fit for a Δ R range of 1–4 Å. The relation N 2 / π Δ R × Δ k suggested approximately 24 independent parameters. Normal “strict degeneracy” was used for the FEFF calculation for the main scattering phase, but the so-called “fuzzy degeneracy” [41] with a margin of 0.03 Å was applied for the aggregate FEFF calculation over two sites of the Co3O4-like scattering phase. The number of scattering paths was therefore reduced substantially to only three single scattering paths (SS), as listed in Table 2 and Table 3 for the secondary scattering phase. We also included two multiple scattering paths in the model for the main lattice, that is, a three-legged path @O1.1Co1.1@ and a four-legged path @O1.1Co1.1O1.1@. In a cubic main phase, these forward scattering paths are perfectly focused and do not put in new free parameters to a fit [39]. In a rhombohedral main phase, these paths are partially focused. Since the angle with the vertex at Co is only 8.5° [39], as determined from the result of the Rietveld refinement, both paths can be treated as the same as the single-scattering path @Co1.1@. However, we found that the quality of the fit could be statistically improved by strictly defining the Δ R j of the path @O1.1Co1.1@ as ( 2 Δ R O 1.1 Δ R C o 1.1 ) / 2 , as shown in Table 2. We used an expansion factor α and the built-in Reff value to describe the isotropic change of all paths of any cubic phase. The variable for Δ R j of the Co3O4-like scattering phase is expressed as αReff in Table 2. In Table 3, the settings α1Reff and α2Reff account for the change in distance of all paths of the main lattice and the secondary phase, respectively.
Regarding all the above-mentioned details, we parametrized 14 variables for σ j i 2 , Δ E 0 j , and Δ R j for the case x = 0 and 10 variables for the cases x = 0.2 and x = 0.4, as displayed in Table 2 and Table 3, respectively. Additionally, there was one more variable not shown in these tables, which accounts for the amplitude term S 0 2 for each case of x. The amplitudes of the main scattering phase and the secondary phase correlate by the formula S 0 2 = S main 2 + S secondary 2 . We implemented fits to the data simultaneously with multiple k weightings (i.e., k to k3). Phase correction for the radial distance was made based on the Co–O pair of the main scattering phase.

4. Results and Discussion
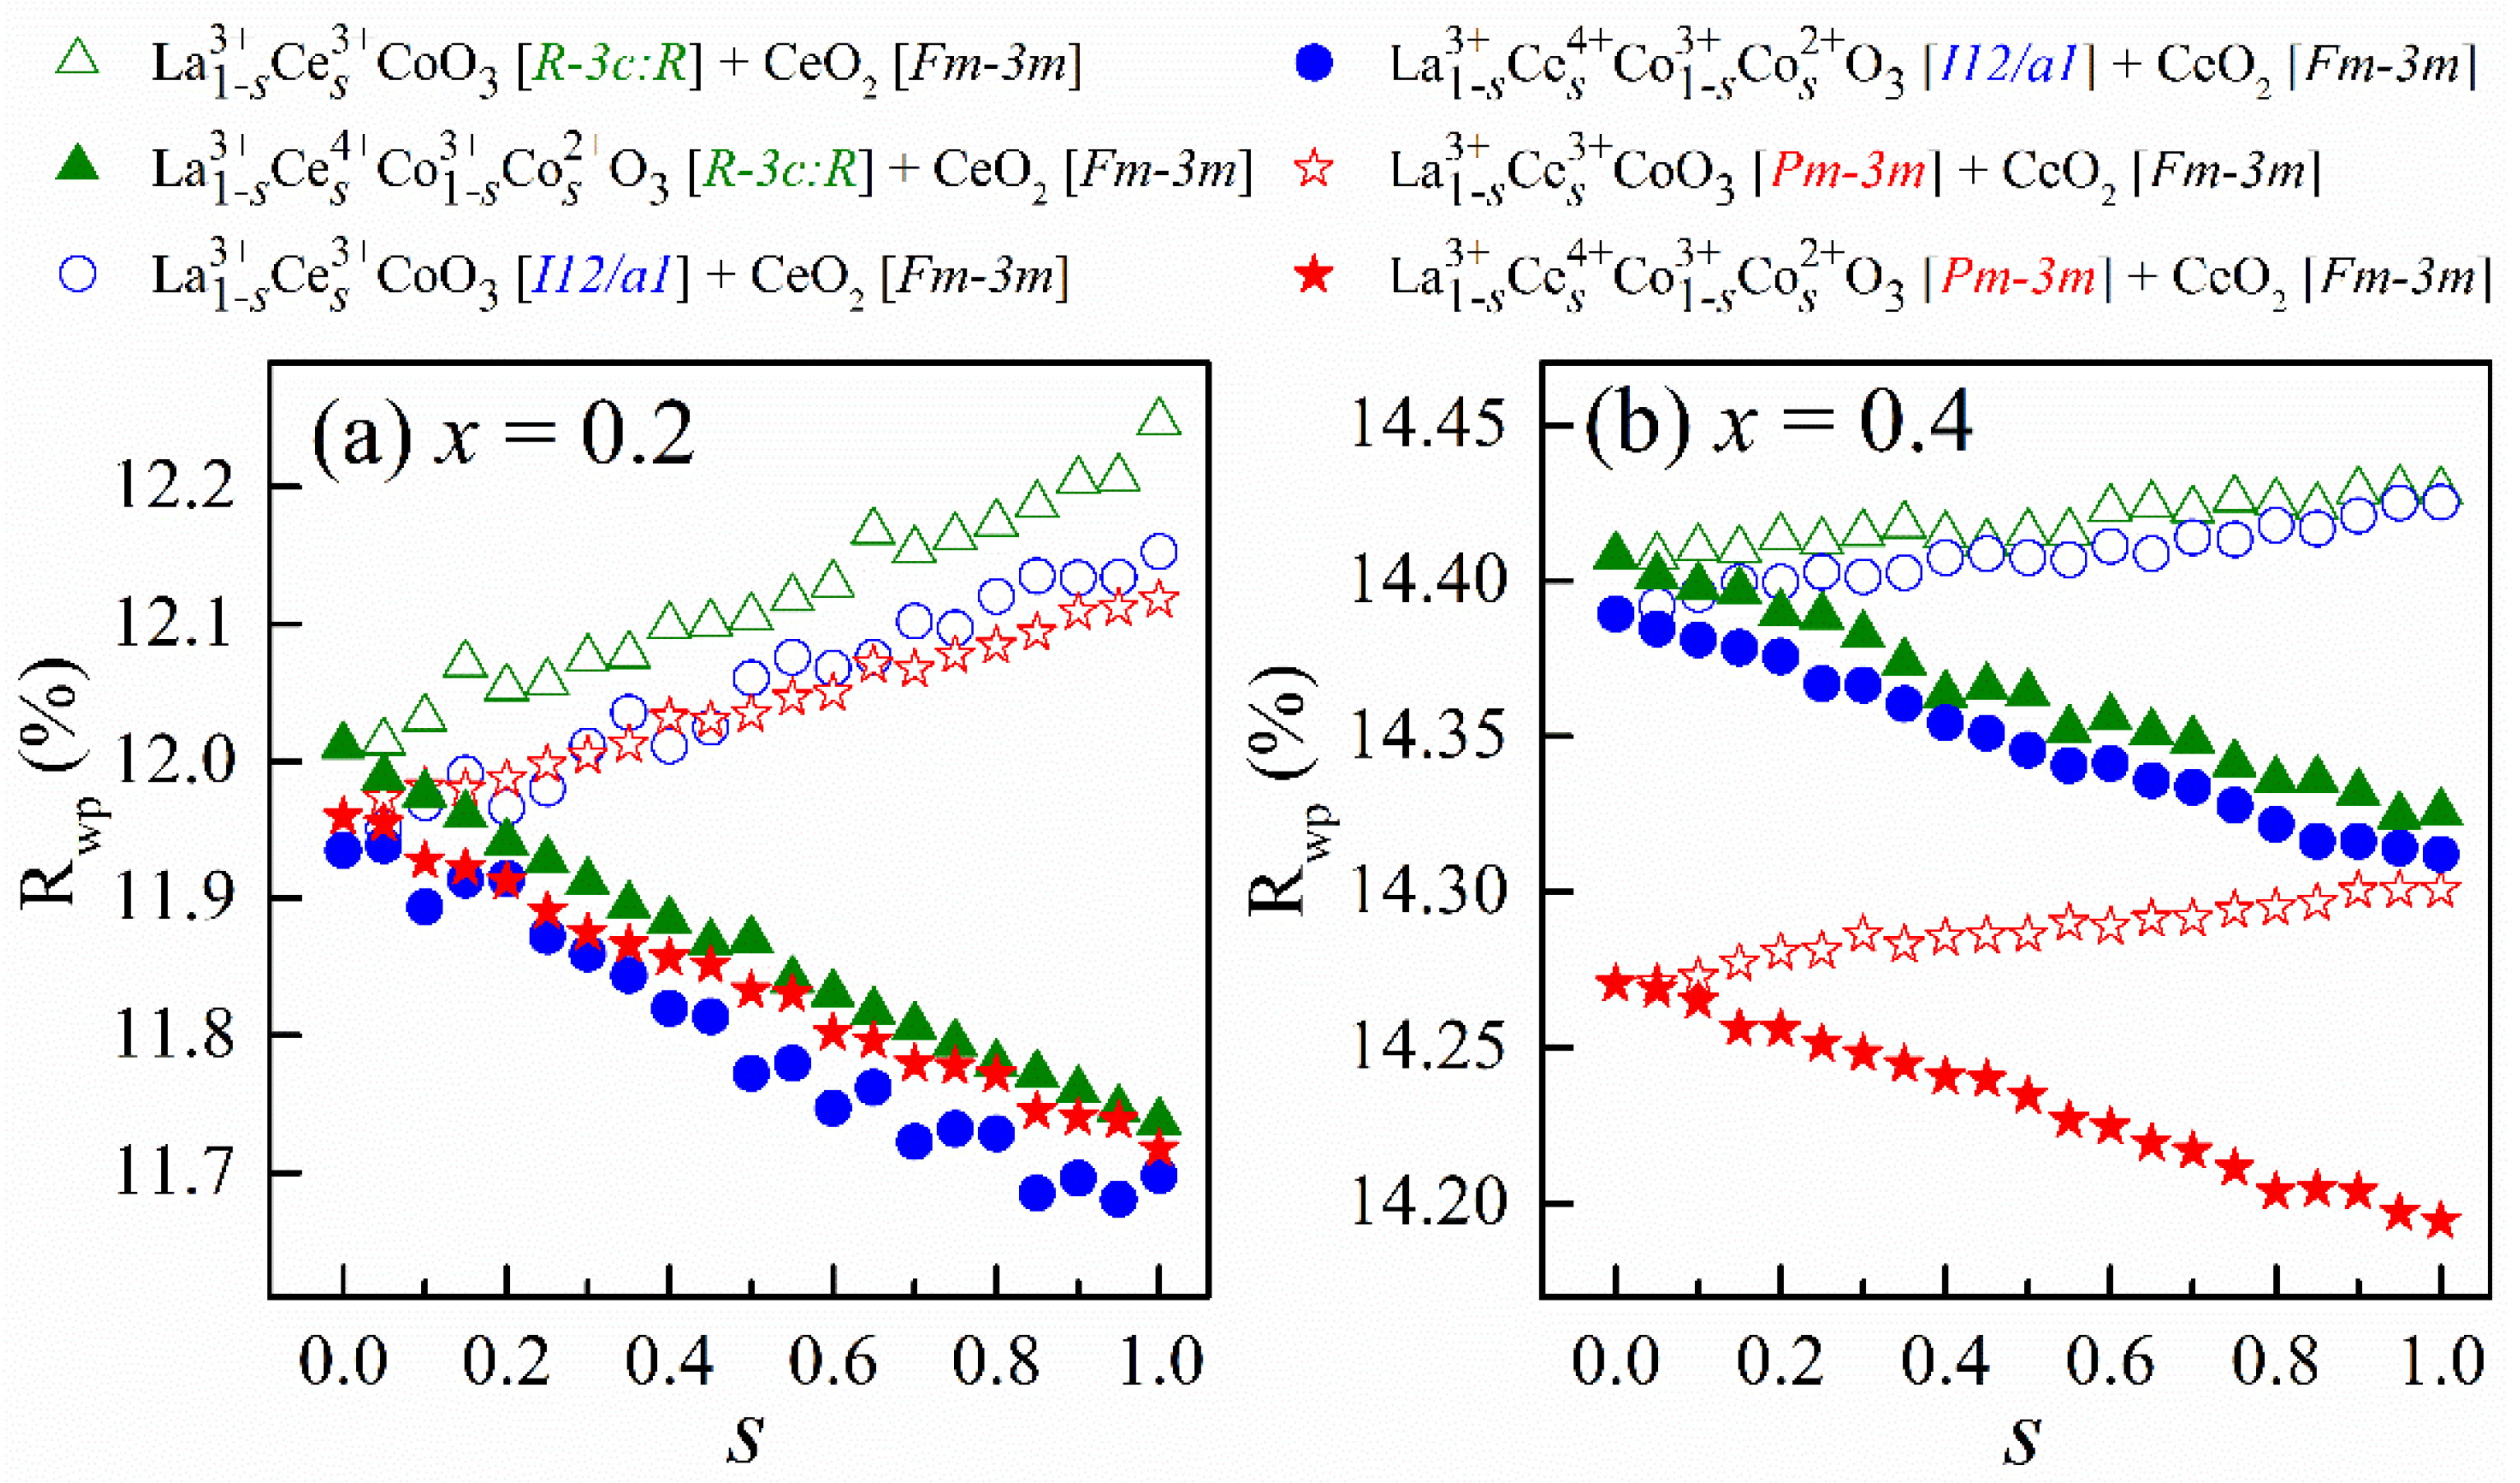
Figure 1 shows Rwp as a function of s for 252 fits to the experimental XRD data of La1−xCexCoO3. It is worth repeating that s accounts for the atomic percent of Ce in La1−sCesCoO3, the main lattice. Such use of s is to conveniently tackle the question as to whether Ce is present and to what extent in the host lattice. The inquiry emerges from a prior admission [20] for an already formed secondary phase, CeO2, if the nominal composition of Ce is higher than 0.03. We find that the two-phase model results in statistically better refinement than the single-phase model. All the resultant Rwp are lower than 15%, which meets the requirement for an adequate Rietveld refinement. Both cases of x reveal that when combining Ce4+ and Co2+ as substitutes for La3+, the Rwp are lower than those where the dopants are Ce3+, highlighting the importance of the charge compensation by Co2+. However, since the Rwp changes linearly and nearly monotonically with s, the absolute extent of Ce insertion into the host lattice remains inconclusive. Further, for x = 0.2, the Rwp regarding each form of dopant are comparable among the three space groups of the main lattice. For x = 0.4, respecting space groups of the main lattice, the Rwp for cubic Pm-3m are lower than those for rhombohedral R-3c: R and monoclinic I12/a1, which holds for both forms of dopants under consideration.
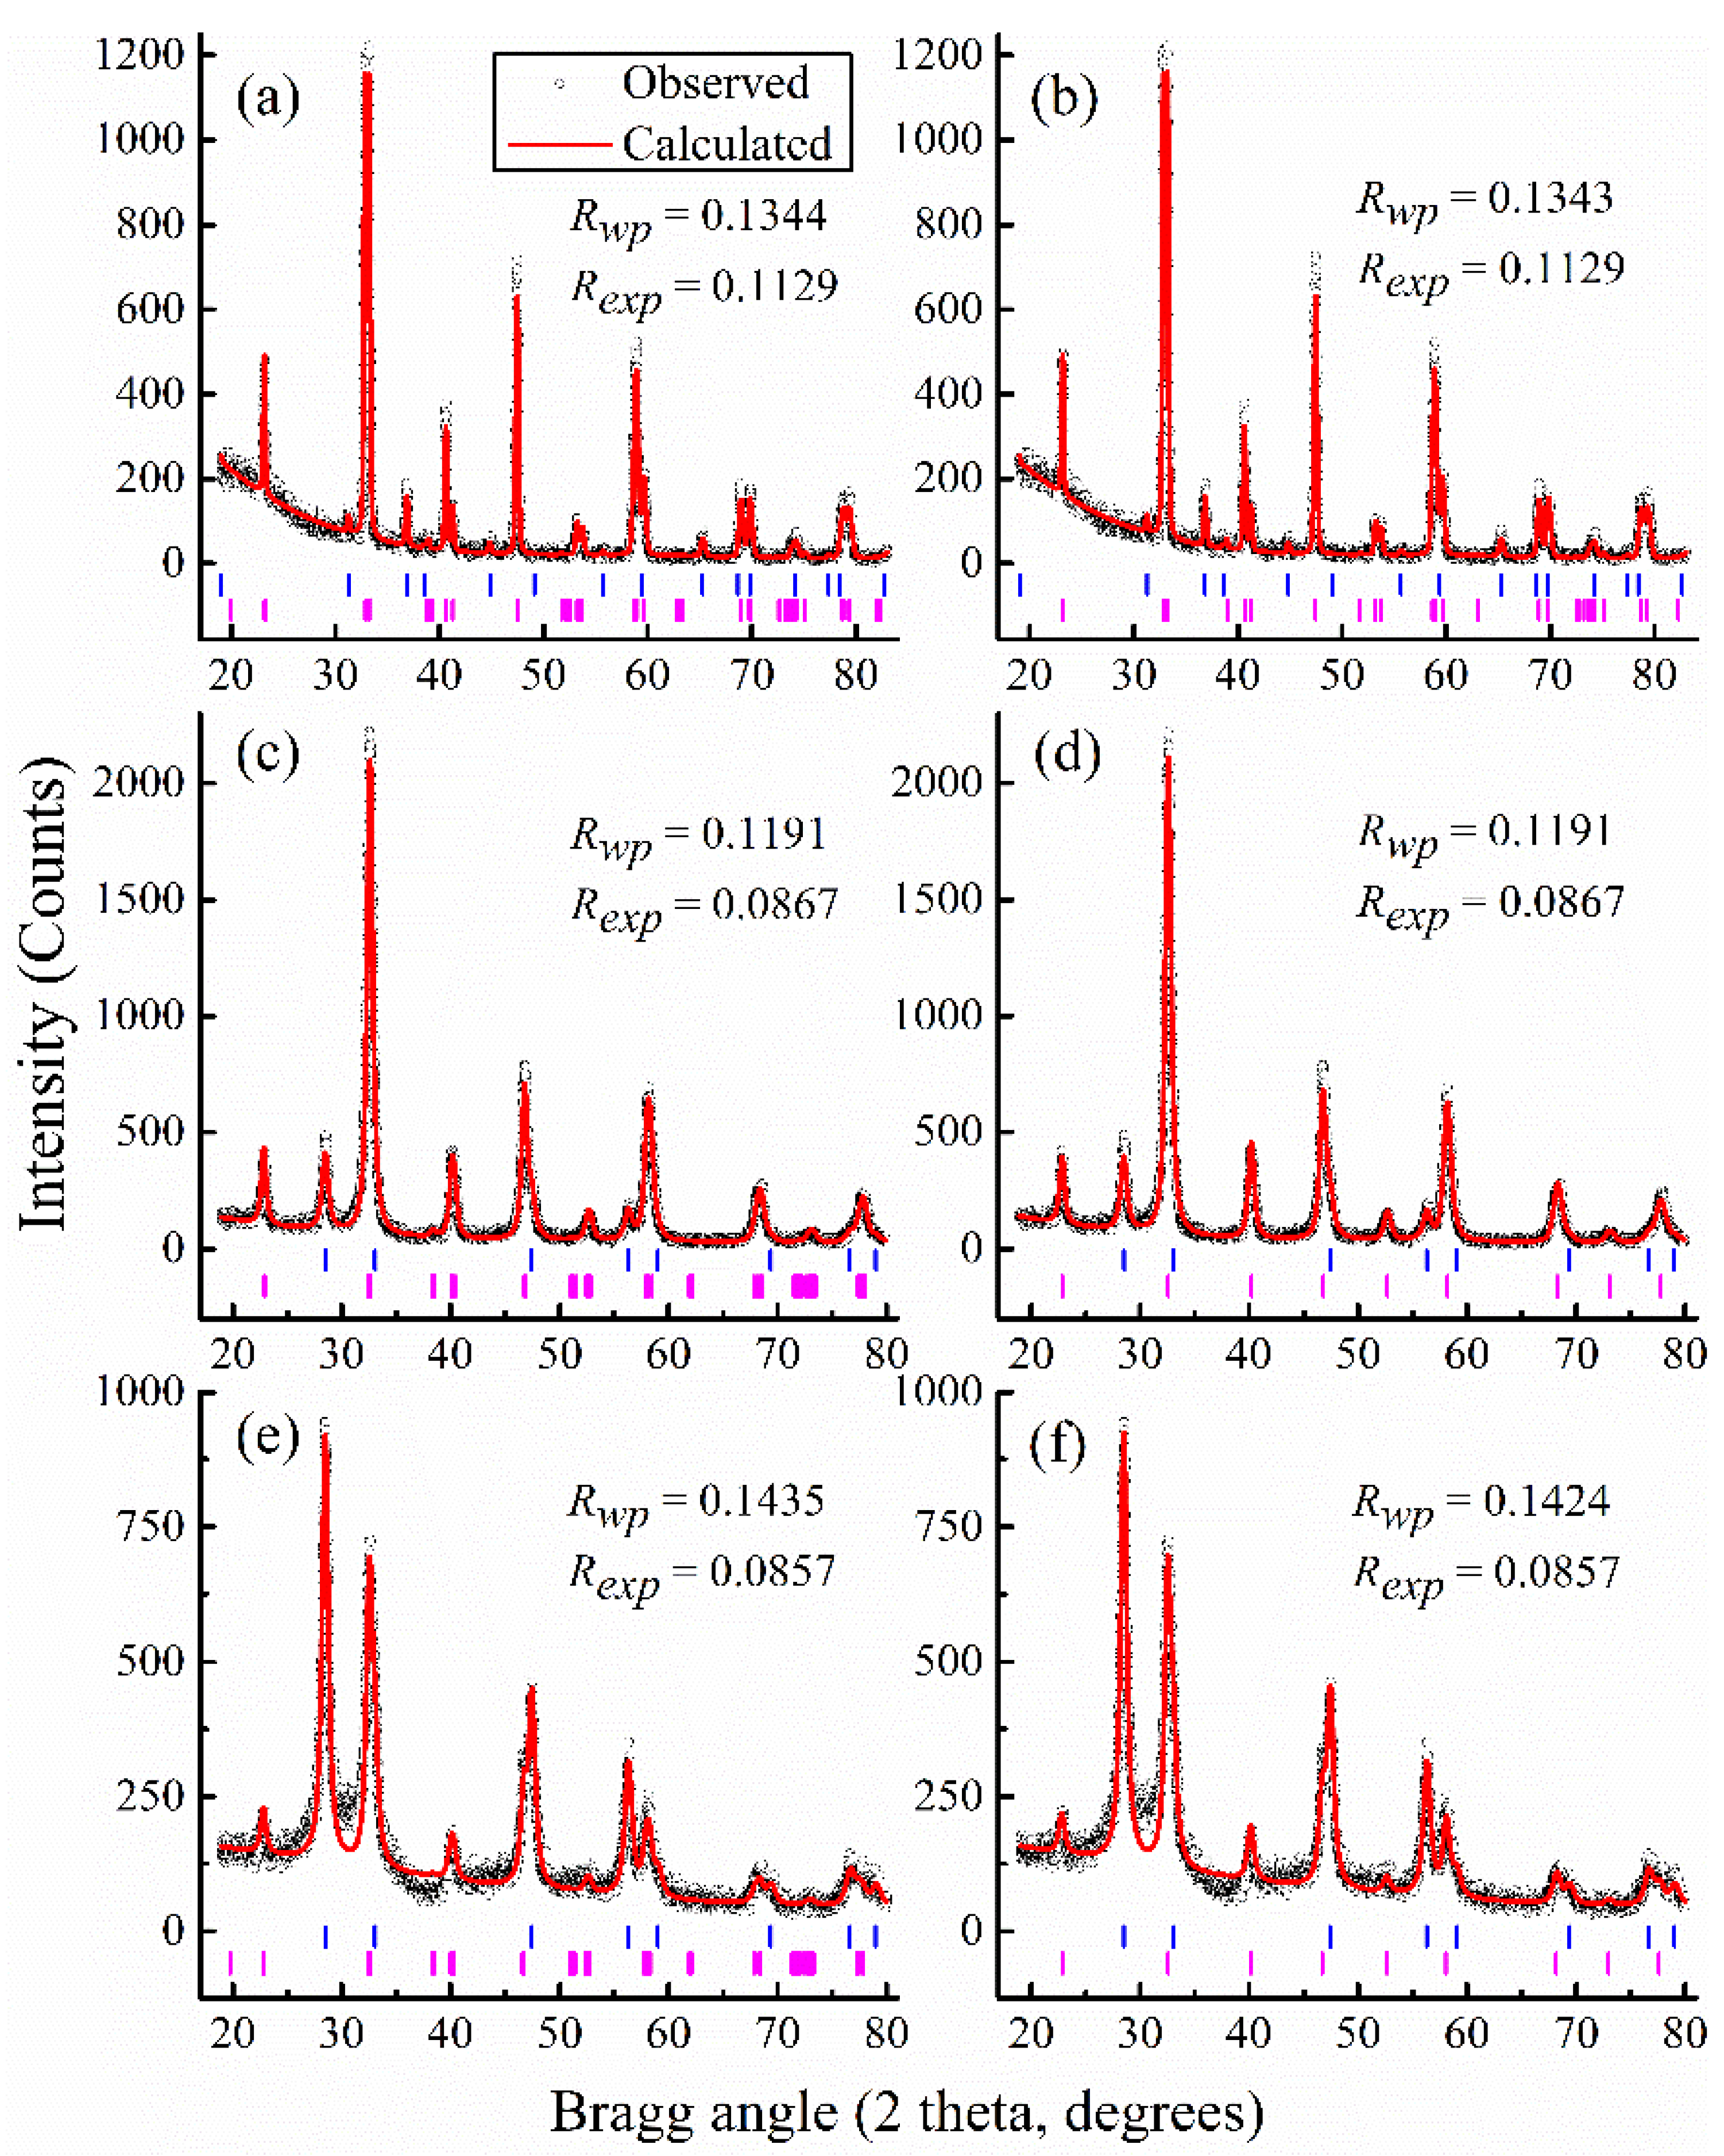
Figure 2 displays some selected Rietveld refined XRD patterns along with the corresponding Bragg positions. It is noteworthy that the cubic space group Pm-3m applied for the main lattice does not result in a successful fit for x = 0 and so is not reported. Figure 2a,b is for the case x = 0, for which the R-factors are 0.1343 and 0.1344, corresponding to the main lattice as rhombohedral R-3c: R and monoclinic I12/a1, respectively. The fact that the two spectra are identical and have equivalent R-factors is consistent with the indistinguishable XRD patterns [7] found previously between the two assumed space groups. Due to this similarity, we show only the typical spectra of monoclinic I12/a1 to compare with the cubic Pm-3m in Figure 2c,d for x = 0.2 and in Figure 2e,f for x = 0.4. The graphic analysis of these patterns brings about an agreement with the Rwp reported in Figure 1. However, the vertical bars representing positions of the Bragg peaks located at the bottom of each figure indicate the disappearance of many peaks for the monoclinic I12/a1 compared to the cubic Pm-3m. These aspects, together with the discussion for Figure 1, show that the cubic model performs best for the interpretation of the main lattice in the crystals of Ce-doped LCO.
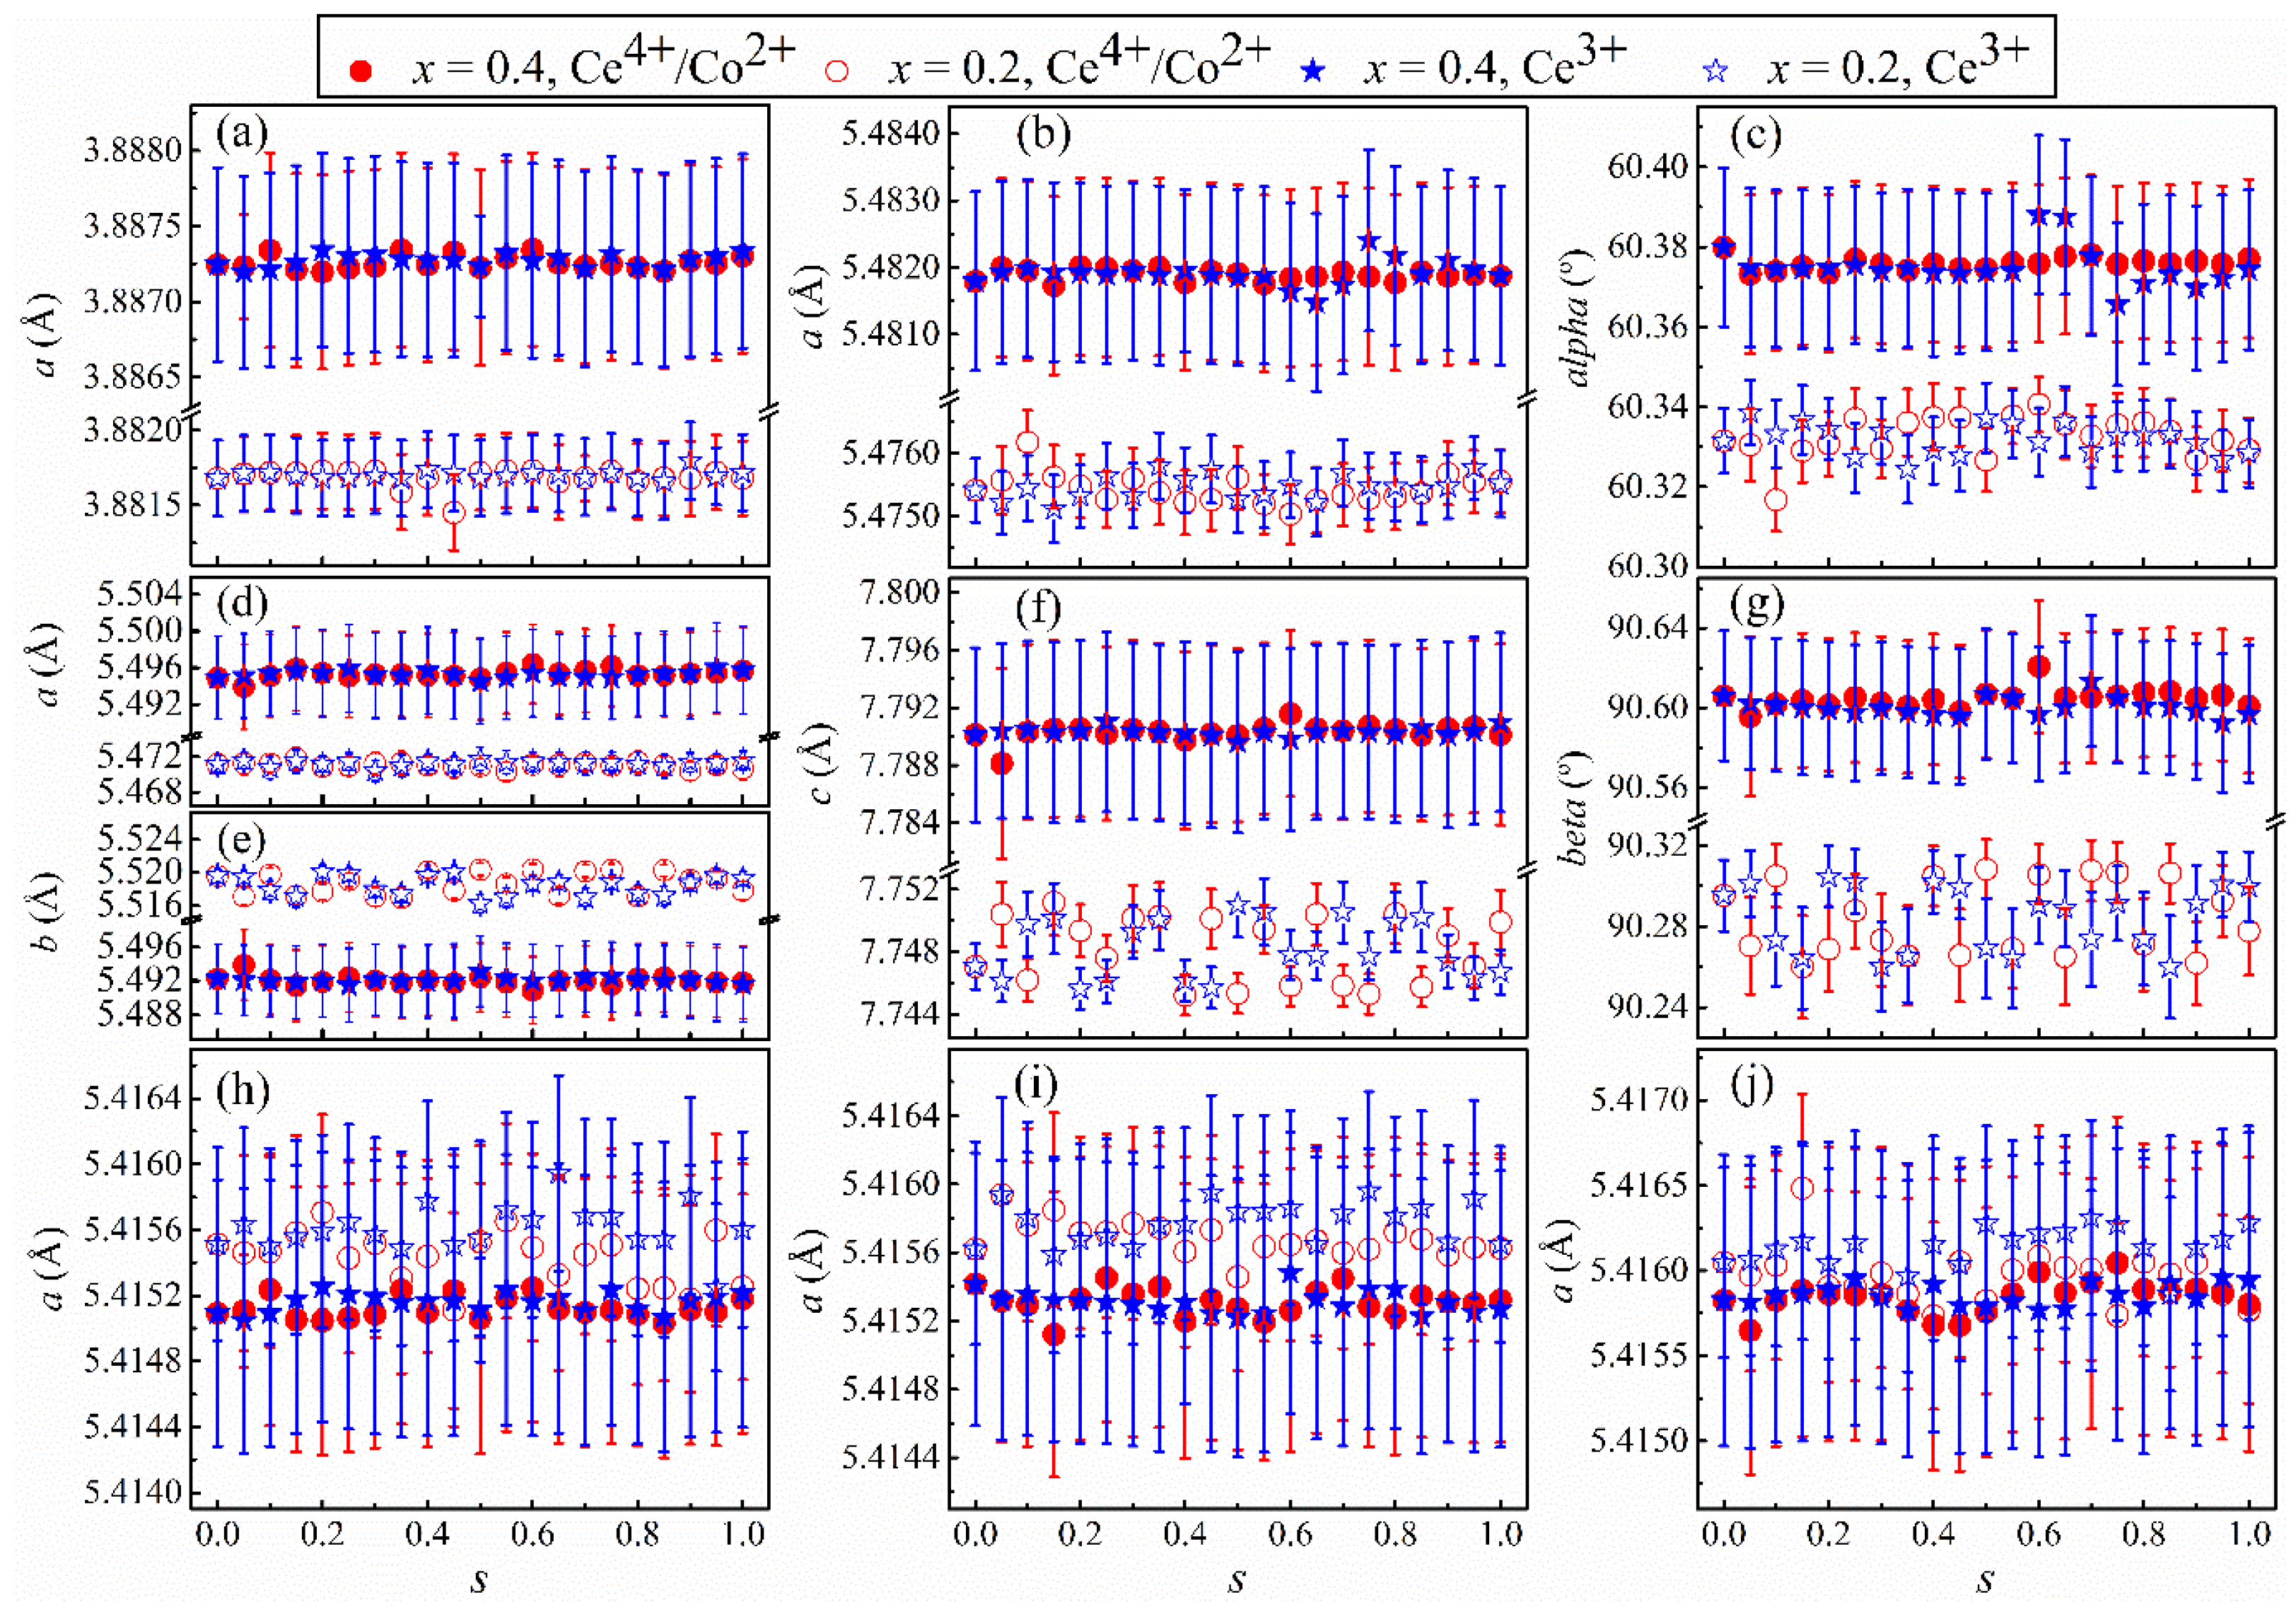
Figure 3 shows the refined lattice parameters from the same fits that resulted in the Rwp in Figure 1. The refined parameters as a function of s for the main lattice in Figure 3a–g are explicitly different between the two cases of x, but only within the error bars for the secondary phase in Figure 3h–j. In Figure 3a, values for the lattice parameter a are greater for x = 0.4 than for x = 0.2, but those for different forms of dopants in each x show no explicit difference. This scenario demonstrates that the expansion of the cubic lattice governed by the doping effect dominates the influence of the intrinsic properties of the dopants, such as the atomic sizes. It is clear from Figure 3b,c that both the lattice length a and angle α increase with increasing x, indicating the simultaneous doping-derived augmentation and tilting of the rhombohedral lattice. Finally, the lattice parameters of the monoclinic main phase in Figure 3d–g show mixed trends with increasing x: a, b, and β increase, but b decreases.
Additionally, Table 4 provides the weight percent and details of microstructures for both phases involved in each fit. Notably, the crystallite sizes of the Ce-doped LCO are about six times smaller than the pristine LCO, regardless of the models used in the fits. This shrinkage complies with the use of the dopants and the sol-gel method for sample preparation. Table 5 summarizes the average lattice parameters to give a comparison among different x. 
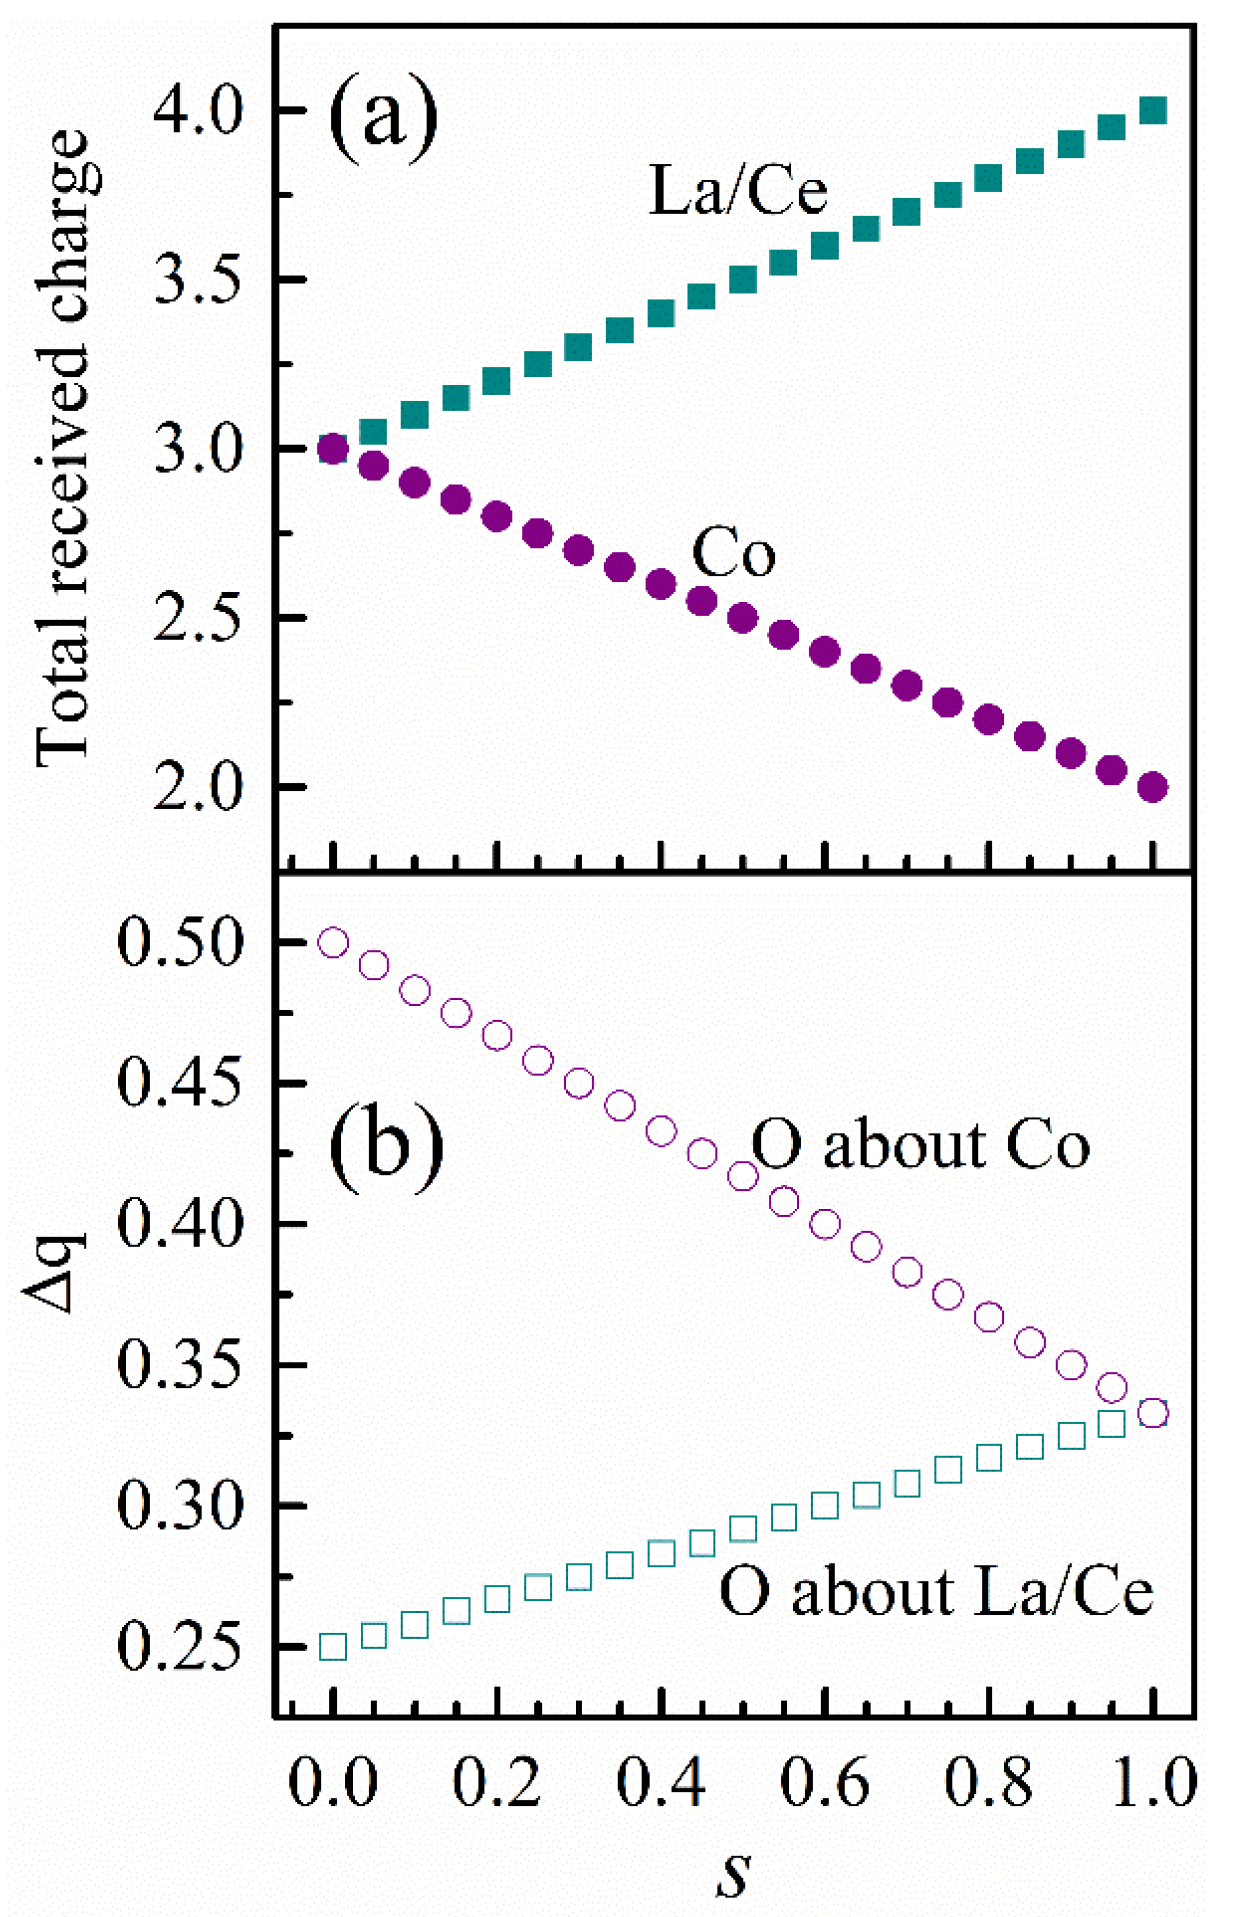
Table 6 tabulates selected bond lengths obtained from the Rietveld refinement and the charge fractions received by each coordination atom, some of which are illustrative in Figure 4. Noticeably, the Co–O bond length is of a six-fold degeneracy in the rhombohedral main phase, while that in the monoclinic main phase differentiates into three pairs of Co–O bond lengths. This finding is consistent with the fact that the Jahn-Teller distortion is missing in the rhombohedral lattice and exists in the monoclinic lattice.
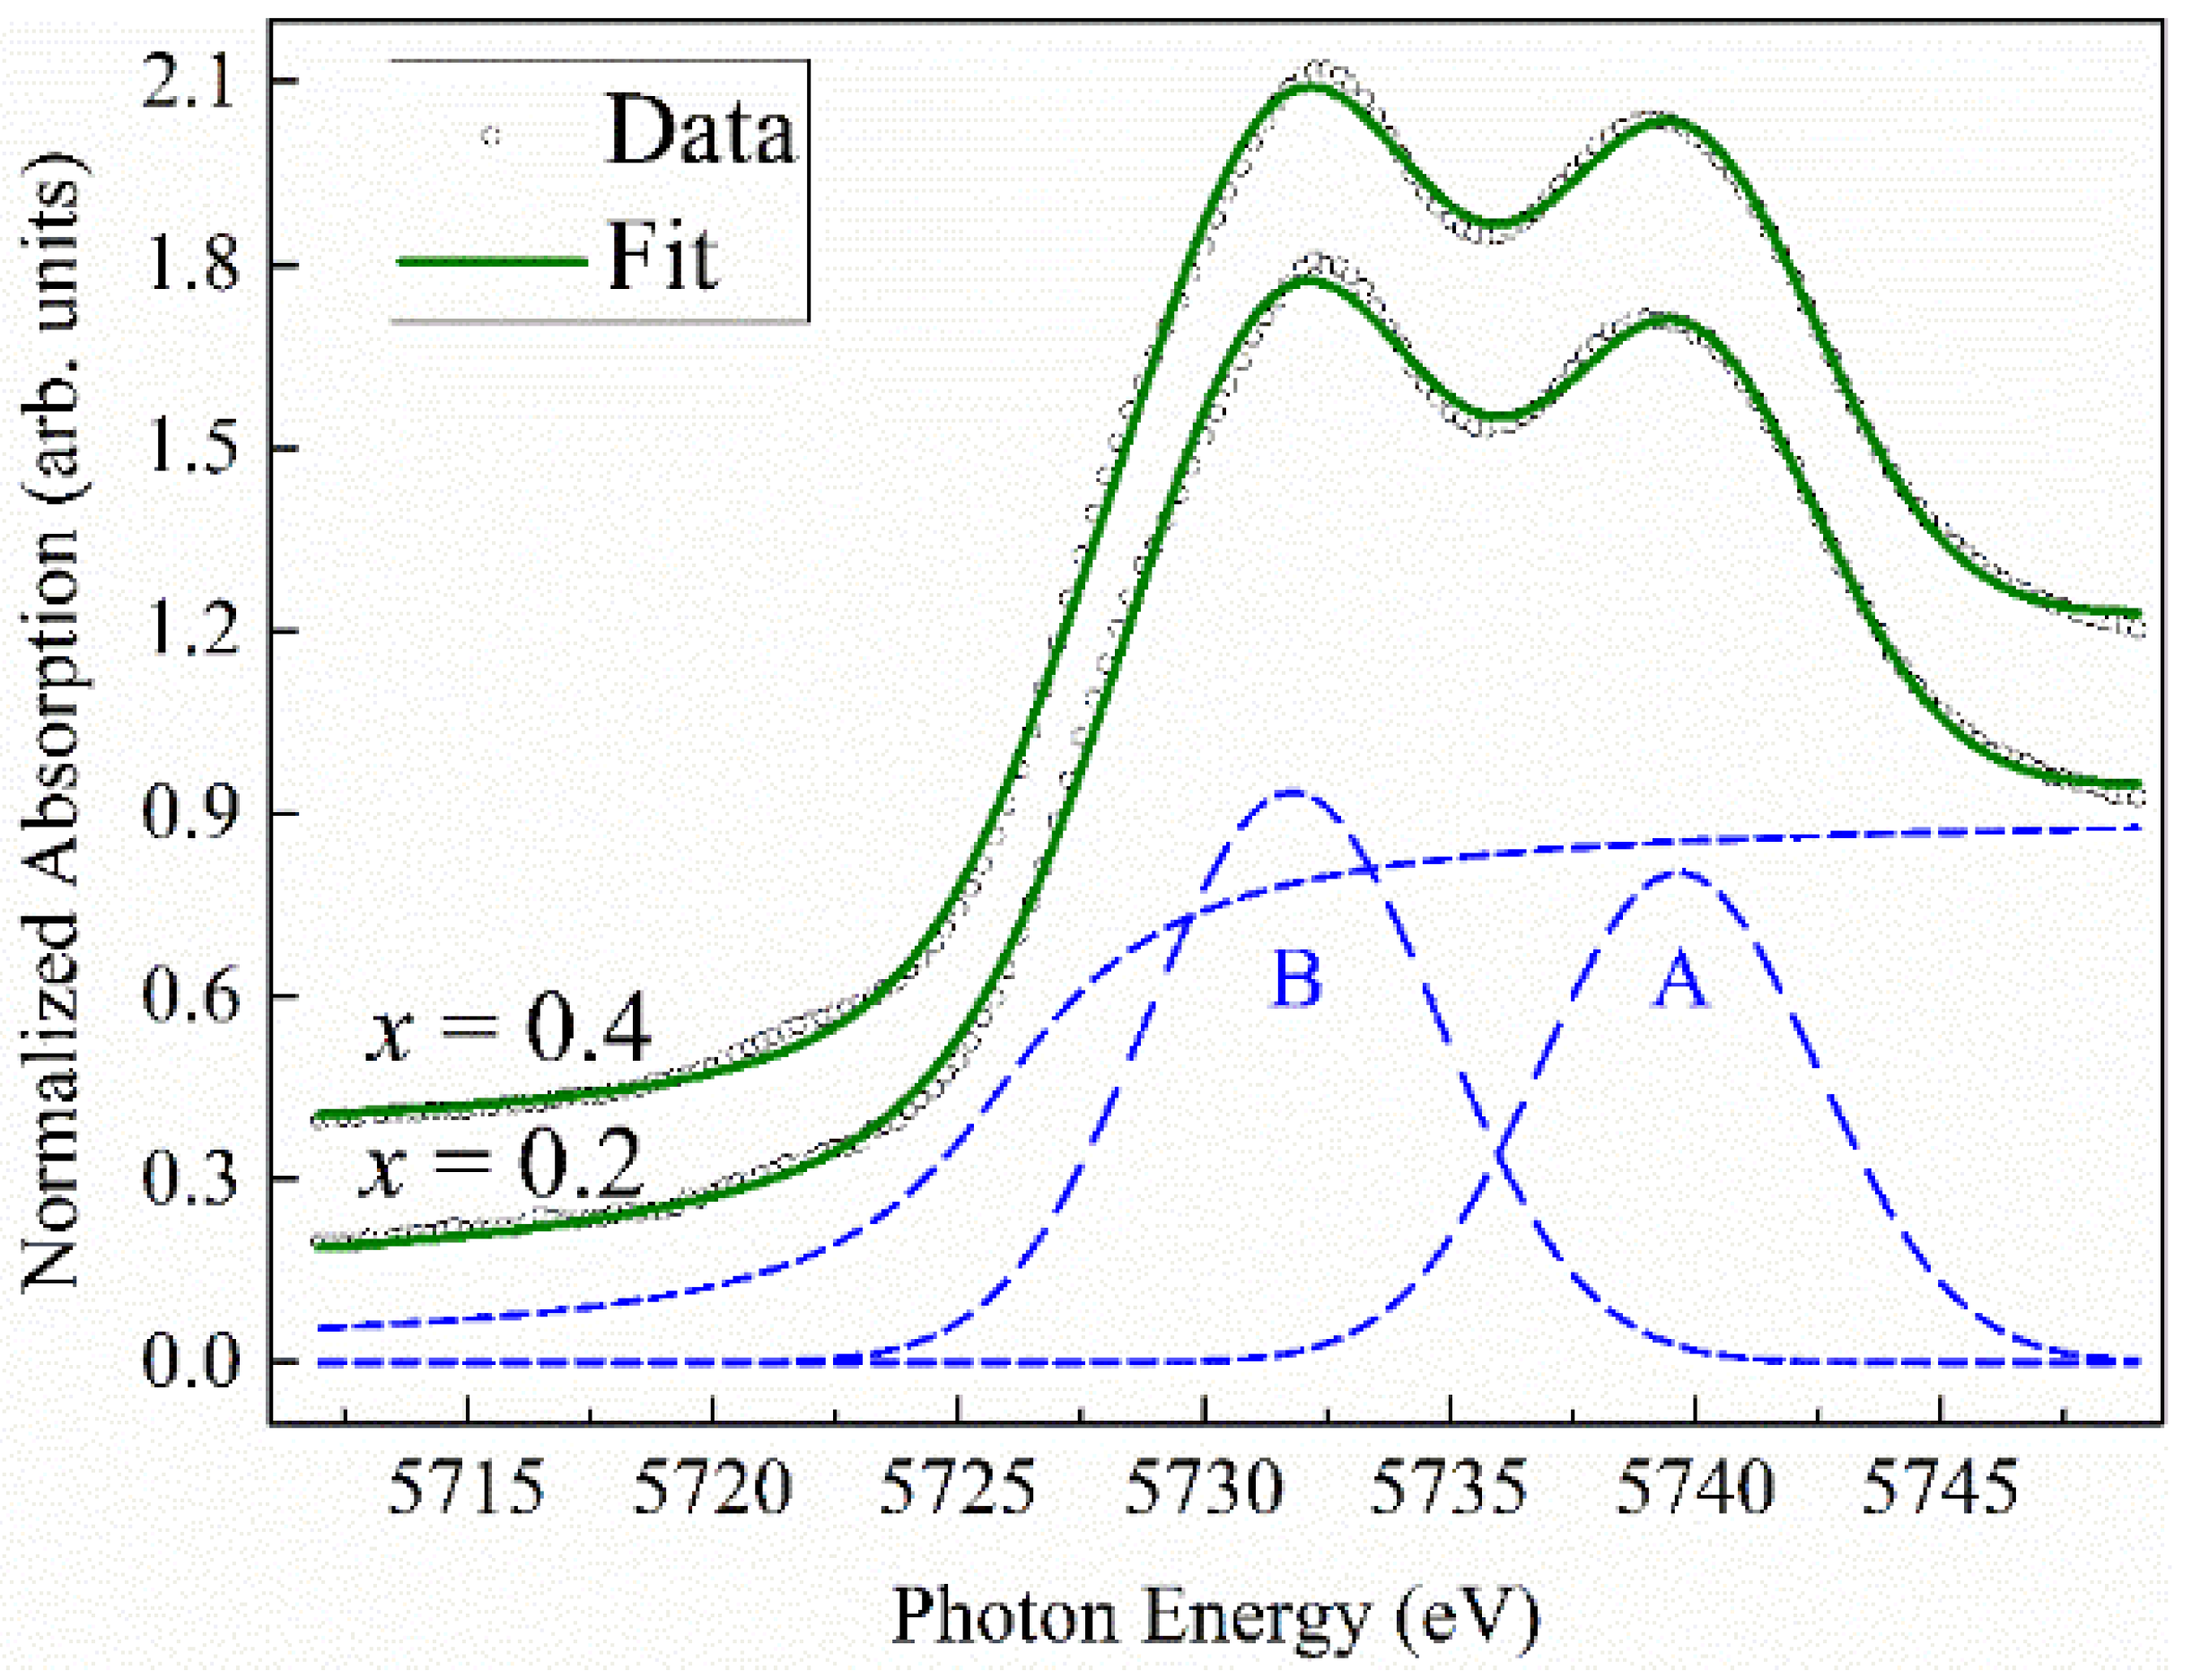
Normalized XANES spectra at the Ce L3-edge together with the curve fits in Figure 5 show that Ce of La1−xCexCoO3 is in a mixed-valence state in both cases of x studied. It is apparent from the spectra the characteristic two-peak structure, the physical origin of which is elucidative in the work of Kotani and colleagues [42]. In the 2p → 5d photo-absorption, a Ce 2p core electron absorbs an incident photon and is excited to the Ce 5d conduction band, leaving behind a core-hole denoted as 2p3/2. The initial state of the Ce is a superposed state of c 0 f 0 + c 1 f 1 L ¯ [42,43], where c0 and c1 are real coefficients, and Lindicates a ligand hole resulting from the O 2p → Ce 4f charge transfer. The final state is a consequence of the interplay of three interactions: the Coulomb attraction between the photo-excited 5d electron (5d*) and the core-hole, the Coulomb repulsion between the 4f electron and 5d*, and the core-hole attractive potential acting on the 4f electron. The roles of these interactions are to localize the 5d* near the core hole site, split the Ce 5d final state into 2p3/24f05d* and 2p3/24f1L5d* configurations, and bring about the 4f electron relaxation in the final state, respectively. Consistent with this description, we decompose each XANES spectrum into a combination of two Gaussian peaks, describing the 5d final states and an arctangent edge jump simulating the transition into continuum states. Dashed lines in Figure 5 illustrate the deconvolution procedure. Peak A represents the Ce tetravalent state with the configuration 2p3/24f05d*. Peak B depicts the 2p3/24f1L5d* state. Using weighted ratio of the areas under peak A (A4+) and peak B (A3+), we estimate from the formula 3 + (A4+/(A3+ + A4+)) the Ce spectroscopic valence of 3.41 and 3.45 for x = 0.2 and x = 0.4, respectively. These values are smaller than 3.49 [31] and 3.56 [34], as previously determined for CeO2. Hence, the results of spectroscopic valence obtained here might signify at least two crystallographic, distinct Ce sites in the La1−xCexCoO3 structure.
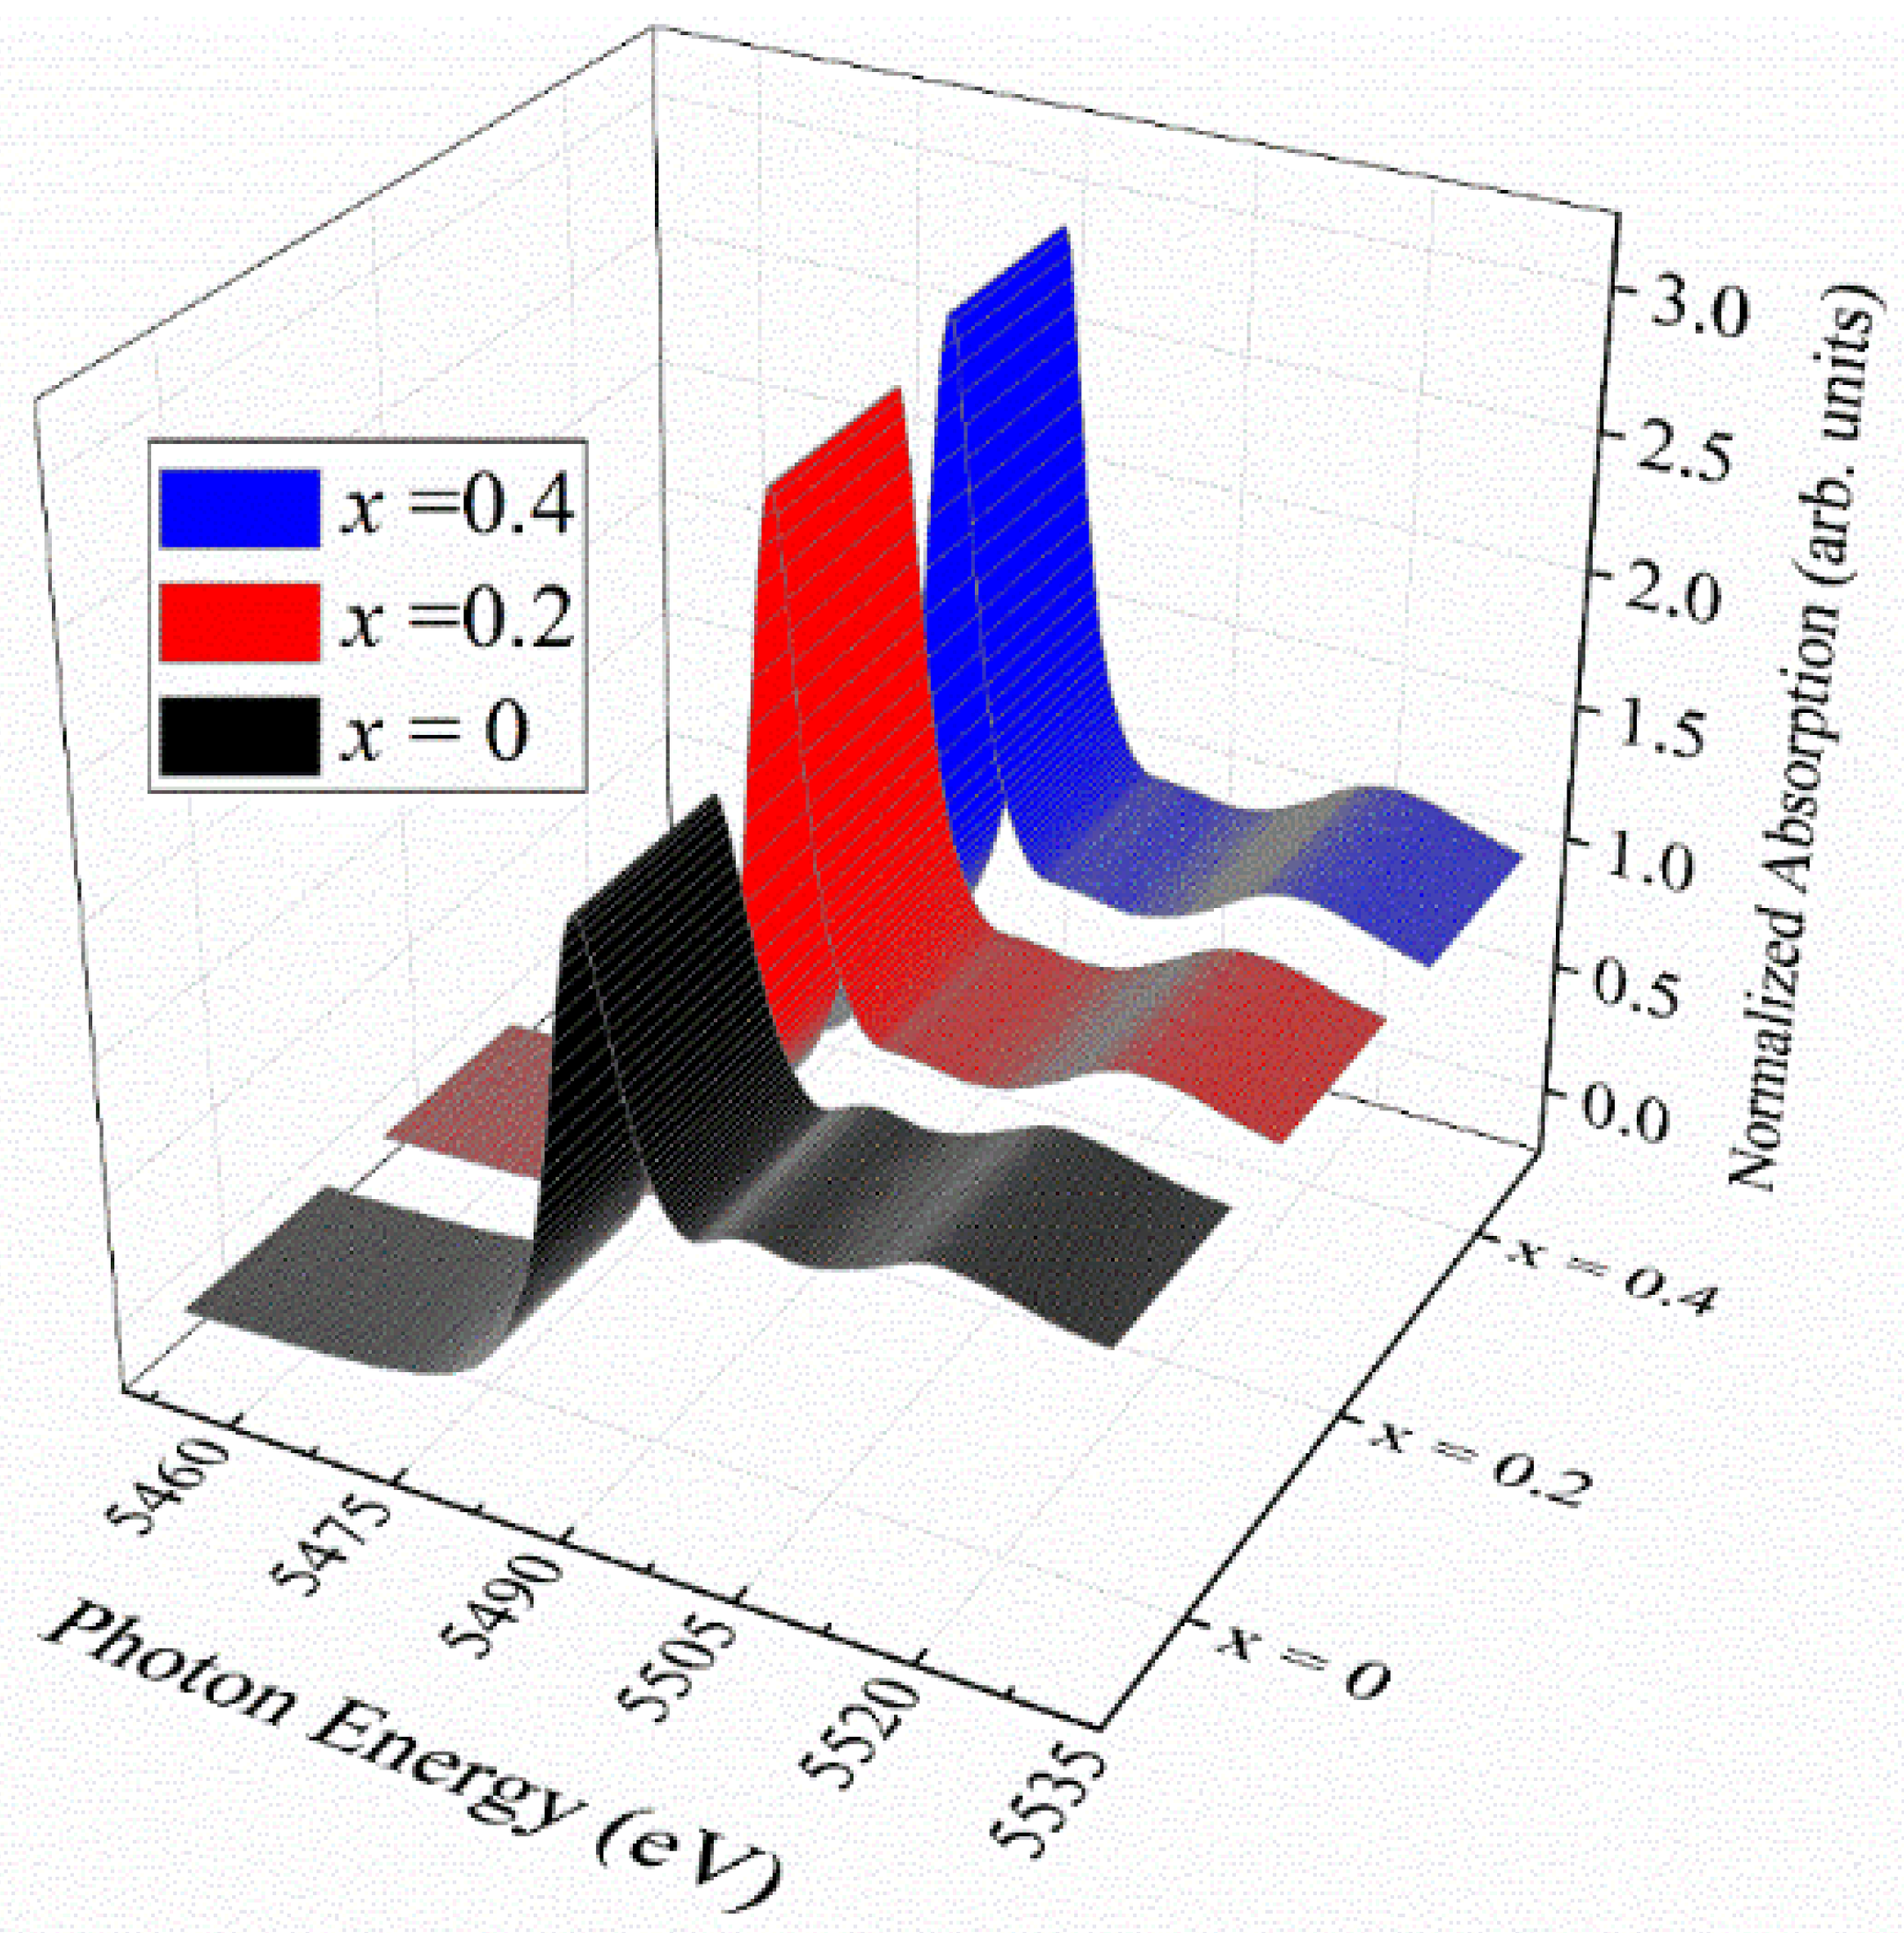
Figure 6 shows XANES data at the La L3-edge for La1−xCexCoO3. The spectrum of the pristine LCO reveals a sharp white line and two post-edge bulging features. These structures indicate holes in the La 5d-band, O 2p-La 5d hybridization states, and possibly part of EXASF, respectively. It is clearly visible that the white line becomes enhanced with increasing Ce content, whereas the post-edge structure analogous to the bulge in the middle of the x = 0 spectrum takes a flat shape in the cases x = 0.2 and x = 0.4. These changes establish direct evidence that the La 5d-band of the pristine LCO is in a partially filled state and eventually turns into a less occupied state when subject to the Ce addition. This finding on the occupancy of the La 5d-band seems to be unexpected, because the La–O bond is commonly anticipated to be pure ionic, owing to a difference greater than 2.0 between the Pauling’s electronegativity of La (1.1) and that of O (3.44). There is, in fact, a differentiation of the La–O bond length in LCO; La–O bonds with short enough bond lengths have some covalent character, as is revealed in the discussion that follows.
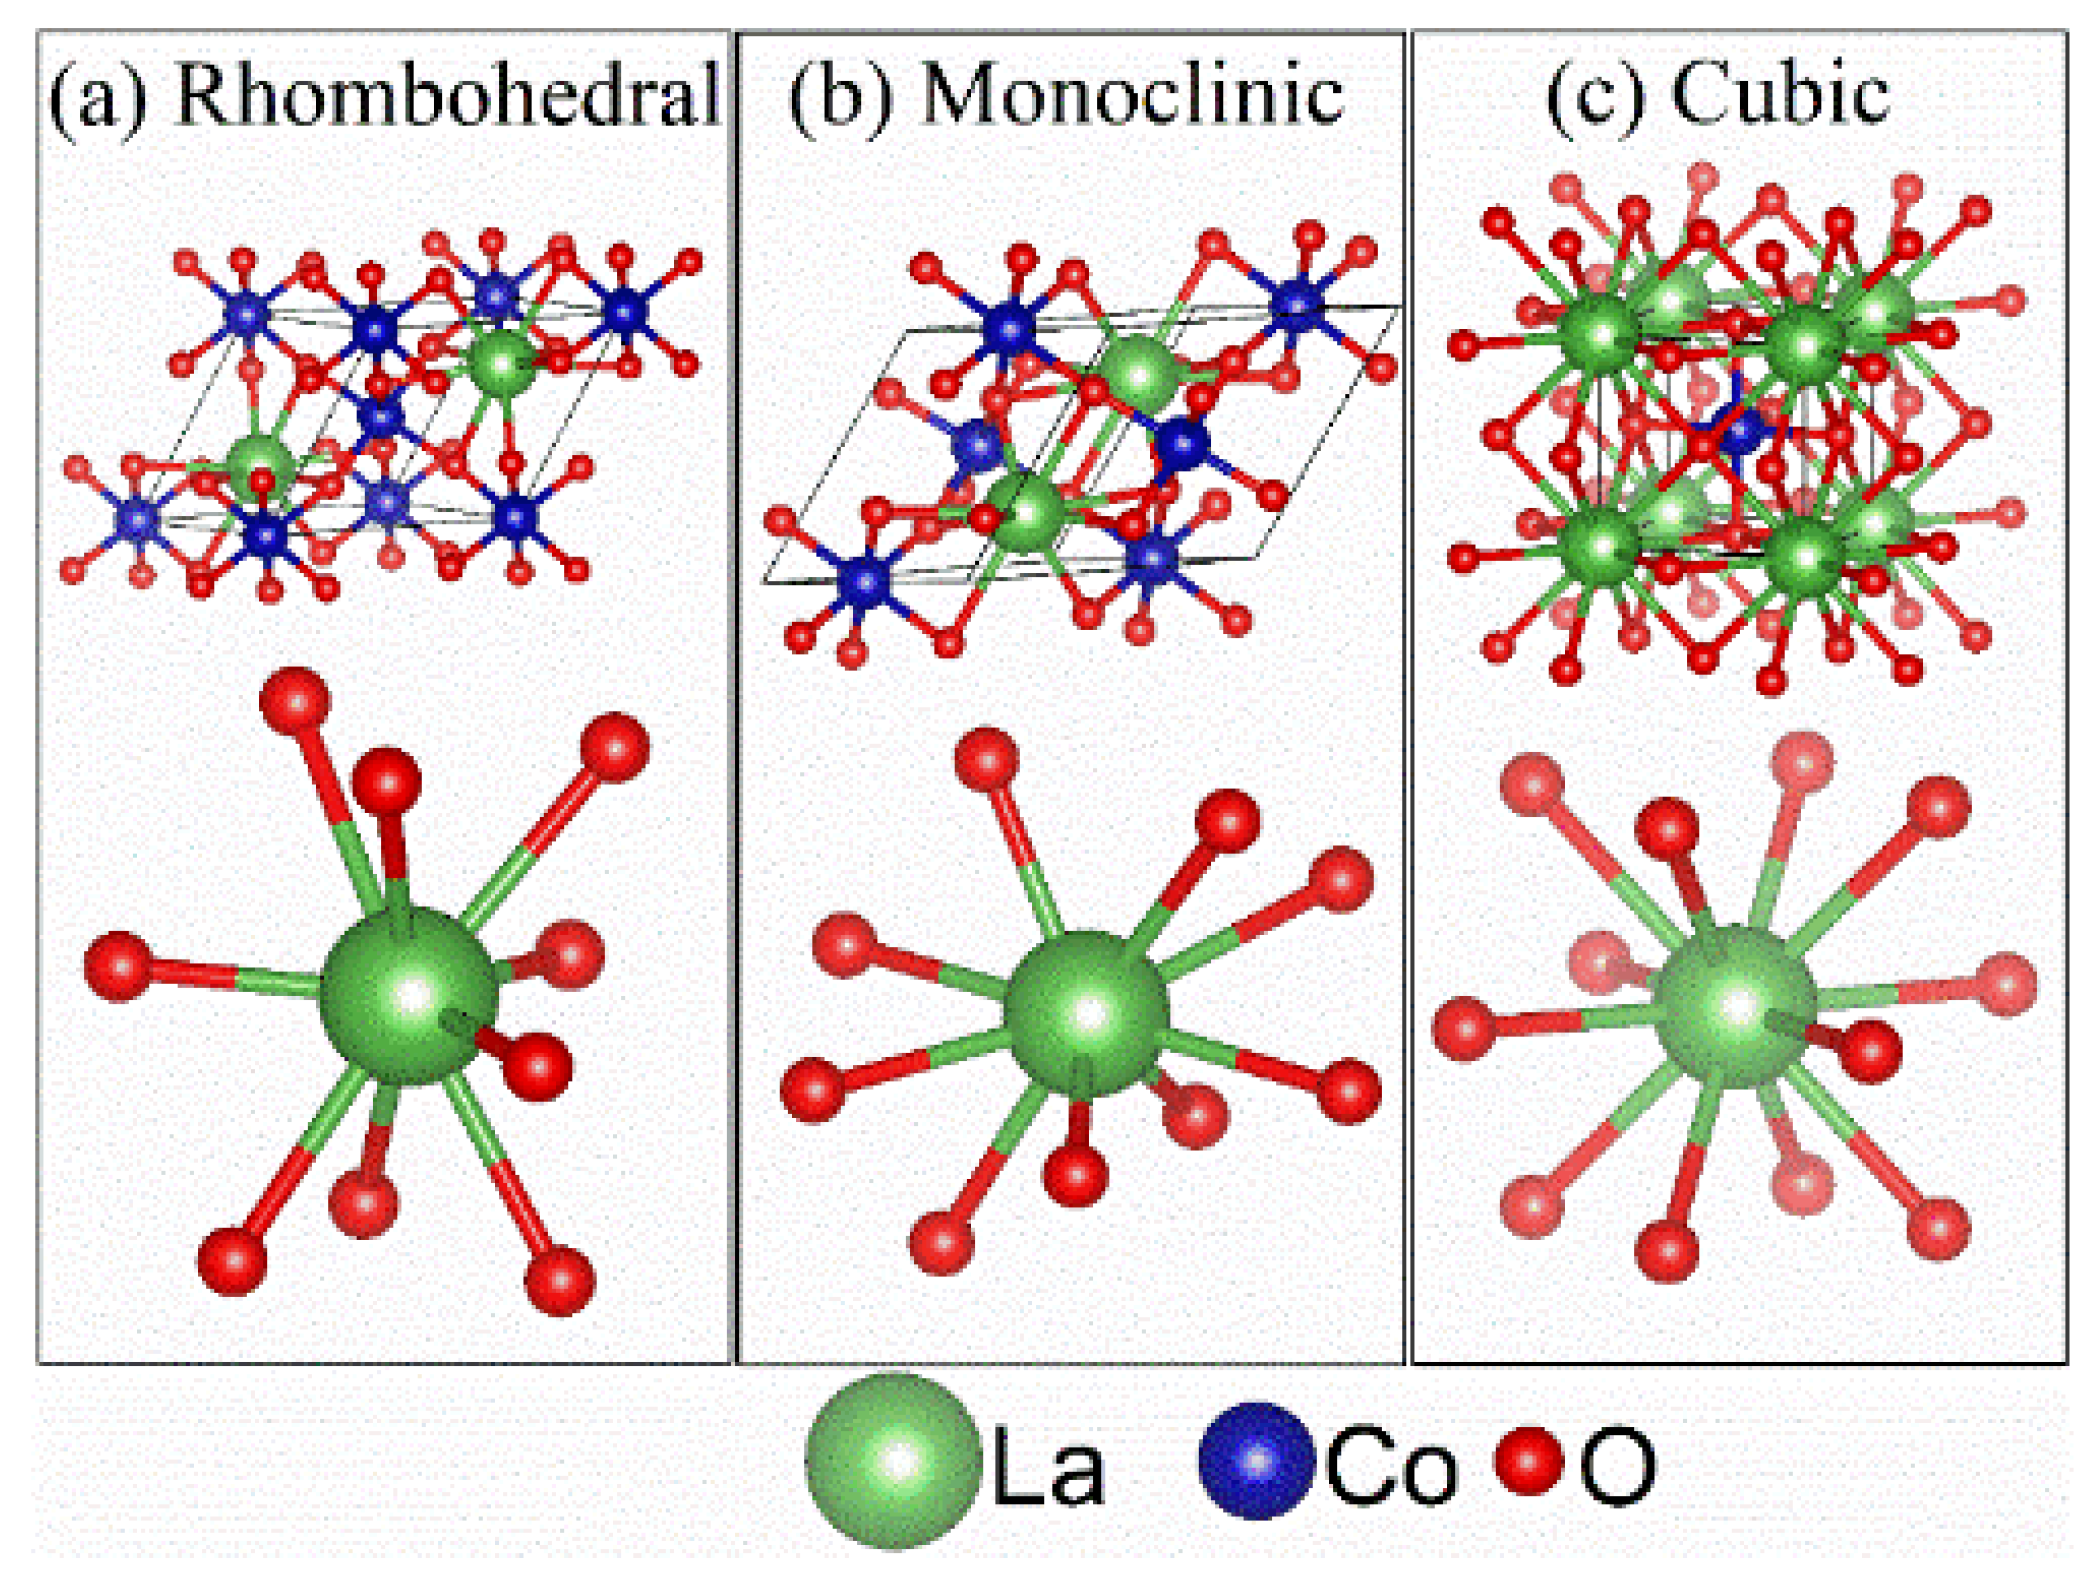
Figure 7 illustrates the local coordination geometry around the La atoms associated with different primitive cells of different lattice models for the main phase of La1−xCexCoO3. The La atom in either the rhombohedral model or monoclinic model for x = 0 is surrounded by 9 O atoms, as opposed to 12 in a representative of cubic model for x = 0.2 and x = 0.4. This illustration is consistent with the calculation of “effective” coordination number (ECN), using the output from the Rietveld refinement analysis in the present work. The results give the ECN as 8.95 and 8.77 for the rhombohedral model and monoclinic model, respectively, and 12 for the cubic model. More specifically, Table 6 lists for each lattice model all 12 La–O distances and the fraction of charge received by each coordinating O atom. Regarding the rhombohedral model, there is a threefold degenerate La–O distance of 3.0062 Å, of which each O receives only 0.074 of the charge. In the case of the monoclinic model, there are also three such long La–O distances. They are, however, split into a twofold degenerate distance of 2.991 Å and a sole distance of 3.032 Å. The O atoms corresponding to these distances gain unsubstantial charge fractions as 0.078 and 0.064, respectively. For this reason, the number of effectively coordinate La–O bonds remains ~9 for both the rhombohedral and monoclinic models. In contrast, La is bonded to twelve equivalent O in a 12-coordinate geometry in the cubic model, where all La–O bond lengths are ~2.74 Å. This distinction in the La local structure elucidates the observable changes in the La XANES data in Figure 6.
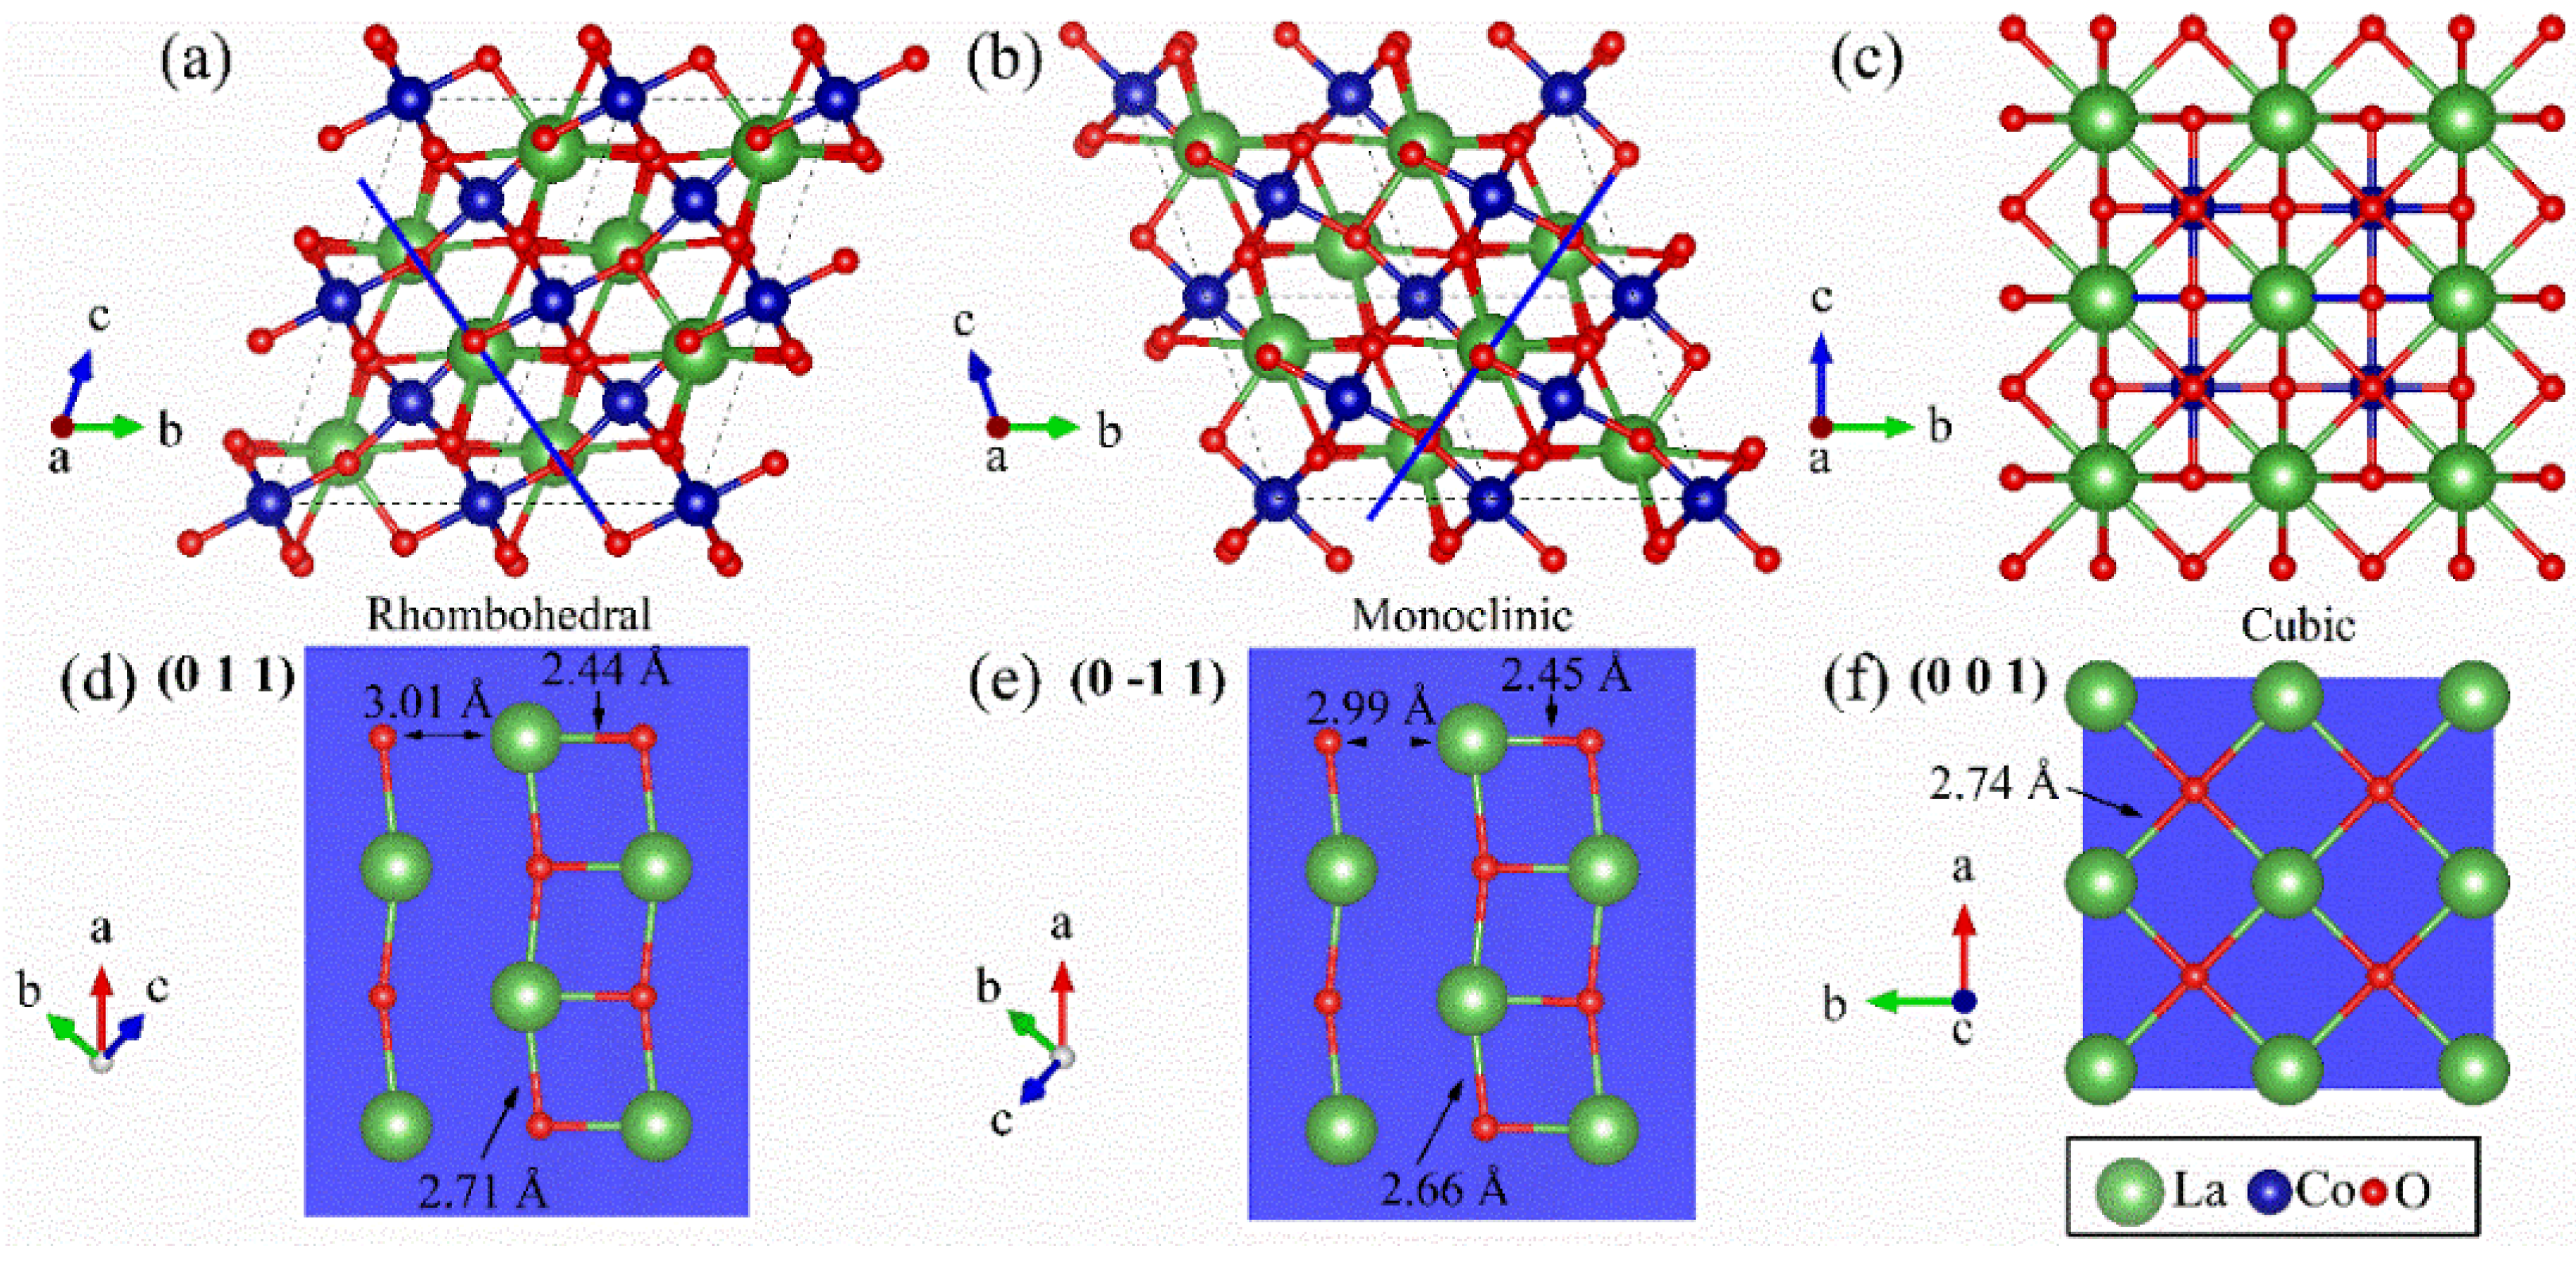
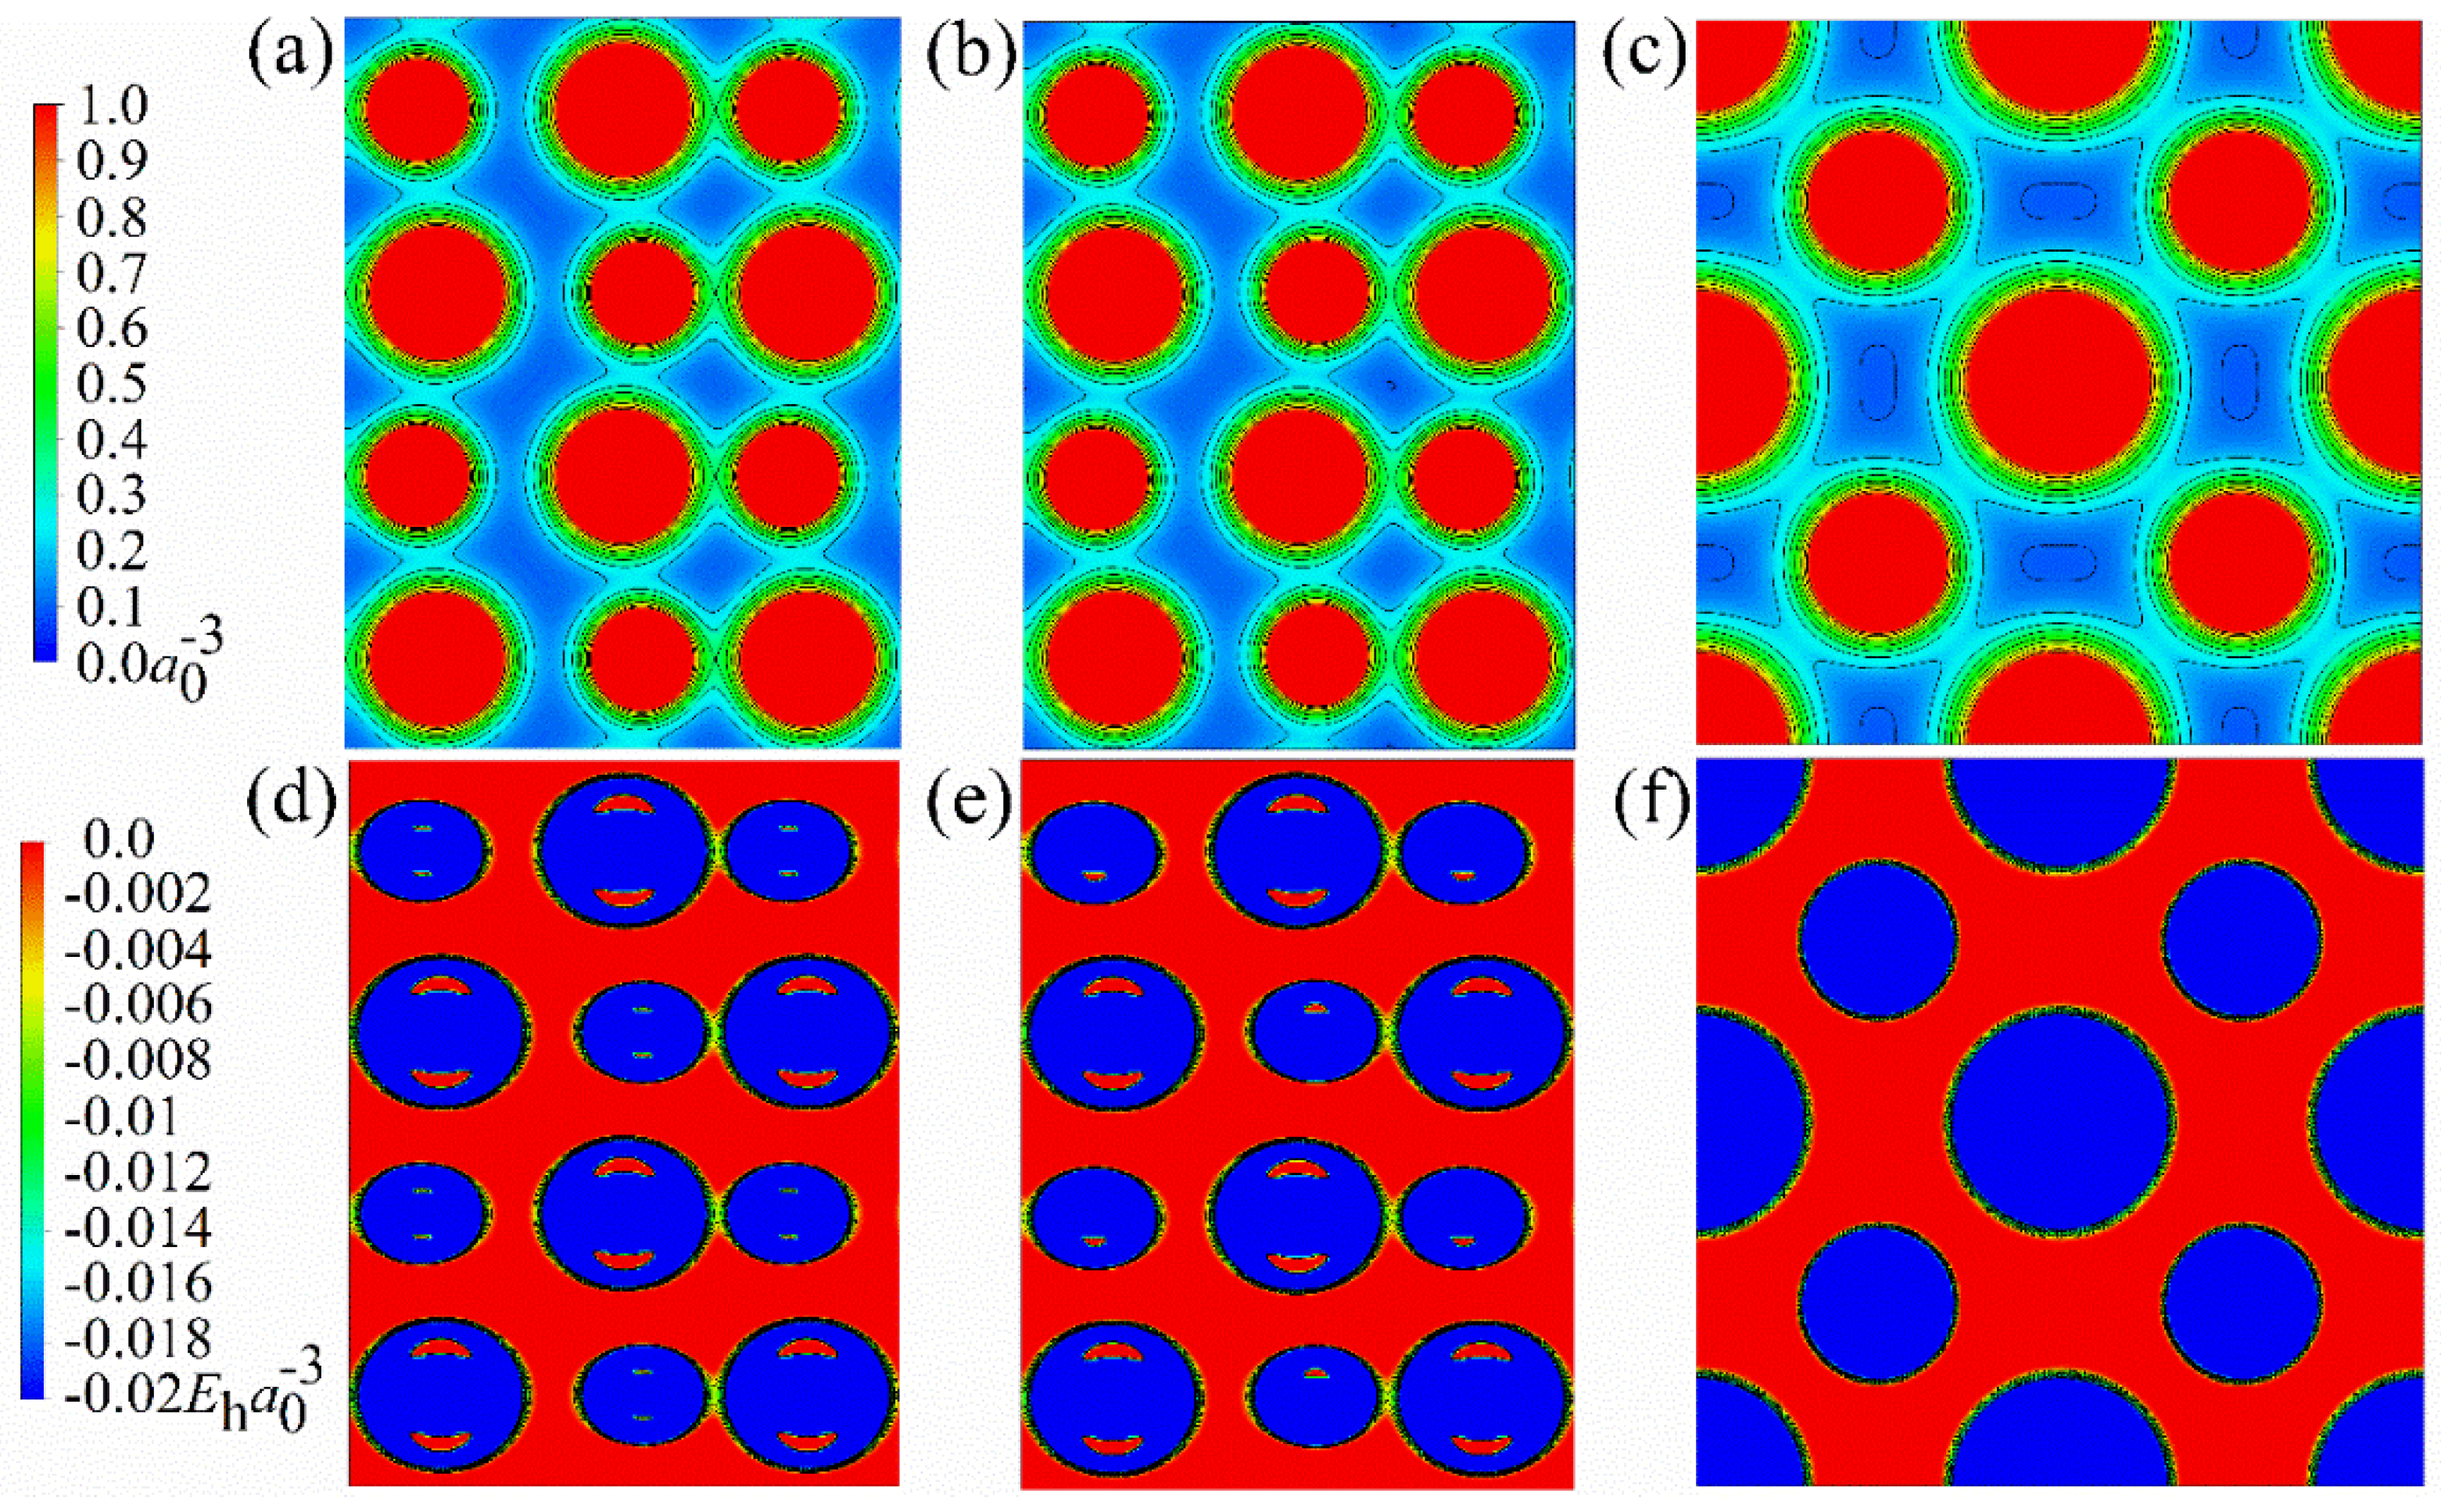
It is necessary to scrutinize the physical nature of interatomic interactions to gain more evidence to support our findings from the La L3-edge XANES observations. Each of Figure 8a–c shows a 2 × 2 × 2 supercell of different lattice models for the main phase of La1−xCexCoO3 along the lattice vector a. A solid (blue) line therein marks a rhombohedral (011) plane, a monoclinic (0-11) plane, and a cubic (001) plane. In Figure 8d–f, pictorial details of these planes depict the short (2.4 Å), intermediate (2.7 Å), and long (3.0 Å) La–O distances. These structural descriptions serve as the basis for further considerations of the experimental electron density and the electronic energy distribution shown in Figure 9a–f, respectively. Figure 9a explicitly shows an uneven electronic distribution in the rhombohedral (011) plane. Regarding each La atom, which coordinates with 4 O atoms, the interatomic region of a short La–O distance has a higher electron density than that of the three longer La–O distances. Correspondingly, Figure 9d shows the electronic energy maximally negative in the midway region of the short La–O bond, which unequivocally indicates a shared-type atomic interaction. The observations found here profusely resemble results from inspections for the monoclinic (0-11) plane in Figure 9b,e. In contrast, the electron density distribution shown in Figure 9c is uniform for all La–O bonds in the cubic (001) plane. Furthermore, according to the electron energy distribution in Figure 9f, each La atom in the cubic (001) plane participates in four closed-shell interactions with adjacent O atoms. Overall, these facts infer that some La–O bonding states of the pristine LCO have a covalent bond nature in both rhombohedral and monoclinic lattice models and tend to favor a change towards being nearly pure ionic in cubic Ce-doped LCO.
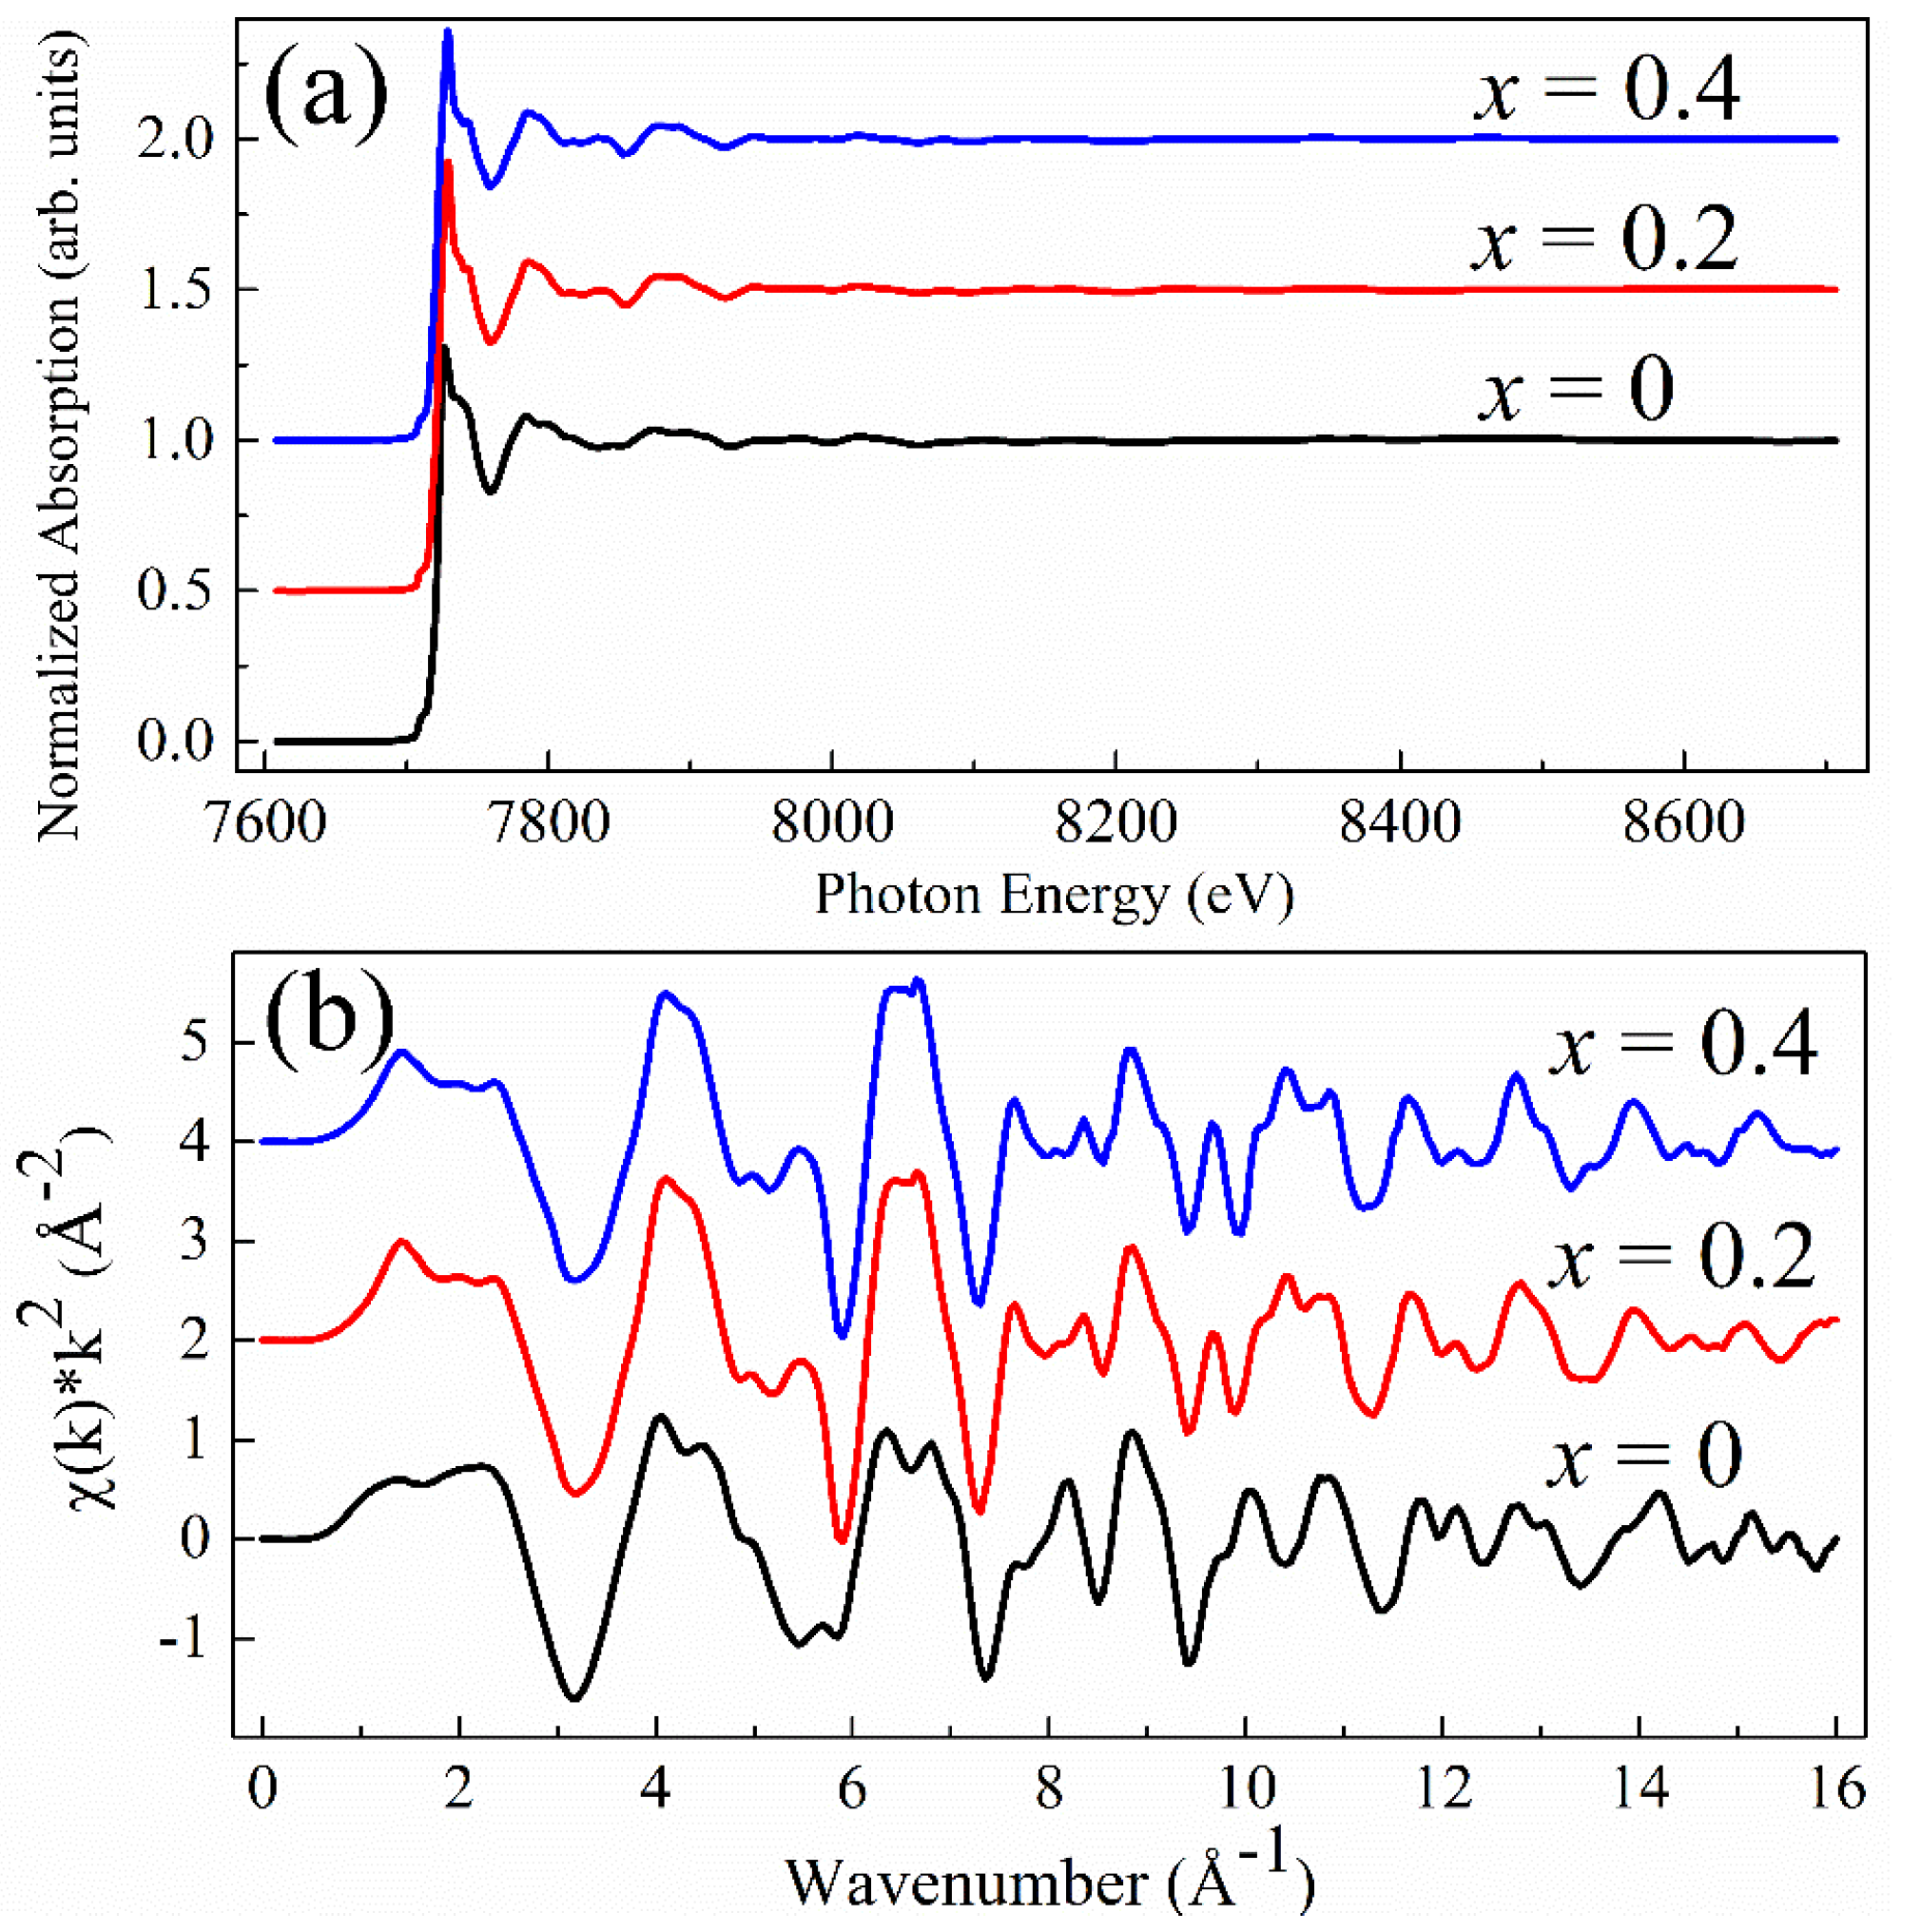
Figure 10 shows the normalized Co K-edge XAS data measured on the La1−xCexCoO3 samples and extracted k2-weighted χ k 
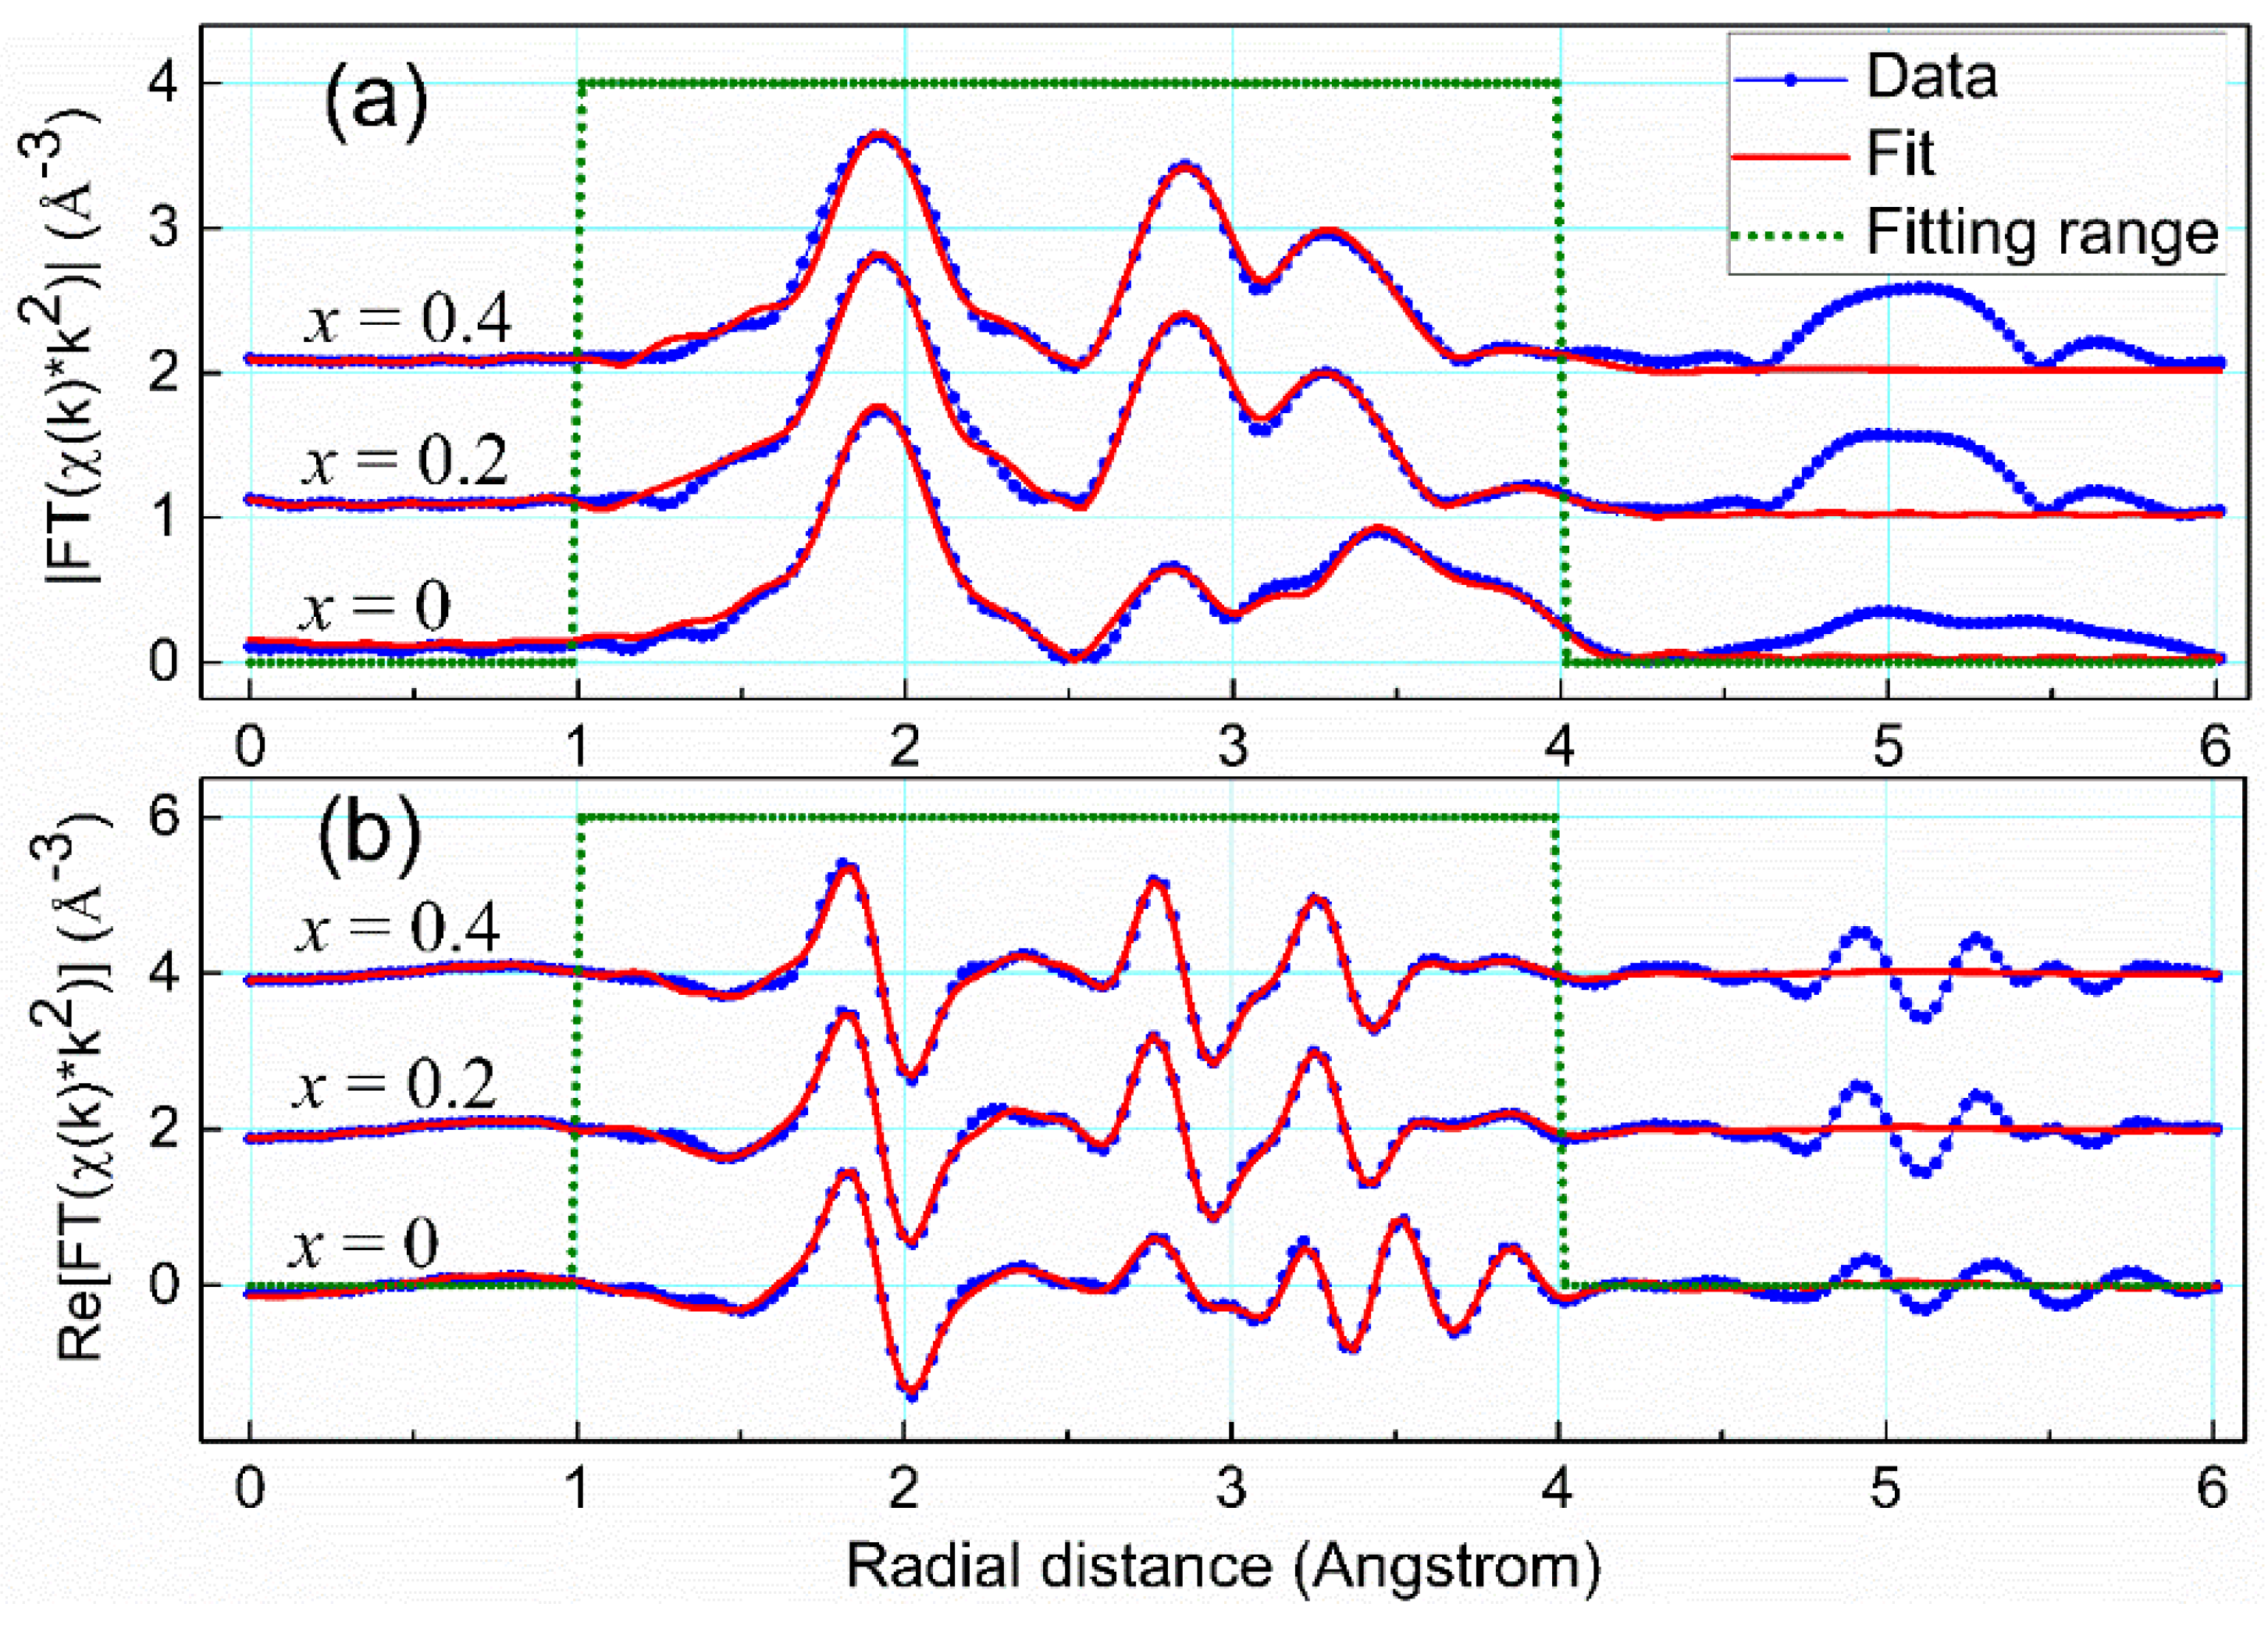
data. All the EXAFS fits for x = 0.2 using different values of s resulted in intuitively identical curves. The same situation holds for x = 0.4. Therefore, we show only a representative graph of s = 0.25 for each case of x when comparing the Fourier-transformed EXAFS signals in Figure 11. It is obvious therein that the theoretical fitting curves match closely with both the magnitude and the real part of the real-space EXAFS data. Moreover, fitted parameters from these fits have adopted reasonable values, as listed in Table 7, Table 8 and Table 9. Minute changes of all the radial distances, except for the value 0.16 Å of the path @La1.1@ in the case x = 0, justify the Rietveld refinement analysis and the EXAFS models used.
The resulting sigma square terms σ2, accounting for the mean square variation in path lengths, require some discussion. The σ2 value of the path @O1.1@ is smaller in the case of x = 0 than in the cases x = 0.2 and 0.4. Such an attribute depends directly on a difference of one La–O bonding between the rhombohedral lattice and the cubic lattice assumed for the main scattering phase. If LCO crystallizes in the rhombohedral R-3c: R space group, O is bonded in a 5-coordinate geometry to three equivalent La and two equivalent Co atoms. Considering Ce-doped LCO in the cubic Pm-3m symmetry, O is bonded in a distorted linear geometry to four equivalent La and two equivalent Co atoms. To that end, the relative displacement Co → O1.1 in the cubic lattice possesses more disorder than that in the rhombohedral lattice. In addition, the σ2 value of the path @O1.1@ is greater than that of the path @O_SS@ in any case of x. This property also derives from the local coordination geometry. Regarding Co3O4 in the cubic Fd-3m symmetry, O is bonded in a distorted trigonal pyramidal geometry to four Co atoms. Hence, the two scattering phases under consideration differ in both metal-oxygen bonding numbers and atomic coordination types, and the number of metal-oxygen bonding prevails in influencing the disorder of the scattering paths.
In addition, regarding the main scattering phase in each case of x, the σ2 value is higher for the path @O1.1@ than other scattering paths, reflecting a reversal dependence of σ2 on the atomic number of the scattering atom. A similar trend is observable for the Co3O4-like phase. In general, σ2 increases with increasing radial distance. In particular, Table 7 shows a σ2 value as high as 0.0296 Å2 for the scattering path @Co_SS2@, whereas the corresponding values in Table 8 and Table 9 are 0.0052 Å2 and 0.0053 Å2, respectively. This seems to indicate that the Co3O4-like phase is only well-ordered in a shorter range for x = 0 than for x = 0.2 and x = 0.4. It is worth reminding that Co3O4 crystallites are noticeable from the XRD pattern of the case x = 0 and missing for x = 0.2 and x = 0.4. We thus attribute the difference herein to the degrees of freedom in the fits, i.e., the model with the cubic main lattice has more degrees of freedom than the model with the rhombohedral main lattice.
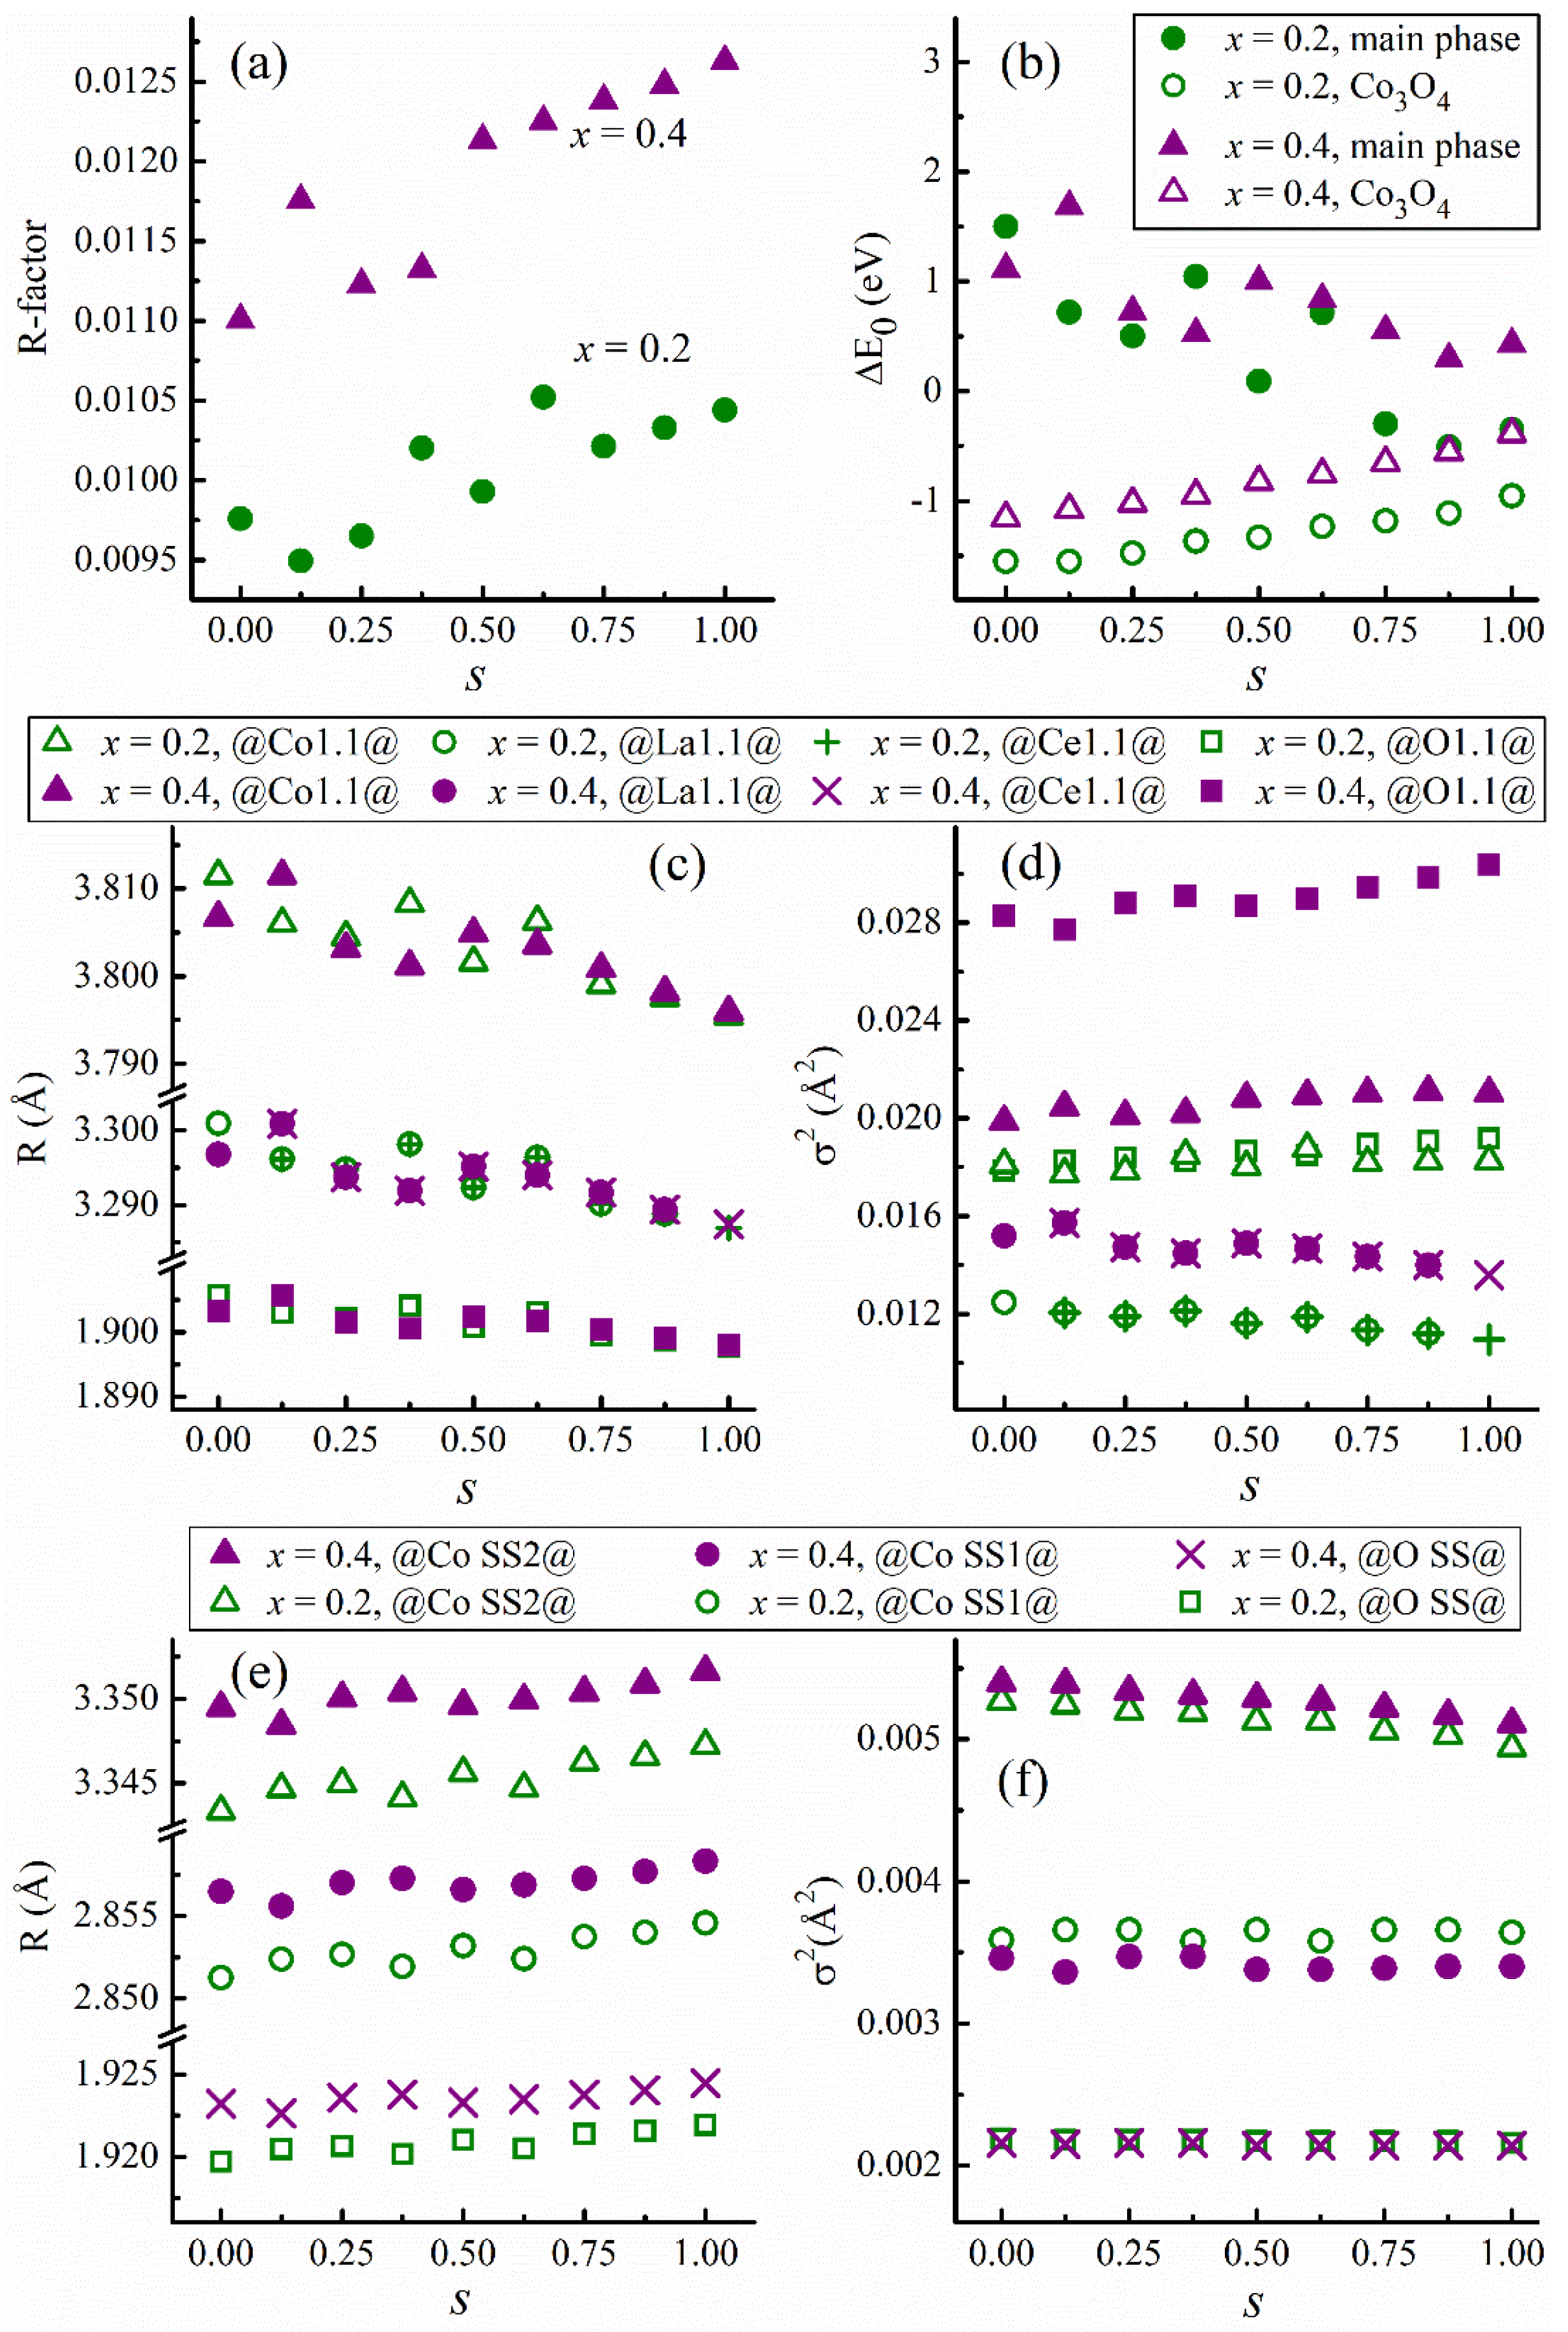
Furthermore, Figure 12a–f present the full particulars of R-factor, △E0, radial distance, and σ2 as a function of s for x = 0.2 and x = 0.4. All the R-factors less than 0.02 and the △E0 much less than 10 eV are strong indications of good EXAFS fits, validating the model of a mixture of two scattering phases. Notably, with increasing x, the main scattering phase shows subtle changes in the radial distance in Figure 12c, in contrast to the vividly increased σ2 values in Figure 12d. Otherwise, with increasing x, the secondary scattering phase reveals a distinct change of radial distance in Figure 12e and an insubstantial variation of σ2 values in Figure 12f. We deduce from these observations that the main scattering phase of the x = 0.4 sample possesses more disorder than that of the x = 0.2 sample. Additionally, the disorder degree of the secondary scattering phase is similar between the two cases x = 0.2 and x = 0.4.

5. Conclusions

In summary, we applied a combination of XRD and XAS on La1−xCexCoO3 samples to reexamine the solubility of Ce into the host lattice and study metal-oxygen bonding states of these electron-doped materials. The central result of the current work is the observation of changes in the Co–O bond and La–O bond lengths in LCO upon the effect of Ce addition and the formation of the mixed Ce valence state. The model combining a cubic LCO with Ce4+/Co2+ dopants and a secondary phase provides the best Rietveld refinement fit to the XRD data. Further, the EXAFS fitting results of Co K-edge data also substantiate the Rietveld analysis. However, all the models studied did not capture the precise knowledge on the extent of Ce insertion, and thus this issue remains open. In particular, the XANES data showed that La 5d-band of the pristine LCO is slightly electron-filled and that of Ce-doped LCO is in a less occupied state. We explored this phenomenon by the ab initio calculation of electron energy distribution, using the model electron density derived from XRD experiments and formulae of the density functional theory. The results establish the marginally covalent La–O bonding states of the pristine LCO in both rhombohedral and monoclinic lattice models and the nearly pure ionic La–O bonding states in cubic Ce-doped LCO.

Author Contributions

D.-C.N.: Conceptualization, Project administration, Methodology, Investigation, Data curation, Validation, Formal analysis, Software, Visualization, Writing—original draft, Writing—review and editing. C.-C.C.: Investigation. A.K.A.: Investigation. C.-S.C.: Resources, Supervision, Validation, Writing—review and editing. C.-H.L.: Resources, Supervision, Validation, Writing—review and editing, Funding acquisition. All authors have read and agreed to the published version of the manuscript.

Funding

National Science Council of Taiwan. Contract No. 99-WFA-0400161.

Institutional Review Board Statement

Not applicable.

Informed Consent Statement

Not applicable.

Data Availability Statement

The data presented in this study are available within the article.

Acknowledgments

We thank Duc-Long Nguyen, Tung Hsu, and Peng-Jen Chen for fruitful discussions and technical assistance. We acknowledge the Taiwan Light Source (NSRRC) for provision of beam time. This work was supported by the National Science Council of Taiwan, under Contract No. 99-WFA-0400161.

Conflicts of Interest

The authors declare no conflict of interest.

References

  1. Hwang, J.; Rao, R.R.; Giordano, L.; Katayama, Y.; Yu, Y.; Shao-Horn, Y. Perovskites in catalysis and electrocatalysis. Science 2017, 358, 751–756. [Google Scholar] [CrossRef] [PubMed] [Green Version]
  2. Seh, Z.W.; Kibsgaard, J.; Dickens, C.F.; Chorkendorff, I.; Nørskov, J.K.; Jaramillo, T.F. Combining theory and experiment in electrocatalysis: Insights into materials design. Science 2017, 355, 6321. [Google Scholar] [CrossRef] [Green Version]
  3. Fabbri, E.; Nachtegaal, M.; Binninger, T.; Cheng, X.; Kim, B.J.; Durst, J.; Bozza, F.; Graule, T.; Schäublin, R.; Wiles, L.; et al. Dynamic surface self-reconstruction is the key of highly active perovskite nano-electrocatalysts for water splitting. Nat. Mater. 2017, 16, 925–931. [Google Scholar] [CrossRef] [PubMed]
  4. Zhu, H.Y.; Zhang, P.F.; Dai, S. Recent advances of Lanthanum-based perovskite oxides for catalysis. ACS Catal. 2015, 5, 6370–6385. [Google Scholar] [CrossRef]
  5. Zeng, Z.C.; Xu, Y.S.; Zhang, Z.S.; Gao, Z.S.; Luo, M.; Yin, Z.Y.; Zhang, C.; Xu, J.; Huang, B.L.; Luo, F.; et al. Rare-earth-containing perovskite nanomaterials: Design, synthesis, properties and applications. Chem. Soc. Rev. 2020, 49, 1109–1143. [Google Scholar] [CrossRef] [PubMed]
  6. Radaelli, P.G.; Cheong, S.-W. Structural phenomena associated with the spin-state transition in LaCoO3. Phys. Rev. B 2002, 66, 094408. [Google Scholar] [CrossRef] [Green Version]
  7. Haas, O.; Struis, R.P.W.J.; McBreen, J.M. Synchrotron X-ray absorption of LaCoO3 perovskite. J. Solid State Chem. 2004, 177, 1000–1010. [Google Scholar] [CrossRef]
  8. Phelan, D.; Louca, D.; Rosenkranz, S.; Lee, S.-H.; Qiu, Y.; Chupas, P.J.; Osborn, R.; Zheng, H.; Mitchell, J.F.; Copley, J.R.D.; et al. Nanomagnetic droplets and implications to orbital ordering in La1−xSrxCoO3. Phys. Rev. Lett. 2006, 96, 027201. [Google Scholar] [CrossRef] [Green Version]
  9. Maris, G.; Ren, Y.; Volotchaev, V.; Zobel, C.; Lorenz, T.; Palstra, T.T.M. Evidence for orbital ordering in LaCoO3. Phys. Rev. B 2003, 67, 224423. [Google Scholar] [CrossRef] [Green Version]
  10. Korotin, M.A.; Ezkov, S.Y.; Solovyev, I.V.; Anisimov, V.I.; Khomskii, D.I.; Sawatzky, G.A. Intermediate-spin state and properties of LaCoO3. Phys. Rev. B 1996, 54, 5309. [Google Scholar] [CrossRef] [Green Version]
  11. Imada, M.; Fujimori, A.; Tokura, Y. Metal-insulator transitions. Rev. Mod. Phys. 1998, 70, 1039. [Google Scholar] [CrossRef] [Green Version]
  12. Ishikawa, A.; Nohara, J.; Sugai, S. Raman study of the orbital-phonon coupling in LaCoO3. Phys. Rev. Lett. 2004, 93, 136401. [Google Scholar] [CrossRef]
  13. Haverkort, M.W.; Hu, Z.; Cezar, J.C.; Burnus, T.; Hartmann, H.; Reuther, M.; Zobel, C.; Lorenz, T.; Tanaka, A.; Brookes, N.B.; et al. Spin state transition in LaCoO3 studied using soft X-ray absorption spectroscopy and magnetic circular dichroism. Phys. Rev. Lett. 2006, 97, 176405. [Google Scholar] [CrossRef] [Green Version]
  14. Merz, M.; Fuchs, D.; Assmann, A.; Uebe, S.; Löhneysen, H.v.; Nagel, P.; Schuppler, S. Spin and orbital states in single-layered La2−xCaxCoO4 studied by doping- and temperature-dependent near-edge X-ray absorption fine structure. Phys. Rev. B 2011, 84, 014436. [Google Scholar] [CrossRef]
  15. Augustinský, P.; Křápek, V.; Kuneš, J. Doping induced spin state transition in LaCoO3: Dynamical mean-field study. Phys. Rev. Lett. 2013, 110, 267204. [Google Scholar] [CrossRef] [Green Version]
  16. Feygenson, M.; Novoselov, D.; Pascarelli, S.; Chernikov, R.; Zaharko, O.; Porcher, F.; Karpinsky, D.; Nikitin, A.; Prabhakaran, D.; Sazonov, A.; et al. Manifold of spin states and dynamical temperature effects in LaCoO3: Experimental and theoretical insights. Phys. Rev. B 2019, 100, 054306. [Google Scholar] [CrossRef] [Green Version]
  17. Park, H.; Nanguneri, R.; Ngo, A.T. DFT + DMFT study of spin-charge-lattice coupling in covalent LaCoO3. Phys. Rev. B 2020, 101, 195125. [Google Scholar] [CrossRef]
  18. Medling, S.; Lee, Y.; Zheng, H.; Mitchell, J.F.; Freeland, J.W.; Harmon, B.N.; Bridges, F. Evolution of magnetic oxygen states in Sr-doped LaCoO3. Phys. Rev. Lett. 2012, 109, 157204. [Google Scholar] [CrossRef] [PubMed] [Green Version]
  19. Zhang, Q.F.; Zhang, W.Y. Magnetic ground state of electron-doped La1−xCexCoO3 compounds. Phys. Rev. B 2003, 68, 184403. [Google Scholar] [CrossRef]
  20. Fuchs, D.; Schweiss, P.; Adelmann, P.; Schwarz, T.; Schneider, R. Ferromagnetic order in the electron-doped system La1−xCexCoO3. Phys. Rev. B 2005, 72, 014466. [Google Scholar] [CrossRef]
  21. Merz, M.; Nagel, P.; Pinta, C.; Samartsev, A.; Löhneysen, H.v.; Wissinger, M.; Uebe, S.; Assmann, A.; Fuchs, D.; Schuppler, S. X-ray absorption and magnetic circular dichroism of LaCoO3, La0.7Ce0.3CoO3, and La0.7Sr0.3CoO3 films: Evidence for cobalt-valence-dependent magnetism. Phys. Rev. B 2010, 82, 174416. [Google Scholar] [CrossRef] [Green Version]
  22. Qian, J.M.; Wang, T.T.; Zhang, Z.M.; Liu, Y.G.; Li, J.F.; Gao, D.Q. Engineered spin state in Ce doped LaCoO3 with enhanced electrocatalytic activity for rechargeable Zn-air batteries. Nano Energy 2020, 74, 104948. [Google Scholar] [CrossRef]
  23. Xu, X.M.; Wang, W.; Zhou, W.; Shao, Z.P. Recent advances in novel nanostructuring methods of perovskite electrocatalysts for energy-related applications. Small Methods 2018, 2, 1800071. [Google Scholar] [CrossRef]
  24. Tsang, K.L.; Lee, C.H.; Jean, Y.C.; Dann, T.E.; Chen, J.R.; D’Amico, K.L.; Oversluizen, T. Wiggler X-ray beamlines at Synchrotron Radiation Research Center. Rev. Sci. Instrum. 1995, 66, 1812–1814. [Google Scholar] [CrossRef]
  25. Lutterotti, L.; Matthies, S.; Wenk, H.-R.; Schultz, A.S.; Richardson, J.W. Combined texture and structure analysis of deformed limestone from time-of-flight neutron diffraction spectra. J. Appl. Phys. 1997, 81, 594–600. [Google Scholar] [CrossRef]
  26. Thornton, G.; Tofield, B.C.; Hewat, A.W. A neutron diffraction study of LaCoO3 in the temperature range 4.2 < T < 1248 K. J. Solid State Chem. 1986, 61, 301–307. [Google Scholar]
  27. Wold, A.; Ward, R. Perowskite-type oxides of cobalt, chromium and vanadium with some rare earth elements. J. Am. Chem. Soc. 1954, 76, 1029–1030. [Google Scholar] [CrossRef]
  28. Roth, W.L. The magnetic structure of Co3O4. J. Phys. Chem. Solids 1964, 25, 1–10. [Google Scholar] [CrossRef]
  29. Wyckoff, R.W.G. Crystal Structures, 2nd ed.; Interscience Publishers, Inc.: New York, NY, USA, 1963; Volume 1, pp. 239–444. [Google Scholar]
  30. Toby, B.H. R factors in Rietveld analysis: How good is good enough? Powder Diffr. 2006, 21, 67–70. [Google Scholar] [CrossRef] [Green Version]
  31. Capehart, T.W.; Mishra, R.K.; Meisner, G.P.; Fuerst, C.D.; Herbst, J.F. Steric variation of the cerium valence in Ce2Fe14B and related compounds. Appl. Phys. Lett. 1993, 63, 3642. [Google Scholar] [CrossRef]
  32. Li, Y.J.; Ohnishi, N.; Nakai, I.; Amakai, Y.; Murayama, S. X-ray absorption near edge structure of amorphous CexRu100-x. J. Phys. Soc. Jpn. 2009, 78, 904717. [Google Scholar] [CrossRef]
  33. Kossoy, A.; Wang, Q.; Korobko, R.; Grover, V.; Feldman, Y.; Wachtel, E.; Tyagi, A.K.; Frenkel, A.I.; Lubomirsky, I. Evolution of the local structure at the phase transition in CeO2-Gd2O3 solid solutions. Phys. Rev. B 2013, 87, 054101. [Google Scholar] [CrossRef] [Green Version]
  34. Minasian, S.G.; Batista, E.R.; Booth, C.H.; Clark, D.L.; Keith, J.M.; Kozimor, S.A.; Lukens, W.W.; Martin, R.L.; Shuh, D.K.; Stieber, S.C.E.; et al. Quantitative evidence for Lanthanide-Oxygen orbital mixing in CeO2, PrO2, and TbO2. J. Am. Chem. Soc. 2017, 139, 18052–18064. [Google Scholar] [CrossRef] [PubMed] [Green Version]
  35. Tsirelson, V.G. Topological analysis of the experimental electron density. Can. J. Chem. 1996, 74, 1171–1179. [Google Scholar] [CrossRef]
  36. Tsirelson, V.G. The mapping of electronic energy distributions using experimental electron density. Acta Crystallogr. B 2002, 58, 632–639. [Google Scholar] [CrossRef] [PubMed] [Green Version]
  37. Momma, K.; Izumi, F. VESTA 3 for three-dimensional visualization of crystal, volumetric and morphology data. J. Appl. Crystallogr. 2011, 44, 1272–1276. [Google Scholar] [CrossRef]
  38. Ravel, B.; Newville, M. ATHENA, ARTEMIS, HEPHAESTUS: Data analysis for X-ray absorption spectroscopy using IFEFFIT. J. Synchrotron. Radiat. 2005, 12, 537–541. [Google Scholar] [CrossRef] [Green Version]
  39. Calvin, S. XAFS for Everyone; CRC Press: Boca Raton, FL, USA, 2013. [Google Scholar]
  40. Nguyen, D.C.; Chu, C.C.; Lee, C.H.; Lai, W.C.; Chang, C.S. Coercivity enhancement of FePd thin films prepared by the post-annealing of off-stoichiometric magnetron-sputtered multilayers. J. Appl. Phys. 2018, 123, 073901. [Google Scholar] [CrossRef]
  41. Ravel, B. Path degeneracy and EXAFS analysis of disordered materials. J. Synchrotron. Radiat. 2014, 21, 1269–1274. [Google Scholar] [CrossRef]
  42. Kotani, A.; Jo, T.; Parlebas, J.C. Many-body effects in core-level spectroscopy of rare-earth compounds. Adv. Phys. 1988, 37, 37–85. [Google Scholar] [CrossRef]
  43. Booth, C.H.; Walter, M.D.; Lukens, W.W.; Andersen, R.A. Self-contained Kondo effect in single molecules. Phys. Rev. Lett. 2005, 95, 267202. [Google Scholar] [CrossRef] [PubMed] [Green Version]
Figure 1. Weighted profile R-factor as a function of s, the fraction of cerium dopants in the main phase of La1−xCexCoO3 with (a) x = 0.2 and (b) x = 0.4. In these Rietveld fits, six models consider three different space-groups of the main phase and two forms of dopants. The three space groups are R-3c: R (rhombohedral), I12/a1 (monoclinic), and Pm-3m (cubic). The two cases of cerium dopants are Ce3+ and Ce4+/Co2+. The secondary phase, CeO2, has a face-centered cubic space group of Fm-3m.
Crystals 12 00050 g001
Figure 2. Rietveld refinement patterns of XRD data for La1xCexCoO3: (a,b) x = 0, (c,d) x = 0.2, and (e,f) x = 0.4. Vertical lines at the bottom of each sub-figure represent positions of Bragg peaks of the main phase (lower lines) and the secondary phase (upper lines). Phase and [space group] for each subfigure are as follows: (a) LaCoO3 [I12/a1] + Co3O4 [Fd-3m:1], (b) LaCoO3 [R-3c: R] + Co3O4 [Fd-3m:1], (c) La 0.8 3 + Ce 0.2 4 + Co 0.8 3 + Co 0.2 2 + O 3 [I12/a1] + CeO2 [Fm-3m], (d) La 0.8 3 + Ce 0.2 4 + Co 0.8 3 + Co 0.2 2 + O 3 [Pm-3m] + CeO2 [Fm-3m], (e) La 0.6 3 + Ce 0.4 4 + Co 0.6 3 + Co 0.4 2 + O 3 [I12/a1] + CeO2 [Fm-3m], and (f) La 0.6 3 + Ce 0.4 4 + Co 0.6 3 + Co 0.4 2 + O 3 [Pm-3m] + CeO2 [Fm-3m].
Crystals 12 00050 g002
Figure 3. Lattice parameters refined from XRD data for La1−xCexCoO3 with x = 0.2 and x = 0.4, considering two cases of cerium dopants as either Ce3+ or Ce4+/Co2+. (ag) Lattice parameters of the main phase with a lattice model of (a) cubic, (b,c) rhombohedral, and (dg) monoclinic. (hj) Lattice parameters of the secondary phase, CeO2, where (h) the main phase is cubic, (i) the main phase is rhombohedral, and (j) the main phase is monoclinic.
Crystals 12 00050 g003
Figure 4. (a) Total charge received by La/Ce and Co and (b) fraction of charge (△q) received by each O-coordination about La/Ce and Co as a function of s, the fraction of cerium dopants in La1−sCesCoO3, which is the main phase of La1−xCexCoO3. The calculations use the structural parameters obtained from the Rietveld refinement analysis, considering the main lattice as a cubic lattice.
Crystals 12 00050 g004
Figure 5. XANES spectra at the Ce L3 edge of La1−xCexCoO3, with (A) x = 0.2 and (B) x = 0.4, and results of least-squares-fit analyses. The dashed lines indicate the fitting procedure.
Crystals 12 00050 g005
Figure 6. XANES spectra at the La L3-edge of La1−xCexCoO3, where x = 0, 0.2, and 0.4.
Crystals 12 00050 g006
Figure 7. Schematic of the primitive cell of different models for the main phase of La1−xCexCoO3 as (a) rhombohedral, (b) monoclinic, and (c) cubic, and local coordination geometry around La atoms showing the difference in the effective coordination number.
Crystals 12 00050 g007
Figure 8. A 2 × 2 × 2 supercell of different models for the main phase of La1−xCexCoO3 along the lattice vector a: (a) rhombohedral, (b) monoclinic, and (c) cubic. A solid blue line marks (a) a (011) plane of the rhombohedral lattice, (b) a (0-11) plane of the monoclinic lattice, and (c) a (001) plane of the cubic lattice. (df) Details of the corresponding plane marked in (ac), respectively.
Crystals 12 00050 g008
Figure 9. (ac) Electron-density distribution on a plane in the main lattice of La1−xCexCoO3 of different models. (a) a (011) plane of the rhombohedral lattice, (b) a (011) plane of the monoclinic lattice, and (c) a (011) plane of the cubic lattice. Contours are plotted up to 1.0 a0−3, with an interval of 0.1 a0−3. a0 = 0.529177211 Å (a0: Bohr radius). (df) Electronic energy map of the corresponding plane in (ac). Contours are plotted down to −0.02 Eha0−3, with an interval of −0.002 Eha0−3. Eh = 4.3597443 × 10⁻¹⁸ J (Eh: Hartree).
Crystals 12 00050 g009
Figure 10. (a) Normalized absorption data measured at the Co K-edge of La1−xCexCoO3, where x = 0, 0.2, and 0.4. (b) Extracted k2-weighted χ k data.
Crystals 12 00050 g010
Figure 11. Data and fit for EXAFS data of La1−xCexCoO3 with x = 0, 0.2, and 0.4: (a) magnitude and (b) real part of Fourier transform from the corresponding k2-weighted χ k data.
Crystals 12 00050 g011
Figure 12. Fit indices and fitted parameters as a function of s, the fraction of cerium dopants in the cubic main phase, for EXAFS data of La1−xCexCoO3, with x = 0.2, and 0.4. (a) R-factor. (b) △E0. (c,d) respectively show the values for radial distance and σ2 for scattering paths of the main scattering phase. (e,f) respectively show the values for radial distance and σ2 for scattering paths of the Co3O4-like scattering phase.
Crystals 12 00050 g012
Table 1. Structural information used as inputs for FEFF calculations (Rhombo = Rhombohedral).
xPhaseSpace Group
Name, Number
Unit Cell
0Rhombo LaCoO3R-3c, 167a = b = c = 5.3855 (Å), α = β = γ = 60.727 (°)
0Co3O4Fd-3m, 227a = b = c = 8.0796 (Å), α = β = γ = 90.000 (°)
0.2 and 0.4Cubic La1−sCesCoO3Pm-3m, 221a = b = c = 3.8817 (Å), α = β = γ = 90.000 (°)
0.2 and 0.4Co3O4Fd-3m, 227a = b = c = 8.0796 (Å), α = β = γ = 90.000 (°)
Note: s = 0, 0.125, 0.25, 0.375, 0.5, 0.625, 0.75, 0.875, and 1.
Table 2. EXAFS model for Co K-edge spectrum of the x = 0 sample based on the two-phase mixture. Co3O4 has two inequivalent absorbing sites. The symbol @ denotes the absorbing atom.
Scattering PhaseScattering Path N j i R e f f   ( Å ) σ j i 2   ( Å 2 ) Δ E 0 j   ( eV ) Δ R j   ( Å )
Rhombo LaCoO3@ O1.1 @61.936 σ O 1.1 2 Δ E 0 1 Δ R O 1.1
Rhombo LaCoO3@ La1.1 @23.280 σ L a 1.1 2 Δ E 0 1 Δ R L a 1.1
Rhombo LaCoO3@ La1.2 @63.328 σ L a 1.1 2 Δ E 0 1 Δ R L a 1.2
Rhombo LaCoO3@ Co1.1 @63.829 σ C o 1.1 2 Δ E 0 1 Δ R C o 1.1
Rhombo LaCoO3@ O1.1Co1.1 @Ʃ = 123.850 σ C o 1.1 2 Δ E 0 1 = ( 2 Δ R O 1.1 Δ R C o 1.1 ) / 2
Rhombo LaCoO3@ O1.1Co1.1O1.1 @Ʃ = 63.871 σ C o 1.1 2 Δ E 0 1 Δ R C o 1.1
Co3O4@ O_SS @5.3331.923 σ O   S S 2 Δ E 0 2 αReff
Co3O4@ Co_SS1 @4 2.857 σ C o   S S 1 2 Δ E 0 2 αReff
Co3O4@ Co_SS2 @83.350 σ C o   S S 2 2 Δ E 0 2 αReff
Table 3. EXAFS model for Co K-edge spectra of the x = 0.2 and x = 0.4 samples based on the two-phase mixture. Co3O4 has two inequivalent absorbing sites. The symbol @ denotes the absorbing atom.
Scattering PhaseScattering PathNji R e f f   ( Å ) σ j i 2   ( Å 2 ) Δ E 0 j   ( eV ) Δ R j   ( Å )
Cubic La1−sCesCoO3@ O1.1 @5.41.941 σ O 1.1 2 Δ E 0 1 α1Reff
Cubic La1−sCesCoO3@ La1.1 @8(1−s)3.362 σ L a 1.1 2 Δ E 0 1 α1Reff
Cubic La1−sCesCoO3@ Ce1.1 @8s3.362 σ L a 1.1 2 Δ E 0 1 α1Reff
Cubic La1−sCesCoO3@ Co1.1 @63.882 σ C o 1.1 2 Δ E 0 1 α1Reff
Cubic La1−sCesCoO3@ O1.1Co1.1 @Ʃ = 123.882 σ C o 1.1 2 Δ E 0 1 α1Reff
Cubic La1−sCesCoO3@ O1.1Co1.1O1.1 @Ʃ = 63.882 σ C o 1.1 2 Δ E 0 1 α1Reff
Co3O4@ O_SS @5.3331.923 σ O   S S 2 Δ E 0 2 α2Reff
Co3O4@ Co_SS1 @4 2.857 σ C o   S S 1 2 Δ E 0 2 α2Reff
Co3O4@ Co_SS2 @83.350 σ C o   S S 2 2 Δ E 0 2 α2Reff
Note: s = 0, 0.125, 0.25, 0.375, 0.5, 0.625, 0.75, 0.875, and 1.
Table 4. Weight percent and microstructural details of individual phases of La1−xCexCoO3, as determined from the Rietveld refinement analysis. Numbers in parentheses are statistical errors of the last significant digit (Main = main phase, Second = Secondary phase).
xMain Phase Lattice ModelWeight %Crystallite Size (Å)Micro-Strain (%)
MainSecondMainSecondMainSecond
0.0Rhombohedral85.5(2)14.5(2)1411(39)1045(38)0.160(3)0.186(7)
0.0Monoclinic85.3(3)14.7(3)1386(38)908(35)0.160(3)0.166(6)
0.2Cubic86.5(1)13.5(1)228(1)167(2)0.278(4)0.048(1)
0.2Rhombohedral86.4(1)13.6(1)236(1)171(2)0.181(7)0.031(2)
0.2Monoclinic86.4(1)13.6(1)242(2)171(2)0.104(6)0.039(3)
0.4Cubic43.6(3)56.4(3)185(9)171(5)0.17(2)0.11(2)
0.4Rhombohedral42.7(3)57.3(3)211(9)171(5)0.049(8)0.11(2)
0.4Monoclinic42.8(3)57.2(3)211(9)171(5)0.047(5)0.16(1)
Table 5. Lattice parameters of individual phases of La1−xCexCoO3 resulting from the Rietveld refinement. Form of dopants: Ce4+/Co2+. Numbers in parentheses are statistical errors of the last significant digit.
Main PhaseSecondary Phase (All Cubic)
Latticex = 0x = 0.2x = 0.4x = 0x = 0.2x = 0.4
Co3O4CeO2CeO2
a (Å)Cubic 3.8817(2)3.8873(6) 5.4154(6)5.4151(8)
a (Å)Rhombohedral5.3855(2)5.4754(5)5.482(1)8.0796(6)5.4157(6)5.4153(8)
α (°)Rhombohedral60.727(2)60.333(8)60.38(2)
a (Å)Monoclinic5.387(2)5.471(1)5.495(5)8.0798(6)5.4160(5)5.4158(9)
b (Å)Monoclinic5.443(3)5.5187(9)5.492(4)
c (Å)Monoclinic7.657(4)7.748(2)7.790(6)
β (°)Monoclinic90.91(3)90.28(2)90.60(3)
Table 6. Details of local coordination for La and Co of the main phase, as a result of the Rietveld refinement analysis. Numbers in parentheses are statistical errors of the last significant digit.
xMain Phase Lattice ModelCoordination and MultiplicityDistance (Å)Fraction of the Charge Received by Each O-Coordination
0RhombohedralLa-O × 32.4384(1)0.447
La-O × 32.7074(1)0.240
La-O × 32.7079(1)0.239
La-O × 33.0062(1)0.074
Co-O × 61.93510(8)0.500
0MonoclinicLa-O × 12.411(1)0.472
La-O × 22.4549(9)0.437
La-O × 22.662(1)0.272
La-O × 22.711(1)0.236
La-O × 22.750(1)0.209
La-O × 22.991(1)0.078
La-O × 13.032(2)0.064
Co-O × 21.8988(6)0.558
Co-O × 21.939(1)0.494
Co-O × 21.9688(8)0.448
0.2CubicLa-O × 122.7448(3)0.250 to 0.333 (plotted in Figure 4)
Co-O × 61.9409(2)0.500 to 0.333 (plotted in Figure 4)
0.4CubicLa-O × 122.7487(5)0.250 to 0.333 (plotted in Figure 4)
Co-O × 61.9436(4)0.500 to 0.333 (plotted in Figure 4)
Table 7. EXAFS fit values for x = 0. R-factor = 0.0145. S 0 2 = 1 (Rhombo = Rhombohedral).
Scattering PhaseScattering Path σ j i 2   ( Å 2 ) Δ E 0 j   ( eV ) Δ R j   ( Å ) R j i   ( Å )
Rhombo LaCoO3@ O1.1 @0.01200.3−0.0491.887
Rhombo LaCoO3@ La1.1 @0.00370.30.1603.440
Rhombo LaCoO3@ La1.2 @0.00370.30.0053.333
Rhombo LaCoO3@ Co1.1 @0.00720.3−0.0483.781
Rhombo LaCoO3@ O1.1Co1.1 @0.00720.3−0.0253.825
Rhombo LaCoO3@ O1.1Co1.1 O1.1 @0.00720.3−0.0483.823
Co3O4@ O_SS @0.0020−5.7−0.0061.918
Co3O4@ Co_SS1 @0.0080−5.7−0.0082.848
Co3O4@ Co_SS2 @0.0296−5.7−0.0103.340
Table 8. EXAFS fit values for x = 0.2, s = 0.25. R-factor = 0.0096. S 0 2 = 1 .
Scattering PhaseScattering Path σ j i 2   ( Å 2 ) Δ E 0 j   ( eV ) Δ R j   ( Å ) R j i   ( Å )
Cubic La1−sCesCoO3@ O1.1 @0.01840.5−0.0391.902
Cubic La1−sCesCoO3@ La1.1 @0.01190.5−0.0673.295
Cubic La1−sCesCoO3@ Ce1.1 @0.01190.5−0.0673.295
Cubic La1−sCesCoO3@ Co1.1 @0.01780.5−0.0773.804
Cubic La1−sCesCoO3@ O1.1Co1.1 @0.01780.5−0.0773.804
Cubic La1−sCesCoO3@ O1.1Co1.1O1.1 @0.01780.5−0.0773.804
Co3O4@ O_SS @0.0022−1.5−0.0031.921
Co3O4@ Co_SS1 @0.0037−1.5−0.0042.853
Co3O4@ Co_SS2 @0.0052−1.5−0.0053.345
Table 9. EXAFS fit values for x = 0.4, s = 0.375. R-factor = 0.0113. S 0 2 = 1 .
Scattering PhaseScattering Path σ j i 2   ( Å 2 ) Δ E 0 j   ( eV ) Δ R j   ( Å ) R j i   ( Å )
Cubic La1−sCesCoO3@ O1.1 @0.02910.5−0.0401.901
Cubic La1−sCesCoO3@ La1.1 @0.01450.5−0.0703.292
Cubic La1−sCesCoO3@ Ce1.1 @0.01450.5−0.0703.292
Cubic La1−sCesCoO3@ Co1.1 @0.02020.5−0.0813.801
Cubic La1−sCesCoO3@ O1.1Co1.1 @0.02020.5−0.0813.801
Cubic La1−sCesCoO3@ O1.1Co1.1O1.1 @0.02020.5−0.0813.801
Co3O4@ O_SS @0.0022−0.90.0001.924
Co3O4@ Co_SS1 @0.0035−0.90.0012.857
Co3O4@ Co_SS2 @0.0053−0.90.0013.350
Publisher’s Note: MDPI stays neutral with regard to jurisdictional claims in published maps and institutional affiliations.

