Article

Dislocation Mechanisms and Local Strength with a View towards Sleeper Screw Failures

Department of Civil and Mechanical Engineering, Technical University of Denmark, 2800 Kgs. Lyngby, Denmark
*
Author to whom correspondence should be addressed.
Crystals 2023, 13(4), 656; https://doi.org/10.3390/cryst13040656
Submission received: 1 March 2023 / Revised: 4 April 2023 / Accepted: 7 April 2023 / Published: 11 April 2023

Abstract

:
Dislocation structures can be directly related to the fatigue properties of metals, such as fatigue strength, including the fatigue limit and saturation stress. We present an indirect dislocation-structure-based method to evaluate the local stresses for an in-depth analysis of sleeper screw failures, as there is little knowledge about the load and local stresses related to these failures. The sleeper screw, fastening baseplates of rails to sleepers, is a small but critical component in the railway. High loads from passing trains are transferred to the screws, leading to cyclic straining. In the present study, three stress-level tension fatigue experiments are designed in the constant stress mode at a stress ratio R = 0 and a testing frequency of 10 Hz. The microstructures in the failed specimens are characterized and compared with those close to the fracture surface of screws that failed in the field. The dislocation structure similarities and differences are analyzed, and the potential of the proposed methodology is discussed.

1. Introduction

The fatigue of metals and alloys is normally characterized by crack initiation and propagation from either external surfaces [1,2,3,4] or interior defects [5,6,7,8], and the fatigue life can be expressed as the sum of two contributions: (a) the number of loading cycles required to initiate cracks and (b) the number of cycles it takes the cracks to propagate to failure. During the fatigue processes of many single-phase metals, including copper and steel, the formation of intense slip bands, called persistent slip bands (PSBs), has been well-known since the 1970s [1]. PSBs persist more or less unchanged throughout the major part of a low-strain amplitude fatigue test and are visible on the surfaces of the specimens when they are electropolished and re-strained. Strain localization at PSBs is normally a precursor to crack initiation. Most of the experiments leading to these conclusions were performed under a constant plastic strain amplitude for single- and poly-crystalline FCC and BCC single-phase metals [1,2,3]. Besides PSBs, other dislocation structures such as dislocation cells in the matrix also develop. This is to accommodate the irreversible slip processes and the increasing dislocation density during cyclic forward and reverse loading.
Whereas a lot of work has been performed studying low cycle fatigue (LCF) in single-phase samples in the laboratory, there is, of course, an even larger interest in understanding LCF for components used in the field. An interesting example is sleeper screws, which fasten the baseplate of rails to the sleepers. Sleeper screws experience complicated loading conditions. The high loads from passing trains are cyclically transferred into the screws, while exposure to often harsh environments corrodes the screws. This may result in premature failure. For example, the sleeper screws in use near the Copenhagen central station in Denmark often break after being in service for less than one year. Due to the complex conditions, the load and local stresses related to such screw failures are neither well characterized nor understood, so these failures cannot be modeled in spite of their importance for the safety and reliability of the railway network [9].
A common characteristic of the locally-stressed area is its limited extension into the material, typically from a few micrometers to a few tens of micrometers [10]. It is, therefore, difficult to determine the stress profile in this area, for example, to be used in fatigue models. As a substitute for direct stress measurements, microhardness has been successfully applied in the evaluation of local stresses in a heterogeneously deformed 1050 Al ring [11]. However, the spatial resolution of this method is limited because of the indent size. Meanwhile, nanoindentation is seldom applied in the engineering field as it overestimates the stress level due to the size effect (the smaller nanoindents result in higher measured hardness).
In order to increase the resolution of the stress estimate in local volumes such as those near the deformed/fractured surface, it has been suggested to supplement the direct techniques with an indirect method where microstructural parameters are quantified by electron microscopy and the stress is calculated based on assumptions with regard to strengthening mechanisms and strength–structure relationships [11,12,13,14,15,16]. This indirect method may also be applied for nanostructured high-strength metallic samples to understand the effect of thermomechanical and/or thermochemical processing during production and repair on the properties and performance [17,18,19,20]. For more complicated engineering situations, such as the high local stresses leading to sleeper screw failures in the field, it is of interest to investigate if such microstructural investigations in the laboratory can be used to evaluate the local stress level.
In this paper, low cycle fatigue experiments are designed to develop similar dislocation structure characteristics as those observed in the field-failed screws in the soft phase of a ferrite + pearlite dual-phase steel. We suggest that we thereby can estimate the local stresses leading to sleeper screw failures. The similarities and differences in the laboratory and in-field dislocation structures are discussed, as well as other factors that may influence the results, such as specific loading conditions and environmental effects. Additionally, the estimated local stresses may subsequently be used in fatigue models to simulate crack initiation and propagation.

2. Experimental

In a previous investigation of sleeper screws, which have failed or almost failed in the Danish rail network, the 3D shape of the screws was characterized by X-ray tomography [21]. The results revealed an obvious elongation and necking between the second and third screw threads, indicating that a tension component is critical to the failure of these screws. At the same time, the fracture topography showed the typical three crack stages: crack initiation, crack propagation and shear fracture [10].
The investigated sleeper screws are made of a dual-phase steel. For the dual-phase structure of soft ferrite and hard pearlite, the plastic deformation during low cycle fatigue initiates in the soft phase and subsequently transfers to the hard phase, as also observed in other two-phase systems [22,23,24,25,26]. During the fatigue processes, dislocation structures form and their scales tend to saturate after several thousand cycles during reverse push-pull fatigue [27]. However, dislocation boundary misorientation information has seldom been reported in the literature. Thus, in this study, we will apply a new standard to evaluate the local stress under fatigue, including the scale of the dislocation structure, such as the boundary spacing, as well as the boundary misorientation.
The samples used in this project are sleeper screws provided by Railnet Denmark. The screw steel is an ASTM 1035 middle carbon steel with a ferrite + pearlite dual-phase microstructure (Figure 1a). Figure 1b,c shows the tensile stress-strain curve for this material. The yield stress is about 390 MPa, while the ultimate tensile strength is 680 MPa with a total elongation of 19%.
The fatigue samples were made to the same size as those for the tensile testing according to the international standard ISO 6892-1 [28] as sketched in Figure 1d. Stress-controlled low cycle fatigue tests were performed using a SHY-039-Instron-8872 test machine with a digital control system at room temperature in air. The frequency was 10 Hz with the stress ratio of R = 0. The selected stress amplitudes were 391, 500 and 600 MPa, while the total cycles to failure were 200,000 (stopped but not failed), 69,000 and 8900, respectively. The system could collect about 50 data points per cycle for the subsequent analysis. During the fatigue test, the uniaxial strain was measured by a clip-on extensometer with a gauge length of 12.5 mm, which was attached to the gauge zone of the sample. The deformed microstructures were characterized by a ZEISS Supra 35 scanning electron microscope operated at 15kV using electron backscatter diffraction (EBSD) with a step size of 100 nm. For this, the cross-sections of the gauge parts were cut out and mechanically polished with a series of sandpapers until #4000, followed by mechanical polishing under a load of 10 N for 15 min, then 5 N for 5 min with an oxide-polishing solution (OPS) containing 25% Ammonia and 3% H2O2.
Modern EBSD systems directly perform diffraction pattern “quality” (e.g., Band slope (BS)) calculations for every pattern analyzed, regardless of the EBSD “indexability” or the state of the material beneath. BS maps are microstructurally sensitive SEM images, collected at EBSD speeds and with high grid resolutions [29]. BS maps are useful for visual estimation of features that cause poor band contrast, including slip bands, grain boundaries, low-angle dislocation boundaries (LABs), phase interfaces and surface imperfections, such as pores, scratches and small inclusions. BS maps are generally clearer than backscatter electron (BSE) images, but are also a lot more time-consuming to analyze properly. In this study, BS maps plus dislocation boundary characteristics, including boundary spacing and misorientation determined by EBSD, are used for the evaluation of local stresses.

3. Results and Discussion

As a basis for our evaluation of local stresses in sleeper screws, we use a comparison between microstructures observed in screws that have failed in the field and in samples deformed under controlled fatigue experiments in the laboratory. We shall, therefore, in the following, first present the in-field-failed screw microstructure and then those observed in the laboratory-tested samples.
Figure 2 shows an optical micrograph of the fracture surface and site-specific cross-section sub-surface SEM and EBSD micrographs at the crack initiation stage (stage 1) of an in-field-failed screw. The OM micrograph shows the typical three stages: crack initiation, crack propagation and shear fracture. Fresh fracture surfaces have often been used to analyze the failure mechanisms for metals [30]. In the present case, the fracture surface of the broken screw is covered by oxides from corrosion, which inhibit such an analysis. The broken screw has, therefore, been cut into two pieces from the central line, as indicated by the black dashed line in Figure 2. Thereby we can investigate the sub-surface area corresponding to stages 1 and 2, i.e., crack initiation and propagation.
Figure 3 indicates that close to the fracture surface, the stress is high. The ferrite grains have been subdivided into subgrains with an average size of around 600 nm with subgrain boundary misorientations ranging from 1° to 19°. A larger subgrain size of 1.2 μm, at a distance of ~20 μm from the surface, is observed in the ferrite grain (pointed to by the black arrow in the EBSD BS map in Figure 2); and the lighter grey color of the subgrain boundaries also indicates smaller boundary misorientations, compared to those in the two ferrite grains pointed to by the white arrow in Figure 2. Relatively “clean” ferrite grains without subgrain boundaries are observed at a position of ~2 mm from the fracture surface. This gradient microstructure reveals a stress/strain gradient from the fracture surface into the matrix [13,14,16].
It is interesting that the gradient structure forms not only in the ferrite grains (as mentioned above), but also in the pearlite lamellar structure. Normally there are threading dislocations but no dislocation boundaries in the ferrite lamellae in a pearlite colony [31,32,33] and the misorientations between neighboring ferrite lamellae are normally less than 1° in the as-transformed state from austenite [34,35,36]. However, in the present sample, there are many dislocation boundaries with misorientations larger than 2° in the ferrite lamellae, as well as between neighboring ferrite lamellae (colored blue in Figure 3a). The density of these dislocation boundaries is high close to the fracture surface (bottom left corner), while they are rare several micrometers away (top right corner).
Besides the key finding that there exists a stress gradient from the fracture surface into the matrix, other important characteristics include:
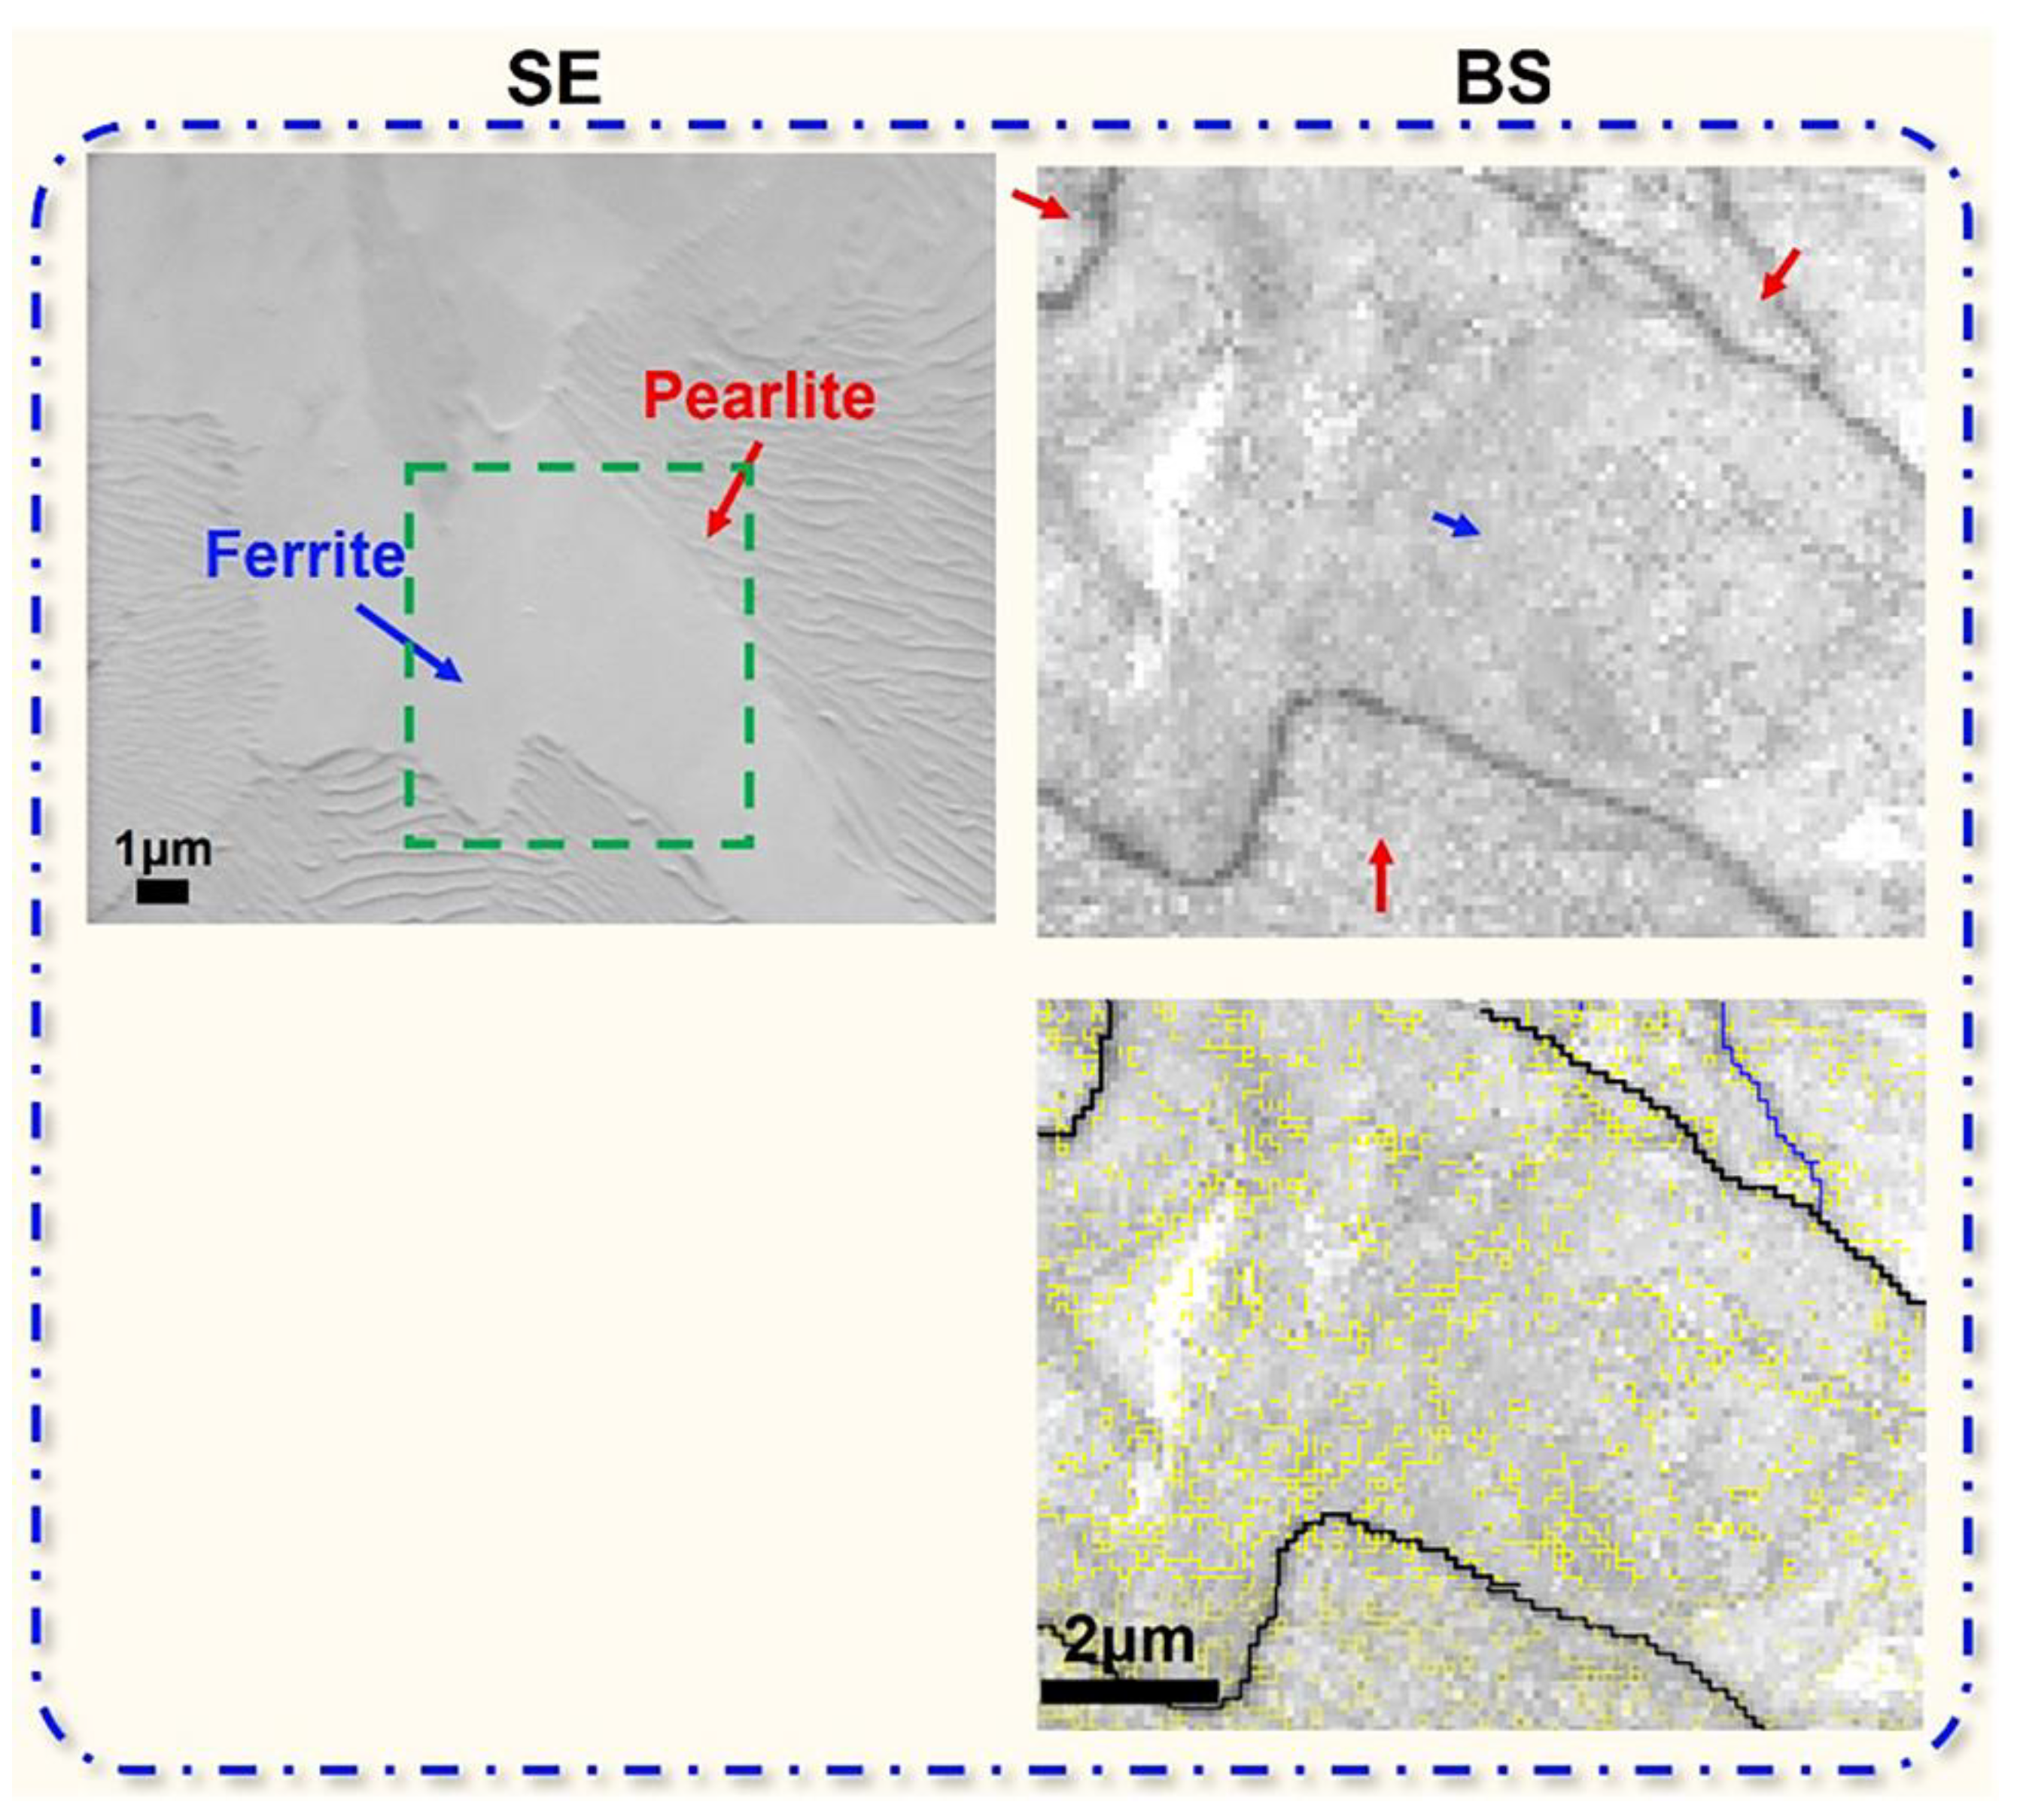
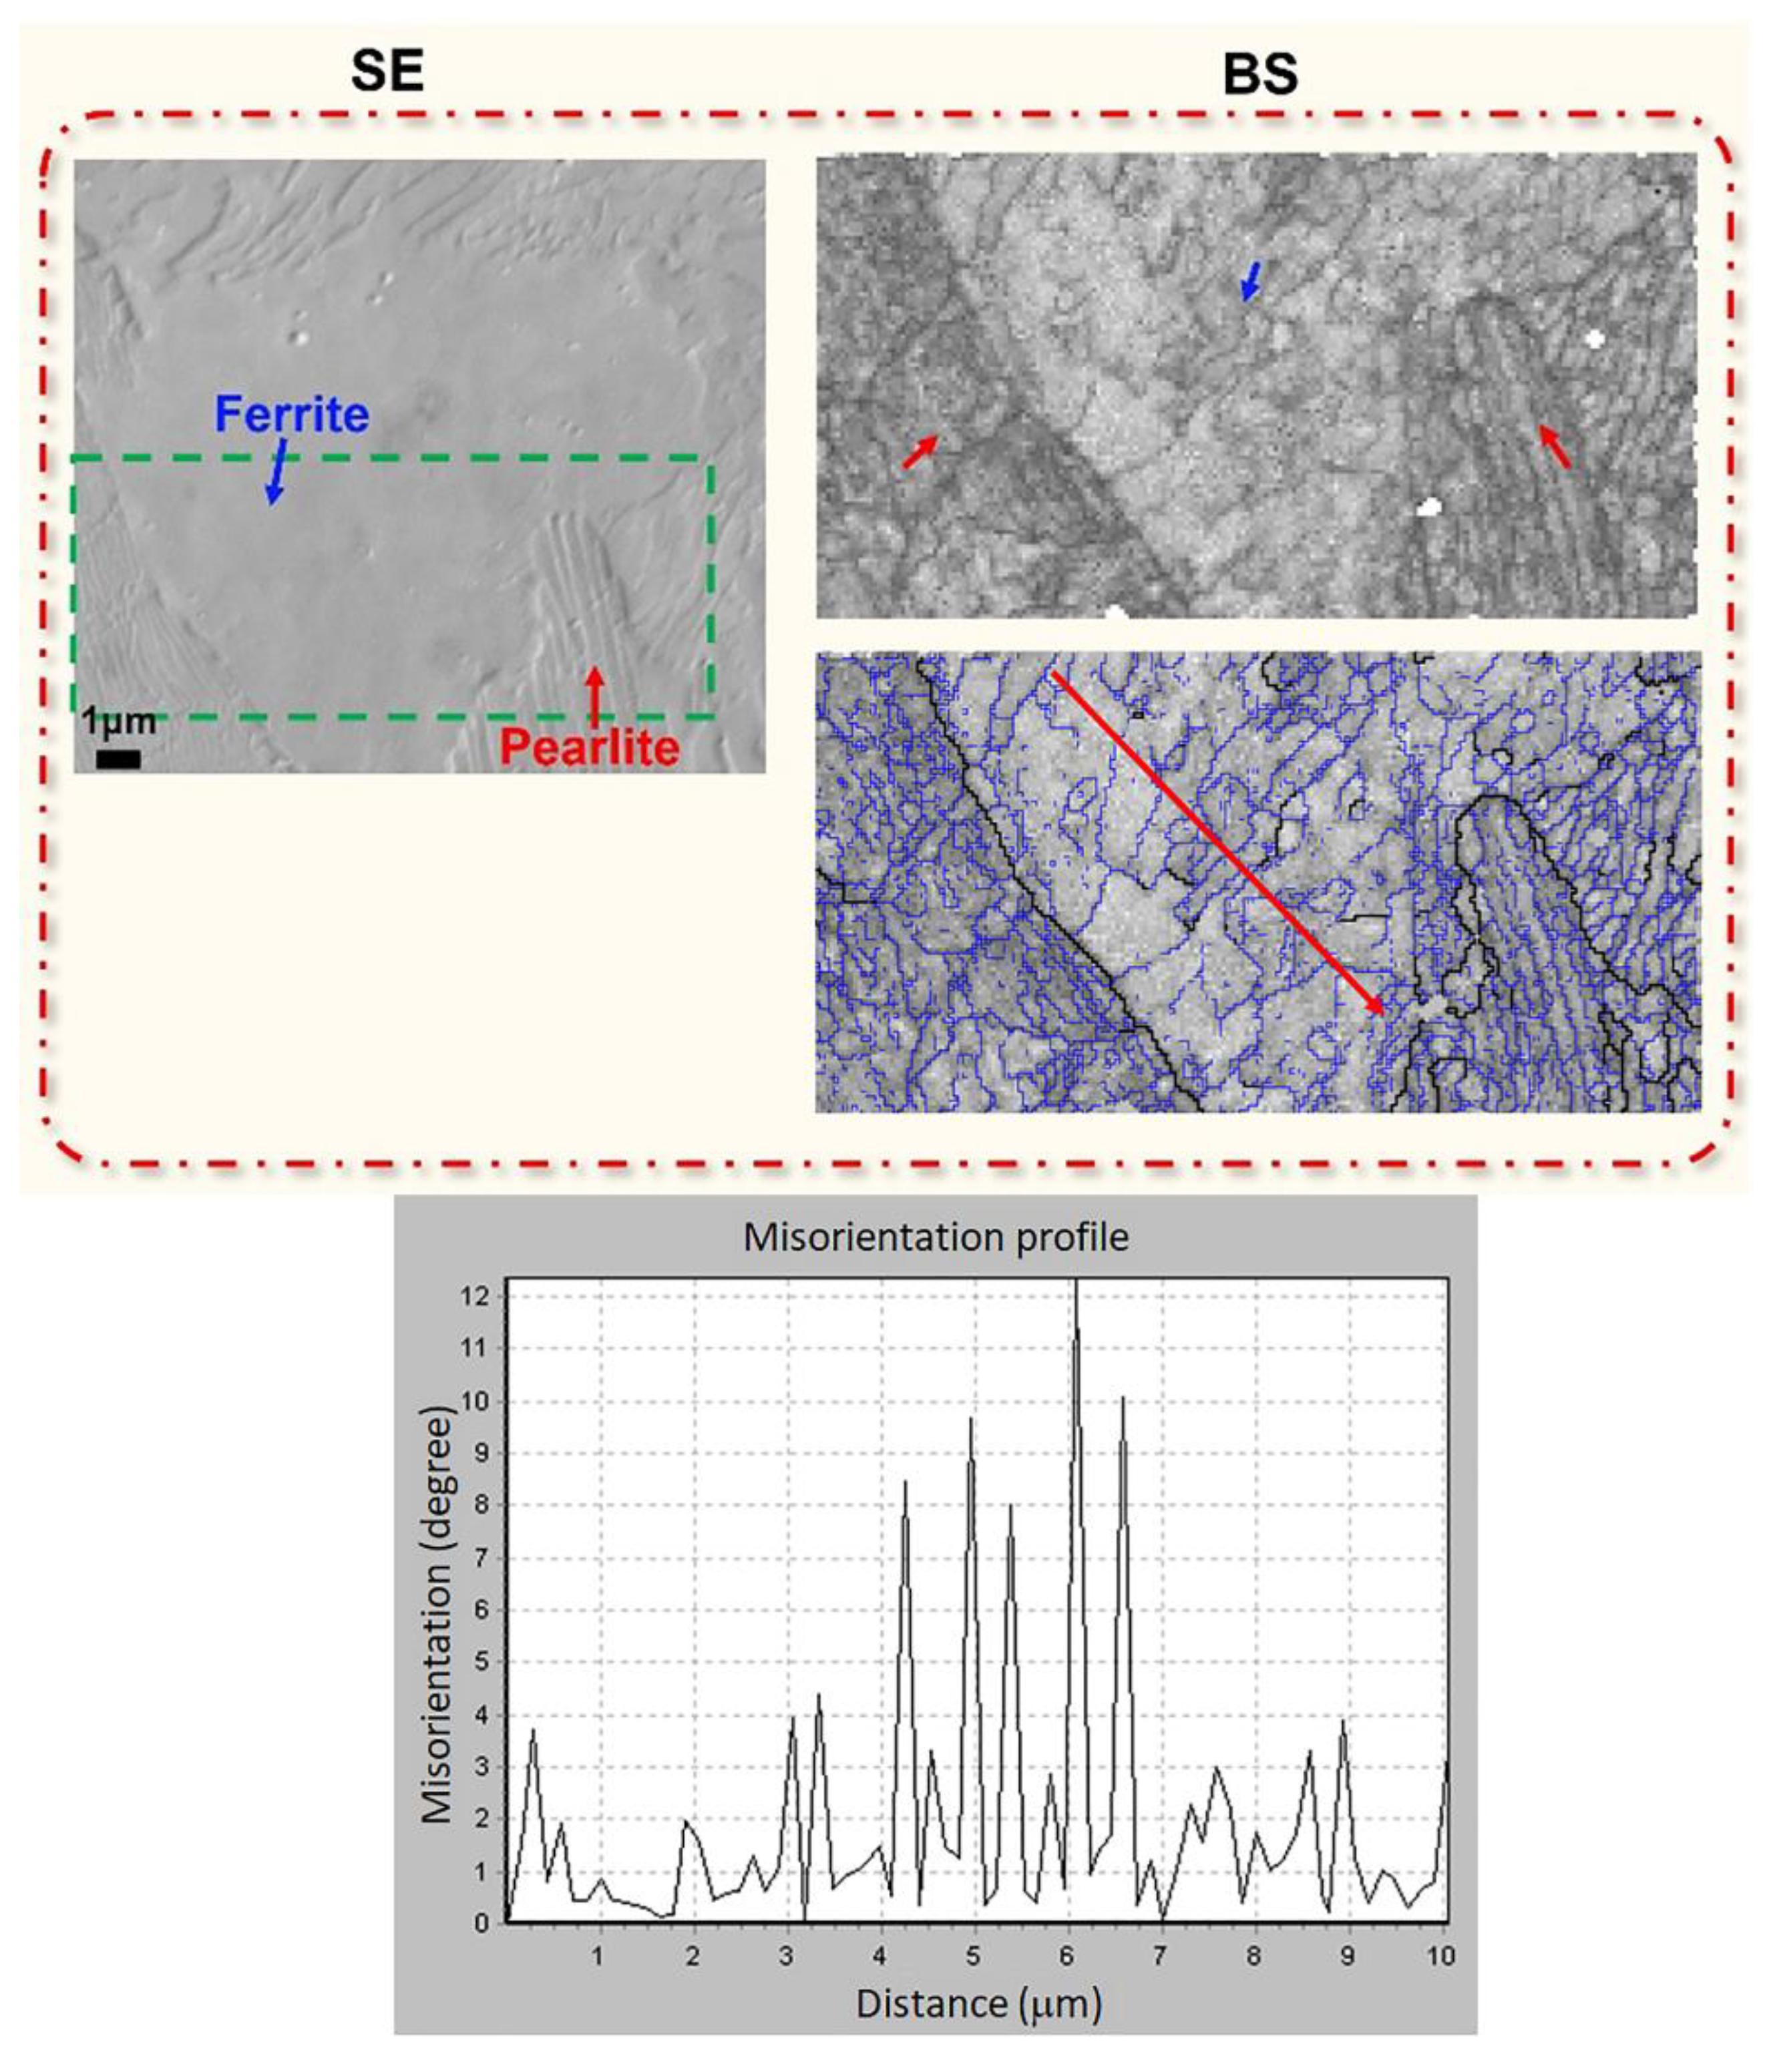
  • Subcracks propagate along local stress/strain concentrations, such as the kink band, shown by the orange arrow in the SEM SE map (Figure 2);
  • Corrosion may follow the pearlite lamellar direction, as shown by the blue arrow (Figure 2). This area cannot be indexed by EBSD, indicating that this was corroded. The cementite lamellae remain and there exists a curved interface between the corroded area and the non-corroded one in the pearlite colony. It is well-known that the existence of cementite is beneficial for the mechanical properties but harmful to corrosion resistance, as:
(i).
Cementite with a low hydrogen over-voltage would act as a cathodic site to promote the corrosion of the ferrite phase in an acidic solution [37];
(ii).
The area of exposed cementite increases with time and forms a porous layer causing a continuous acceleration in the ferrite dissolution rate [38,39,40];
(iii).
The alternating ferrite and cementite lamellae microstructure in the pearlite colony acts like a series of circuits; this causes simultaneous corrosion of several ferrite lamellae.
These in-field-failed screw microstructures are compared to those in the laboratory-fatigued samples. The microstructure within the sample fatigued at a constant stress of 391 MPa for 200,000 cycles consists of a large number of blurred dislocation boundaries (dark grey lines in Figure 4) with low misorientations, less than 2°. An increase in the stress up to 500 MPa for 5000 cycles does not significantly change the subgrain size or the boundary misorientation. Further increasing the stress to 600 MPa and fatiguing to failure for 8900 cycles still results in an average grain size of around 1 μm and dislocation boundary misorientations below 2°, as shown in Figure 5.
When the number of fatigue cycles is increased beyond ~10 thousand at medium stress loads, interesting results are observed. For example, in the specimen fatigued at a constant stress of 500 MPa, which fails at 69,000 cycles (see Figure 6), a large number of subgrains with clear boundaries (dark grey lines) and misorientation angles higher than 1° are observed in the ferrite grains. Some misorientations even reach 12° and the average spacing between neighboring dislocation boundaries is around 590 nm. These subgrain parameters are very similar to those observed close to the fracture surface in the field-failed specimen, which are: an average subgrain size of around 600 nm and misorientations ranging from 1° to 19°.
The difference between the two types of microstructures observed in the laboratory testing; one with blurred dislocation boundaries having low misorientations of less than 2° and an average spacing around 1 μm (in the specimens fatigued at 391 MPa for 200,000 cycles, 500 MPa for 5000 cycles and 600 MPa for 8900 cycles (failed)), and the other with clear dislocation boundaries having high misorientations, larger than 10°, and an average spacing of around 600 nm (in the specimens fatigued at 500 MPa for 69,000 cycles (failed)), may be related to the loading history and the occurrence of localized deformation, PSBs and crack initiation/propagation. As the first cycle of fatigue is loading, as in normal tensile testing, the first cycle can produce PSBs in some ferrite grains when the stress/strain level is high enough. For example, PSBs can be observed on the electro-polished surface when the stress reaches around 500 MPa (equivalent to the strain reaching ~2.5 %, see Figure 1). When the stress/strain is high enough, these PSBs with different depths of intrusions/extrusions will develop into cracks at the end of stage I. In the following stage, stage II, these cracks will propagate. Higher stress, and deeper intrusions, will result in a shorter fatigue life. It is suggested that the formation of the observed microstructures in the present study thus may be explained as follows:
  • When the stress amplitude is low, such as 391 MPa, which is the yield stress of the material, the loading will not produce PSBs in the microstructure. Therefore, no cracks are formed during the fatigue processes, even up to 200,000 cycles. The dislocation structures may slowly evolve and reorganize during the elastic fatigue process after the first cycle.
  • When the stress amplitude is high, such as 600 MPa at a tensile strain of around 5%, close to the ultimate tensile strength, the first cycle loading will produce PSBs with deep intrusions. The constant-stress fatigue processes afterward will initiate cracks at these PSBs. The fatigue process may, therefore, not continuously harden the matrix, as the cracks are large enough to propagate. As a result, the dislocation structures in the matrix do not evolve significantly after the first cycle and the boundary misorientations remain at a low level, below 1–2°.
  • When the stress amplitude is sufficiently high (around 500 MPa) to initiate PSBs but not large enough to initiate cracks (stage I) during the first cycle (confirmed by ex situ observations during fatigue [41]), dislocation structures will develop in the matrix and the misorientation across dislocation boundaries will increase continuously. Only later in the fatigue process will crack initiation at PSBs and crack propagation occur. This is suggested to be the reason why the dislocation cells in the specimen that fatigued at 500 MPa after 5000 cycles have similar microstructural characteristics as those in Figure 4 and Figure 5. Further, the dislocation cell size is further refined to an average size of 590 nm and the boundary misorientations increase to high values beyond 2° after cycling to beyond ten thousand cycles (Figure 6).
Based on the similarities of the microstructure developed close to the fracture surface in the field-failed sample and those formed in the samples that were fatigued and failed in the laboratory, it is suggested that the local stress level for the observed sleeper screw crack initiation and failures is around 500 MPa.
Knowing that the test samples in the laboratory failed at around 70,000 cycles (at 500 MPa), one may try to estimate what that would correspond to in the field. If we assume 30 trains (each with five carriages and four wheel sets for one carriage) pass the screws per day, this would correspond to a life time of 70,000/30/5/4 = 117 days. This is somewhat shorter than what is observed near Copenhagen Central Station, and as corrosion should be considered, an even shorter life time would, therefore, be expected. A reason for the difference, which we consider to be significant, may be that the laboratory tests were performed with the square cross-section sample shape (see Figure 1d), leading to stress concentration at the corners, which is not realistic for the field case. A further consideration is that the screws fastening rails to concrete sleepers are mounted via a dowel, and the interaction between the screw and dowel may further affect the crack propagation rate. Additional laboratory experiments simulating the field cases even closer would be very interesting to perform.

4. Summary

Three stress-amplitude low cycle fatigue experiments of the ASTM 1035 ferrite + pearlite steel are designed and performed in the constant stress amplitude mode, at a stress ratio of R = 0 and a testing frequency of 10 Hz, to evaluate the local stress level relevant for initiating sleeper screw failure. Based on the microstructural characterization of the spacing between and misorientation across dislocation boundaries, the following conclusions are reached:
  • The local stress level for in-field-fatigue failures can be evaluated based on well-designed laboratory fatigue tests and the characterization of microstructural parameters.
  • The stress amplitude plays a key role in the development of local persistent slip bands, in crack formation and propagation, and in the development of dislocation structures in the low cycle fatigue:
    (i)
    When the stress amplitude is low, a dislocation structure will develop during the first cycle loading and reorganize slightly during the following elastic fatigue processes;
    (ii)
    When the stress amplitude is high enough to initiate PSBs, the strain localization at PSBs leads to the initiation of cracks. Simultaneously, subgrains form and develop;
    (iii)
    When the stress amplitude is very high, lots of cracks form (i.e., stage II is reached after a few cycles), while the subgrain structure remains largely stable;
  • Based on the laboratory experiments, it is not surprising that the screws near the Copenhagen Central Station in Denmark fail so soon.

Author Contributions

Conceptualization, X.Z.; resources, D.J.J. and X.Z.; experiments, K.L. and L.Z.; writing—review & editing, K.L., D.J.J. and X.Z.; supervision, X.Z.; funding acquisition, D.J.J. and X.Z. All authors have read and agreed to the published version of the manuscript.

Funding

Villum Experiment grant (00028216) from VILLUM FONDEN support L. Zhou and X. Zhang. European Research Council under the European Union Horizon 2020 research and innovation program (grant agreement No. 788567-M4D) support D. Juul Jensen.

Data Availability Statement

Data supporting the present reported results will be provided on request.

Acknowledgments

We wish to thank Railnet Denmark for introducing us to this problem and providing failed sleeper screws, and Wenkang Wang for his contributions to the fatigue experiments. Part of this research was conducted using mechanical testing equipment from DTU Center for Advanced Structural and Material Testing (CASMAT), Grant N. VKR023193 from Villum Fonden.

Conflicts of Interest

The authors declare no conflict of interest in the representation and/or interpretation of these reported research results.

References

  1. Brown, L.M. Dislocation substructures and the initiation of cracks by fatigue. Met. Sci. 1977, 11, 315–320. [Google Scholar] [CrossRef]
  2. Mughrabi, H.; Herz, K.; Stark, X. The effect of strain-rate on the cyclic deformation properties of a-iron single crystals. Acta Metall. 1976, 24, 659–668. [Google Scholar] [CrossRef]
  3. Sangid, M.D. The physics of fatigue crack initiation. Int. J. Fatigue 2013, 57, 58–72. [Google Scholar] [CrossRef]
  4. Mallipeddi, D.; Norell, M.; Naidu, V.M.S.; Zhang, X.; Näslund, M.; Nyborg, L. Micropitting and microstructural evolution during gear testing-from initial cycles to failure. Tribol. Int. 2021, 156, 106820. [Google Scholar] [CrossRef]
  5. Cao, Z.; Shi, Z.; Liang, B.; Zhang, X.; Cao, W.; Weng, Y. Melting route effects on the rotatory bending fatigue and rolling contact fatigue properties of high carbon bearing steel SAE52100. Int. J. Fatigue 2020, 140, 105854. [Google Scholar] [CrossRef]
  6. Shi, Z.; Li, J.; Zhang, X.; Shang, C.; Cao, W. Influence Mechanisms of Inclusion Types on Rotating Bending Fatigue Properties of SAE52100 Bearing Steel. Materials 2022, 15, 5037. [Google Scholar] [CrossRef]
  7. Shi, Z.; Wang, H.; Gao, Y.; Wang, Y.; Yu, F.; Xu, H.; Zhang, X.; Shang, C.; Cao, W. Improve fatigue and mechanical properties of high carbon bearing steel by a new double vacuum melting route. Fatigue Fract. Eng. Mater. Struct. 2022, 45, 1995–2009. [Google Scholar] [CrossRef]
  8. Shi, Z.; Xu, H.; Wang, C.; Liang, J.; Shang, C.; Zhang, X.; Godfrey, A.; Cao, W. Crack initiation induced by twin-martensite and inclusion in rotatory bending fatigue of a high nitrogen martensite bearing steel. Mater. Sci. Eng. A 2022, 861, 144402. [Google Scholar] [CrossRef]
  9. Galeazzi, R.; Danielsen, H.K.; Ersbøll, B.K.; Juul Jensen, D.; Santos, I. Intelligent Quality Assessment of Railway Switches and Crossings; Springer: Cham, Switzerland, 2021. [Google Scholar]
  10. Zhang, X.; Zhang, Y.; Rasmussen, C.J.; Lange, M.T.; Juul Jensen, D. Analysis of Sleeper Screw Failures. In Intelligent Quality Assessment of Railway Switches and Crossings; Springer: Cham, Switzerland, 2021; pp. 93–105. [Google Scholar]
  11. Zhang, X.; Nielsen, C.V.; Hansen, N.; Silva, C.M.A.; Martins, P.A.F. Local stress and strain in heterogeneously deformed aluminum: A comparison analysis by microhardness, electron microscopy and finite element modelling. Int. J. Plast. 2019, 115, 93–110. [Google Scholar] [CrossRef]
  12. Hughes, D.A.; Dawson, D.B.; Korellis, J.S.; Weingarten, L.I. A microstructurally based method for stress estimates. Wear 1995, 181-183, 458–468. [Google Scholar] [CrossRef]
  13. Zhang, X.; Hansen, N.; Gao, Y.; Huang, X. Hall–Petch and dislocation strengthening in graded nanostructured steel. Acta Mater. 2012, 60, 5933–5943. [Google Scholar] [CrossRef] [Green Version]
  14. Zhang, X.; Hansen, N.; Nielsen, C.V. Local microstructure and flow stress in deformed metals. IOP Conf. Ser. Mater. Sci. Eng. 2017, 219, 012053. [Google Scholar] [CrossRef] [Green Version]
  15. Nikas, D.; Zhang, X.; Ahlström, J. Evaluation of local strength via microstructural quantification in a pearlitic rail steel deformed by simultaneous compression and torsion. Mater. Sci. Eng. A 2018, 737, 341–347. [Google Scholar] [CrossRef]
  16. Ahlström, J.; Zhang, X. Effect of strain gradient on the microstructure and mechanical properties of pearlitic steel. IOP Conf. Ser. Mater. Sci. Eng. 2019, 580, 012027. [Google Scholar] [CrossRef] [Green Version]
  17. Ostash, O.P.; Kulyk, V.V.; Poznyakov, V.D.; Haivorons’kyi, O.A.; Markashova, L.I.; Vira, V.V.; Duriagina, Z.A.; Tepla, T.L. Fatigue crack growth resistance of welded joints simulating the weld-repaired railway wheels metal. Arch. Mater. Sci. Eng. 2017, 86, 49–55. [Google Scholar] [CrossRef]
  18. Feng, H.; Wang, L.; Cui, S.; Hansen, N.; Fang, F.; Zhang, X. Microstructure and Strengthening Mechanisms of Nanolamellar Structures in Ultrastrong Drawn Iron Wires. Scr. Mater. 2021, 200, 113906. [Google Scholar] [CrossRef]
  19. Zhou, L.; Fang, F.; Kumagai, M.; Pickering, E.; Zhang, X. A modified pearlite microstructure to overcome the strength-plasticity trade-off of heavily drawn pearlitic wire. Scr. Mater. 2022, 206, 114236. [Google Scholar] [CrossRef]
  20. Bai, J.; Xu, H.; Chen, X.; Cao, W.; Zhang, X.; Xu, Y. Effect of tempering temperature on the wear behaviour of martensitic ductile iron. Mater. Sci. Technol. 2023, 39, 744–755. [Google Scholar] [CrossRef]
  21. Robertson, I.M.; Schuh, C.A.; Vetrano, J.S.; Browning, N.D.; Field, D.P.; Juul Jensen, D.; Miller, M.K.; Baker, I.; Dumand, D.C.; Dunin-Borkowski, R.; et al. Towards an integrated materials characterization toolbox. J. Mater. Res. 2011, 26, 1341–1383. [Google Scholar] [CrossRef]
  22. Zhang, X.; Liu, W.; Godfrey, A.; Liu, Q. The effect of long-time austenization on the wear resistance and thermal fatigue properties of a High Speed Steel roll. Metall. Mater. Trans. A 2009, 40, 2171–2177. [Google Scholar] [CrossRef]
  23. Chen, S.; Hu, J.; Zhang, X.; Dong, H.; Cao, W. High Ductility and Toughness of a Micro-duplex Medium-Mn Steel in a Large Temperature Range from −196 °C to 200 °C. J. Iron Steel Res. Int. 2015, 22, 1126–1130. [Google Scholar] [CrossRef]
  24. Feng, H.; Cai, L.; Wang, L.; Zhang, X.; Fang, F. Microstructure and strength in ultrastrong cold-drawn medium carbon steel. J. Mater. Sci. Technol. 2022, 97, 89–100. [Google Scholar] [CrossRef]
  25. Bai, J.; Xu, H.; Wang, Y.; Chen, X.; Zhang, X.; Cao, W.; Xu, Y. Microstructures and Mechanical Properties of Ductile Cast Iron with Different Crystallizer Inner Diameters. Crystals 2022, 12, 413. [Google Scholar] [CrossRef]
  26. Xiong, J.C.; Li, H.; Kong, L.; Zhang, X.; Cao, W.Q.; Wang, Y.H. Dependence of Charpy Impact Properties of Fe-30Mn-0.05C Steel on Microstructure. Crystals 2023, 13, 353. [Google Scholar] [CrossRef]
  27. Ye, D.; Wang, Z. Change characteristics of static mechanical property parameters and dislocation structures of 45 medium carbon structural steel during fatigue failure process. Mater. Sci. Eng. A 2001, 297, 54–61. [Google Scholar]
  28. ISO 6892-1; Metallic Materials—Tensile Testing—Part 1: Method of Test at Room Temperature. International Standard: Geneva, Switzerland, 2009.
  29. Wright, S.I.; Nowell, M.M. EBSD image quality mapping. Microsc. Microanal. 2002, 12, 72–84. [Google Scholar] [CrossRef]
  30. Sun, C.; Song, Q.; Zhou, L.; Liu, J.; Wang, Y.; Wu, X.; Wei, Y. The formation of discontinuous gradient regimes during crack initiation in high strength steels under very high cycle fatigue. Int. J. Fatigue 2019, 124, 483–492. [Google Scholar] [CrossRef] [Green Version]
  31. Zhang, X.; Hansen, N.; Godfrey, A.; Huang, X. Structure and strength of sub-100 nm lamellar structures in cold-drawn pearlitic steel wire. Mater. Sci. Technol. 2018, 34, 794–808. [Google Scholar] [CrossRef] [Green Version]
  32. Zhang, X.; Godfrey, A.; Huang, X.; Hansen, N.; Liu, W.; Liu, Q. Characterization of the microstructure in drawn pearlitic steel wires. In Proceedings of the 30th Risø International Symposium on Materials Science: Nanostructured Metals—Fundamentals to Applications, Roskilde, Denmark, 7–11 September 2009; pp. 409–416. [Google Scholar]
  33. Zhang, X.; Hansen, N.; Godfrey, A.; Huang, X. Hirarchical structures and strength in cold-drawn pearlitic steel wire. In Proceedings of the 35th Risø International Symposium on Materials Science: Nanostructured Metals—New Frontiers of Nanometals, Roskilde, Denmark, 1–5 September 2014; pp. 153–170. [Google Scholar]
  34. Zhang, X.; Godfrey, A.; Hansen, N.; Huang, X. Hierarchical structures in cold-drawn pearlitic steel wire. Acta Mater. 2013, 61, 4898–4909. [Google Scholar] [CrossRef] [Green Version]
  35. Zhang, X.; Hansen, N.; Godfrey, A.; Huang, X. Dislocation-based plasticity and strengthening mechanisms in sub-20 nm lamellar structures in pearlitic steel wire. Acta Mater. 2016, 114, 176–183. [Google Scholar] [CrossRef] [Green Version]
  36. Zhang, X. Exploring high strength metallic materials: A lesson from pearlitic steel wire. IOP Conf. Ser. Mater. Sci. Eng. 2019, 580, 012058. [Google Scholar] [CrossRef]
  37. Staicopolus, D.N. The rate of cementite in the acidic corrosion of steel. J. Electrochem. Soc. 1963, 110, 1121–1124. [Google Scholar] [CrossRef]
  38. Mora-Mendoza, J.L.; Turgoose, S. Fe3C influence on the corrosion rate of mild steel in aqueous CO2 systems under turbulent flow conditions. Corros. Sci. 2002, 44, 1223–1246. [Google Scholar] [CrossRef]
  39. Ochoa, N.; Vega, C.; Pébère, N.; Lacaze, J.; Brito, J.L. CO2 corrosion resistance of carbon steel in relation with microstructure changes. Mater. Chem. Phys. 2015, 156, 198–205. [Google Scholar] [CrossRef] [Green Version]
  40. Hao, X.; Dong, J.; Etim, I.I.N.; Wei, J.; Ke, W. Sustained effect of remaining cementite on the corrosion behavior of ferrite-pearlite steel under the simulated bottom plate environment of cargo oil tank. Corros. Sci. 2016, 110, 296–304. [Google Scholar] [CrossRef]
  41. Lin, K. Crack Initiation and Propagation in Ferrite-Pearlite Dual-Phase Steel during Fatigue and Corrosion Fatigue Processes; Technical University of Denmark: Kgs. Lyngby, Denmark, 2022. [Google Scholar]
Figure 1. The ferrite-pearlite dual-phase microstructure, the stress-strain curve of the sleeper screw steel and tensile sample: (a) optical micrograph; (b) tensile stress-strain curve; (c) an amplified section from (b); (d) sketch of the flat dog-bone sample shape used for the tensile and fatigue testing.
Crystals 13 00656 g001
Figure 2. OM micrograph (top) to show the fracture surface while SEM secondary electron (SE) and EBSD BS maps show the same sub-surface area in the cross-section. The dark-grey area in the BS map represents the un-indexed zone due to oxidation and cracks.
Crystals 13 00656 g002
Figure 3. (a) An enlargement of the area in the red box of Figure 2, the black lines show dislocation boundaries with misorientation angles of θ > 15° and the blue lines show low angle boundaries with misorientation angles of 2° < θ < 15° within the two ferrite grains. (b) Shows the misorientation profiles between neighboring points along the two arrows in the ferrite grains in (a). Please note that cementite lamellae are seen as dark grey lines because they cannot be indexed because they are very thin, only several tens of nanometers. Part of the structure with two ferrite and three cementite lamellae in the light blue box is sketched and enlarged with dashed lines in ferrite lamellae, representing dislocation boundaries.
Crystals 13 00656 g003
Figure 4. SE and BS maps showing the microstructure within the gauge length section of the sample fatigued at 391 MPa for 200,000 cycles. The EBSD mapping is taken from the area shown by the green dashed square area in the SE map. The blue arrows show the ferrite region, while the red arrows show pearlite areas. The two BS maps are identical. Only different coloring schemes are used. The top picture uses band slope coloring, whereas in the lower one, black lines show dislocation boundaries with misorientation angles of θ > 15°, yellow lines show dislocation boundaries with misorientation angles in the range of 0.7° < θ < 2° and blue lines show dislocation boundaries with misorientation angles of 2° < θ < 15°.
Crystals 13 00656 g004
Figure 5. SE and BS maps showing the microstructure within the gauge length section of the sample. Fatigued at 600 MPa for 8900 cycles. The EBSD mapping is taken from the area shown by the green dashed square area in the SE map. The blue arrows show the ferrite region, while the red arrows show pearlite areas. The two BS maps are identical. Only different coloring schemes are used. The top picture uses the band slope coloring, whereas, in the lower one, black lines show dislocation boundaries with misorientation angles of θ > 15°, yellow lines show dislocation boundaries with misorientation angles in the range of 0.7° < θ < 2° and blue lines show dislocation boundaries with misorientation angles of 2° < θ < 15°.
Crystals 13 00656 g005
Figure 6. SE and BS maps showing the microstructure within the gauge length section of the sample fatigued at 500 MPa for 69,000 cycles. The EBSD mapping is taken from the area shown by the green dashed square area in the SE map. The blue arrows show the ferrite region, while the red arrows show pearlite areas. The two BS maps are identical, only different coloring schemes are used. The top picture uses the band slope coloring, whereas, in the lower one, black lines show dislocation boundaries with misorientation angles of θ > 15°, yellow lines show dislocation boundaries with misorientation angles in the range of 0.7° < θ < 2° and blue lines show dislocation boundaries with misorientation angles of 2° < θ < 15°. The misorientation profile between neighboring points shows misorientations of dislocation boundaries along the red arrow in the ferrite grain.
Crystals 13 00656 g006
Disclaimer/Publisher’s Note: The statements, opinions and data contained in all publications are solely those of the individual author(s) and contributor(s) and not of MDPI and/or the editor(s). MDPI and/or the editor(s) disclaim responsibility for any injury to people or property resulting from any ideas, methods, instructions or products referred to in the content.

