Article

Geometrically Necessary Dislocation Analysis of Deformation Mechanism for Magnesium under Fatigue Loading at 0 °C

School of Mechanical and Materials Engineering, Washington State University, Pullman, WA 99164, USA
Crystals 2023, 13(3), 490; https://doi.org/10.3390/cryst13030490
Submission received: 16 February 2023 / Revised: 7 March 2023 / Accepted: 10 March 2023 / Published: 12 March 2023

Abstract

:
This study focused on the analysis of geometrically necessary dislocation (GND) densities for five selected fine-grained magnesium samples. Among the samples, three were tested under different fatigue-loading conditions at 0 °C, one experienced quasi-static tensile loading at 0 °C, and one represented the as-rolled state. The fatigue-tested samples were chosen according to the relationship between the maximum loading stress of a test and the material’s yield strength. This study provides new insights on the deformation mechanism of fine-grained magnesium at 0 °C. It is observed that the average GND densities were increased by 95~111% for the tested samples when compared with the as-rolled sample. It is especially interesting that there is a significant increase in the average GND density for the sample that experienced the fatigue loading with a low-maximum applied stress, and the maximum applied stress was lower than the material’s yield strength. This observation implies that the grain boundary mediated the dislocation-emission mechanism.

1. Introduction

Grain refinement [1,2] is widely used to improve the mechanical properties of various metals and alloys such as aluminum and its alloys [3,4], titanium and its alloys [5], magnesium and its alloys [6,7,8], copper alloys [9], and steels [10]. Fine-grained metallic materials have often been achieved through different types of severe plastic-deformation-processing techniques including rolling, extrusion, equal-channel angular pressing, high-pressure torsion, friction-stir processing, and drawing [7,8,11,12,13]. Taking pure magnesium as an example, it has been reported that coarse-grained magnesium yielded at about 44 MPa [13], and fine-grained magnesium had a yield strength of about 98 MPa at room temperature, according to [14], leading to a significant improvement of about 123%.
It is well accepted that dislocation activities often play a critical role in the mechanical behavior of a broad range of materials such as composites [15,16], graded materials [17], and metals and alloys [18,19]. In addition to the importance of dislocation mechanisms during quasi-static testing, deformation mechanisms during high-strain-rate testing are also often controlled by dislocation behaviors [20,21,22,23]. With the refinement of grains, the specific grain-boundary-volume fraction increases, and there are more atoms located around grain boundaries. A natural expectation is that grain boundaries would become more actively involved during the deformation of fine-grained materials than their coarse-grained counterparts, and grain-boundary-assisted deformation mechanisms should become more critical for the materials with nanosized grains or fine grains.
For nanostructured metallic materials, there are a variety of grain-boundary-related mechanisms such as grain-boundary sliding [4,24], grain-boundary migration [25,26], grain-boundary atomic shuffling [27], free-volume migration [28], and grain rotation [29] that have been proposed and investigated to understand the deformation behaviors. In addition, these mechanisms are usually coupled among each other during the deformation of materials. Hasnaoui et al. observed cooperative plastic deformation activity between different grains in a nanocrystalline nickel sample through the large-scale molecular dynamic modeling of a sample with 125 grains and a 5 nm average grain size [28]. Liu et al. studied the cooperative grain growth by grain-boundary migration and nanograin rotation through the modeling of an elastically isotropic two-dimensional nanograined face-centered cubic microstructure [29]. Most reported studies focused on body-centered cubic and face-centered cubic nanocrystalline metals, and there is still a need to explore the grain-boundary-mediated deformation mechanisms in magnesium with a hexagonal close-packed structure. Furthermore, most existing articles have focused on the room-temperature mechanical behaviors of magnesium. With the motivation to expand the practical applications of magnesium in the transportation industries, it is necessary to explore the material’s behavior at the environmental service temperatures. During the winter season, many states in the USA have an average environmental temperature of about 0 °C. For example, the average winter temperatures are −0.1 °C for Kansas, 0.2 °C for Missouri, 0.1 °C for Nevada, 0.6 °C for New Jersey, −0.3 °C for Rhode Island, 0.6 °C for Washington, and 0.4 °C for West Virginia [30]. Thus, fine-grained magnesium samples were investigated here through a GND analysis to obtain insights on the grain-boundary-mediated plastic deformation mechanism under mechanical loading at the testing temperature of 0 °C.

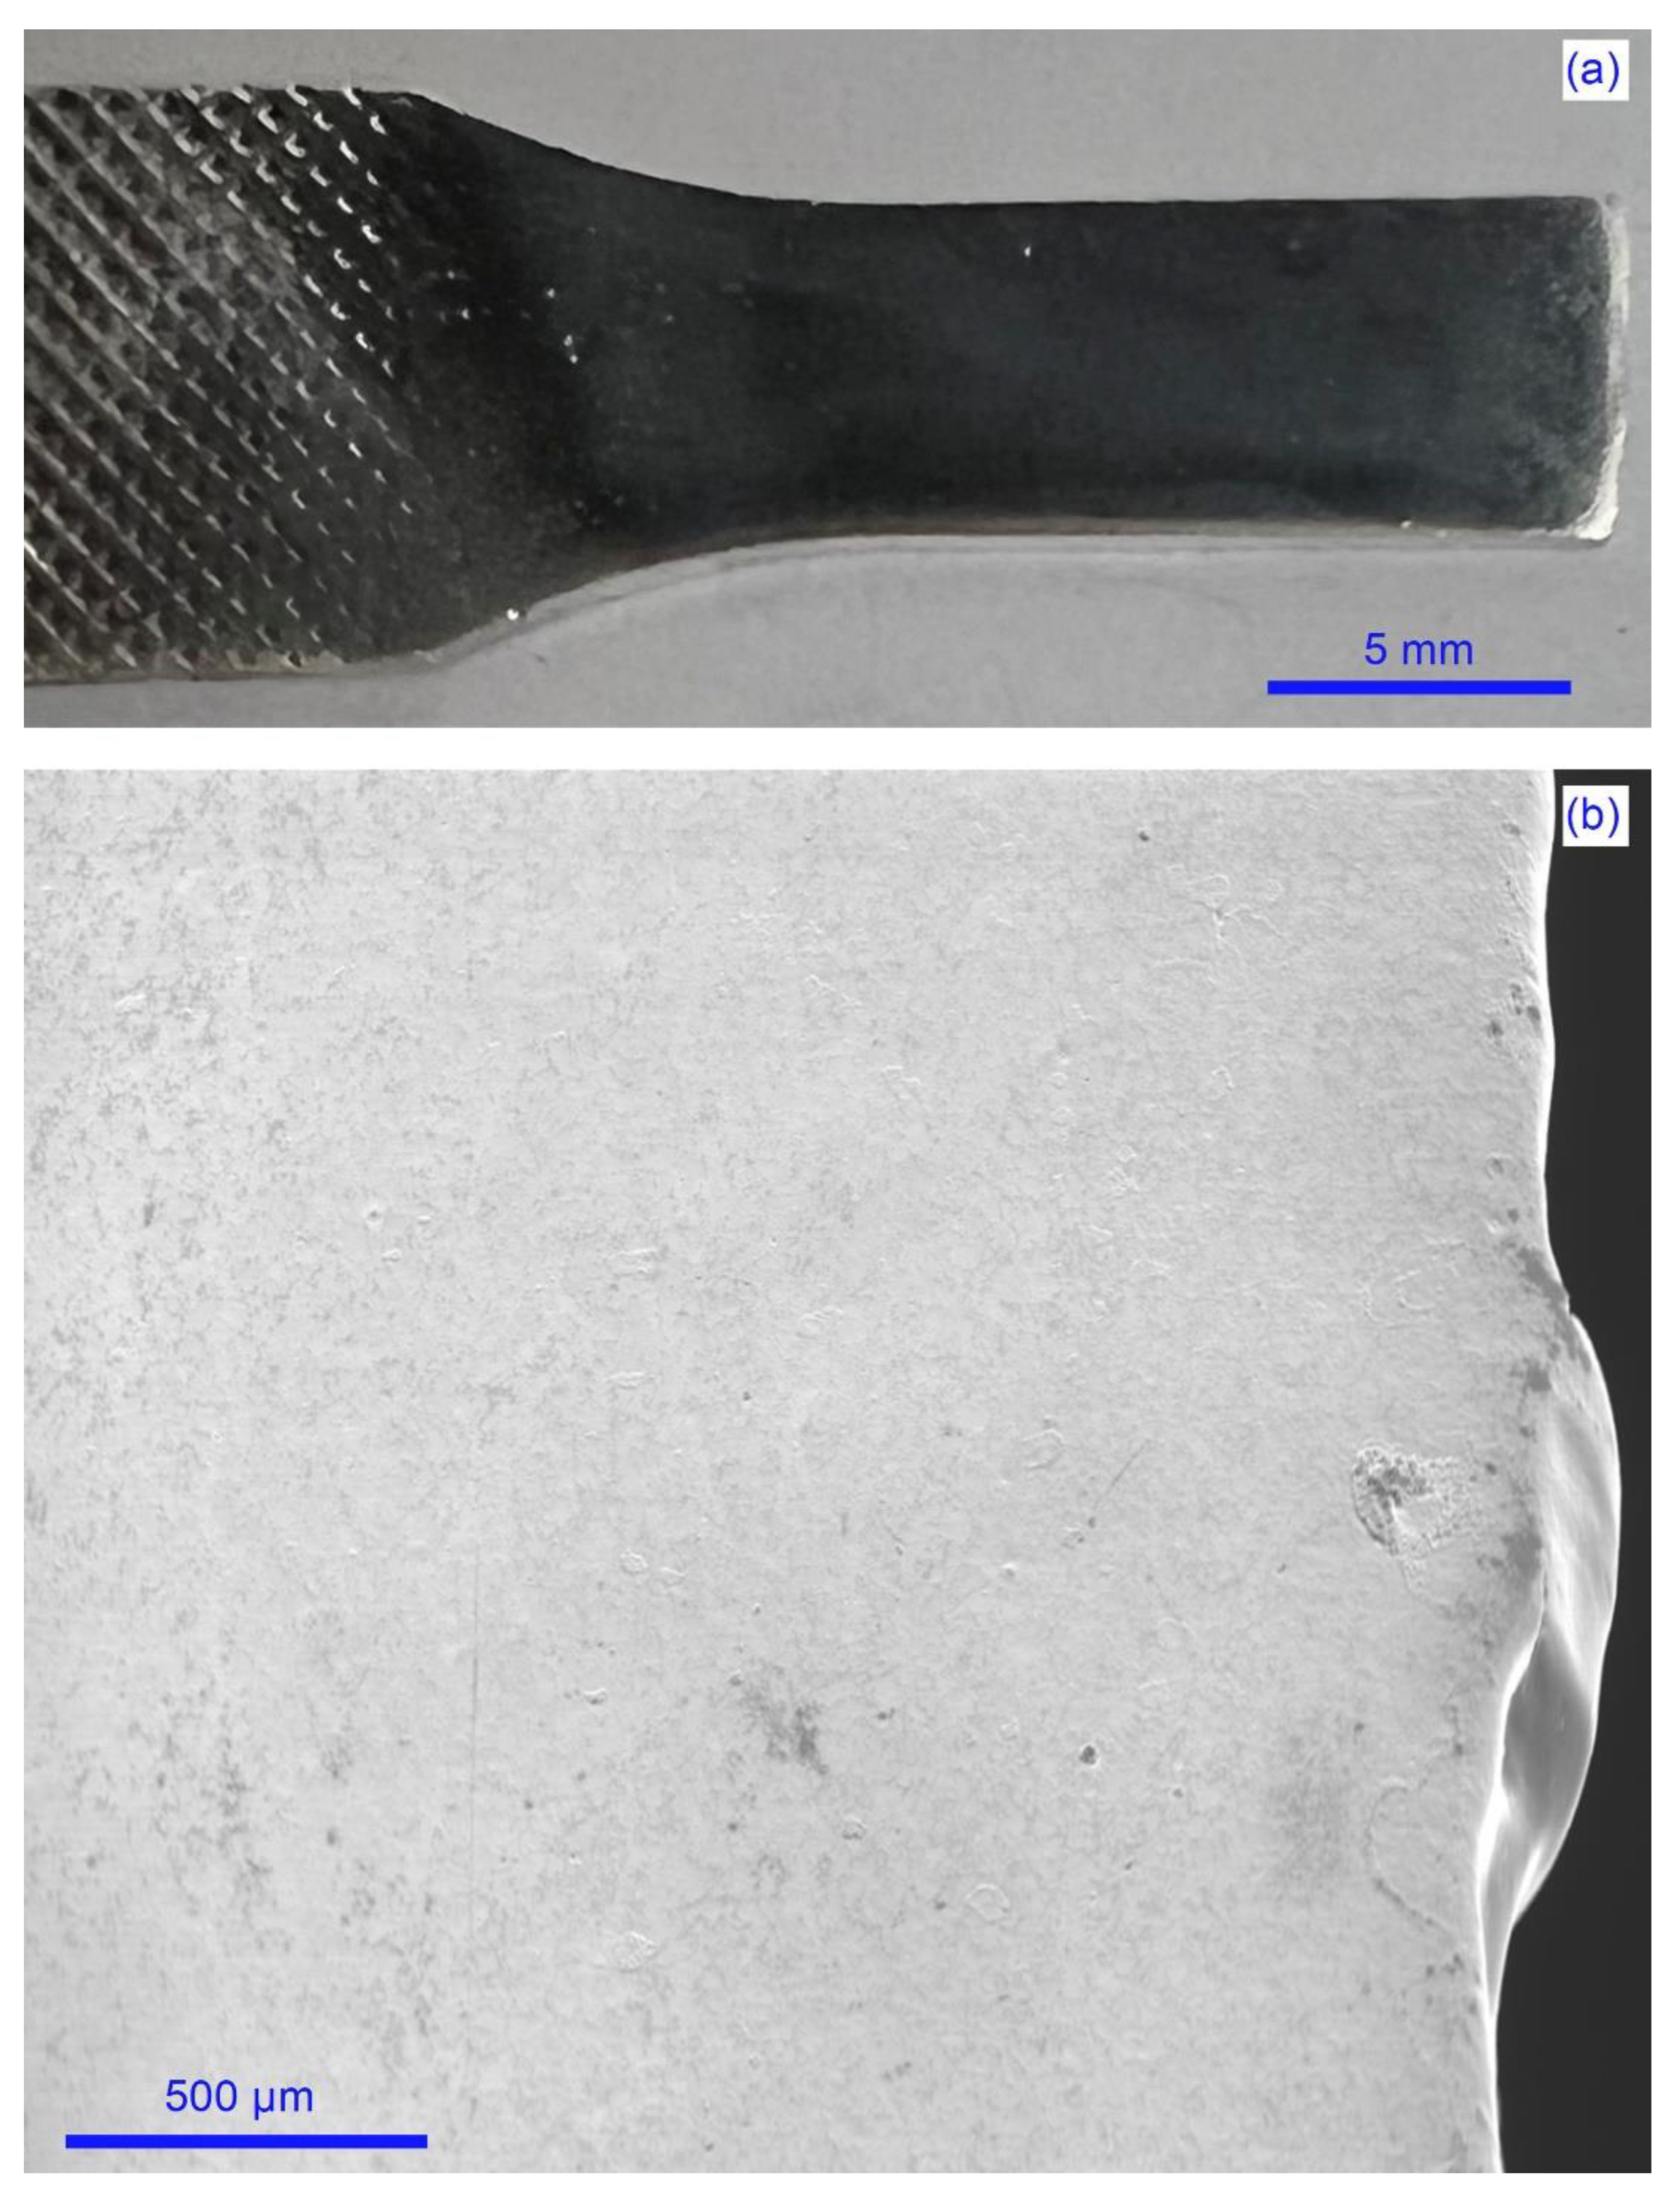
2. Materials and Experiments

Fine-grained magnesium samples with an average grain size of about 6 μm were prepared and then tested at 0 °C using an Instron servohydraulic universal testing machine under tension–tension-fatigue-loading conditions [31]. The sample’s chemical composition was ~99.93% magnesium, 0.005% cobalt, <0.005% aluminum, <0.005% copper, 0.03% silicon, <0.001% iron, 0.024% manganese, <0.001% Pd, 0.001% zinc, and <0.001% nickel. The fine-grained structure was obtained through multipass rolling at 200 °C [14,21]. Before the rolling process, a magnesium plate ~8 mm thick was heated at 400 °C for 3 h. The plate was then heated at 200 °C and rolled at about a 5% reduction strain for each rolling pass until reaching the final thickness of ~1 mm. The 1 mm-thick-rolled magnesium sheets were machined to obtain the specimens for quasi-static tensile testing and fatigue testing. The specimens have a gage thickness of about 1 mm, a gage width of about 6 mm, and a gage length of about 15 mm. For the quasi-static tensile testing, the ASTM B557 standard was used and the testing was performed under a strain rate of 10−3 s−1 at 0 °C. For the fatigue testing, the ASTM E466 standard was employed, the loading frequency was 20 Hz, and the testing was under tension–tension cyclic loading at 0 °C. The quasi-static tensile testing of the studied material indicated that the yield strength σy and the ultimate tensile strength σUTS were about 105 MPa and 193 MPa, respectively, at 0 °C [21]. This study focused on analyzing the geometrically necessary dislocations of some selected tested samples. The sample selection criterion for the analysis was to include the full range of maximum stresses applied, σmax, for a fatigue-loading cycle. Specifically, one sample designated as Fatigue-L was tested with the σmax < σy, the second sample designated as Fatigue-M was tested with the σma ≈ σy, and the third sample designated as Fatigue-H was tested with the σmax > σy. For comparison, the investigation was also performed for the as-rolled sample, and the sample experienced quasi-static tensile testing. The utilized σmax was 92 MPa, 111 MPa, and 149 MPa for the Fatigue-L, Fatigue-M, and Fatigue-H samples, respectively. Electron backscatter diffraction (EBSD) was employed to characterize the selected samples, and the GND data were extracted and analyzed to explore the deformation mechanism for the fine-grained magnesium samples mechanically tested at 0 °C. The selected samples were sequentially grounded using sandpaper of P120 grit, P240 grit, P600 grit, P1000 grit, P1500 grit, and P2500 grit, then mechanically polished using 1 µm alumina slurry and 0.05 µm alumina slurry, and lastly electropolished. The OIM Analysis version 8 was utilized for EBSD analysis and GND analysis, and a threshold angle of 5° was used for obtaining the GND density maps. Figure 1 shows the macroscopic image and the morphology of the samples studied under scanningelectron microscope (SEM). The top surface of the samples as shown in Figure 1a was investigated.

3. Results and Discussion

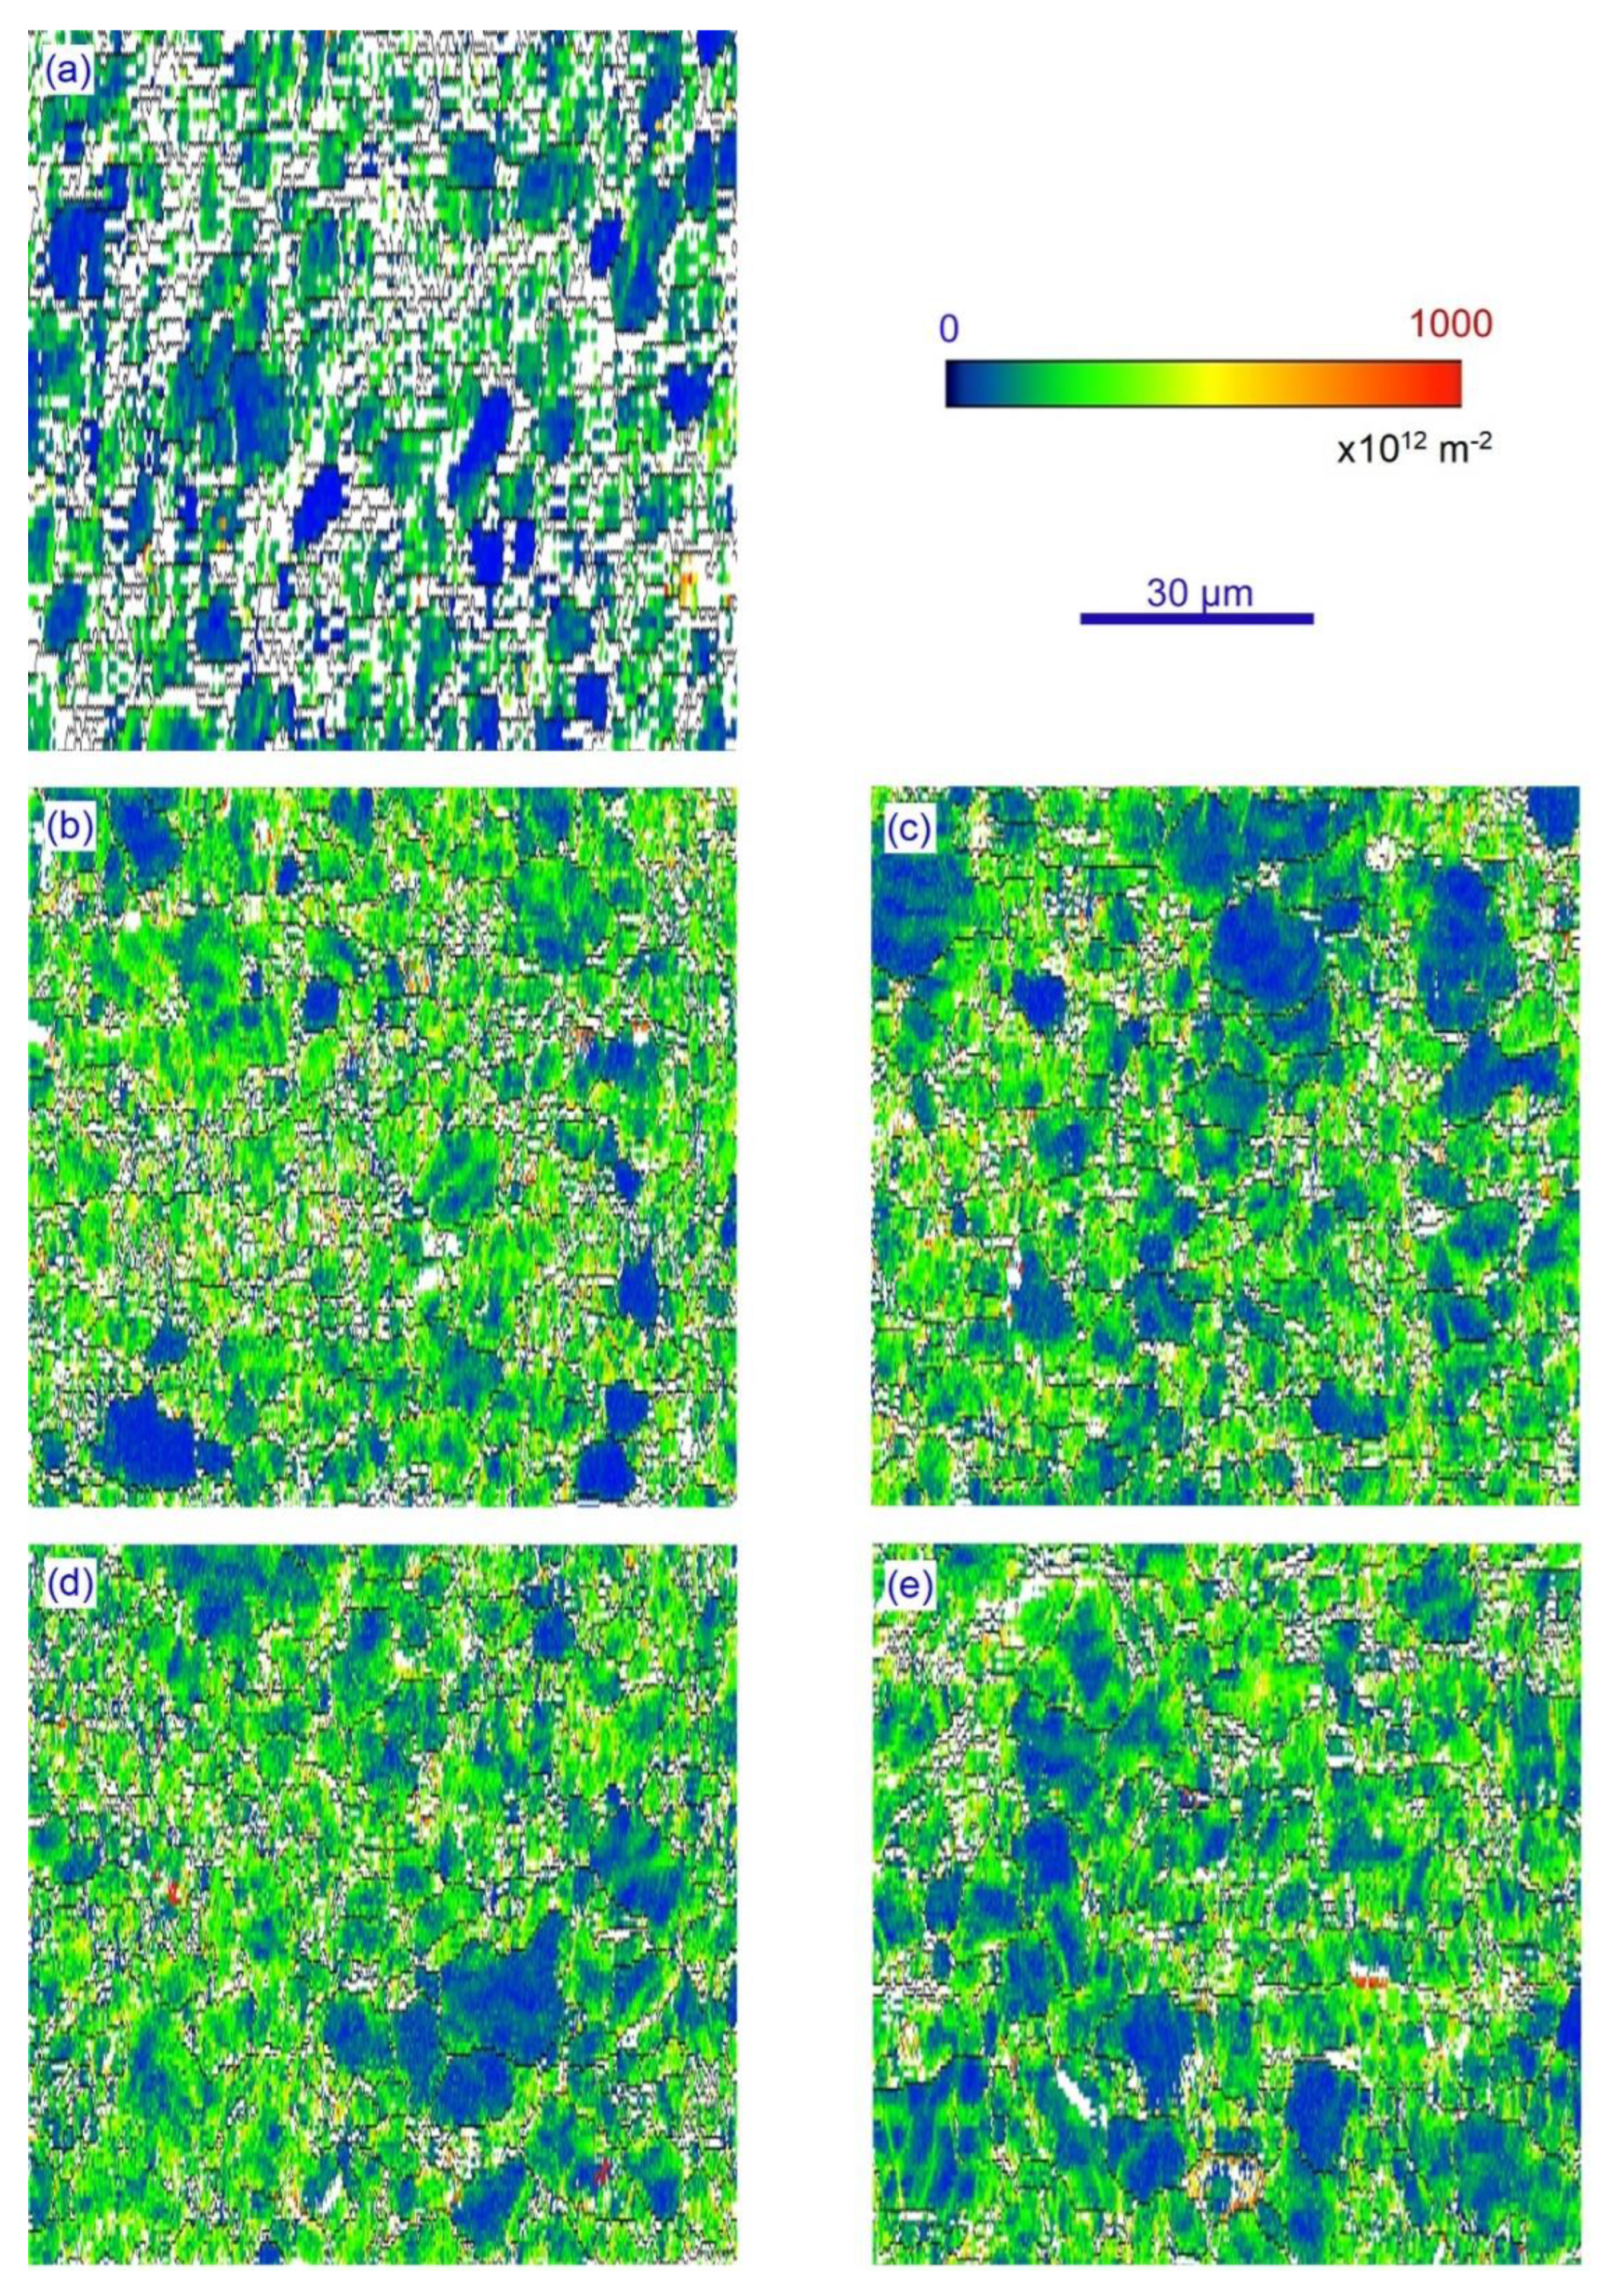
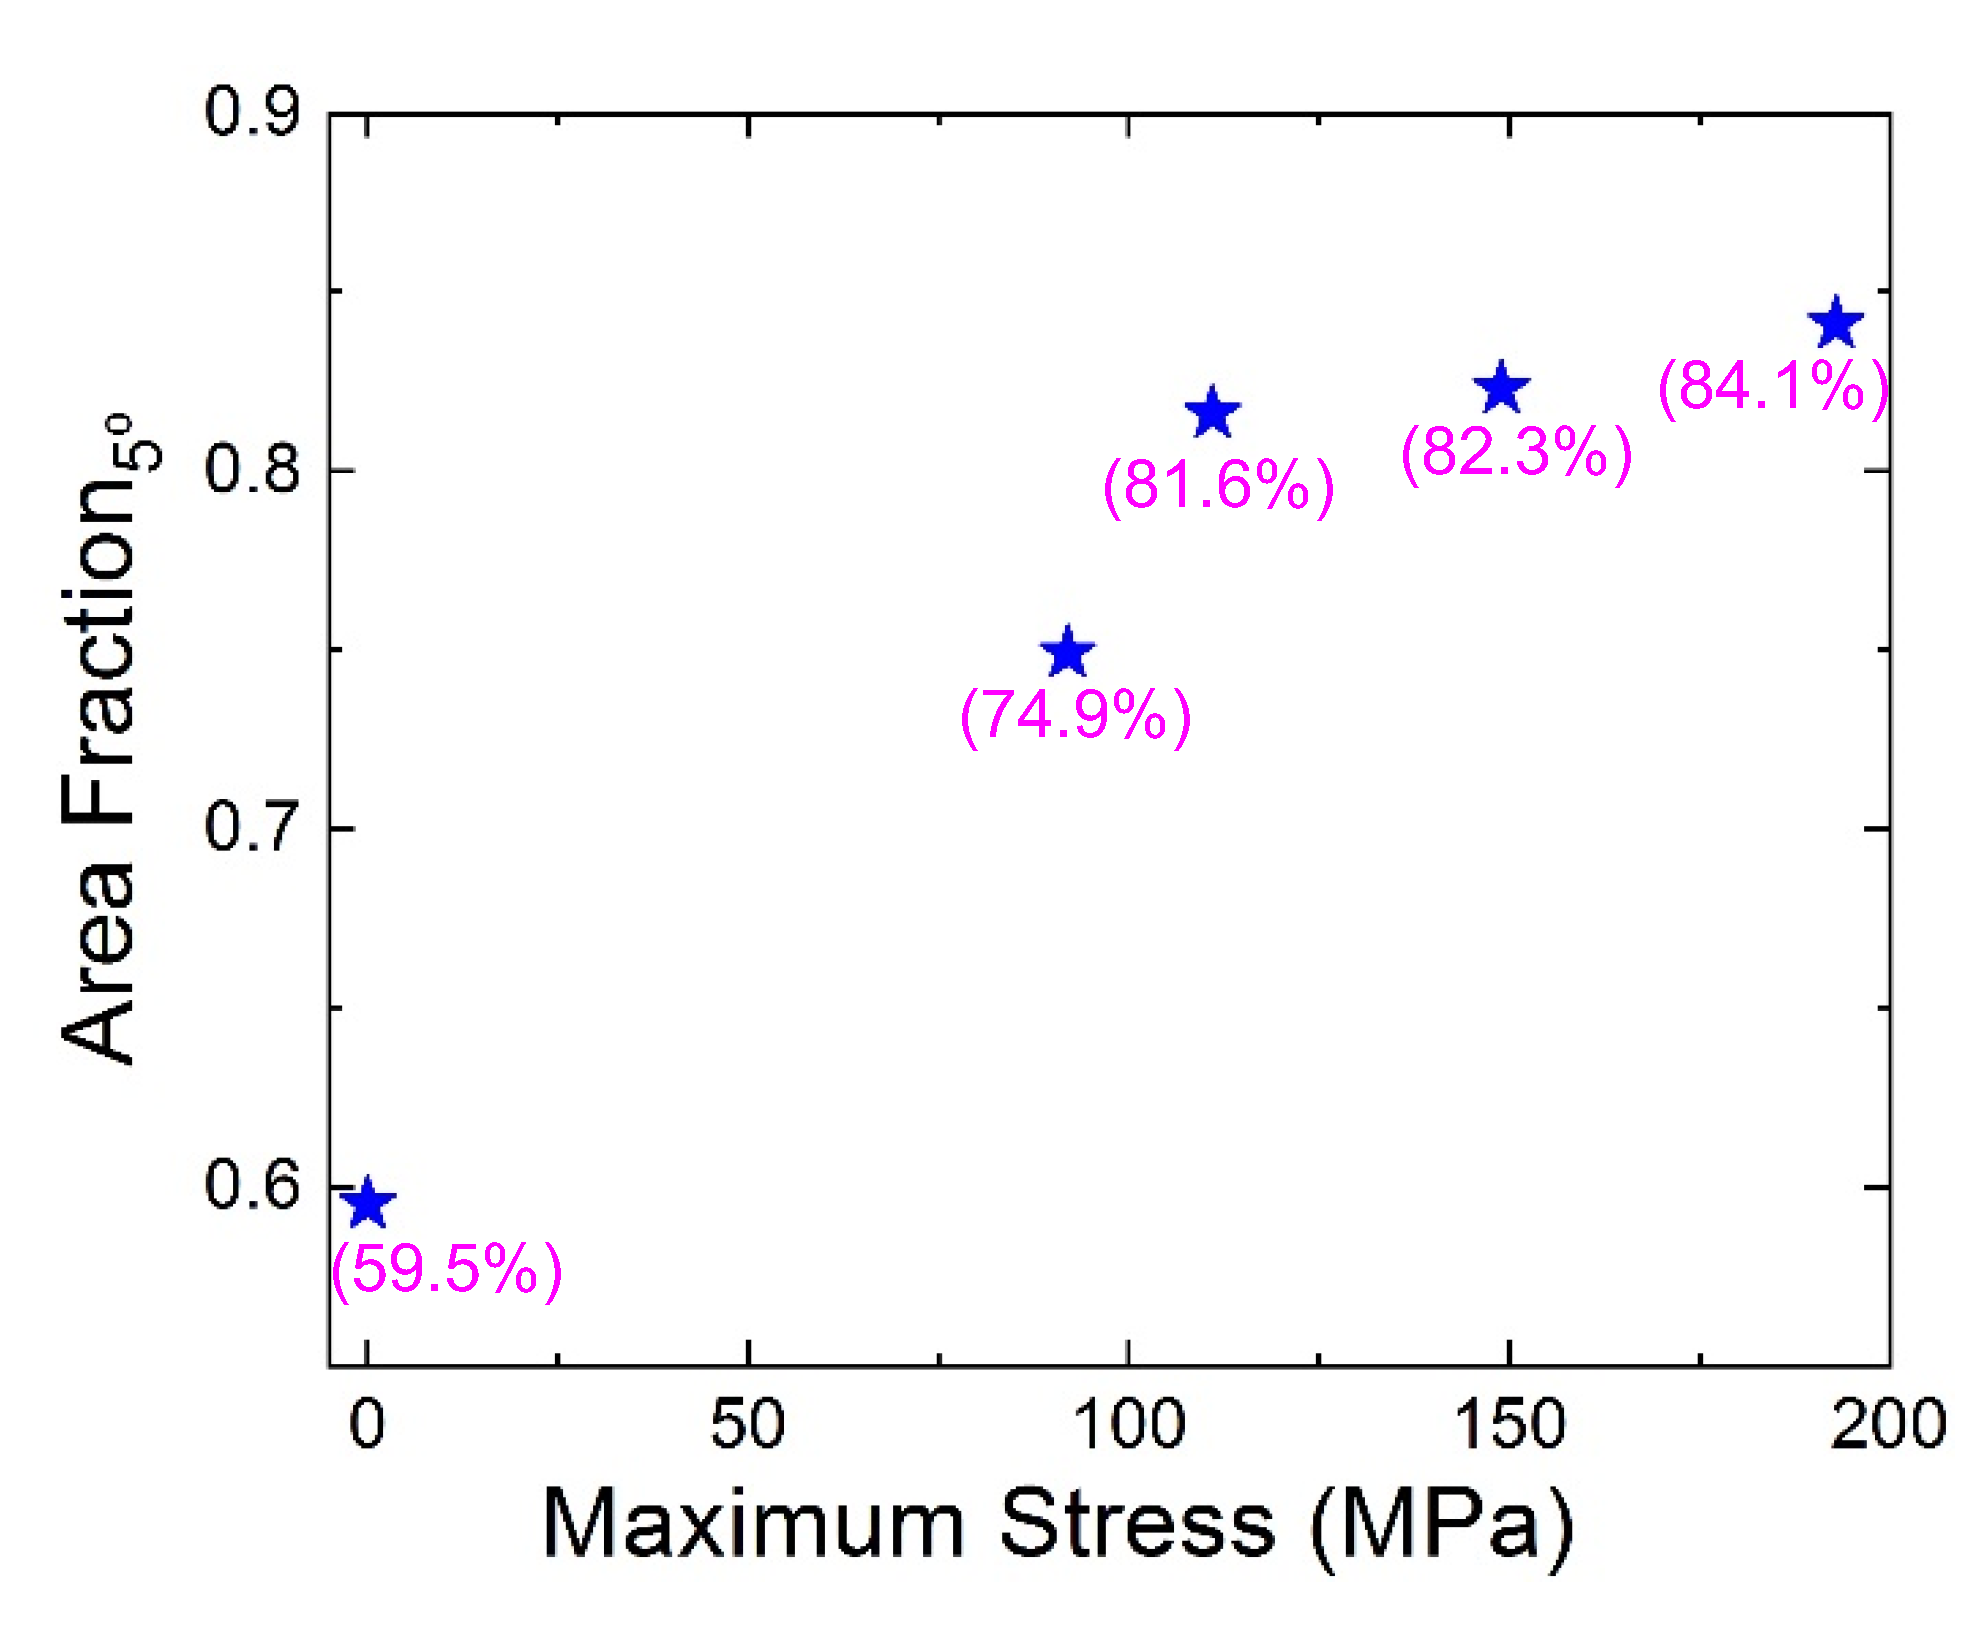
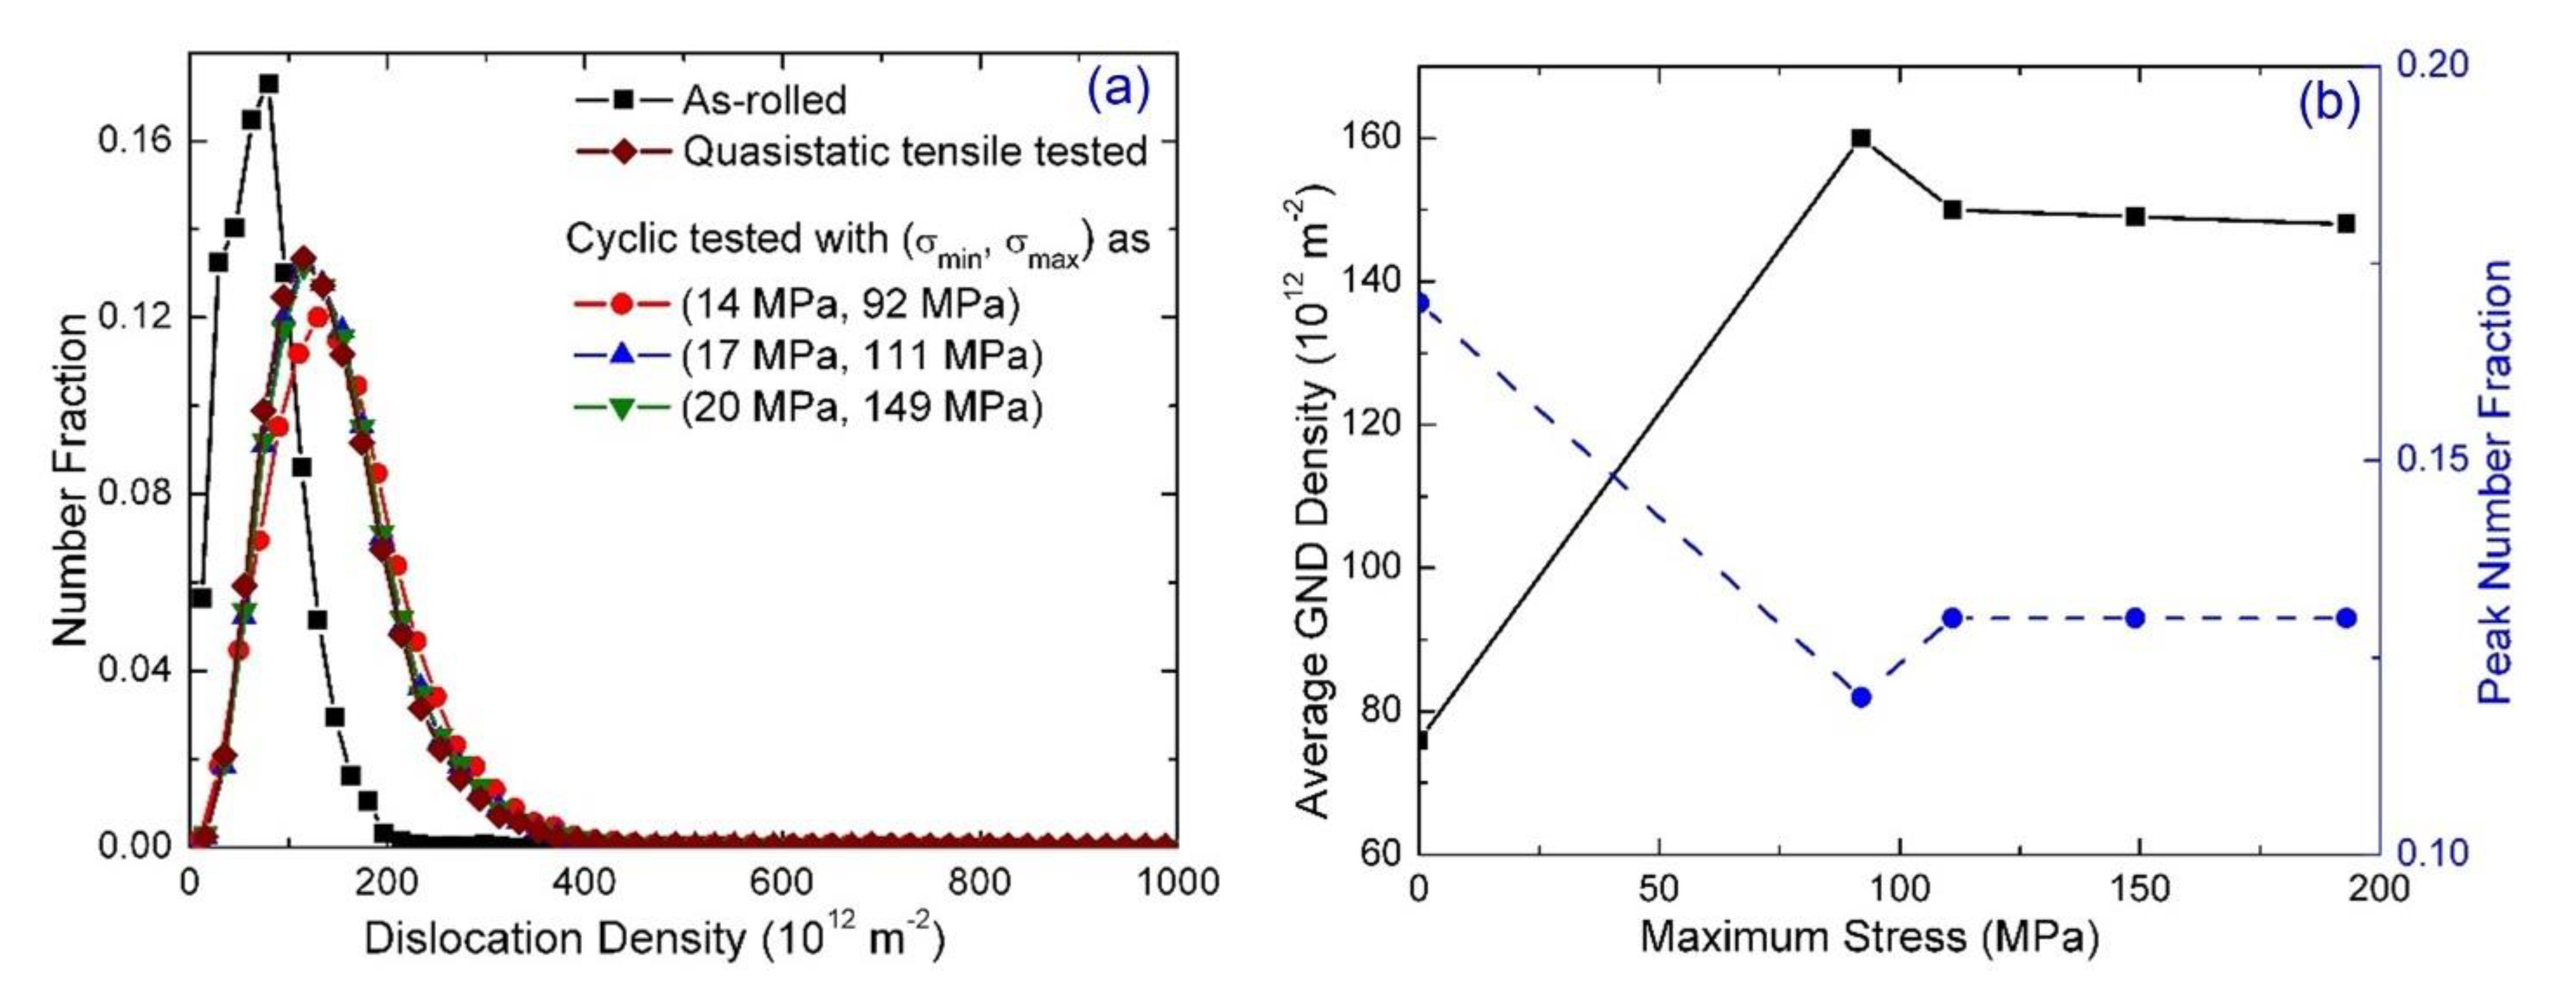
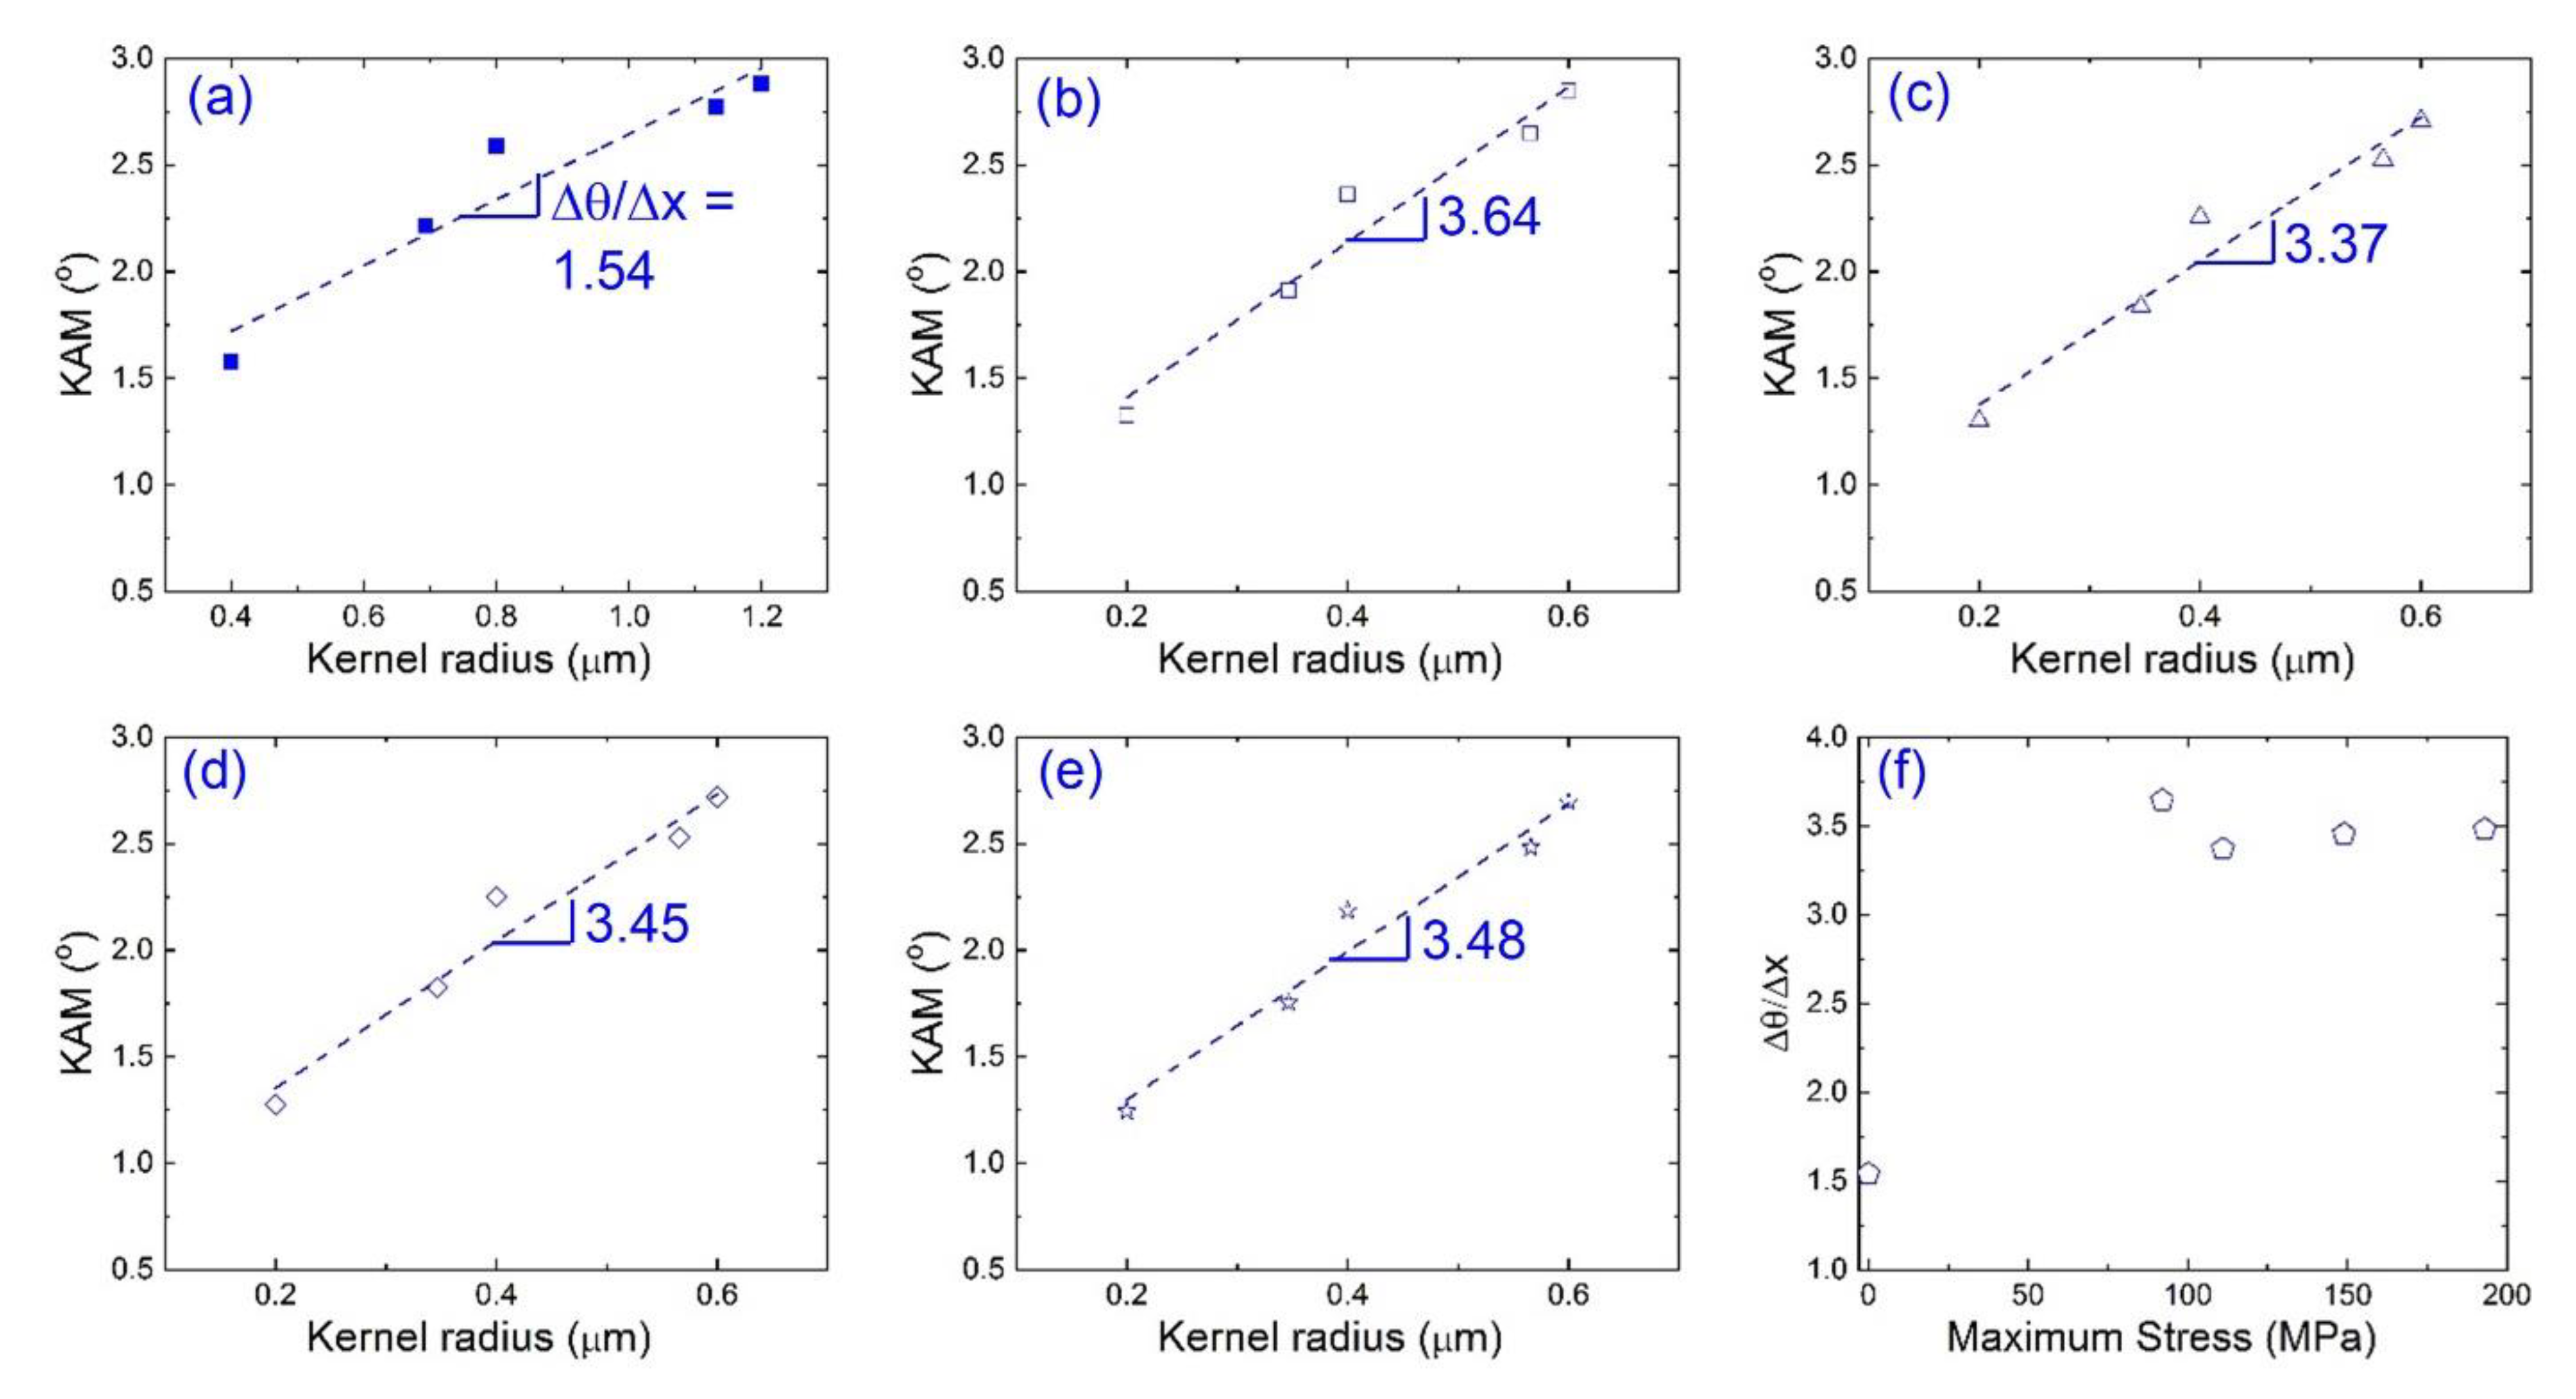
3.1. Geometrically Necessary Dislocation Density Evolution Due to Loading

Due to the local misorientation inside the grains, the geometrically necessary dislocations (GNDs) are needed to preserve the continuity of the lattice of the grains. Figure 2 reports the GND density maps for the as-rolled and tested samples. The scale bar representing 30 µm and the GND color code are provided in Figure 2. The color code varies from blue to red with the increase in GND density. For all the samples, the areas with low local misorientation show low GND density according to the colored scale bar. Most areas in the as-rolled sample had low GND densities, and some areas possessed medium GND densities. The tested samples had significantly larger areas with medium and high GND densities than the as-rolled sample. Although the Fatigue-L sample had a smaller area with low GND densities than the other tested samples, all tested samples had grains containing low GND densities surrounded by grains with medium GND densities. There was a lower percentage of misorientation angles less than 5° in the as-rolled sample compared with those in the fatigue-tested and tensile-tested samples. Since the threshold angle for GND density calculation is 5°, the fatigue-tested sample and the tensile-tested sample had higher GND densities than the as-rolled sample. The selection of 5° indicates that some regions were not included in the calculations of GND density. Specifically, when the local misorientation was greater than 5° for a region, there were no GND density data for this region. Figure 2a shows that the as-rolled sample had a higher area fraction of regions with greater than 5° of local misorientation than the other four samples. Figure 3 presents the data on the area fractions of the regions with up to 5° of local misorientation for the five samples. This area fraction was about 59.5% for the as-rolled sample, 74.9% for the Fatigue-L sample, 81.6% for the Fatigue-M sample, 82.3% for the Fatigue-H sample, and 84.1% for the quasi-static tensile-tested sample. The regions with greater than 5° of local misorientation were primarily located around the grain boundaries for all samples. The application of loading to the samples reduced the area fraction of the regions with greater than 5° of local misorientation. With the increase in the applied σmax experienced by the samples, a decrease was observed in the area fraction of the regions with greater than 5° of local misorientation. This phenomenon indicates that atomic rearrangement occurred around grain boundaries to reduce local misorientation during mechanical loading.
Figure 4a presents the number fraction of the GND densities for the as-rolled and tested samples. The average GND density (GNDavg) for each sample was also computed and is reported in Figure 4b. Each of the samples showed a right-skewed Gaussian distribution with a peak number fraction (fpeak) and the corresponding peak GND density (GNDpeak) as reported in Table 1. For fpeak, the as-rolled sample had the highest value among the five selected samples, while the Fatigue-L sample had the lowest value. However, for the GNDpeak, the Fatigue-L sample possessed the highest value, and this value is about 1.65 times that of the lowest value observed in the as-rolled sample. Furthermore, the GNDpeak values for the Fatigue-M and Fatigue-H samples, and the quasi-static tensile-tested sample were almost the same, and these GNDpeak values are about 88% of the GNDpeak value in the Fatigue-L sample. Along the right tail of the distributions, the number fraction f for each selected sample decreased when the GND density value increased, and the GND densities for the 1% number fraction (denoted as GND1%) on the right tail of the curves are reported in Table 1. The combination of a high fpeak and a low GND1% on the right tail led to the sharpest peak in the distribution curve of the as-rolled sample. On the contrary, the Fatigue-L sample had the broadest peak in the distribution curve since it had a low fpeak and a high GND1% on the right tail. For the quasi-static tensile-tested sample and the Fatigue-M and Fatigue-H samples, the GND distributions were similar to each other and the peaks were slightly narrower than that for the Fatigue-L sample.
The average GND densities from EBSD ( G N D a v g E B S D ) are also provided in Table 1. The average values can also be estimated through the following equation [32,33]:
GND avg = k   Δ θ / b   Δ x
where Δ θ / Δ x is the rate of the misorientation angle variation with respect to the distance (i.e., the strain gradient), k is a constant depending on the sub-boundary, and b is the magnitude of the Burgers vector. Based on the EBSD data, the variation in kernel average misorientation (KAM) angle with kernel radius can be obtained, and the corresponding slope provides the Δθ/Δx value, as shown in Figure 5. In addition, the assumption of k = 1 represents an array of tilt-edge dislocations; and the assumption of k = 2 represents two perpendicular arrays of screw dislocations [32,33]. The value of b is 0.321 nm for <a>-type slip direction. The estimated average GND densities were obtained according to Equation (1) for both k = 1 and k = 2, as reported in Table 1. The values of the data based on k = 2 were more than twice those of the experimental data based on EBSD, while those based on k = 1 provide a good agreement with the experimental data. Thus, it is assumed that the sub-boundaries have tilt configuration with edge dislocations, as shown in Figure 6. The spacing D between two neighbor dislocations varies with the misorientation angle θ as the following [34],
D = b / θ
where b is the magnitude of the Burgers vector. When θ is 5°, the spacing D is about 3.68 nm. This implies the existence of very dense dislocations, and the atomic arrangement is highly disordered. This also supports the selection of 5° as the threshold angle for GND density calculation.
For the as-rolled sample, the GND can be assumed to arrange uniformly like a forest inside the grains, as shown in Figure 7a. The distance d between two neighboring dislocations is about 0.115 µm for the average GND density of 76 × 1012 m−2. When a dislocation moves under loading, the geometrically necessary dislocations serve as barriers and pinning points. An initially straight-moving dislocation (i.e., the dashed line in Figure 7a) bows out through the channel between two neighboring dislocations (i.e., the solid and curved dislocation line in Figure 7a). The maximum shear stress τmax is required when the moving dislocation forms a semicircle. The diameter of the semicircle is d, as shown in Figure 7a. τmax can be obtained using the following equation [34,35],
τ max = 2   T / b   d
where T is the line tension of dislocation and is about Gb2/2, and G is the shear modulus of magnesium and is about 17 GPa. For the as-rolled magnesium, τmax is about 48 MPa. τmax corresponds to the yield strength σy of the material at room temperature through the following relation [36],
σy = τmax/s
where s is the Schmid factor and equals cos(ϕ) cos(λ), ϕ is the angle between the loading direction and the plane normal direction of the slip plane, and λ is the angle between the loading direction and the slip direction, as shown in Figure 7b. Assuming that s is 0.5, σy is estimated to be about 96 MPa, and this estimation agrees well with the experimental σy of about 98 MPa based on the quasi-static tensile testing at room temperature for the studied fine-grained magnesium reported in the reference [14]. This agreement supports the assumed GND arrangement in the as-rolled sample.

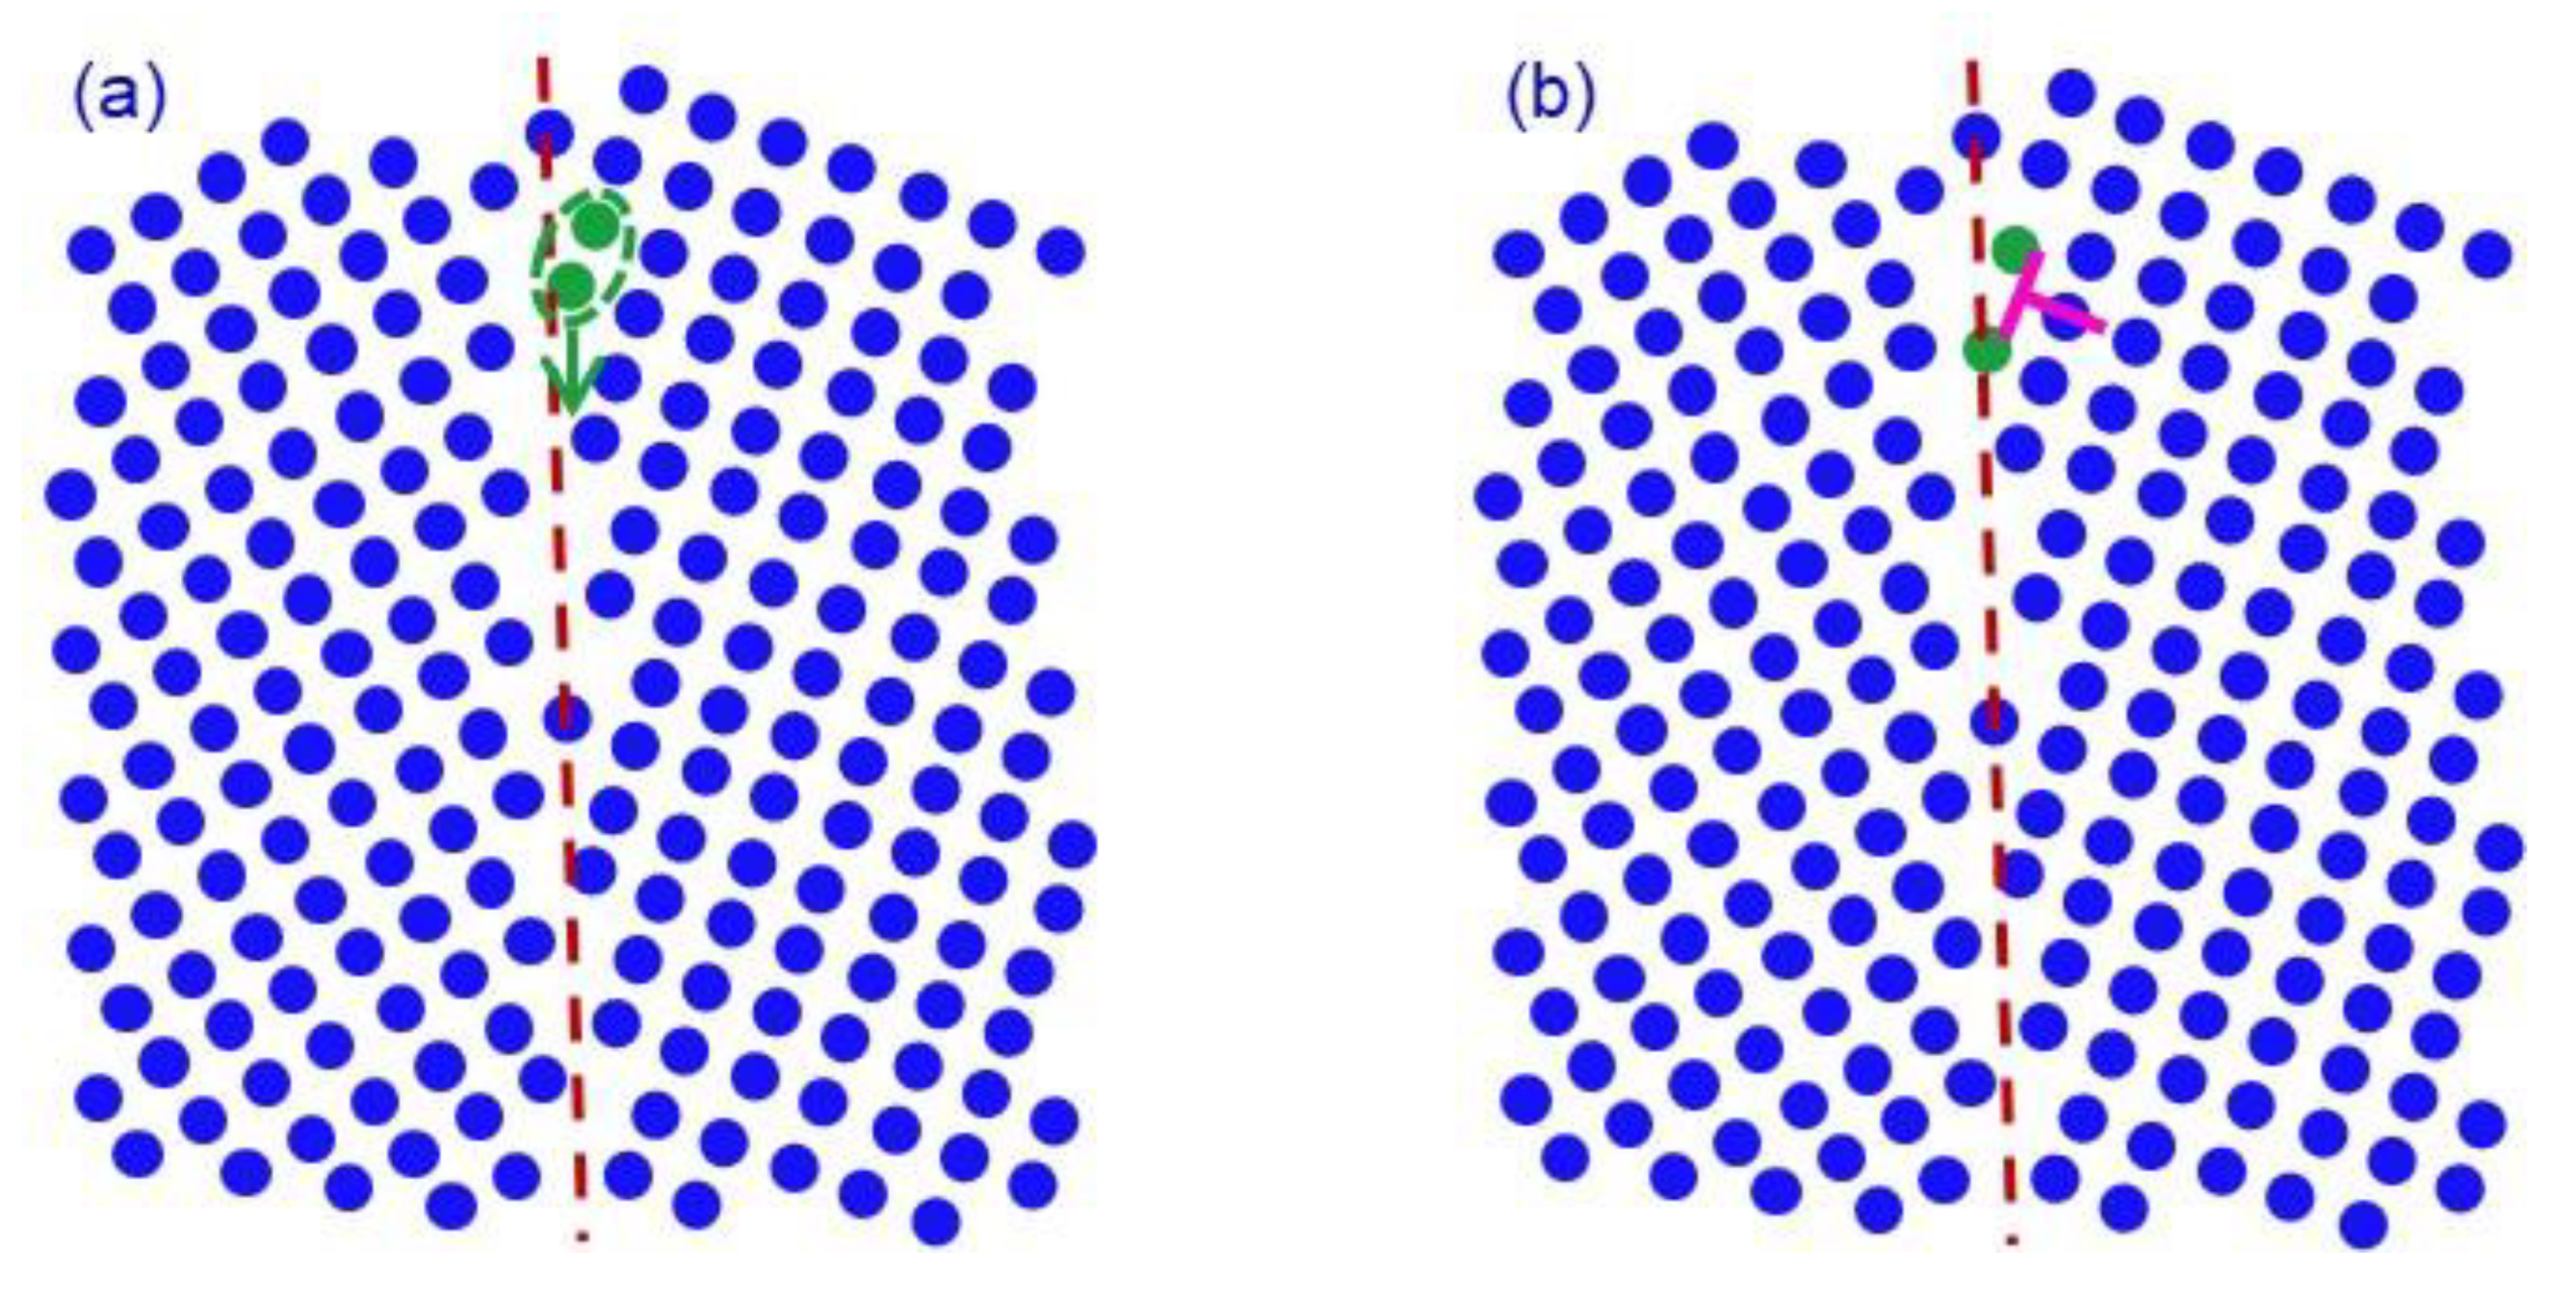
3.2. Grain Boundary Mediated Dislocation Emission

Based on the data in Figure 4, the as-rolled sample had the lowest average GND density (GNDavg), and the tested samples had much higher GNDavg. Quantitatively, GNDavg increased by about 111%, 97%, 96%, and 95% for the Fatigue-L sample, the Fatigue-M sample, the Fatigue-H sample, and the quasi-static tensile-tested sample, respectively, compared to the as-rolled sample. The increase in GNDavg for all tested samples can be due to the Frank–Read mechanism of dislocation multiplication [35] and grain-boundary- mediated dislocation emission. For the Fatigue-L sample, σmax applied to the sample was 92 MPa, which was below the required stress of 96 MPa for the Frank–Read mechanism, which implies that the increase in dislocation density was primarily due to dislocation emissions from the grain boundary. In addition, for the Fatigue-M, Fatigue-H, and quasi-static tensile-tested samples, the σmax experienced by these samples were higher than the yield strength. One possible implication is that the Frank–Read mechanism was active and GNDavg increased from that for the Fatigue-L sample. However, the GND data in Figure 4 show that the Fatigue-L sample had higher GNDavg. The Fatigue-M, Fatigue-H, and quasi-static tensile-tested samples had about the same GNDavg, which were about 86~87% of the GNDavg for the Fatigue-L sample. This phenomenon indicates that another deformation mechanism was activated when the applied stress exceeded the yield strength. One possible additional mechanism is the activation of tensile twinning, and its invalidity is shown by the nonexistence of twins [37]. Since σmax was greater than the yield strength for the Fatigue-M, Fatigue-H, and quasi-static tensile-tested samples, some of the generated dislocations from grain-boundary atomic rearrangement and some existing dislocations can move through a grain to reach the other part of grain boundary, which can result in a lower GNDavg than that for the Fatigue-L sample. This type of grain boundary mediated dislocation emission process was observed during the modeling of nanograined material with a face-centered cubic microstructure when both grain-boundary migration and grain-rotation operated under certain circumstances [29]. Rupert et al. also reported grain-boundary dislocation emission in nanograined Ni-W alloy [27].
The sketch in Figure 8 displays the generation of dislocation from the grain boundary (represented by the dashed line) due to the local grain-boundary atomic rearrangement. It is known that the atoms around the grain boundary are loosely packed, and there is open space along the grain boundary. Atomic movements are much easier around a grain boundary than within a grain. Under loading, atoms such as the ones identified by the dashed ellipse in Figure 8a can slide locally along the grain boundary, and this process generates a dislocation in the right grain, as shown in Figure 8b. During this process, the grain boundary becomes better aligned, the local misorientation angle is reduced, and the stored deformation decreases. In addition, dislocation multiplication results in more uniform dislocation distribution and lower peak number fraction values of the GND density for the tested samples compared to the as-rolled sample, as shown in Figure 4. For the Fatigue-L sample, the generated dislocations can only move for a short distance of about d within a grain to stay inside the grains, and can force the existing dislocations to move locally and rearrange, thus significantly increasing the GND density without the activation of dislocation multiplication through the Frank–Read mechanism.
For the tested samples, the energy increase per unit volume (ΔU) due to the increase in the average GND density can be estimated by the following equation,
ΔU = ΔGNDavg Gb2/2
where ΔGNDavg is the difference between the average GND density for the tested sample and that for the as-rolled sample, and Gb2/2 is the energy of dislocation per unit length [38]. The estimated ΔU values are 74 kJ/m3 for the Fatigue-L sample, 65 kJ/m3 for the Fatigue-M sample, 64 kJ/m3 for the Fatigue-H sample, and 63 kJ/m3 for the quasi-static tensile-tested sample. Before the loading stress reaches the yield strength, the elastic-strain-energy input (Uelastic) can be calculated using the following relation,
Uelastic = σ2/(2E)
where E is the Young’s modulus of magnesium and about 45 GPa. For the Fatigue-L sample, Uelastic is about 94 kJ/m3, and this energy is about 20 kJ/m3 higher than the estimated ΔU due to the additional GND stored in the samples. For the quasi-static tensile-tested sample, the Fatigue-M sample, and the Fatigue-H sample, Uelastic is about 123 kJ/m3, and this energy is about twice that of the estimated ΔU. Furthermore, the mechanical energies due to loading were higher than the Uelastic for the samples when the applied σmax was higher than the yield strength. Thus, a portion of the applied mechanical energy may be consumed for local grain-boundary atomic movement and rearrangement for the tested samples.

4. Conclusions

In this study, the geometrically necessary dislocation (GND) analysis was performed for three selected fatigue-tested samples, the as-rolled sample, and the quasi-static tensile-tested sample. There is no previous article on the GND analysis of fine-grained magnesium mechanically tested at 0 °C. Here, the following insights were obtained from the new analysis:
Due to the open space and loose atomic arrangement along grain boundaries, grain-boundary atomic rearrangement can happen locally under loading to align the neighboring grains, reduce misorientation angle, and generate dislocations inside the grains, even when σmax is less than the yield strength of the fine-grained magnesium. For the mechanically tested samples, the energy increase due to the increase in the average GND density was estimated to be 74 kJ/m3 for the Fatigue-L sample, 65 kJ/m3 for the Fatigue-M sample, 64 kJ/m3 for the Fatigue-H sample, and 63 kJ/m3, for the quasi-static tensile-tested sample. These energies are less than the energy inputs to the samples from mechanical loading. Thus, a portion of the mechanical energy due to the applied loading was the driving force for the grain-boundary atomic rearrangement.
Grain-boundary-mediated atomic rearrangement and dislocation emission led to dislocation multiplications and significant increase in the average geometrically necessary dislocation densities for the samples that experienced fatigue testing and quasi-static tensile testing, respectively, at 0 °C. The average GND density for the tested samples increased by 95~111% from that for the as-rolled sample. The fatigue-tested sample with a σmax lower than σy had the highest average geometrically necessary dislocation density among the tested samples, which implies that the Frank–Read mechanism was not the dislocation multiplication mechanism, and the mechanism was mainly dislocation emissions from the grain boundary.
Dislocation generation, motion, and grain-boundary atomic rearrangement were the critical deformation mechanisms for the studied fine-grained magnesium under fatigue loading and quasi-static tensile loading, respectively, at 0 °C.

Funding

This research was funded by the Basic Energy Sciences Office at the US Department of Energy, grant number DESC0016333.

Institutional Review Board Statement

Not applicable.

Data Availability Statement

The data presented in this study are available on request from the corresponding author.

Acknowledgments

The author appreciates the support by the Basic Energy Sciences Office at the US Department of Energy.

Conflicts of Interest

The authors have no known competing personal relationships or financial interests that could have appeared to influence the work reported in this paper.

References

  1. Langdon, T.G. Twenty-five years of ultrafine-grained materials: Achieving exceptional properties through grain refinement. Acta Mater. 2013, 61, 7035–7059. [Google Scholar] [CrossRef]
  2. Armstrong, R.W. Size effects on material yield strength/deformation/fracturing properties. J. Mater. Res. 2019, 34, 2161–2176. [Google Scholar] [CrossRef]
  3. Armstrong, R.W. Comparison of grain size and strain rate influences on higher temperature metal strength and fracturing properties. Strength Fract. Complex. 2018, 11, 121–135. [Google Scholar] [CrossRef]
  4. Hahn, E.N.; Meyers, M.A. Grain-size dependent mechanical behavior of nanocrystalline metals. Mater. Sci. Eng. A 2015, 646, 101–134. [Google Scholar] [CrossRef] [Green Version]
  5. Hsu, C.S.; Li, Q. Processing and Characterization of Ti64/AZ31 Multilayered Structure by Roll Bonding; Springer International Publishing: Cham, Switzerland, 2018; pp. 73–78. [Google Scholar]
  6. Liu, D.X.; Pang, X.; Li, D.L.; Guo, C.G.; Wongsa-Ngam, J.; Langdon, T.G.; Meyers, M.A. Microstructural Evolution and Properties of a Hot Extruded and HPT-Processed Resorbable Magnesium WE43 Alloy. Adv. Eng. Mater. 2017, 19, 1600698. [Google Scholar]
  7. Li, Q.; Jiao, X. Exploration of equal channel angular pressing routes for efficiently achieving ultrafine microstructure in magnesium. Mater. Sci. Eng. A 2018, 733, 179–189. [Google Scholar] [CrossRef]
  8. Li, Q.; Jiao, X. Recrystallization mechanism and activation energies of severely-deformed magnesium during annealing process. Materialia 2019, 5, 100188. [Google Scholar] [CrossRef]
  9. Huang, A.H.; Wang, Y.F.; Wang, M.S.; Song, L.Y.; Li, Y.S.; Gao, L.; Huang, C.X.; Zhu, Y.T. Optimizing the strength, ductility and electrical conductivity of a Cu-Cr-Zr alloy by rotary swaging and aging treatment. Mater. Sci. Eng. A 2019, 746, 211–216. [Google Scholar] [CrossRef]
  10. Cao, Y.; Wang, Y.; An, X.; Liao, X.; Kawasaki, M.; Ringer, S.; Langdon, T.; Zhu, Y. Concurrent microstructural evolution of ferrite and austenite in a duplex stainless steel processed by high-pressure torsion. Acta Mater. 2014, 63, 16–29. [Google Scholar] [CrossRef]
  11. Lin, P.; Sun, Y.; Chi, C.; Wang, W. Effect of plastic anisotropy of ZK60 magnesium alloy sheet on its forming characteristics during deep drawing process. Int. J. Adv. Manuf. Technol. 2017, 88, 1629–1637. [Google Scholar] [CrossRef]
  12. Wang, Q.; Jiang, B.; Chen, D.; Jin, Z.; Zhao, L.; Yang, Q.; Huang, G.; Pan, F. Strategies for enhancing the room-temperature stretch formability of magnesium alloy sheets: A review. J. Mater. Sci. 2021, 56, 12965–12998. [Google Scholar] [CrossRef]
  13. Li, Q.; Tian, B. Mechanical properties and microstructure of pure polycrystalline magnesium rolled by different routes. Mater. Lett. 2012, 67, 81–83. [Google Scholar] [CrossRef]
  14. Li, Q. Effect of subfreezing testing temperature on tensile mechanical behavior of fine-grained magnesium. Mater. Sci. Eng. A 2021, 803, 140457. [Google Scholar] [CrossRef]
  15. Cristescu, N.D.; Craciun, E.-M.; Soós, E. Mechanics of Elastic Composites; Chapman and Hall/CRC: Boca Raton, FL, USA, 2003. [Google Scholar]
  16. Li, Q.; Tian, B. Compression behavior of magnesium/carbon nanotube composites. J. Mater. Res. 2013, 28, 1877–1884. [Google Scholar] [CrossRef]
  17. Jafari, M.; Chaleshtari, M.H.B.; Abdolalian, H.; Craciun, E.-M.; Feo, L. Determination of forces and moments per unit length in symmetric exponential FG plates with a quasi-triangular hole. Symmetry 2020, 12, 834. [Google Scholar] [CrossRef]
  18. Liu, C.; Yao, Y. Study of Crack-Propagation Mechanism of Al0. 1CoCrFeNi High-Entropy Alloy by Molecular Dynamics Method. Crystals 2023, 13, 11. [Google Scholar] [CrossRef]
  19. Li, Q. Microstructure and deformation mechanism of 0 0 0 1 magnesium single crystal subjected to quasistatic and high-strain-rate compressive loadings. Mater. Sci. Eng. A 2013, 568, 96–101. [Google Scholar] [CrossRef]
  20. Armstrong, R.W. High-Rate Crystal/Polycrystal Dislocation Dynamics. Crystals 2022, 12, 705. [Google Scholar] [CrossRef]
  21. Shehadeh, M.; El Ters, P.; Armstrong, R.W.; Arnold, W. Dislocation mechanics of extremely high rate deformations in iron and tantalum. J. Eng. Mater. Technol. 2022, 144, 011015. [Google Scholar] [CrossRef]
  22. Armstrong, R.W. Constitutive relations for slip and twinning in high rate deformations: A review and update. J. Appl. Phys. 2021, 130, 245103. [Google Scholar] [CrossRef]
  23. Li, Q. Dynamic mechanical response of magnesium single crystal under compression loading: Experiments, model, and simulations. J. Appl. Phys. 2011, 109, 103514. [Google Scholar] [CrossRef]
  24. Kumar, P.; Kawasaki, M.; Langdon, T.G. Review: Overcoming the paradox of strength and ductility in ultrafine-grained materials at low temperatures. J. Mater. Sci. 2016, 51, 7–18. [Google Scholar] [CrossRef]
  25. Zhou, X.; Li, X.; Lu, K. Size dependence of grain boundary migration in metals under mechanical loading. Phys. Rev. Lett. 2019, 122, 126101. [Google Scholar] [CrossRef] [PubMed]
  26. Legros, M.; Gianola, D.S.; Hemker, K.J. In situ TEM observations of fast grain-boundary motion in stressed nanocrystalline aluminum films. Acta Mater. 2008, 56, 3380–3393. [Google Scholar] [CrossRef]
  27. Rupert, T.J.; Trelewicz, J.R.; Schuh, C.A. Grain boundary relaxation strengthening of nanocrystalline Ni–W alloys. J. Mater. Res. 2012, 27, 1285–1294. [Google Scholar] [CrossRef]
  28. Hasnaoui, A.; Van Swygenhoven, H.; Derlet, P. Cooperative processes during plastic deformation in nanocrystalline fcc metals: A molecular dynamics simulation. Phys. Rev. B 2002, 66, 184112. [Google Scholar] [CrossRef]
  29. Liu, C.; Lu, W.; Weng, G.J.; Li, J. A cooperative nano-grain rotation and grain-boundary migration mechanism for enhanced dislocation emission and tensile ductility in nanocrystalline materials. Mater. Sci. Eng. A 2019, 756, 284–290. [Google Scholar] [CrossRef]
  30. N.C.D. Center, Climate of the United States. 2021. Available online: https://www.ncdc.noaa.gov/climate-information (accessed on 3 March 2023).
  31. Li, Q. Fatigue behavior of fine-grained magnesium under tension-tension loading at 0 °C. Int. J. Fatigue 2021, 153, 106506. [Google Scholar] [CrossRef]
  32. Gao, H.; Huang, Y.; Nix, W.; Hutchinson, J. Mechanism-based strain gradient plasticity—I. Theory. J. Mech. Phys. Solids 1999, 47, 1239–1263. [Google Scholar] [CrossRef]
  33. Kubin, L.; Mortensen, A. Geometrically necessary dislocations and strain-gradient plasticity: A few critical issues. Scr. Mater. 2003, 48, 119–125. [Google Scholar] [CrossRef] [Green Version]
  34. Hirth, J.P.; Lothe, J.; Mura, T. Theory of dislocations. J. Appl. Mech. 1983, 50, 476. [Google Scholar] [CrossRef] [Green Version]
  35. Frank, F.; Read, W., Jr. Multiplication processes for slow moving dislocations. Phys. Rev. 1950, 79, 722. [Google Scholar] [CrossRef]
  36. Schmid, E.; Boas, W. Plasticity of Crystals; P. Hughes: London, UK, 1950. [Google Scholar]
  37. Li, Q. Microstructural analysis of fine-grained magnesium after cyclic tension–tension fatigue testing at 0 °C. J. Mater. Res. Technol. 2022, 20, 4306–4317. [Google Scholar] [CrossRef]
  38. Hirth, J.P.; Lothe, J. Theory of Dislocations; Krieger Pub. Co., Ltd.: Malabar, FL, USA, 1992. [Google Scholar]
Figure 1. (a) Macroscopic image of the fractured sample after mechanical testing. (b) SEM image of the top surface of the sample.
Crystals 13 00490 g001
Figure 2. GND density maps for the five selected samples: (a) the as−rolled sample, (b) the Fatigue-L sample, (c) the Fatigue−M sample, (d) the Fatigue−H sample, and (e) the quasi−static tensile−tested sample.
Crystals 13 00490 g002
Figure 3. Variation in area fractions of the regions with up to 5° local misorientation (Area Fraction) with respect to applied maximum stress σmax experienced by the samples.
Crystals 13 00490 g003
Figure 4. (a) Number fractions for the GND densities in the range of 0~1000 × 1012 m−2 for the five selected samples. (b) Variation in average GND density and peak number fraction with respect to the applied σmax experienced by the samples. (Note: The solid line with square symbols in (b) represents average GND density, and the dashed line with circle symbols in (b) represents peak number fraction for the selected samples.)
Crystals 13 00490 g004
Figure 5. Variation in KAM with kernel radius for (a) the as-rolled sample, (b) the Fatigue-L sample, (c) the Fatigue-M sample, (d) the Fatigue-H sample, and (e) the quasi-static tensile-tested sample; and (f) the slope Δθ/Δx for all the samples.
Crystals 13 00490 g005
Figure 6. Schematic sketch of tilt sub-boundary with an array of edge dislocations. The circles represent the atoms. D is the spacing between two neighbor dislocations and each inverted “T” represents a dislocation.
Crystals 13 00490 g006
Figure 7. (a) Sketch of the uniformly arranged GNDs within a grain and a moving dislocation bowing from a straight line (the dashed line) to a curve due to the pinning of two neighboring GNDs. (b) Schematic drawing of the relation between the applied stress σ and the slip system with the slip plane as the shaded plane, the plane normal N of the slip plane, and the slip direction S.
Crystals 13 00490 g007
Figure 8. Sketch of two neighboring grains: (a) initial state and (b) after local atomic rearrangement and dislocation generation in the right grain. (Note: The circles represent the atoms. The dashed straight line represents the grain boundary. The arrow in (a) denotes the atomic sliding direction. The slanted “T” in (b) represents the generated dislocation).
Crystals 13 00490 g008
Table 1. Peak number fraction (fpeak) and the corresponding peak GND density (GNDpeak), GND density for 1% number fraction (GND1%), and average GND density from EBSD ( G N D a v g E B S D and Equation (1) ( G N D a v g E q 1 ), respectively, for the as-rolled, Fatigue-L, Fatigue-M, Fatigue-H, and quasi-static tensile-tested samples.
As-RolledFatigue-LFatigue-MFatigue-HQuasi-Static
fpeak17%12%13%13%13%
GNDpeak
(×1012 m−2)
79130114115115
GND1%
(×1012 m−2)
220440410420420
G N D a v g E B S D
(×1012 m−2)
76160150149148
G N D a v g E q 1  
with k = 1 (×1012 m−2)
84198183188189
G N D a v g E q 1  
with k = 2 (×1012 m−2)
168396366376378
Disclaimer/Publisher’s Note: The statements, opinions and data contained in all publications are solely those of the individual author(s) and contributor(s) and not of MDPI and/or the editor(s). MDPI and/or the editor(s) disclaim responsibility for any injury to people or property resulting from any ideas, methods, instructions or products referred to in the content.

