Article

Advancing PLA 3D Printing with Laser Polishing: Improving Mechanical Strength, Sustainability, and Surface Quality

1
Department of Industry Engineering, School of Mechanical Engineering, Northwestern Polytechnical University, Xi’an 710072, China
2
Faculty of Integrated Technologies, Universiti Brunei Darussalam, Jalan Tungku Link, Gadong BE1410, Brunei
3
Department of Mechatronics Engineering, Faculty of Engineering and Technology, University of Chakwal, Chakwal 48800, Pakistan
*
Authors to whom correspondence should be addressed.
These authors contributed equally to this work.
Crystals 2023, 13(4), 626; https://doi.org/10.3390/cryst13040626
Submission received: 27 February 2023 / Revised: 1 April 2023 / Accepted: 2 April 2023 / Published: 5 April 2023

Abstract

:
Three-dimensional (3D) printing of polylactic acid using the fused filament fabrication approach is a widely used additive manufacturing method in various fields, despite the historical issue of substantial surface roughness in fused filament fabrication products. Several strategies have been utilized to minimize the surface roughness of 3D-printed items. However, laser polishing is a novel technique for reducing surface roughness and improving other material qualities. In this study, polylactic acid was examined using the laser polishing method for surface roughness and mechanical properties, such as tensile and flexural strength and laser scan time. Several trials were conducted to determine how changing the laser’s characteristics may affect the materials’ surface quality and mechanical qualities. Before the final test, preliminary tests were performed to determine the lowest potential heat-affected zone. Laser polishing reduced surface roughness by more than 88.8% (from 7.8 µm to 0.87 µm). The tensile strength of the specimen increased by 14.03%, from 39.2 MPa to 44.7 MPa. Polylactic acid had a constant flexural strength of 70.1 MPa before and after polishing, and the laser scan time for samples was 19.4 s. Polished morphologies were studied to learn more about the microstructure. These findings show that laser polishing can improve and modify the surface properties of a fused filament fabrication product, which can benefit the industry and researchers.

1. Introduction

Additive manufacturing creates physical objects layer after layer from a three-dimensional (3D) model [1]. Because of its low cost and low energy needs, additive manufacturing has found extensive applications. The healthcare, transportation, aerospace, and biotechnology markets are expanding at the quickest rates [2,3,4,5]. The term “3D printing” is an umbrella word for a variety of production techniques [6,7,8], such as stereolithography, fused filament fabrication (FFF) [9], powder-bed fusion [10,11,12,13,14], and selective laser melting [15,16]. In polymer printing, FFF is one of the most often used additive manufacturing processes [17,18]. In a typical FFF process, filament materials comprising thermoplastic, waxes, or metal fusion are extruded from hot nozzles and set at a consistent rate along a defined trajectory for each layer [19].
When one layer is complete, it is followed by a subsequent layer, and so on, with the platform being lowered by the thickness of a layer between each successive layer [20,21,22]. The multilayer construction, however, makes the surface somewhat uneven on top [23,24,25,26]. In addition, the poor surface quality of an FFF component might reduce its usefulness. For instance, low-quality plastic gears might impair the gear transmission accuracy [27]. To fix this situation, several researchers have investigated different methods of improving the surface quality of FFF components [28,29]. Adjusting the parameters of the FFF process is a powerful method [30]. Mushtaq et al. [31] analyzed the relationship between the surface roughness (Ra) of FFF-fabricated items and their central thickness, road width, layer thickness, extrusion temperature, heat bed temperature, and deposition speed. Layer thickness (LT) was found to be inversely related to roughness in the data. Experimental verification of a theoretical strategy developed by Ahn et al. [32] for forecasting the Ra was also provided. They discovered that changing certain building parameters could enhance the surface characteristic of the FFF parts. Garg et al. [33] examined how building orientation and raster angle affected the Ra of FFF-processed ABS components. The FFF part with the smoothest surface was produced with the raster angle set to 0 degrees in the X direction.
Although the process parameters may be optimized, the surface quality cannot be reduced to an industrially acceptable level. Fine-tuning the parameters requires much time and effort. Thus, many scientists have instead turned to post-processing techniques to improve surface quality [34,35]. Galantucci et al. [36] employed chemical polishing to enhance the surface quality of the FFF-printed components. The maximum Ra value decreased from 11.8 µm to 2.2 µm. The authors [37] used computer numerical control milling to reduce the typical Ra of FFF parts drastically. The FFF components were treated with dichloromethane vapor and NaOH by Jin et al. [38]. Compared to before treatment, the Ra indeed decreased by 88%. Nigam [39] used acetone vapor to smooth the FFF-produced parts, but he was cautious not to melt the 3D-printed components. Traditional post-treatments have been available for quite some time, but they suffer from several drawbacks that render them subpar.
Laser polishing is a relatively recent industrial process that has the potential to improve surface quality. It has several benefits over traditional polishing techniques, such as better suitability for processing complex 3D parts, using less production time, and generating no tool or part wear [40]. As a result of its capacity to improve surface quality, laser polishing has increasingly been used on both metals and non-metals in recent decades [41]. To increase the surface quality of additive manufacturing components, studies have begun to use laser polishing as a post-processing step [42,43]. Using a CO2 laser to polish FFF-printed polylactic acid (PLA) reduces Ra by 68%, as reported by Chai et al. [44]. According to Dewey et al. [45], a CO2 laser was used to post-process 3D-printed PLA components. Upon perfecting the parameters, the roughness was cut by as much as 97%, down to 2.02 µm.
Continuous lasers can produce a stable and steady light beam at a constant power level, making them ideal for cutting, welding, and drilling [46]. The continuous beam of light generated by continuous lasers can cause thermal damage to the processed material due to prolonged exposure to the laser energy. As a result, continuous lasers may not be the best option for applications that require precise control of the energy delivered to the material [47]. In contrast, pulsed lasers emit light in short pulses with a high peak and much lower average power. This makes them ideal for applications that require precise control of the energy delivered to the material, such as laser marking, engraving, and surface treatment [48]. The short duration of the laser pulse allows for high peak powers to be achieved without causing excessive thermal damage to the material. Pulsed lasers can also produce a wide range of pulse shapes and durations, allowing for even more precise control over the energy delivered to the material [49].
With its low error rate, response surface methodology optimization has quickly become one of the most popular optimization techniques and is a valuable tool for determining additive manufacturing process parameters. Several applications exist for response surface methodology-based optimization models, but perhaps the most prevalent is in computer numeric control [50]. Griffiths et al. [51] noted that the response surface methodology is a valuable optimization technique because of the small amount of experimental error it introduces. Models with greater degrees of fit and multi-objectivity are no problem for the response surface methodology approach, making it ideal for improving multi-response 3D printers [52]. Srivastava et al. [53] used response surface methodology to analyze the FFF 3DP material’s process parameters. Selvamani et al. [54] studied and optimized the FFF parameters and found considerable improvement using the response surface methodology approach. To improve the Ra of an FFF 3D printer, Saad et al. [52] used response surface methods, symbiotic creature search techniques, and symbiotic optimization of particle swarms.
The above literature shows that laser polishing may improve the surface quality and aesthetic appearance [45]. However, it is not yet clear how this process may impact the mechanical properties or functionality of the final product over time. Moreover, no research has been conducted on the economic side, lower use of energy, and lower carbon emissions. In previous research [55,56], most of the samples either burned due to the high heat affected zone or remained untreated due to less beam energy, which could affect the result and efficacy of the final polished part. Our research intends to explore how the CO2 laser’s power, focal distance, scanning speed, and hatch distance influence the PLA sample created using the FFF technique. We designed two experiments using the response surface methodology-central composite design technique to obtain a clear and precise polished surface. In the first experiment, some of the samples either burned or remained untreated, and in the second design of the experiment, all the parts were well polished. The impacts of the factors were broadly explored via the response surface methodology method. During the laser polishing process, mechanical properties (tensile strength (TS), flexural strength (FS)) and variables were tested and measured for PLA specimens produced utilizing CR5-creality FFF. Scanning electron microscopy (SEM) analysis was used to determine morphological characteristics. The effects of laser polishing on surface finish and the sustainability factor (scan time) were studied. Finally, a response surface methodology-based multi-optimization was performed to enhance mechanical characteristics, sustainability, and Ra with conflicting comprehensive responses, such as lowest Ra and highest mechanical properties. This is the first study that provides an efficient, economic, and sustainable strategy for improving the surface and mechanical properties of 3D-printed parts with a minimal heat-affected zone by analyzing and optimizing the laser parameters. Moreover, the micro fog was detected for the first-time during SEM morphological analysis, which could create new research pathways for researchers.

2. Materials and Methods

2.1. Materials

A “CR-5” professional 3D printer was used for the experiments, along with PLA polymer filament in a 1.75 mm size purchased from the Kexcelled firm, Suzhou, China. Table 1 displays PLA details obtained from Kexcelled.

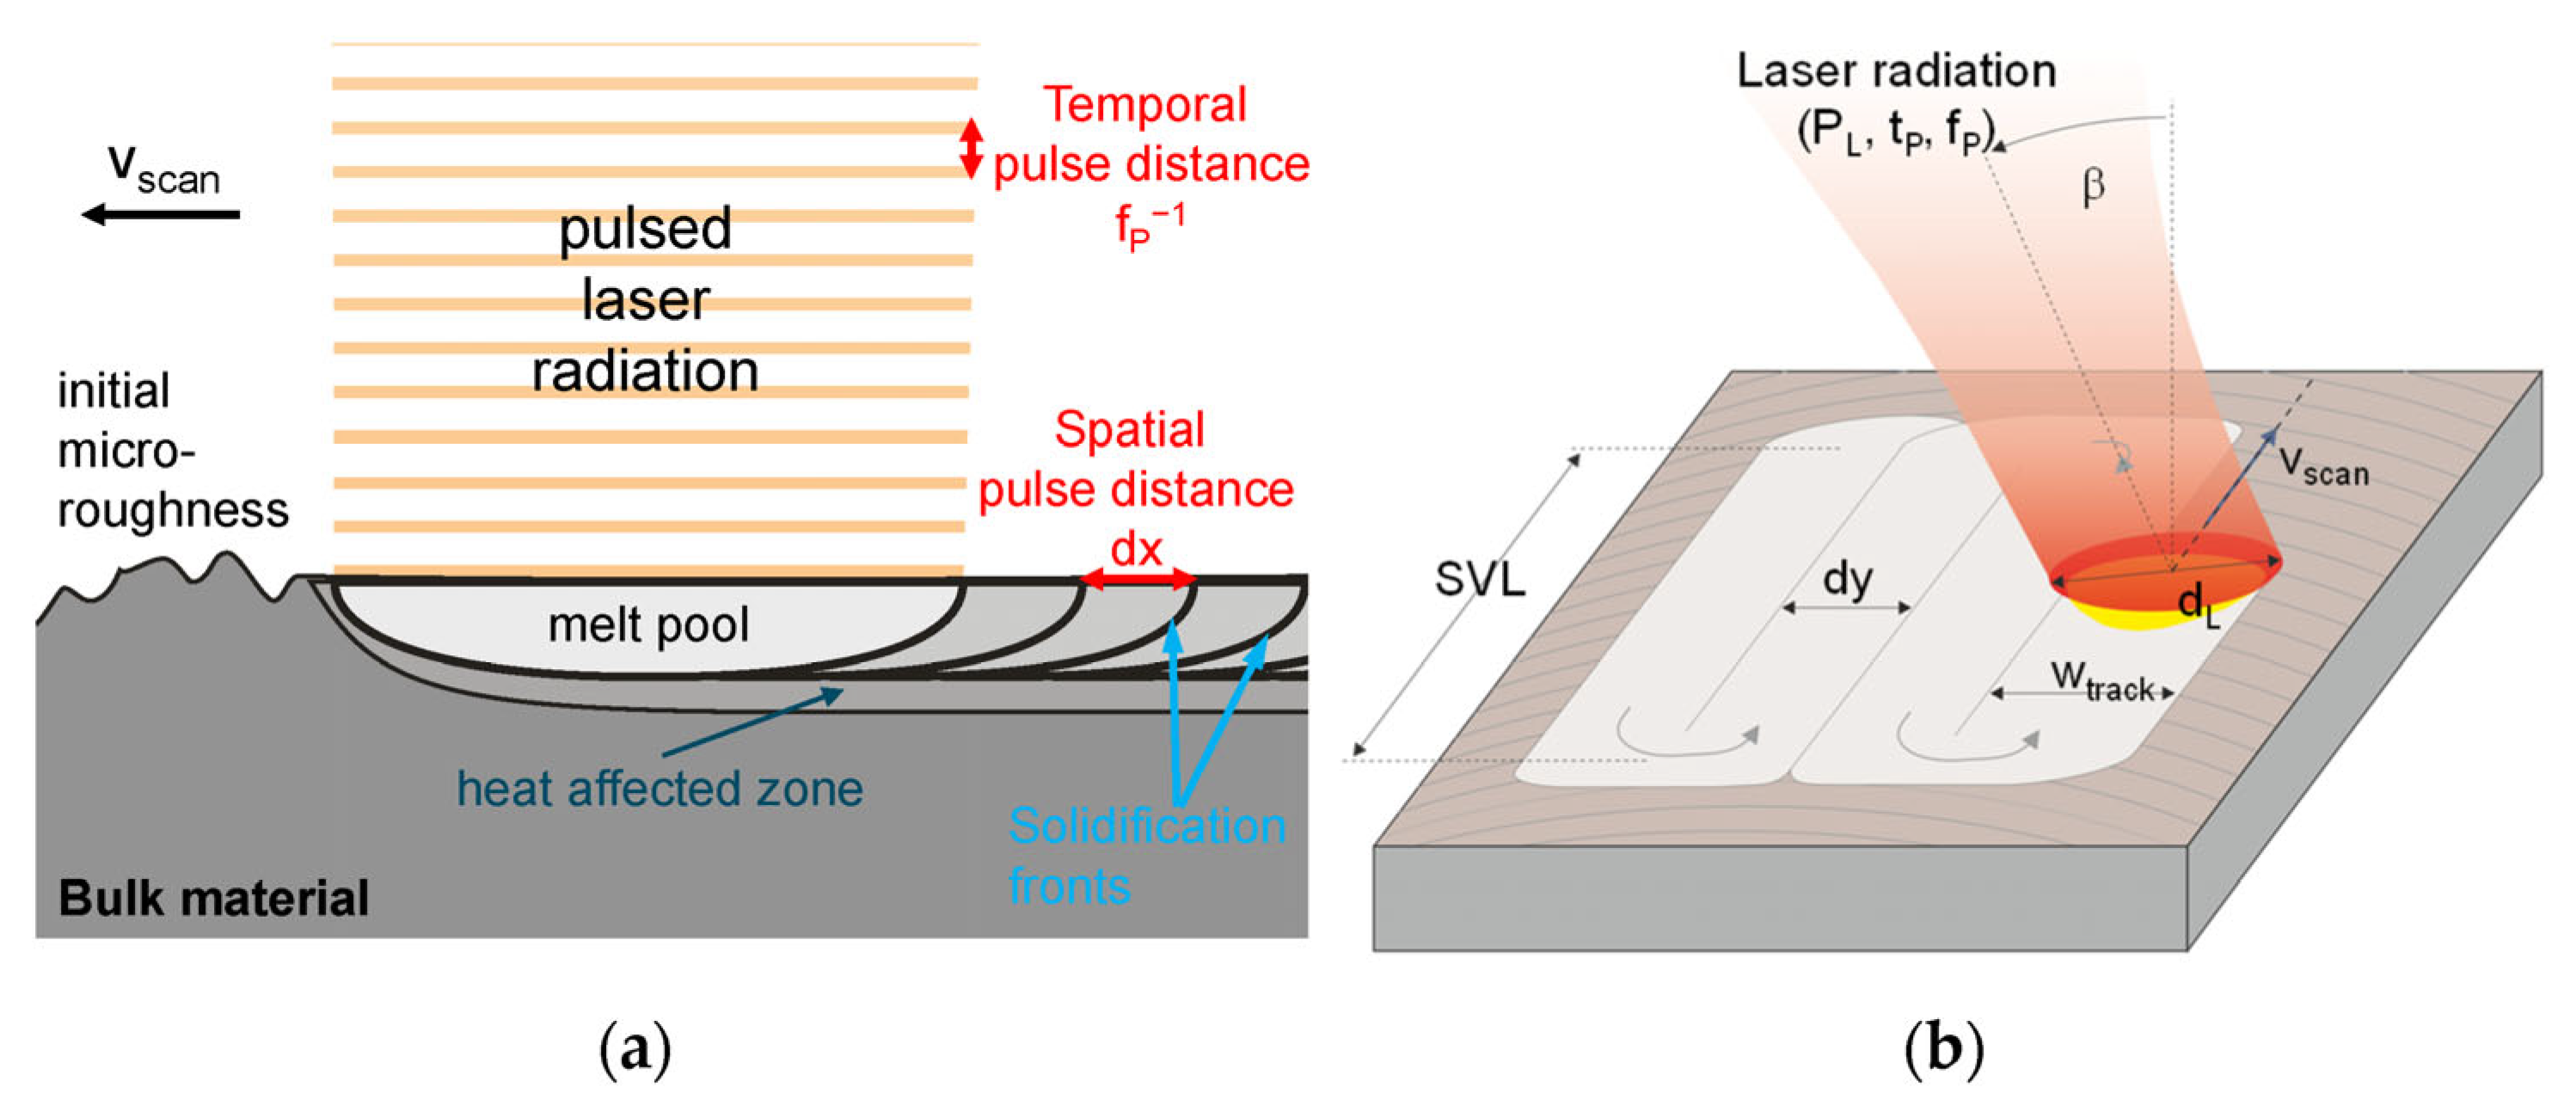
Laser Polishing Procedure

The specimen was polished using a CO2 pulsed laser with an output power of 30 W operating at 10.6 µm, purchased from Shaanxi Donghui Labelling Equipment Co., Ltd. (Shaanxi, China). Laser beams irradiate the sample, as shown in Figure 1. The laser beams create a molten pool, solidifying before the sample is subsequently analyzed. The surface of the anisotropic material melts when the laser is shone on it. The molten material descends from an upper to a lower elevation. The valleys are filled, and the height of the 3D-printed part lessens. The molten pools solidify due to the fast drop in surface temperature once the beam has vanished.
The basic parameters of laser radiation used in the laser polishing procedure include pulse energy, peak power, beam area, and peak power density. The beam diameter (1.8 mm) and the divergence angle (7.5 mrad) characterize the laser spot on the sample’s surface. The calculated exposure parameters are as follows in Equations (1)–(6).
P u l s e   E n e r g y = A v e r a g e   P o w e r R e p e t i t i o n   R a t e = 210   µ J
Peak   power = A v e r a g e   P o w e r Repetition   rate H z × Pulse   width s = 21 W
Beam   area = 2 × A v e r a g e   P o w e r ( π × Pulse   width 2 ) 2 = 2.545 2 cm 2
Average   power   density   ( W c m 2 ) = Average   power   ( W ) Beam   area   ( c m 2 ) = 330.1   W / cm 2
Peak   power   density ( W c m 2 ) = Energy   per   pulse   ( J ) Pulse   width   ( s ) × Beam   area   ( c m 2 ) = 1650   W / cm 2
The laser scanning parameters for sample surface polishing include the laser scan speed and trajectory. In this study, the laser scan speed was adjusted to 200 mm/s, and the laser spot was adjusted perpendicular to the 3D printing layers. The hatch distance ranged from 0.1–0.18 mm, while the focus distance was adjusted between 12–18.5 mm. The laser parameters used in Equations (1)–(5) for laser polishing are summarized in Table 2. Rest of laser parameters are given in Table S1 in Supplementary Materials.

2.2. Preliminary Experimentation for Parameters Selection

2.2.1. FFF Parameters Selection

The reason for choosing high infill density (84%) is that high infill density optimizes the FS and TS, and high print speed (68.8%) helps the material increase the FS and TS because of the high-density interaction at high temperature, which results in the best mechanical properties [58,59]. Similarly, high print speed also helps decrease the print time. In this way, less energy will be used to print the sample [60]. The layer thickness of 0.26 mm was considered because it increases the FS and TS and minimizes the Ra. Thus, at these parameters, we found the highest FS of 70.1 MPa, TS of 39.2 Mpa, lowest Ra of 7.8 µm, lowest print time of 47 min, and print energy of 0.18 kwh.

2.2.2. Laser Parameters Selection

The authors conducted 30 trial experiments on a 120 mm × 120 mm slab using the response surface methodology design as the experimental approach before moving on to the final design of the experiment. We selected four extremely relevant parameters: laser power, focal distance, scan speed, and hatch distance [61,62]. The laser apparatus and the slab for initial trials can be seen in Figure 2a,b, respectively. Initially, we selected four parameters: laser power ranging from 8% to 20%, scan speed from 50–350 mm/s, focal distance from 12–25 mm, and the hatch distance from 0.02 to 0.2 mm. Experiment numbers 15–17 could not be polished due to the combination of highest scan speed and focal distance and the lowest laser power, while the lowest scan speed and hatch distance burnt the samples or increased the heat-affected zone, as shown in Figure 2c. However, the PLA samples 22, 23, and 25 were very well polished, where the laser power was 14% and scan speed was 200 mm/s in all three samples, but the hatch distance and focal distance varied from 0.1 to 0.18 mm and 12 to 18.5 mm, respectively. Thus, it was still necessary to find the best polishing parametric value. Therefore, laser power and scan speed were kept constant at 14 percent and 200 mm/s, respectively. At the same time, the hatch distance and focal distance were selected as variable parameters from 0.1 to 0.18 mm and 12 to 18.5 mm, respectively, as shown in Figure 2d.

2.3. Response Surface Methodology

Technique and experimental design are covered in this section. For the response surface methodology, the central composite design was used to plan and conduct the experiments. Several features specific to the printing technique impact the principal reactions to FFF printing. After analyzing the literature, it was discovered that hatch distance and scan speed are the most significant quantitative input components. The chosen range is affected by several variables, such as the material, mechanical quality, laser machine, and sample geometry. As a result, we based our laser preferences on the findings of earlier research and published clinical trials. Using Design–Expert version 13 (Stat-Ease Inc., Minneapolis, MN, USA), the parameters and their responses for the experiments were established. For a complete analysis, five alternative values exist for each quantitative input parameter (focal and hatch distance). The L13 design of the experiment was created using a full central composite design and an alpha of 1.5 to prevent decimal values in the highest and lowest parameter ranges, as shown in Figure 3a. After the calculations, Design–Expert entered the outcomes into a central composite design table. The laser parameters are shown in Table 3. Figure 3b shows how the part was laser scanned.

Measurement Procedure

Measurements of the mechanical characteristics and morphologies were performed following the laser scanning process. For the TS and FS testing, a GTM 2500 Machine with a 5 kN weight cell was utilized, as shown in Figure 3c,d, respectively, while they were tested at 5 mm/min for TS [63] and 2 mm/min for FS (3-point bending), respectively [64]. TS tests were performed on plastics following ISO 527: 1997 (length = 115 mm, width 19 mm, height 4 mm), and for FS, we referred to ISO 178:2006 (length = 80 mm, width 10 mm, height 4 mm) (plastics: assessment of FS characteristics). To ensure that the specimen did not move during testing, two supports were placed 64 mm apart, and a weight applied to the center of the specimen until it broke. The cylindrical device with a 5 mm radius length was the loading nose. The testing conditions comprised 25 °C and a crosshead speed of 2 mm/s.
An Ra tester manufactured by the ‘JITAI KEYI’ company in China, was used to find the Ra of the FFF-produced component, as shown in Figure 3e. The Ra value is defined by Equation (1) as the geometric mean of the absolute values of the surface profile deviations throughout the entire length away from the centerline. The ISO 16610-211 standard was used to analyze the samples, with a cut-off wavelength of 0.8 mm and a length (Lw) of 4.8 mm [65]. The results of three measurements were then averaged.
R a = 1 L w 0 L w | Z y | d y
where Lw is the sampling length, and Z(y) the coordinates of the profile curve.

3. Results and Discussion

3.1. Analysis of Variance (ANOVA) for Responses

In this work, the representation of the responses by the second-order polynomial (regression) model is as follows:
Z = β 0 + k = 1 m β k X k + k = 1 m β k k X k 2 + k < 1 m β k l X k X l + ε
where Z signifies the expected response, X k and X l are coded input variables, and m denotes the total number of variables. The constant term is denoted by β 0 , the linear regression coefficient by β k , the quadratic term by β k k , the interaction term by β k l , and the random error by ε . An experienced designer analyzed the present work’s regression coefficients and ANOVA method (version 13). For this reason, after the determination of the regression constants, the following actual value regressions were created for TS, FS, scan time, scan energy, scan cost, and Ra in Equations (8)–(11):
T S = 37.0 + 1.1 × f o c a l   d i s t a n c e + 6.3 × h a t c h   d i s t a n c e + 4.3 × f o c a l   d i s t a n c e x   h a t c h   d i s t a n c e 0.05 × f o c a l   d i s t a n c e 2 295.06 × h a t c h   d i s t a n c e 2
F S = 6.26 0.17 x   f o c a l   d i s t a n c e 23.66 × h a t c h   d i s t a n c e
R a = 1 0.958 1.066 x   f o c a l   d i s t a n c e 72.24 × h a t c h   d i s t a n c e + 1.308 × f o c a l   d i s t a n c e × h a t c h   d i s t a n c e + 3.3 × 10 2 × f o c a l   d i s t a n c e 2 + 250.446 × h a t c h   d i s t a n c e
S c a n   t i m e = 150.762 10.058 × f o c a l   d i s t a n c e 541.143 × h a t c h   d i s t a n c e + 2.906 × 10 13 × f o c a l   d i s t a n c e × h a t c h   d i s t a n c e + 0.271 × f o c a l   d i s t a n c e 2 + 1705.761 × h a t c h   d i s t a n c e 2
To identify which process elements had a substantial impact on the dynamic qualities, the regression coefficients were estimated and evaluated using an analysis of variance (ANOVA). The outcomes of the ANOVA tests conducted on each response are shown in Table 4. The second-order regression model was significant when the F-values for all responses (TS = 4.7, FS = 11.41, scan time = 78.45, and Ra = 37.95) were less than 0.05 (p < 0.05). Lack-of-fit p-values, TS = 0.002 and FS = 0.48, were calculated. It was demonstrated that lack of fit was zero when assessed against residual error, even though the p-values for lack of fit for scan time, scan energy, scan cost, and Ra could not be determined. The results for scan time and Ra demonstrate that the lack of fit was minimal or absent, whereas the residual error for FS was significant. The determination coefficient is a statistical measure used to assess how much each regression model fits the data. The ideal determination coefficient is exceptionally high or very close to 1. The significant R2, adjusted R2 and anticipated R2 values for all parameters were identified in the established link. This shows that there is a strong correlation between empirically determined values and theoretically predicted values. The signal-to-noise ratio determines adequate precision, where a perfect quantity is more than 4. The acceptable accuracy for FS and TS in this study was greater than 4, indicating a strong signal.

3.2. Laser Polishing Parametric Effects on Mechanical Properties

The focal distance of the laser may affect the TS and FS properties of 3D-printed components. More significant laser spots result in a rougher surface quality on the component when the focal distance is set to its maximum. Due to the increased likelihood of flaws and voids on an uneven surface, the tensile and FS of the resulting component might be lower. However, the laser spot size decreases as the focal distance decreases, resulting in a finer surface polish. Figure 4d shows that a smooth surface is less likely to include imperfections or cavities that might weaken the component, leading to increased tensile and FS. Although the TS value was lowered in the smaller focal distance (Figure 4a) because of the lower area exposed, the focal distance was only influenced from 44.5 to 45 MPa, and the focal distance could melt well in the middle of the focal distance range.
The scanning laser’s hatch distance may affect the TS and FS properties of a 3D printed component. The hatch distance is an essential parameter in laser polishing since it affects the part’s density and strength. Figure 4b,e for TS and FS illustrates the correlation between hatch distance and density, showing that a smaller hatch distance will result in a greater density and perhaps stronger portion. In contrast, a bigger hatch distance will result in a lighter weight and potentially weaker part. The contour graphs in Figure 4c,f show that the mechanical properties enhance at lower focal and hatch distance levels such as 45 MPa and 71 MPa for TS and FS respectively.
Figure 5c,d shows the experimental result from TS and FS for PLA, respectively. Figure 5a shows the highest TS at experiment number nine (15.25 focal distance and 0.14 hatch distance) with the value of 45.4 MPa, as shown in Figure 5e, which is a well-melted layer, while Figure 5b shows the lowest value of TS at experiment number three (12 focal distance, 0.18 hatch distance) with the value of 42.81 MPa (Figure 5e) because some pore defects were found at experiment number three. Figure 5c shows the highest FS value of 72.33 MPa at experiment number six (20.12 mm focal distance, 0.14 hatch distance), which is a well-melted layer, while the lowest FS value of 68.33 MPa was found at experiment number four (18.5 focal distance, 0.18 hatch distance), where the layer was not fully melted as shown in Figure 5d. Another novel finding during the laser processing of PLA was that smoky waves appeared when the laser polishing was performed with less than 18.5 mm focal distance. The reason for this could be contamination of the 3D-printed surface with micro debris. Our results were in agreement with those of [66].

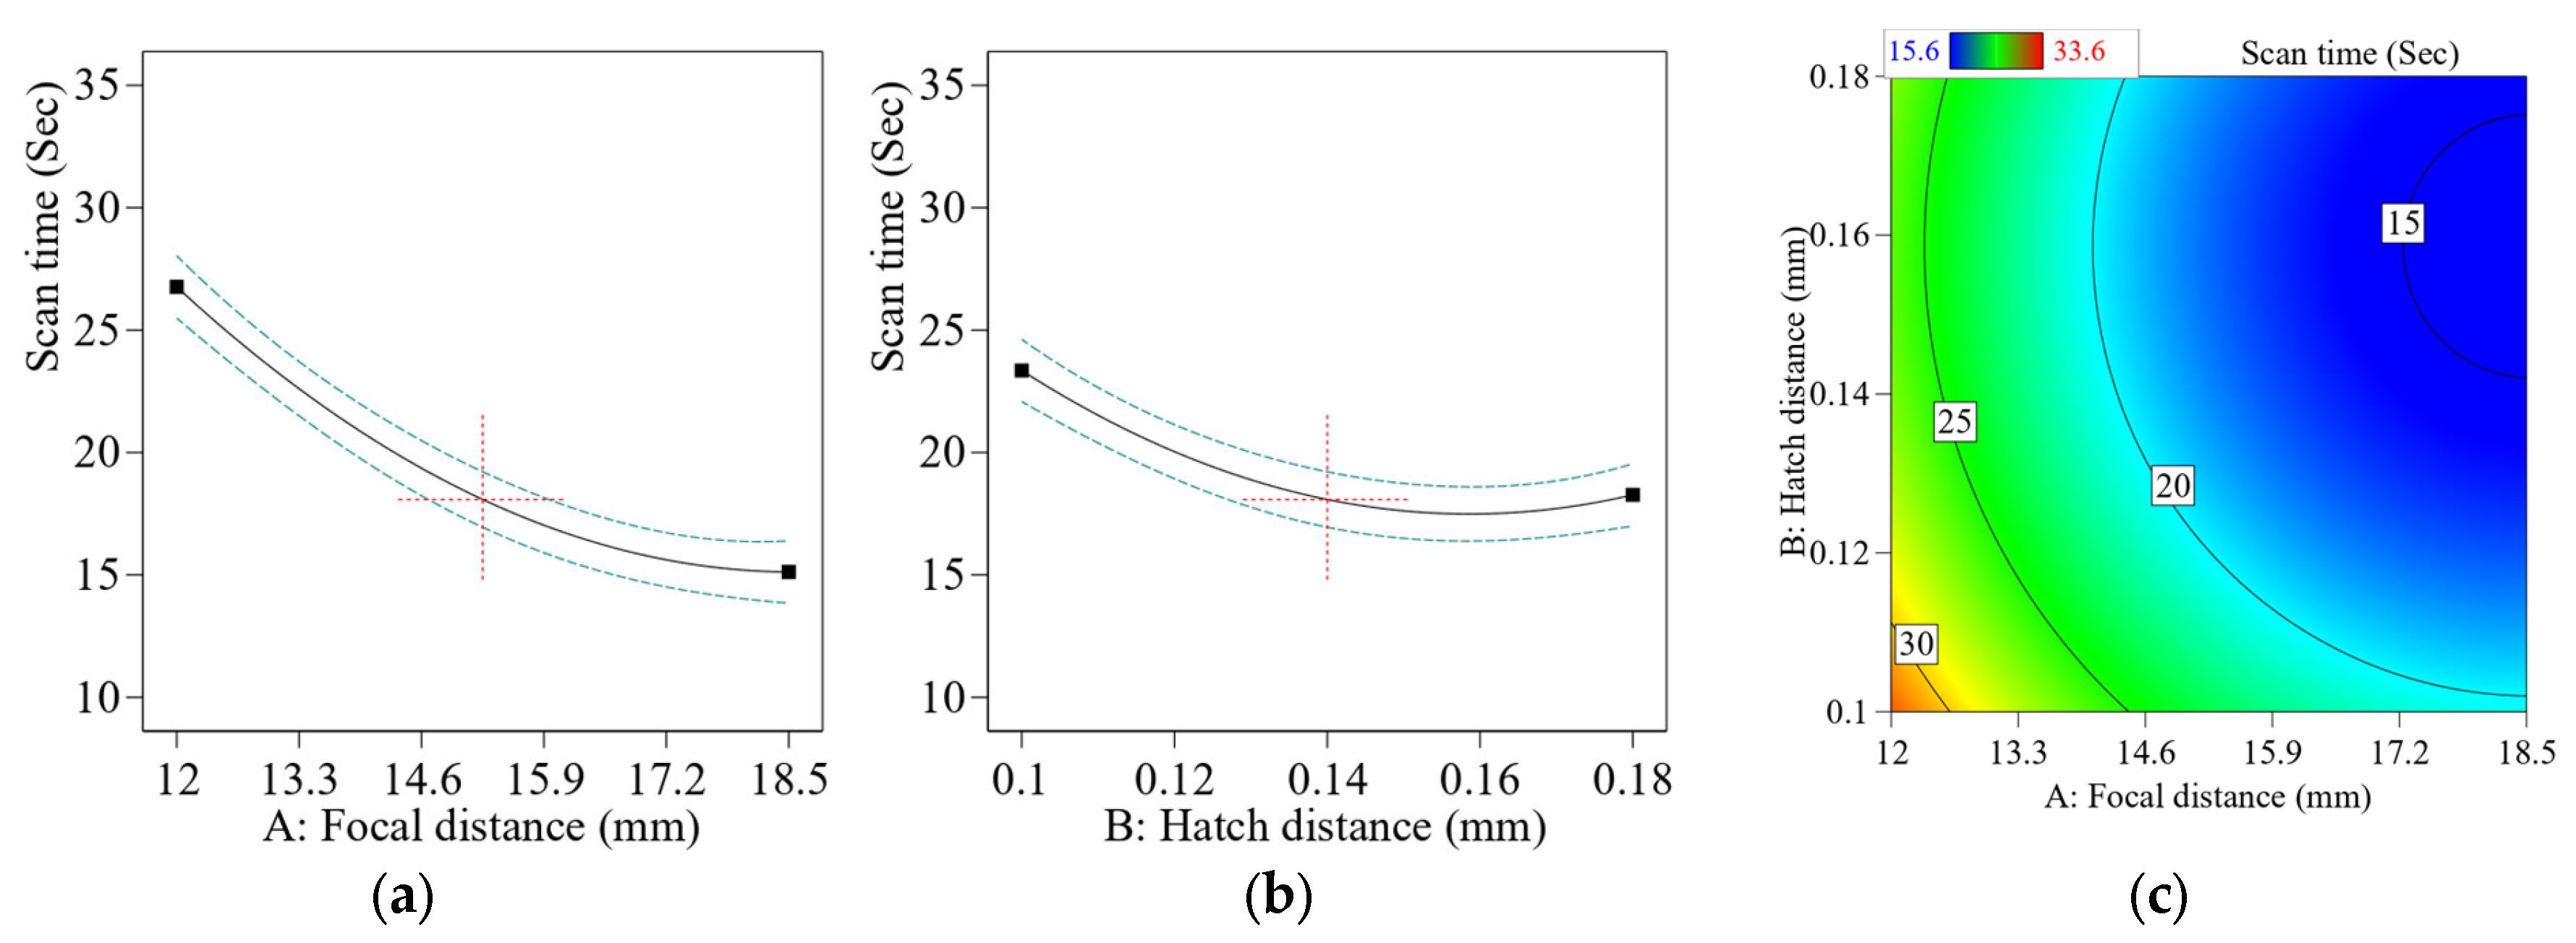
3.3. Effect of Laser Polishing Parameters on Scan Time

The focal distance may affect the laser scan time of a 3D-printed component. With a longer focal distance, the laser spot will increase, and more time is required for the scanner to cross the part’s surface, measured in scan time (Figure 6a). As a result, the total scan time will rise since more laser passes will be required to cover the same region. A decrease in hatch distance improves resolution and detail in the printed output; it also increases laser scan time (Figure 6b) due to the increased number of passes the laser must perform over the build region. A bigger hatch distance results in a lower laser scan time, but at the expense of resolution and detail. The contour graph of hatch distance and focal distance shown in Figure 6c demonstrates that both increases in hatch distance and increase in the focal distance are essential in reducing scan time i.e 15 sec at higher level of focal length and higher level of hatch distance.
The scan time was lowest at experiment number four and six: highest focal distance of 18.5 mm and highest hatch distance of 0.18 mm for experiment number four, and focal distance of 20.2 mm and highest hatch distance of 0.14 mm for experiment number six, also led to a scan time of 15.6 s as shown in Table 3.

3.4. Effect of Laser Polishing Parameters on Ra

The laser beam is directed onto the part’s surface during CO2 laser polishing, where it melts the material in a confined area. The focal distance affects the energy density and amount of material removed, which defines the size of the spot on the surface. A decreased focal distance leads to a smaller spot size, higher energy density, and more efficient removal of surface material, lowering the Ra. A wider focus distance, on the other hand, results in larger spot size, lower energy density, and less effective removal of surface material, which may enhance the Ra value (Figure 7a). Similarly, the hatch distance influences the spacing of laser scanning lines and the degree of heat generated. A smaller hatch distance produces more heat in a smaller region, resulting in a greater smoothing effect and a decrease in Ra (Figure 7b). A greater hatch distance may result in uneven heating and a lower energy density, leading to a less efficient polishing operation and a rougher surface with a higher Ra value. The combined impact of hatch distance vs. focal distance on Ra is shown in Figure 7c. The study found that the Ra value dropped dramatically (1 µm) at the lowest hatch distance and focal distance. Overall, the study supports the idea that optimizing laser polishing parameters is critical to achieving the desired surface characteristics and mechanical response of 3D-printed parts.
Figure 8c presents the Ra response values of all 13 experiments. Figure 8a,b shows SEM images of the highest and the lowest value of Ra, respectively. Figure 8a shows experiment number eight (15.2 focal distance, 0.2 highest hatch distance) of the PLA, which was 3.28 µm, while Figure 9b shows the experiment number seven with the lowest Ra of 0.84 µm at a focal distance = 15.2 mm and lowest hatch distance = 0.08 mm. The layers melted very well and reduced the Ra significantly. This showed that the hatch distance was even more significant than the focal distance. PLA showed a significant reduction in Ra.

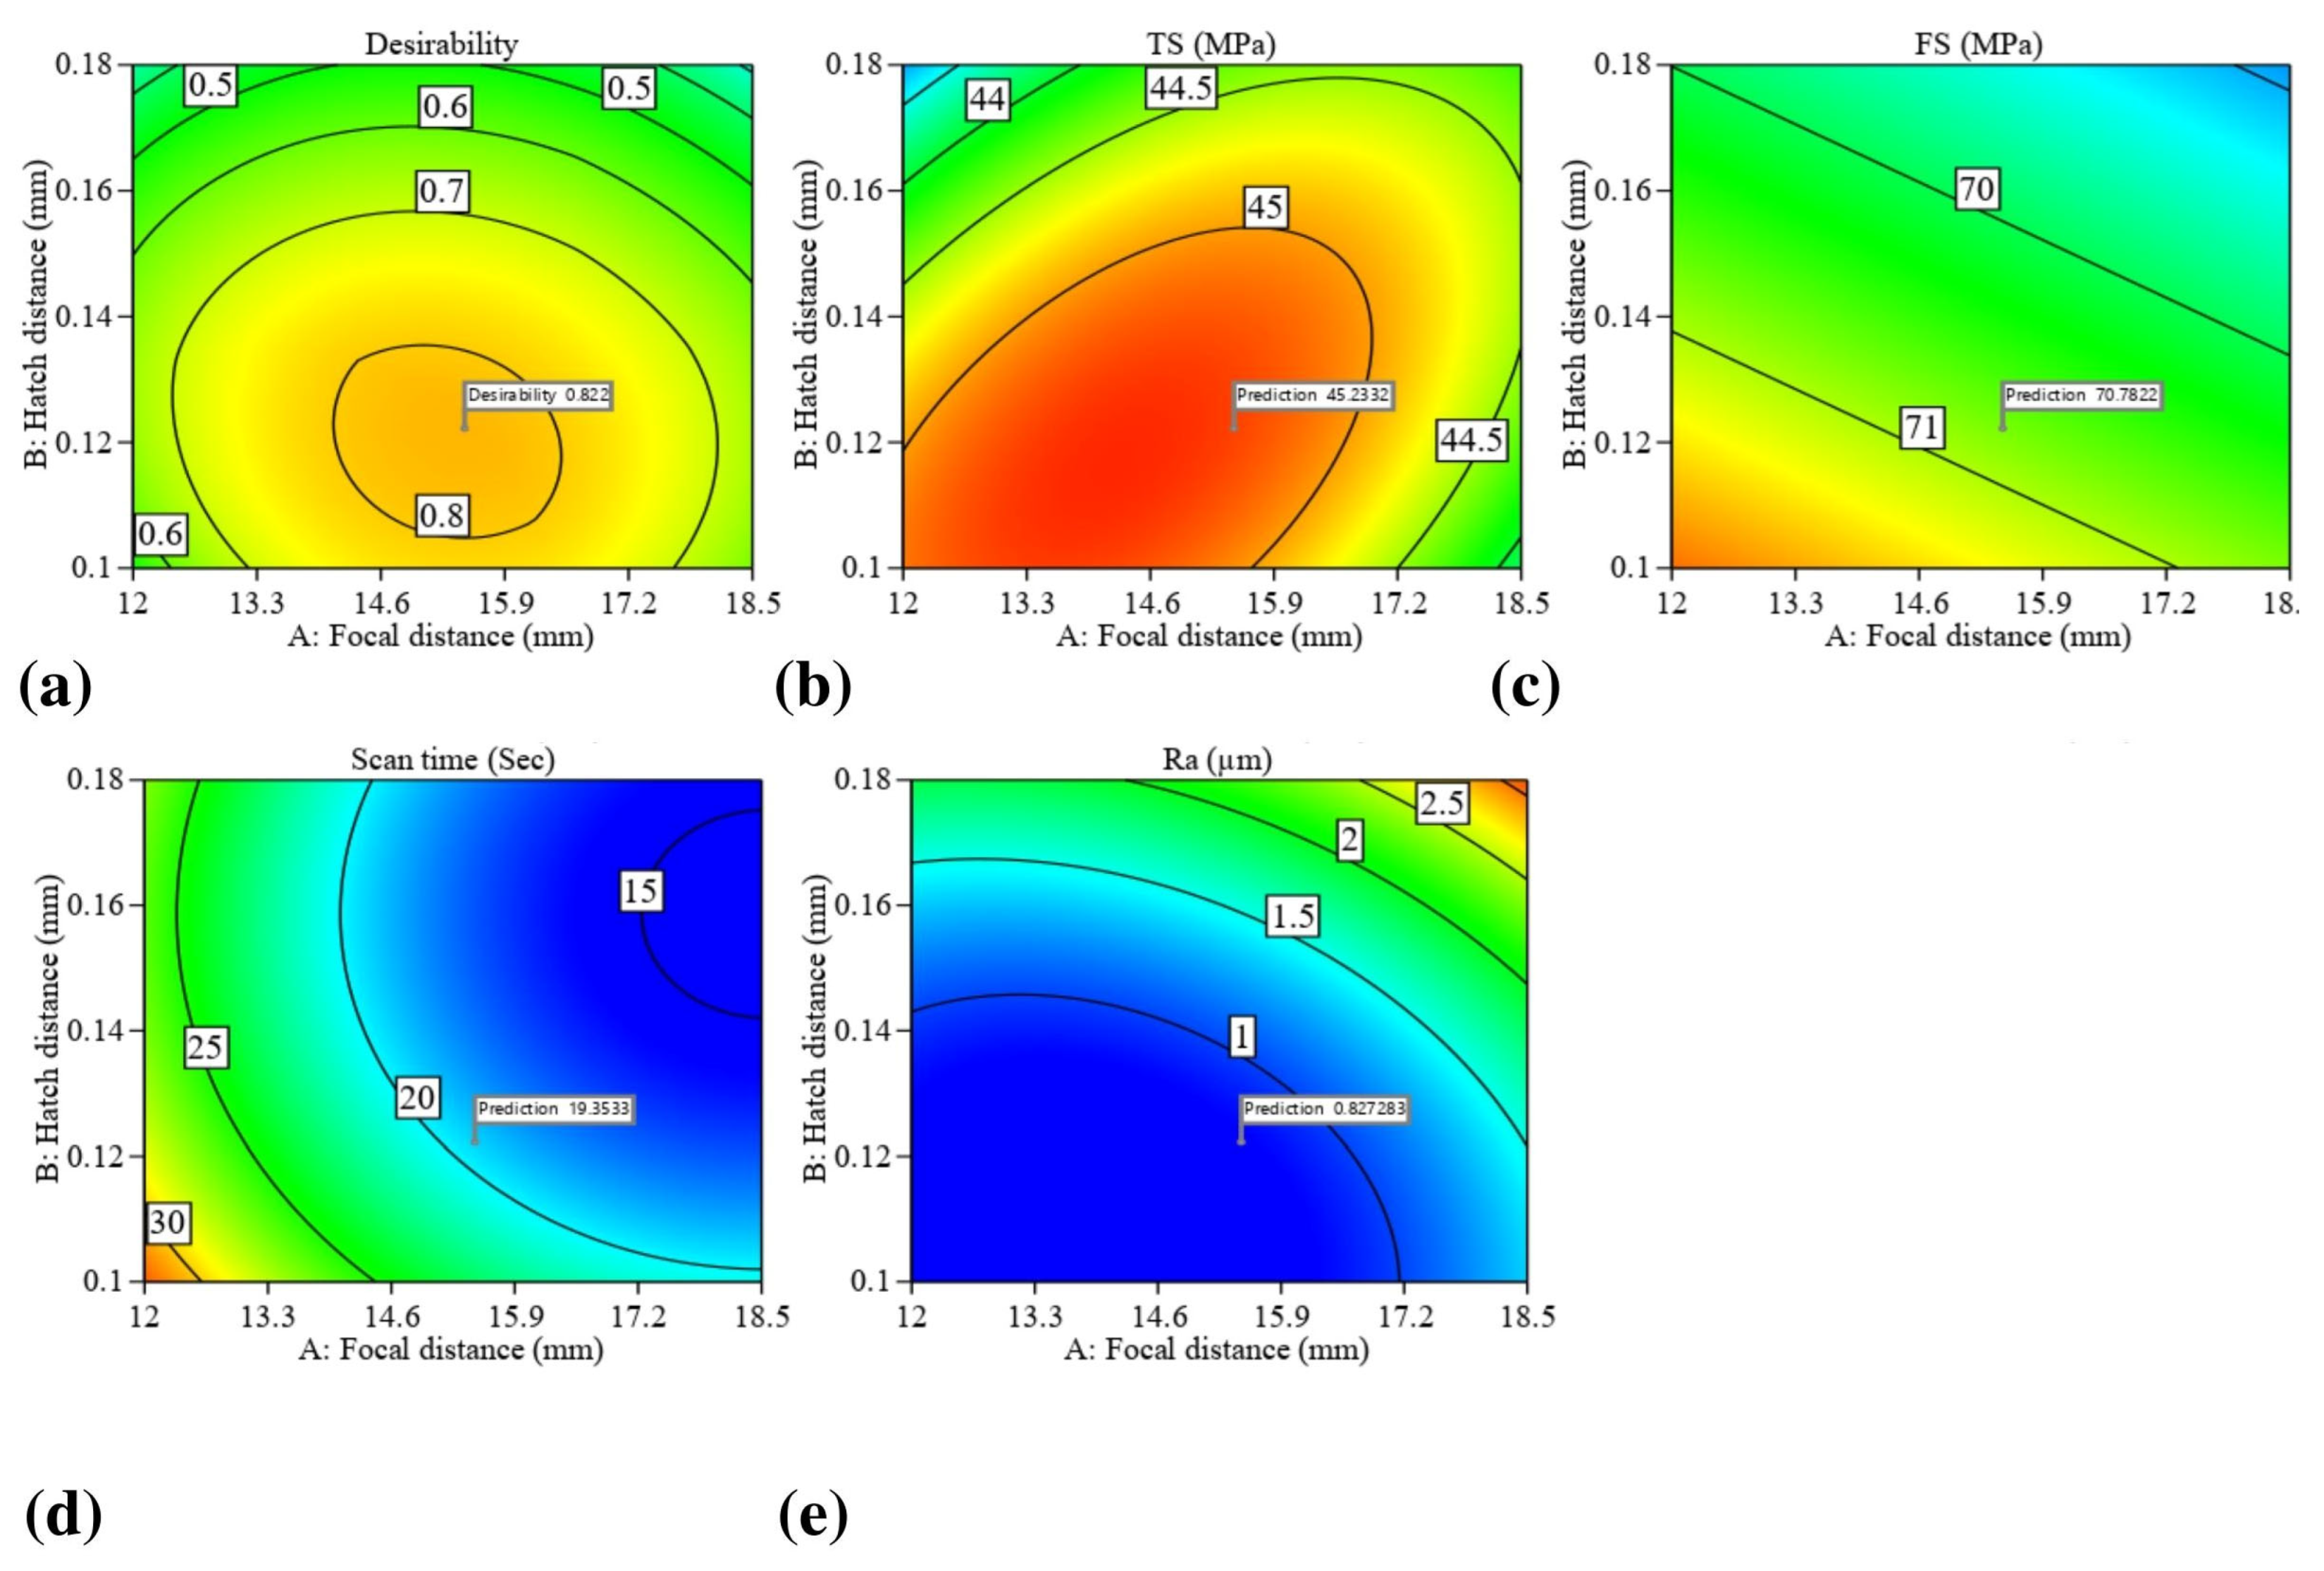
4. Multi-Objective Optimization

A numerical multi-objective optimization was performed to obtain the best mechanical characteristics, the best surface, and the most sustainable model. A numerical optimization is a powerful tool for accomplishing many objectives; the lowest and maximum values it generates may be used directly in fine-tuning laser settings. Numerical optimization results for the laser scanning parameters were constrained to a certain range, while the TS and FS were optimized for maximum value, and the scan time, scan energy, scan cost, and Ra were optimized for least value. Table 5 shows the post-processing optimization goal, condition to achieve the goal, lower and upper limit of parameters, and responses of PLA polymer.
Figure 9a–f and Figure 10a–e are optimization figures generated by the Design–Expert software (Stat-Ease, Minneapolis, MN, USA). Figure 10a,b shows the parameters to optimize the responses, and Figure 9c–f shows the responses in blue. To attain the best possible mechanical properties, including an FS of 70.45 MPa and a TS of 45.13, a scan time of 19.3 s, and a Ra of 1.04 µm, the focal distance and hatch distance must be at 16.2 mm and 0.13 mm, respectively, as shown in Figure 9a–f. The contour’s graphs in Figure 10a–e present the information on where the responses were optimized and show their exact values. This finding corroborates the above results on how the input parameters affect the outcomes. The final step was to check if the numerical optimization of the laser parameters increased mechanical properties, sustainability, and surface morphology. As a result, three samples were produced to double-check the experiment and determine the optimal settings for all the variables.

5. Conformation Test

Table 6 compares the predicted values generated by mathematical models and the laboratory testing results using optimal parameter settings. It was found that the percentage of the difference between the anticipated and experimental values for TS, FS, scan time, and Ra was between 1.17% and 0.96%, 0.69%, and 4.83%, respectively. Therefore, the model’s ability to forecast future events is above average. This demonstrates that the response surface methodology-central composite design successfully achieved outstanding outcomes. The fraction of error was determined using Equation (12).
P r e d i c t i o n   e r r o r   p e r c e n t a g e = A c t u a l p r e d i c t e d a c t u a l 100

6. Conclusions and Prospects

The following outcomes were disclosed from the experimental analysis.
  • Using numerical multi-objective optimization, the optimal printing settings combination for PLA was found to be a focal distance = 15.4 mm, and hatch distance of 0.12 mm, for achieving tensile strength (TS), flexural strength (FS), average surface roughness (Ra), and scan time.
  • The findings showed that Ra was reduced by more than 88.8% using laser polishing (from 7.8 μm to 0.87 μm). The specimen’s TS were raised by 14.03%, from 39.2 MPa to 44.7 MPa. The FS for PLA remained constant before and after polishing at 70.1 MPa with an optimized laser scan time for optimal samples of 19.4 s.
  • For TS, FS, scan time, and Ra, the proportion of deviation from the predicted value to the experimental value as between 1.17% and 0.96%, 0.69%, and 4.83%, respectively. As a result, the model’s execution of predictions was effective.
  • The laser polishing method showed that mechanical characteristics could be significantly improved by applying the optimal laser scanner parameters determined by the response surface methodology. The average values of scan time and Ra were kept to a minimum. To enhance the mechanical properties and printing quality of PLA polymers within the specified range, laser and printing businesses are recommended to employ these optimal printing settings.
  • Smoky waves occurred when the laser polishing was performed with less than 18.5 mm focal distance. The reason could be the contamination of the 3D-printed surface with micro debris. This phenomenon requires further study.
  • The results of the experimental work and those predicted by the PLA statistical equations agreed well. This data may be used as a starting point for identifying the best laser scanning settings, thus saving time on manual procedures for confirming product quality.

Prospects and Recommendation

  • More information on the printing properties of PLA and the laser parameters should be gathered in the future and used to develop industrial models with possible practical applications.
  • We only optimized the sample using a single pass beam; it is advised that the model be optimized as a multi-beam model.

Supplementary Materials

The following supporting information can be downloaded at: https://www.mdpi.com/article/10.3390/cryst13040626/s1, Table S1: Laser parameters.

Author Contributions

R.T.M.: conceptualization, methodology, validation, formal analysis, investigation, writing—original draft preparation; A.I.: data curation, visualization, funding acquisition; Y.W.: funding acquisition, project administration, supervision; A.M.K.: validation, writing—review and editing, M.I.P.: validation, writing—review and editing. All authors have read and agreed to the published version of the manuscript.

Funding

The research grant is funded by (1) the National Key Research and Development Program of China (Grant No. 2019QY(Y)0502), (2) the key research and development program of Shaanxi province (Grant No. 2020ZDLSF04-07), (3) the Fundamental Research Funds for the Central Universities (Grant No. 31020190502009), (4) the Innovation Platform of Bio fabrication (Grant No.17SF0002), (5) University Research Grant (Grant number: UBD/RSCH/URC/RG(b)/2022/027) by Universiti Brunei Darussalam, Brunei.

Institutional Review Board Statement

Not applicable.

Informed Consent Statement

Not applicable.

Data Availability Statement

Not applicable.

Conflicts of Interest

The authors declare no conflict of interest.

Abbreviations

PLAPolylactic acid
FFFFused filament fabrication
RaSurface roughness
TSTensile strength
FSFlexural strength

References

  1. Taylor, G.; Anandan, S.; Murphy, D.; Leu, M.; Chandrashekhara, K. Fracture Toughness of Additively Manufactured ULTEM 1010. Virtual Phys. Prototyp. 2019, 14, 277–283. [Google Scholar] [CrossRef]
  2. Wang, Y.; Ahmed, A.; Azam, A.; Bing, D.; Shan, Z.; Zhang, Z.; Tariq, M.K.; Sultana, J.; Mushtaq, R.T.; Mehboob, A. Applications of Additive Manufacturing (AM) in Sustainable Energy Generation and Battle against COVID-19 Pandemic: The Knowledge Evolution of 3D Printing. J. Manuf. Syst. 2021, 60, 709–733. [Google Scholar] [CrossRef] [PubMed]
  3. Ahmed, A.; Azam, A.; Wang, Y.; Zhang, Z.; Li, N.; Jia, C.; Mushtaq, R.T.; Rehman, M.; Gueye, T.; Shahid, M.B.; et al. Additively Manufactured Nano-Mechanical Energy Harvesting Systems: Advancements, Potential Applications, Challenges and Future Perspectives. Nano Converg. 2021, 8, 37. [Google Scholar] [CrossRef]
  4. Khan, S.B.; Irfan, S.; Lam, S.S.; Sun, X.; Chen, S. 3D printed nanofiltration membrane technology for waste water distillation. J. Water Process Eng. 2022, 49, 102958. [Google Scholar] [CrossRef]
  5. Rehman, M.; Yanen, W.; Mushtaq, R.T.; Ishfaq, K.; Zahoor, S.; Ahmed, A.; Kumar, M.S.; Gueyee, T.; Rahman, M.M.; Sultana, J. Additive Manufacturing for Biomedical Applications: A Review on Classification, Energy Consumption, and Its Appreciable Role since COVID-19 Pandemic. Prog. Addit. Manuf. 2022, 1–35. [Google Scholar] [CrossRef]
  6. Kumar, P.; Zhu, Z.; Nai, S.M.L.; Narayan, R.L.; Ramamurty, U. Scripta Materialia Fracture Toughness of 304L Austenitic Stainless Steel Produced by Laser Powder b e d Fusion. Scr. Mater. 2021, 202, 114002. [Google Scholar] [CrossRef]
  7. Zhen, Y.; Wang, C.; Shen, X.; Chen, Z.; Ramamurty, U.; Zhou, K. Materials Science & Engineering A Additive Manufacturing of Corrosion-Resistant Maraging Steel M789 by Directed Energy Deposition. Mater. Sci. Eng. A 2022, 857, 144032. [Google Scholar] [CrossRef]
  8. Zhao, Y.; Lau, K.B.; Teh, W.H.; Lee, J.J.; Wei, F.; Lin, M.; Wang, P.; Tan, C.C.; Ramamurty, U. By Laser Powder Bed Fusion: A Combinatorial Assessment. J. Alloys Compd. 2021, 883, 160825. [Google Scholar] [CrossRef]
  9. Li, L.; Liu, W.; Wang, Y.; Zhao, Z. Mechanical performance and damage monitoring of CFRP thermoplastic laminates with an open hole repaired by 3D printed patches. Compos. Struct. 2023, 303, 116308. [Google Scholar] [CrossRef]
  10. Ur Rehman, A.; Pitir, F.; Salamci, M.U. Laser Powder Bed Fusion (LPBF) of In718 and the Impact of Pre-Heating at 500 and 1000 °C: Operando Study. Materials 2021, 14, 6683. [Google Scholar] [CrossRef]
  11. Ur Rehman, A.; Sglavo, V.M. 3D Printing of Geopolymer-Based Concrete for Building Applications. Rapid Prototyp. J. 2020, 26, 1783–1788. [Google Scholar] [CrossRef]
  12. Ur Rehman, A.; Mahmood, M.A.; Ansari, P.; Pitir, F.; Salamci, M.U.; Popescu, A.C.; Mihailescu, I.N. Spatter Formation and Splashing Induced Defects in Laser-Based Powder Bed Fusion of AlSi10Mg Alloy: A Novel Hydrodynamics Modelling with Empirical Testing. Metals 2021, 11, 2023. [Google Scholar] [CrossRef]
  13. Ur Rehman, A.; Sglavo, V.M. 3D Printing of Portland Cement-Containing Bodies. Rapid Prototyp. J. 2021, 28, 197–203. [Google Scholar] [CrossRef]
  14. Ur Rehman, A. Additive Manufacturing of Ceramic Materials and Combinations with New Laser Strategies. Master’s Thesis, Nanjing University of Science and Technology, Nanjing, China, 2017. [Google Scholar]
  15. Mahmood, M.A.; Ur Rehman, A.; Pitir, F.; Salamci, M.U.; Mihailescu, I.N. Laser Melting Deposition Additive Manufacturing of Ti6Al4V Biomedical Alloy: Mesoscopic In-Situ Flow Field Mapping via Computational Fluid Dynamics and Analytical Modelling with Empirical Testing. Materials 2021, 14, 7749. [Google Scholar] [CrossRef] [PubMed]
  16. Wang, Y.; Mushtaq, R.T.; Ahmed, A.; Ahmed, A.; Rehman, M.; Rehman, M.; Khan, A.M.; Sharma, S.; Ishfaq, D.K.; Ali, H.; et al. Additive Manufacturing Is Sustainable Technology: Citespace Based Bibliometric Investigations of Fused Deposition Modeling Approach. Rapid Prototyp. J. 2021, 28, 654–675. [Google Scholar] [CrossRef]
  17. Jayanth, N.; Senthil, P.; Prakash, C. Effect of Chemical Treatment on Tensile Strength and Surface Roughness of 3D-Printed ABS Using the FDM Process. Virtual Phys. Prototyp. 2018, 13, 155–163. [Google Scholar] [CrossRef]
  18. Zhou, X.F.; Hsieh, S.J.; Sun, Y.T. Experimental and Numerical Investigation of the Thermal Behaviour of Polylactic Acid during the Fused Deposition Process. Virtual Phys. Prototyp. 2017, 12, 221–233. [Google Scholar] [CrossRef]
  19. Jiang, J.; Lou, J.; Hu, G. Effect of Support on Printed Properties in Fused Deposition Modelling Processes. Virtual Phys. Prototyp. 2019, 14, 308–315. [Google Scholar] [CrossRef]
  20. Golmohammadi, A.H.; Khodaygan, S. A Framework for Multi-Objective Optimisation of 3D Part-Build Orientation with a Desired Angular Resolution in Additive Manufacturing Processes. Virtual Phys. Prototyp. 2019, 14, 19–36. [Google Scholar] [CrossRef]
  21. Li, X.; Wang, Y.; Zhang, B.; Yang, H.; Mushtaq, R.T.; Liu, M.; Bao, C.; Shi, Y.; Luo, Z.; Zhang, W. The Design and Evaluation of Bionic Porous Bone Scaffolds in Fluid Flow Characteristics and Mechanical Properties. Comput. Methods Progr. Biomed. 2022, 225, 107059. [Google Scholar] [CrossRef]
  22. Bao, C.; Wang, Y.; Mushtaq, R.T.; Zhang, K.; Li, X.; Chen, X. Preparation, Characterization, and Curing Kinetics of Elevated and Cryogenic Temperature-Resistant Epoxy Resin Composites. Polym. Test. 2022, 116, 107783. [Google Scholar] [CrossRef]
  23. Mahmood, M.A.; Chioibasu, D.; Rehman, A.U.; Mihai, S.; Popescu, A.C. Post-Processing Techniques to Enhance the Quality of Metallic Parts Produced by Additive Manufacturing. Metals 2022, 12, 77. [Google Scholar] [CrossRef]
  24. Wei, S.; Boon, K.; Jun, J.; Wei, F.; Hock, W.; Zhang, B.; Cheh, C.; Wang, P.; Ramamurty, U. Materials Science & Engineering A Selective Laser Melting of Fe-Al Alloys with Simultaneous Gradients in Composition and Microstructure. Mater. Sci. Eng. A 2021, 821, 141608. [Google Scholar] [CrossRef]
  25. Jamshidian, M.; Promoppatum, P.; Ramamurty, U.; Jhon, M.H. Materials & Design Modulating Fracture Toughness through Processing-Mediated Mesostructure in Additively Manufactured Al-12Si Alloy. Mater. Des. 2022, 215, 110440. [Google Scholar] [CrossRef]
  26. Idury, K.S.N.S.; Narayan, V.C.R.L. Mechanical Behavior of Laser Powder Bed Fusion Processed Inconel 625 Alloy. Trans. Indian Natl. Acad. Eng. 2021, 6, 975–990. [Google Scholar] [CrossRef]
  27. Kechagias, J.D.; Vidakis, N.; Petousis, M. Parameter Effects and Process Modeling of FFF-TPU Mechanical Response. Mater. Manuf. Process. 2021, 38, 341–351. [Google Scholar] [CrossRef]
  28. Molero, E.; Fernández, J.J.; Rodríguez-Alabanda, O.; Guerrero-Vaca, G.; Romero, P.E. Use of Data Mining Techniques for the Prediction of Surface Roughness of Printed Parts in Polylactic Acid (PLA) by Fused Deposition Modeling (FDM): A Practical Application in Frame Glasses Manufacturing. Polymers 2020, 12, 840. [Google Scholar] [CrossRef] [Green Version]
  29. Zhang, A.; Wang, F.; Chen, L.; Wei, X.; Xue, M.; Yang, F.; Jiang, S. 3D printing hydrogels for actuators: A review. Chin. Chem. Lett. 2021, 32, 2923–2932. [Google Scholar] [CrossRef]
  30. Vyavahare, S.; Kumar, S.; Panghal, D. Experimental Study of Surface Roughness, Dimensional Accuracy and Time of Fabrication of Parts Produced by Fused Deposition Modelling. Rapid Prototyp. J. 2020, 26, 1535–1554. [Google Scholar] [CrossRef]
  31. Mushtaq, R.T.; Iqbal, A.; Wang, Y.; Cheok, Q.; Abbas, S. Parametric Effects of Fused Filament Fabrication Approach on Surface Roughness of Acrylonitrile Butadiene Styrene and Nylon-6 Polymer. Materials 2022, 15, 5206. [Google Scholar] [CrossRef]
  32. Ahn, D.; Kweon, J.-H.; Kwon, S.; Song, J.; Lee, S. Representation of Surface Roughness in Fused Deposition Modeling. J. Mater. Process. Technol. 2009, 209, 5593–5600. [Google Scholar] [CrossRef]
  33. Garg, A.; Bhattacharya, A.; Batish, A. Chemical Vapor Treatment of ABS Parts Built by FDM: Analysis of Surface Finish and Mechanical Strength. Int. J. Adv. Manuf. Technol. 2016, 89, 2175–2191. [Google Scholar] [CrossRef]
  34. Zhou, H.; Yang, H.; Yao, S.; Jiang, L.; Sun, N.; Pang, H. Synthesis of 3D printing materials and their electrochemical applications. Chin. Chem. Lett. 2022, 33, 3681–3694. [Google Scholar] [CrossRef]
  35. Singh, G.; Sharma, S.; Mittal, M.; Singh, G.; Singh, J.; Changhe, L.; Khan, A.M.; Dwivedi, S.P.; Mushtaq, R.T.; Singh, S. Impact of Post-Heat-Treatment on the Surface-Roughness, Residual Stresses, and Micromorphology Characteristics of Plasma-Sprayed Pure Hydroxyapatite and 7%-Aloxite Reinforced Hydroxyapatite Coatings Deposited on Titanium Alloy-Based Biomedical Implants. J. Mater. Res. Technol. 2022, 18, 1358–1380. [Google Scholar] [CrossRef]
  36. Galantucci, L.M.; Lavecchia, F.; Percoco, G. Experimental Study Aiming to Enhance the Surface Finish of Fused Deposition Modeled Parts. CIRP Ann. 2009, 58, 189–192. [Google Scholar] [CrossRef]
  37. Boschetto, A.; Bottini, L.; Veniali, F. Finishing of Fused Deposition Modeling Parts by CNC Machining. Robot. Comput. Integr. Manuf. 2016, 41, 92–101. [Google Scholar] [CrossRef]
  38. Jin, Y.; Wan, Y.; Liu, Z. Surface Polish of PLA Parts in FDM Using Dichloromethane Vapour. MATEC Web Conf. 2017, 95, 05001. [Google Scholar] [CrossRef] [Green Version]
  39. Nigam, A.; Tai, B.L. Investigation of In-Situ Surface Polishing for Fused Filament Fabrication. In Proceedings of the ASME 2020 15th International Manufacturing Science and Engineering Conference, Virtual Meeting. 3 September 2020; American Society of Mechanical Engineers: New York, NY, USA, 2020; Volume 84256, p. V001T01A053. [Google Scholar]
  40. Zhang, X.; Chen, L. Effects of Laser Scanning Speed on Surface Roughness and Mechanical Properties of Aluminum/Polylactic Acid (Al/PLA) Composites Parts Fabricated by Fused Deposition Modeling. Polym. Test. 2020, 91, 106785. [Google Scholar] [CrossRef]
  41. Ma, C.P.; Guan, Y.C.; Zhou, W. Laser Polishing of Additive Manufactured Ti Alloys. Opt. Lasers Eng. 2017, 93, 171–177. [Google Scholar] [CrossRef]
  42. Zhu, P.; Zhang, G.; Teng, X.; Du, J.; Jiang, L.; Chen, H.; Liu, N. Investigation and Process Optimization for Magnetic Abrasive Finishing Additive Manufacturing Samples with Different Forming Angles. Int. J. Adv. Manuf. Technol. 2022, 118, 2355–2371. [Google Scholar] [CrossRef]
  43. Li, J.Q.; Xie, H.M.; Ma, K. In-Situ Monitoring of the Deformation during Fused Deposition Modeling Process Using CGS Method. Polym. Test. 2019, 76, 166–172. [Google Scholar] [CrossRef]
  44. Chai, Y.; Li, R.W.; Perriman, D.M.; Chen, S.; Qin, Q.-H.; Smith, P.N. Laser Polishing of Thermoplastics Fabricated Using Fused Deposition Modelling. Int. J. Adv. Manuf. Technol. 2018, 96, 4295–4302. [Google Scholar] [CrossRef]
  45. Dewey, M.P.; Ulutan, D. Development of Laser Polishing As an Auxiliary Post-Process to Improve Surface Quality in Fused Deposition Modeling Parts. In Proceedings of the ASME 2017 12th International Manufacturing Science and Engineering Conference Collocated with the JSME/ASME 2017 6th International Conference on Materials and Processing, Los Angeles, CA, USA, 4–8 June 2017. [Google Scholar]
  46. Pong-ryol, J.; Tae-sok, J.; Nam-chol, K.; Xing, F. Laser Micro-Polishing for Metallic Surface Using UV Nano-Second Pulse Laser and CW Laser. Int. J. Adv. Manuf. Technol. 2016, 85, 2367–2375. [Google Scholar] [CrossRef]
  47. Kumstel, J.; Kirsch, B. Polishing Titanium- and Nickel-Based Alloys Using Cw-Laser Radiation. Phys. Procedia 2013, 41, 362–371. [Google Scholar] [CrossRef]
  48. Vadali, M.; Ma, C.; Duffie, N.A.; Li, X.; Pfefferkorn, F.E. Pulsed Laser Micro Polishing: Surface Prediction Model. J. Manuf. Process. 2012, 14, 307–315. [Google Scholar] [CrossRef] [Green Version]
  49. Chen, L.; Zhang, X. Modification the Surface Quality and Mechanical Properties by Laser Polishing of Al/PLA Part Manufactured by Fused Deposition Modeling. Appl. Surf. Sci. 2019, 492, 765–775. [Google Scholar] [CrossRef]
  50. Li, C.; Xiao, Q.; Tang, Y.; Li, L. A Method Integrating Taguchi, RSM and MOPSO to CNC Machining Parameters Optimization for Energy Saving. J. Clean. Prod. 2016, 135, 263–275. [Google Scholar] [CrossRef]
  51. Griffiths, C.A.; Howarth, J.; De Almeida-Rowbotham, G.; Rees, A. A Design of Experiments Approach to Optimise Tensile and Notched Bending Properties of Fused Deposition Modelling Parts. Proc. Inst. Mech. Eng. B J. Eng. Manuf. 2016, 230, 1502–1512. [Google Scholar] [CrossRef]
  52. Saad, M.S.; Nor, A.M.; Baharudin, M.E.; Zakaria, M.Z.; Aiman, A.F. Optimization of Surface Roughness in FDM 3D Printer Using Response Surface Methodology, Particle Swarm Optimization, and Symbiotic Organism Search Algorithms. Int. J. Adv. Manuf. Technol. 2019, 105, 5121–5137. [Google Scholar] [CrossRef]
  53. Srivastava, M.; Rathee, S.; Maheshwari, S.; Kundra, T.K. Estimating Percentage Contribution of Process Parameters towards Build Time of FDM Process for Components Displaying Spatial Symmetry: A Case Study. Int. J. Mater. Prod. Technol. 2019, 58, 201. [Google Scholar] [CrossRef]
  54. Selvamani, S.K.; Rajan, K.; Samykano, M.; Kumar, R.R.; Kadirgama, K.; Mohan, R.V. Investigation of Tensile Properties of PLA–Brass Composite Using FDM. Prog. Addit. Manuf. 2022, 7, 839–851. [Google Scholar] [CrossRef]
  55. Kaligar, A.B.; Kumar, H.A.; Ali, A.; Abuzaid, W.; Egilmez, M.; Alkhader, M.; Abed, F.; Alnaser, A.S. Femtosecond Laser-Based Additive Manufacturing: Current Status and Perspectives. Quantum Beam Sci. 2022, 6, 5. [Google Scholar] [CrossRef]
  56. Rosa, B.; Mognol, P.; Hascoet, J.-Y. Laser Polishing of Additive Laser Manufacturing Surfaces. J. Laser Appl. 2015, 27, S29102-NA. [Google Scholar] [CrossRef] [Green Version]
  57. Temmler, A.; Cortina, M.; Ross, I.; Küpper, M.E.; Rittinghaus, S.-K. Laser Micro Polishing of Tool Steel 1.2379 (AISI D2): Influence of Intensity Distribution, Laser Beam Size, and Fluence on Surface Roughness and Area Rate. Metals 2021, 11, 1445. [Google Scholar] [CrossRef]
  58. Vidakis, N.; Petousis, M.; Kechagias, J.D. Parameter Effects and Process Modelling of Polyamide 12 3D-Printed Parts Strength and Toughness. Mater. Manuf. Process. 2022, 37, 1358–1369. [Google Scholar] [CrossRef]
  59. Kechagias, J.; Chaidas, D.; Vidakis, N.; Salonitis, K.; Vaxevanidis, N.M. Key Parameters Controlling Surface Quality and Dimensional Accuracy: A Critical Review of FFF Process. Mater. Manuf. Process. 2022, 37, 963–984. [Google Scholar] [CrossRef]
  60. Tamburrino, F.; Graziosi, S.; Bordegoni, M. The Influence of Slicing Parameters on the Multi-Material Adhesion Mechanisms of FDM Printed Parts: An Exploratory Study. Virtual Phys. Prototyp. 2019, 14, 316–332. [Google Scholar] [CrossRef]
  61. Krishnan, A.; Fang, F. Review on Mechanism and Process of Surface Polishing Using Lasers. Front. Mech. Eng. 2019, 14, 299–319. [Google Scholar] [CrossRef] [Green Version]
  62. Mushtaq, R.T.; Wang, Y.; Rehman, M.; Khan, A.M.; Mia, M. State-Of-The-Art and Trends in CO2 Laser Cutting of Polymeric Materials—A Review. Materials 2020, 13, 3839. [Google Scholar] [CrossRef] [PubMed]
  63. ISO 527-1; BSI Standards Publication Determination of Tensile Properties—ISO527 Part1. ISO: Geneva, Switzerland, 2012.
  64. ASTM International. Standard Test Methods for Flexural Properties of Unreinforced and Reinforced Plastics and Electrical Insulating Materials. D790. Annu. Book ASTM Stand. 2002, 1–12. [Google Scholar] [CrossRef]
  65. Teir, L.; Lindstedt, T.; Widmaier, T.; Hemming, B.; Brand, U.; Fahrbach, M.; Peiner, E.; Lassila, A. In-Line Measurement of the Surface Texture of Rolls Using Long Slender Piezoresistive Microprobes. Sensors 2021, 21, 5955. [Google Scholar] [CrossRef] [PubMed]
  66. Chen, L.; Richter, B.; Zhang, X.; Bertsch, K.B.; Thoma, D.J.; Pfefferkorn, F.E. Effect of Laser Polishing on the Microstructure and Mechanical Properties of Stainless Steel 316L Fabricated by Laser Powder Bed Fusion. Mater. Sci. Eng. A 2021, 802, 140579. [Google Scholar] [CrossRef]
Figure 1. Laser polishing procedure including irradiation, melt pool, solid phase, and analysis; (a) laser operation with melt pool, and heat affected zone, (b) direction of laser beams (Figure reprinted from [57] under the license CC-BY 4.0.).
Crystals 13 00626 g001
Figure 2. Primary and final laser polishing: (a) CO2 laser machine used for laser polishing, (b) 120 mm × 120 mm initial slab for experiments, (c) primary polished samples for PLA, and (d) final laser polishing experiments (before polishing of TS, FS samples).
Crystals 13 00626 g002
Figure 3. FFF printed parts, laser procedure, and analysis: (a) FFF—printed parts, (b) laser scanning of FFF-part, (c) TS test, (d) FS test, and (e) Ra test.
Crystals 13 00626 g003
Figure 4. Effect of laser scanning parameters on mechanical properties: (a) TS vs. focal distance, (b) TS vs. hatch distance, (c) 2D-contour plots show interaction effect of hatch distance vs. focal distance on TS, (d) FS VS focal distance, (e) FS vs. hatch distance, and (f) 2D-contour plots show interaction effect of hatch distance vs. focal distance on FS.
Crystals 13 00626 g004
Figure 5. Microscopic images of samples and the experimental results in graphs. (a) SEM sample of exp. seven with highest TS value, (b) SEM sample of exp. three with least TS value because it could not be well polished, (c) SEM sample of exp. Six with highest FS value, (d) SEM sample of exp. four with least FS value, (e) TS experimental results for PLA, and (f) FS experimental results for PLA.
Crystals 13 00626 g005
Figure 6. Effect of laser scanning parameters on sustainability: (a) scan time vs. focal distance, (b) scan time vs. hatch distance, and (c) 2D-contour plots show interaction effect of hatch distance vs. focal distance on scan time.
Crystals 13 00626 g006
Figure 7. Effect of laser scanning parameters on Ra: (a) Ra vs. focal distance, (b) Ra vs. hatch distance, (c) 2D-contour plots show interaction effect of focal distance vs. scan speed on Ra.
Crystals 13 00626 g007
Figure 8. SEM analysis of Ra–PLA and experimental results: (a) SEM image of exp. eight (15.25 focal distance, 0.2 hatch distance), (b) SEM image of exp. seven (focal distance = 15.25 mm and lowest hatch distance = 0.08 mm), (c) graphical representation of each experimental sense value of Ra after laser polishing.
Crystals 13 00626 g008
Figure 9. Post-processing optimization conditions and final responses as result of optimization. (a,b) for parameters, (cf) for the responses.
Crystals 13 00626 g009
Figure 10. PLA multi-objective numerical desirability and response optimization: (a) desirability, (b) TS, (c) FS, (d) scan time, (e) Ra.
Crystals 13 00626 g010
Table 1. Properties of PLA (credit: Kexcelled (http://backend.kexcelled.nl, accessed on 26 February 2023).
PropertiesPLA K5Unit
Density1.24 g/cm3
Flexural modulus2000–3000MPa
TS44–48 (at 100% infill)MPa
Impact strength22–26 (at 100% infill)KJ/m2
Heat resistance50–60 °C °C
Melt temperature160°C
Glass transition temperature60°C
Melt flow rate 7–25g/10 min
Heat deflection temperature57°C
Vicat softening temperature57°C
Table 2. Laser polishing parameters used for polishing on 3D printed samples.
ParameterValue
Average laser power14% of 30 W
Frequency20 kHz
Pulse length10 µs
Area to be polished (for surface roughness sample)8 mm × 8 mm
Table 3. Design of experiments with varied laser exposure parameters.
Experiment NumberFocal Distance
(mm)
Hatch Distance
(mm)
Laser Scan Time
1120.133.6
218.50.121
3120.1828.2
418.50.1815.6
510.30.1431.8
620.10.1415.6
715.20.0827
815.20.219.8
915.20.1418
1015.20.1418
1115.20.1418
1215.20.1418
1315.20.1418
Full central composite design methodology was used which allowed choosing 13 varied experiments, including eight non-center points (exp. 1–8) and five center points (exp. 9–13) in order to improve the precision of experimental error estimation.
Table 4. Response analysis of regression models.
ResponseR2Adj-R2Pre-R2PrecisionF-ValueLack of Fitp-Value
TS77.2160.9357.885.474.70.002<0.038
FS69.5363.3947.419.4111.410.48<0.0026
Scan time98.2597.0087.524.5978.45 <0.0001
Ra96.3893.874.1116.2637.95 <0.0001
Table 5. Post-processing optimization goal, condition to achieve the goal, lower and upper limit of parameters and responses of PLA polymer.
NameTypeUnitGoalLower LimitUpper LimitImportance
A: Focal distanceParametermmis in range1218.53
B: Hatch distanceParametermmis in range0.10.183
TSResponseMPamaximize42.8145.43
FSResponseMPamaximize68.3372.333
Scan timeResponsesecminimize15.633.63
RaResponseµmminimize0.843.283
Table 6. Predicted parameters, predicted responses, experimental responses, and error by multi-objective response surface methodology optimization.
Predicted Process ParametersResponsesPredicted ResponseExperimental ResponseError %
NameUnitValueNameUnitValueValueValue
Focal distancemm15.4TSMPa45.2344.71.17
Hatch distancemm0.12FSMPa70.7870.10.96
Scan timesec19.319.40.69
Raμm0.8270.874.83
Disclaimer/Publisher’s Note: The statements, opinions and data contained in all publications are solely those of the individual author(s) and contributor(s) and not of MDPI and/or the editor(s). MDPI and/or the editor(s) disclaim responsibility for any injury to people or property resulting from any ideas, methods, instructions or products referred to in the content.

