1. Introduction
The turn of the century brought an expansion of the counterfeiting of medicines, or at least the consciousness of the problem [
1,
2]. Several “epidemic diseases” in developing countries had been related to falsified or low-quality medicines. As an example, the observation of fatal renal problems in children in Bangladesh, which were caused by the presence of ethylene glycol in paracetamol elixir [
3]. Similarly, many deaths due to malaria in Southeast Asia had been related to falsified artesunate [
4,
5,
6]. In broad terms, the WHO defines falsified medical products to be those that are deliberately/fraudulently misrepresented with respect to their identity, composition or source. This includes the substitution, adulteration or reproduction of an authorized medical product or the manufacture of a medical product that is not an authorized product [
7,
8,
9], [
10] (pp. 195, 197, 243).
At least nine types of falsification can be distinguished [
10,
11], the first being products that contain the same active pharmaceutical ingredient (API) and excipients as the original medicine, are correctly packaged and labelled but are illegally imported and distributed. Other types of falsification are products that have the original packaging, and contain the same ingredients as the genuine medicine but contain incorrect amounts of ingredients. Another type of falsification comprises products that, despite being identical from an external point of view and having genuine packaging, contain no active ingredients. There are also products that, despite being identical from an external point of view and having similar packaging, contain different excipients than the original medicine. Outwardly, these products look similar to the original in their genuine packaging but contain different or harmful substances instead of the declared active ingredients. The next category is known products with counterfeit packaging and the correct amounts of active ingredients. There are also products with counterfeit packaging but with different amounts of active ingredients. Others are products with counterfeit packaging that contain a different active ingredient. Finally, there are products with counterfeit packaging that do not contain active ingredients. These categories, all being intellectual property rights offences, are of different importance from the patient’s health point of view. Hence, the external view and the packaging are less important than the product composition, and then the excipient content (if neutral) is less important than the active ingredient content, and finally, a lower dose is less harmful (especially in the case of the title Viagra) than a higher dose.
According to the WHO, in a period from 2013 to 2017, the main categories of substandard and falsified products were anti-malarial (19.6%), antibiotics (16.9%), anesthetics and painkillers (8.5%), lifestyle products (8.5%), cancer medicines (6.8%) and others (39.7%) [
12] (p. 12), [
13].
Although there are not many known serious problems with pharmaceutical products containing phosphodiesterase type-V inhibitors, they are the most frequently falsified medicinal products encountered in Europe and in other developed countries of the world. As far as this applies to all products from this group, the most frequently falsified product is Viagra from Pfizer, and therefore, our attention was mainly aimed at this product as an example in the group. Our experience, as well as data reported by Pfizer [
14], show that the majority of counterfeit Viagra tablets contain no API (24%) or a lower dose of the active ingredient (57%), and only rarely a higher dose of it (9%). Another issue is the possible risk connected with substandard medicines [
15]. This is very often connected with the low quality of active ingredients, which was shown lately by Keizers et al. for sildenafil found in falsified erectile dysfunction products [
16]. In recent years, we have studied many samples of Viagra using X-ray powder diffraction (XRPD). We showed previously that this method could be used as a very convenient “fingerprint” method, enabling distinguishing between original and falsified products even by non-professionals [
17]. The XRPD method is, however, a very powerful method of qualitative analysis. In the case of falsified products, it could be used to identify not only active ingredients but also different excipients, including those not declared by the manufacturer of the original product, which is sometimes hard to identify using standard high-performance liquid chromatography (HPLC) or spectroscopic methods. One of the very important issues that could be solved by X-ray diffraction is the problem of distinguishing between polymorphic forms or different solvates of a given chemical substance. Such forms differ from each other significantly in their powder diffraction patterns, which we have also demonstrated previously for Acomplia samples [
18].
Analytical Methods Used in Counterfeit/Falsified Medicines Investigations
Several physicochemical methods have been employed lately to distinguish falsified products from original medicinal products. The methods range from very simple, e.g., thin-layer chromatography [
19], proposed for movable field laboratories, to more expensive and sophisticated methods based on near-infrared (NIR) or Raman spectroscopy [
20], utilized in equipment used by customs and border police for drug enforcement purposes to laboratory methods used both in qualitative and quantitative analyses. Some methods, such as NIR, were demonstrated to be suitable as characteristic fingerprints (even without sample preparation) and can be used in cluster analyses in combination with chemometric methods [
21]. Other methods, e.g., XRPD, as we tried to show some years ago for Viagra [
18], can be used as fingerprints of the product even without any mathematical or statistical treatment. Importantly, some of the methods such as NIR, XRPD or Raman spectroscopy are non-destructive methods and can be used not only as fingerprinting but also as qualitative methods. Many spectroscopic methods give spectra characteristics not only for APIs but also for crystalline excipients [
22]. It was demonstrated for instance that the Raman method gives characteristic spectra for both API and almost all excipients declared in original Viagra [
23]; but, as shown there, the Raman spectra of sildenafil citrate and the finished product are very similar and not discernible for non-professionals. The same applies to Fourier-transform infrared spectroscopy (FTIR) when using the attenuated total reflectance (ATR) method. Both Raman and FTIR spectrometers can be relatively small and in the case of Raman even hand-held. It is different in the case of X-ray diffractometers which are, even in the smallest benchtop version, much bigger and more expensive than the former. Contrary to other methods, however, XRPD is a method of choice for all crystalline materials, especially for inorganic or mineral substances which give very sharp and characteristic diffraction patterns.
Mass spectrometry (MS) coupled to liquid chromatography (LC) is very useful in falsified medicines analysis. The use of a time-of-flight (TOF) analyzer is helpful, as it allows accurate mass measurements, and hence the assessment of empirical formulas of unknown analogues of API [
24]. Using only MS spectra to identify unknown substances is not sufficient, as different substances could have the same empirical formula but different fragmentation patterns; therefore, using quadrupole and MS/MS mode is obligatory. The advantages of LC–QTOF-MS include its high specificity, sensitivity and ability to identify unknown substances. The QTOF-MS/MS uniquely offers three dimensions of identification information simultaneously on all results: precise mass, isotopic pattern and MS/MS fragmentation pattern.
2. Materials and Methods
2.1. Standards and Reagents
2.1.1. XRPD
Sildenafil citrate from a not-registered manufacturer secured by border police was applied in X-ray studies as the working standard. The quality of this chemical was checked using XRPD and HPLC techniques comparing it with the sildenafil citrate standard from Polpharma (Starogard Gdański, Poland).
Calcium hydrogen phosphate dihydrate (CaHPO4·2H2O), calcium carbonate (CaCO3) and calcium sulphate hemihydrate (CaSO4·0.5H2O) were from Chempur(Piekary Śląskie, Poland); cellulose (microcrystalline) and corn starch were from Sigma Aldrich, (Saint Louis, MO, USA), whereas lactose hydrate was from POCH, (Gliwice, Poland).
Calcium sulphate hemihydrate comprised a mixture of two phases, calcium sulphate (anhydrite CaSO4) and calcium sulphate dihydrate (gypsum CaSO4·2H2O). Hence, we cannot use bassanite (calcium sulphate hemihydrate) in constructing calibration curves. Therefore, we decided to use gypsum instead. Gypsum is a soft crystalline mineral. To be sure to have a pure polymorphic form, we decided to use a large monocrystal (from a natural source). We micronized the gypsum sample in an agate mortar. The powder was sieved through the sieve and then analyzed by XRPD. The analysis confirmed the single-phase form of calcium sulphate dihydrate.
2.1.2. LC-DAD, LC-QTOF-MS
Methanol purchased from Merck Millipore (LiChrosolv; Darmstadt, Germany), acetonitrile from AppliChem (Maryland Heights, MO, USA) and formic acid from Fluka (a subsidiary of Merck Millipore), all of LC-MS grade, and doubly distilled water additionally purified in the Nanopure Diamond UV Deionization System from Barnstead (a part of Thermo Fisher Scientific, Waltham, MA, USA) were used throughout. Sildenafil citrate was supplied by Polpharma.
2.2. Samples
Three control samples C01, C02 and C03 of known concentration and two real falsified samples, denoted F01 and F02, of unknown compositions were analyzed. Many real falsified samples were submitted by the police to our laboratory for testing; however, only F01 and F02 samples were selected because they contained sildenafil citrate, gypsum and microcrystalline cellulose. The composition was confirmed by the XRPD technique. Both samples consisted of pale blue (F01) or blue (F02) rounded-diamond-shape film-coated tablets with “Pfizer” imprinted on one side and “VGR100” on the other side. The imprints suggested a declared dose of 100 mg of sildenafil.
The samples C01, C02 and C03 were prepared in our laboratory and contained only sildenafil citrate, calcium sulphate dihydrate and microcrystalline cellulose. The concentrations of C01 were 74.6 mg (16.14%) + 22.7 mg (4.91%) + 365.0 mg (78.95%), respectively. The total weight of the sample was 462.3 mg. The concentrations of C02 were 45.0 mg (8.32%) + 141.3 mg (26.13%) + 354.5 mg (65.55%), respectively, and the total weight was 540.8 mg. The concentrations of C03 were 87.2 mg (20.31%) + 114.6 mg (26.69%) + 227.5 mg (52.99%), respectively, and the total weight was 429.3 mg.
2.3. XRPD Analysis
The availability of standard samples or calibration coefficients and the frequency of analysis determine the choice of a quantitative or semi-quantitative XRD method. If the analyte is pure, the single or dual line addition model applies, but it results in the contamination of samples. The reference intensity ratio (RIR) method can be used for all reflections or can be limited to a few reflections for mixtures where all phases can be detected. This method is not applicable here due to some identification problems, the lack of references in the database or the lack of structural information. The Rietveld method involves the use of crystallographic structures and calculates powder diffractograms for initial parameters that describe an instrument. Finally, the curves of all phases are summed, the background is added, and sometimes curves calculated by the LeBail or the Pawley methods are added. The result is compared with the experimental measurement. The ratio of each phase can then be adjusted to obtain the best fit for the experimental data. This allows the phase ratio to be determined. Apart from the disadvantage of refinement of crystal structures from powder data, it also requires the knowledge of the crystal structure of each of the phases. The presence of an amorphous phase makes this task even more difficult.
Well-known calibration line methods apply for the straight line with the correlation
Ci =
f(
Ii) such as the general model, the straight line calibration model, the internal standard model and the matrix flushing model. The linear regression method applies to different substances with similar absorption coefficients. The correlation equation
Ci =
f(
Ii) presented below is more general and can be useful when the absorbance of all samples is not the same and for a nonlinear calibration curve. It is intended to be an easy-to-use method for semi-quantitative X-ray powder diffraction analysis. A visualization of the steps and performed decisions to convert intensity into estimated concentration [%] and/or mass [mg] is shown in
Figure 1. To simplify the illustration, the procedures for repeating the intensity determination of reflections with different backgrounds around a reflection to obtain more data and calculate arithmetic averages have been omitted.
2.3.1. Instrumentation
X-ray powder diffraction was carried out using a Bruker D8 Advance diffractometer. The Bragg–Brentano configuration with a θ-θ goniometer was used with a 1D position-sensitive detector Våntec. The CuKα monochromatic radiation was applied. For qualitative analyses (denoted QA), the applied 2θ range was usually between 5° and 60° and a step size of 0.021° or sometimes smaller (0.014° or 0.007°) was used. However, for quantitative analyses, a step size of 0.014° or sometimes 0.007° was used (denoted S-QTY). The 2θ range depends on the sample, e.g., for sildenafil citrate the 2θ range between 6.6° and 11° was used.
The best ratio between a step size and a measurement time per step was chosen to obtain optimal parameters and measurement times as short as possible. All diffractogram interpretations were performed using EVA software from Bruker AXS [
25] and powder diffraction databases. Samples were prepared at 298 K and mounted in PMMA specimen holders with a 25 mm diameter and a depth of ~0.7 mm.
2.3.2. Determination of Intensity
For intensities calculation, the EVA software from Bruker [
25] was used. However, because some reflections might overlap, the “FPM Model” or “FPM Evaluation” tools were applied. As an alternative method to perform deconvolution of reflections, the TOPAS software from Bruker [
26] or a non-commercial alternative, e.g., the Fityk software [
27] can be used.
2.3.3. Calibration Curves
Intensities for calibration curves were determined several times for the same diffraction pattern using EVA V14. Different approaches were tested. Reproducible and similar results from various techniques were obtained when a Fourier transform and manual background determination were used. The calibration curves for reflections located in different positions from the 2θ range up to ca. 30° can be significantly different. This is because of various illuminations of the sample in the Bragg–Brentano configuration and because of Lorentz–polarization correction [
28]. Determination of the sulphate concentration may allow for assessment of the absorption of the mixture, which may be a better approach to estimating the concentration of sildenafil in the sample. We describe a methodology using an example of a sample containing sildenafil citrate, calcium sulphate dihydrate and microcrystalline cellulose, which is usually amorphous. There are four possible combinations of two-phase calibration curves: two combinations for sildenafil citrate (i) in calcium sulphate dihydrate and (ii) in microcrystalline cellulose; and two combinations for calcium sulphate dihydrate (iii) in sildenafil citrate and another (iv) in microcrystalline cellulose. Calibration curves were prepared based on reference mixtures with the compositions mentioned above (see
Figure 2,
Figure A1,
Figure A2,
Figure A3,
Figure A4,
Figure A5 and
Figure A6 in
Appendix C,
Figure A9 in
Appendix F).
On the calibration curves (e.g.,
Figure 2a), we have omitted the ranges between low concentrations of sildenafil and 100% because we expect only low concentrations of the active ingredient in falsified products. This can be seen as a mistake, but it is intentional. Higher concentrations are more harmful to humans and should be detectable even if there are no points on the curve.
2.3.4. The Choice of Reflections—Selection of Measurements Ranges
The most crucial issue in the good performance of quantitative analysis is the proper choice of reflections, the intensities of which will be used in further calculations. The possible choices of characteristic reflections for sildenafil citrate and calcium sulphate dihydrate are presented in
Figure 3. For sildenafil citrate in calcium sulphate dihydrate (i), three reflections at 2θ ≈ 7.22°, 8.2° or 10.2° could be used. For sildenafil citrate in microcrystalline cellulose (ii), three reflections at 2θ ≈ 7.2°, 8.2° or 10.2° could also be used.
For calcium sulphate dihydrate in sildenafil citrate (iii), more reflections could be used, e.g., at 2θ ≈ 11.6° or 33.3°. However, the reflection at 2θ ≈ 11.6° is overlapping with the very weak reflection from sildenafil citrate at 2θ ≈ 11.4°. The reflection at 2θ ≈ 23.3° is overlapping with the very weak reflection from sildenafil citrate. The reflection at 29° is localized between two reflections at 28.8° and 29.3° from sildenafil citrate—these are hard to separate.
Similarly, many reflections, e.g., at 11.6° or 33.3°, could be used for calcium sulphate dihydrate in microcrystalline cellulose (iv). The reflection at 23.3° is on the slope of a broad amorphous profile of microcrystalline cellulose, but both can be deconvoluted.
2.4. LC-DAD and LC-QTOF-MS Analysis
2.4.1. Instrumentation and Conditions
A tandem mass spectrometer micrOTOF-QII from Bruker Daltonik (Bremen, Germany) with a time-of-flight analyzer (TOF) coupled to a high-performance liquid chromatography (HPLC) Ultimate 3000 system (Thermo Scientific, Dreieich, Germany) was used. The MS conditions were as follows: ESI positive ion mode, dry gas flow rate 8.0 L·min−1, dry heater 180 °C, capillary voltage 4500 V, end plate offset −500 V, MS data full scan mode (from m/z 50 to 1500). A C18 analytical column (Hypersil GOLD, 100 mm × 2.1 mm; 3 µm particle size; Thermo Fisher Scientific, Waltham, MA, USA) with a guard column (Hypersil GOLD, 10 mm × 2.1 mm; 3 µm; Thermo Fisher Scientific) was used. The linear gradient elution at a flow rate of 0.15 mL·min−1 was performed using 0.1% formic acid in solvent A (water/acetonitrile 9:1, v:v) and 0.1% formic acid in solvent B (methanol/acetonitrile 9:1, v:v). After 2 min in initial conditions (10% B), the gradient increased to 90% B in 5 min, with a hold time of 3 min, followed by a linear return to 10% B within 2 min and 2 min stabilization. The diode-array detection (DAD) was set from 190 to 320 nm. A wavelength of 256 nm was chosen for quantification.
2.4.2. Standard Solutions and Matrix Solution
Sildenafil citrate was dissolved in a 1:1:1 (v/v/v) mixture of methanol, acetonitrile and water. Stock solutions were prepared at a concentration range from 0.08 to 20 μg·mL−1. Working solutions were prepared by successively diluting stock solutions. The matrix solution was composed of an 80 mg 1:3 (w/w) mixture of calcium sulphate dihydrate and microcrystalline cellulose dissolved in the same solution as standards.
2.4.3. Sample Preparation
Tablets were weighed, powdered and homogenized. Accurately weighed portions of the powder, equivalent to 10 mg or 50 mg of sildenafil, were dissolved with a 1:1:1 (v/v/v) mixture of methanol, acetonitrile and water and sonicated. The extracts were further diluted to an appropriate concentration.
2.4.4. Methods Validation
The validity of the method was investigated based on ICH guidelines [
29]. Relative standard deviation (RSD) of sildenafil peak retention time and mass errors were investigated to confirm specificity. Additionally, matrix solution chromatograms were investigated, to check for any interfering peaks. Seven concentration levels from 0.08 μg·mL
−1 to 20 μg·mL
−1 were analyzed to estimate a linearity range, and the coefficient of determination (r
2) was calculated. Intra-day and inter-day precision and accuracy were assessed at three concentration levels. Inter-day precision was calculated on three days. RSD value was used for precision evaluation and accuracy was expressed in percentage. A concentration range for which a suitable precision, accuracy and linearity of analytical signals is guaranteed was evaluated.
3. Results
3.1. Qualitative Analysis of Viagra by X-ray Powder Diffraction
X-ray powder diffraction is a very powerful method for the qualitative analysis of all types of crystalline solids. As far as all crystalline components of a sample give increments to the total diffraction pattern, they could also be identified by applying data collected in spacious databases including those that are commercially available [
30], open-access [
31,
32,
33,
34] and user-composed. Using only the Viagra 100 mg example, we can show several analyses where we identified different not-declared excipients or even different APIs.
In
Figure 4, examples of the analysis of different alleged Viagra 100 mg tables are presented.
Figure 4a represents an original tablet from Pfizer. Microcrystalline cellulose (shown as a dark purple, partially amorphous profile), anhydrous calcium hydrogen phosphate (depicted as vertical pale-blue lines) and sildenafil citrate (shown as vertical red lines) are the three main ingredients. All but the third (
Figure 4c) example represent cases where sildenafil was identified—the red vertical lines in
Figure 4a,b,d,e correspond to sildenafil citrate, whereas the green vertical lines in
Figure 4f could be ascribed to sildenafil in the form of a base. The only example, presented here, which did not contain sildenafil as an API is the case from
Figure 4c, where acetaminophen (paracetamol) was identified—depicted as orange vertical lines. Comparing the overall view of the presented diffraction patterns, one can conclude however that the contents of the studied tablets differ significantly. Microcrystalline cellulose is one of the excipients that has been identified very frequently in both original and counterfeit samples of Viagra (see dark purple profiles in
Figure 4a,e,f). Corn starch was observed much less frequently and only in the falsified samples—see gray profiles in
Figure 4b,d. Other undeclared substances are also found in many samples of falsified Viagra tablets. From those found in our laboratory, calcium carbonate (calcite)—pink vertical lines in
Figure 4c,f—is encountered very often, as well as calcium sulphate in differently hydrated forms, e.g., brown vertical lines in
Figure 4e (here, we identified the anhydrous form—anhydrite—but very often gypsum and basanite can also be found).
3.2. Semiquantitative Analysis of Viagra 100 mg Tablets
3.2.1. Theory and General Concept
The examples in
Figure 4 show that even dubious Viagra tablets from the illegal supply chain sometimes contain the proper API (examples in
Figure 4b,d,e). They show, however, that the qualitative composition of the tablets differs significantly from the original product. As far as the differences are mainly in excipients, the question arises about the dose of API, which is a major issue when the health of a potential patient is concerned. In this case, both overdose as well as a lower dose is dangerous.
As was already mentioned before, the intensity of a reflection coming from an additive is proportional to its concentration in the sample. Because we usually use the same sample holders for the XRPD measurements, as well as the same protocol of analyses (at least we can perform analyses in such a way), the integral intensity of a reflection which is ascribed to a given crystalline phase gives us information about the concentration of this phase in the mixture. This is of course only true for regions where reflections from different phases do not overlap.
Generally, the integrated intensity of a diffracted peak (hkl) of a substance
i measured with a diffractometer is: [
35,
36]
where:
Ipr = intensity of the primary beam;
e−2Mi = Debye–Waller temperature factor;
pi = multiplicity factor;
Fi = structure factor;
Lp = Lorentz–polarization factor;
Vi = volume of the compound i (pressed to the solid);
vi = volume of the unit cell of a compound I;
T(θ) = transmitted fraction of the diffracted X-ray beam (dependent on θ, but not absorbed).
For the given conditions, some of the factors could be considered constant for a given (hkl) reflection and hence could be included in the
Ki constant. Then, we obtain:
or:
because
where
Vi is an effective volume. In practice, to obtain the value, a packing factor should be applied.
The transmitted fraction
T(θ) is:
where
μm = mass absorption coefficient,
l = absorption path length and
ρ = density of the sample.
The reasoning brings us finally to an equation:
which ties the concentration of the
i-th phase with the intensity of the reflection. It assumes that for a given experimental conditions (diffractometer, divergence slits, sample area and thickness), some values for a reflection for the
i-th phase (the subscripts A and B refer to the phases in a two-phase system) can be treated as being constant and written as
Bi. The last equation shows also that the major problem in a very simple quantitative analysis of Viagra by an application of X-ray powder diffraction might be the differences in the mass absorption coefficients
μm (see
Table A1 and
Table A2) between unknown samples.
3.2.2. Quantitative X-ray Diffraction Methods
The general model and the straight line model are well-known quantitative methods based on Equation (5). Both methods can be used, when standard samples or calibration coefficients are available. Manuals for various X-ray instruments very often give two examples of quantitative analyses: the content of boehmite [AlO(OH)] in corundum (Al2O3), and of austenite in martensite (crystalline steel components containing iron and carbon). Both cases belong to the straight line model where μm is approximately the same for both components and hence μm is independent of sample compositions, which is unusually rare for our samples. This model is, however, suitable for evaluating different polymorph concentrations, which we have successfully applied several times in our lab.
We looked for a fast and simple-as-possible method of a quantitative X-ray analysis of sildenafil content in falsified erectile dysfunction medicinal products. We want to avoid probe contamination by adding an internal standard in a quantitative approach. As we can see in exemplary diffractograms (
Figure 3 and
Figure 4), products are mixtures of many phases including amorphous phases and ingredients characterized by overlapping peaks. Quantitative X-ray diffraction calculations based on crystallographic structures are difficult and sometimes impossible to apply. In contrast, methods based on the ratios of reflections’ intensities (e.g., RIR) of different phases are not easily applicable due to the amorphous nature of some phases [
28,
36]. The straight line model has been selected as the starting point and “pure compounds” were used to prepare a series of two-phase samples for calibration curves. The samples used for calibration contained sildenafil citrate and a second phase. The second phase is one of the inactive substances that have been identified in previous qualitative analyses, such as calcium hydrogen phosphate (CaHPO
4), calcium carbonate (CaCO
3), calcium sulphate (CaSO
4), cellulose, starch, lactose, etc. In one case, as the second phase, a 1:1 mixture of calcium hydrogen phosphate and cellulose was applied which corresponds approximately to the composition of excipients in original Viagra products. Based on the intensities of reflections
I1 (for 2θ ~ 7.3°),
I2 (2θ ~ 8°) and
I3 (2θ ~ 10.2°) of sildenafil citrate, the respective calibration curves were prepared. The calibration curves for sildenafil citrate mixed with different excipients are shown in
Figure 5.
3.2.3. Generalization of the Linear Model
When the mass absorption coefficients of both phases (sildenafil citrate and second phase) in the sample are similar, then a straight line should be obtained as the calibration curve (
Figure 5a). For organic substances such as lactose, starch or cellulose which have a lower μ
i than sildenafil citrate, the curves are below the straight line, whereas for inorganic substances such as calcium hydrogen phosphate, calcium hydrogen phosphate with cellulose, calcium carbonate or calcium sulphate, the situation is reversed (see
Table A1 in
Appendix B). Therefore, instead of using linear regression, an equation is used:
where
Irel ≠ 0 and the packing factor 0 < PF < 1 was derived and used to describe the calibration curves in
Figure 5b (see
Appendix D and
Appendix E for transformations of equations and
Figure A7).
3.3. A Semiquantitative Method Description
To determine the mass fraction of sildenafil citrate in the Viagra samples studied, the intensities of three reflections ascribed to sildenafil citrate were precisely measured (at a slower scanning speed and longer counting time—during the tests we wanted higher quality measurements than the standard qualitative analysis measurements in our laboratory) and the mass fraction was calculated applying the appropriate equation of the calibration curve. For lower sildenafil doses, the calibration curve can be approximated by a straight line which makes the approximation of the mass fraction even easier. The quantification is sometimes not very easy, because samples are composed of more than two phases. Therefore, to obtain more accurate result, an additional equation of calibration curve for a non-sildenafil citrate phase is necessary. Then, for both results, the final arithmetic mean can be calculated (see
Appendix G for a standard deviation of the arithmetic mean). For a more accurate result, a new calibration curve for sildenafil citrate in the three-phase sample can be prepared. Nevertheless, the first step is always the qualitative analysis enabling the selection of a proper calibration curve. Then, selected reflections intensities have to be remeasured precisely and finally the mass fractions might be calculated.
The equation
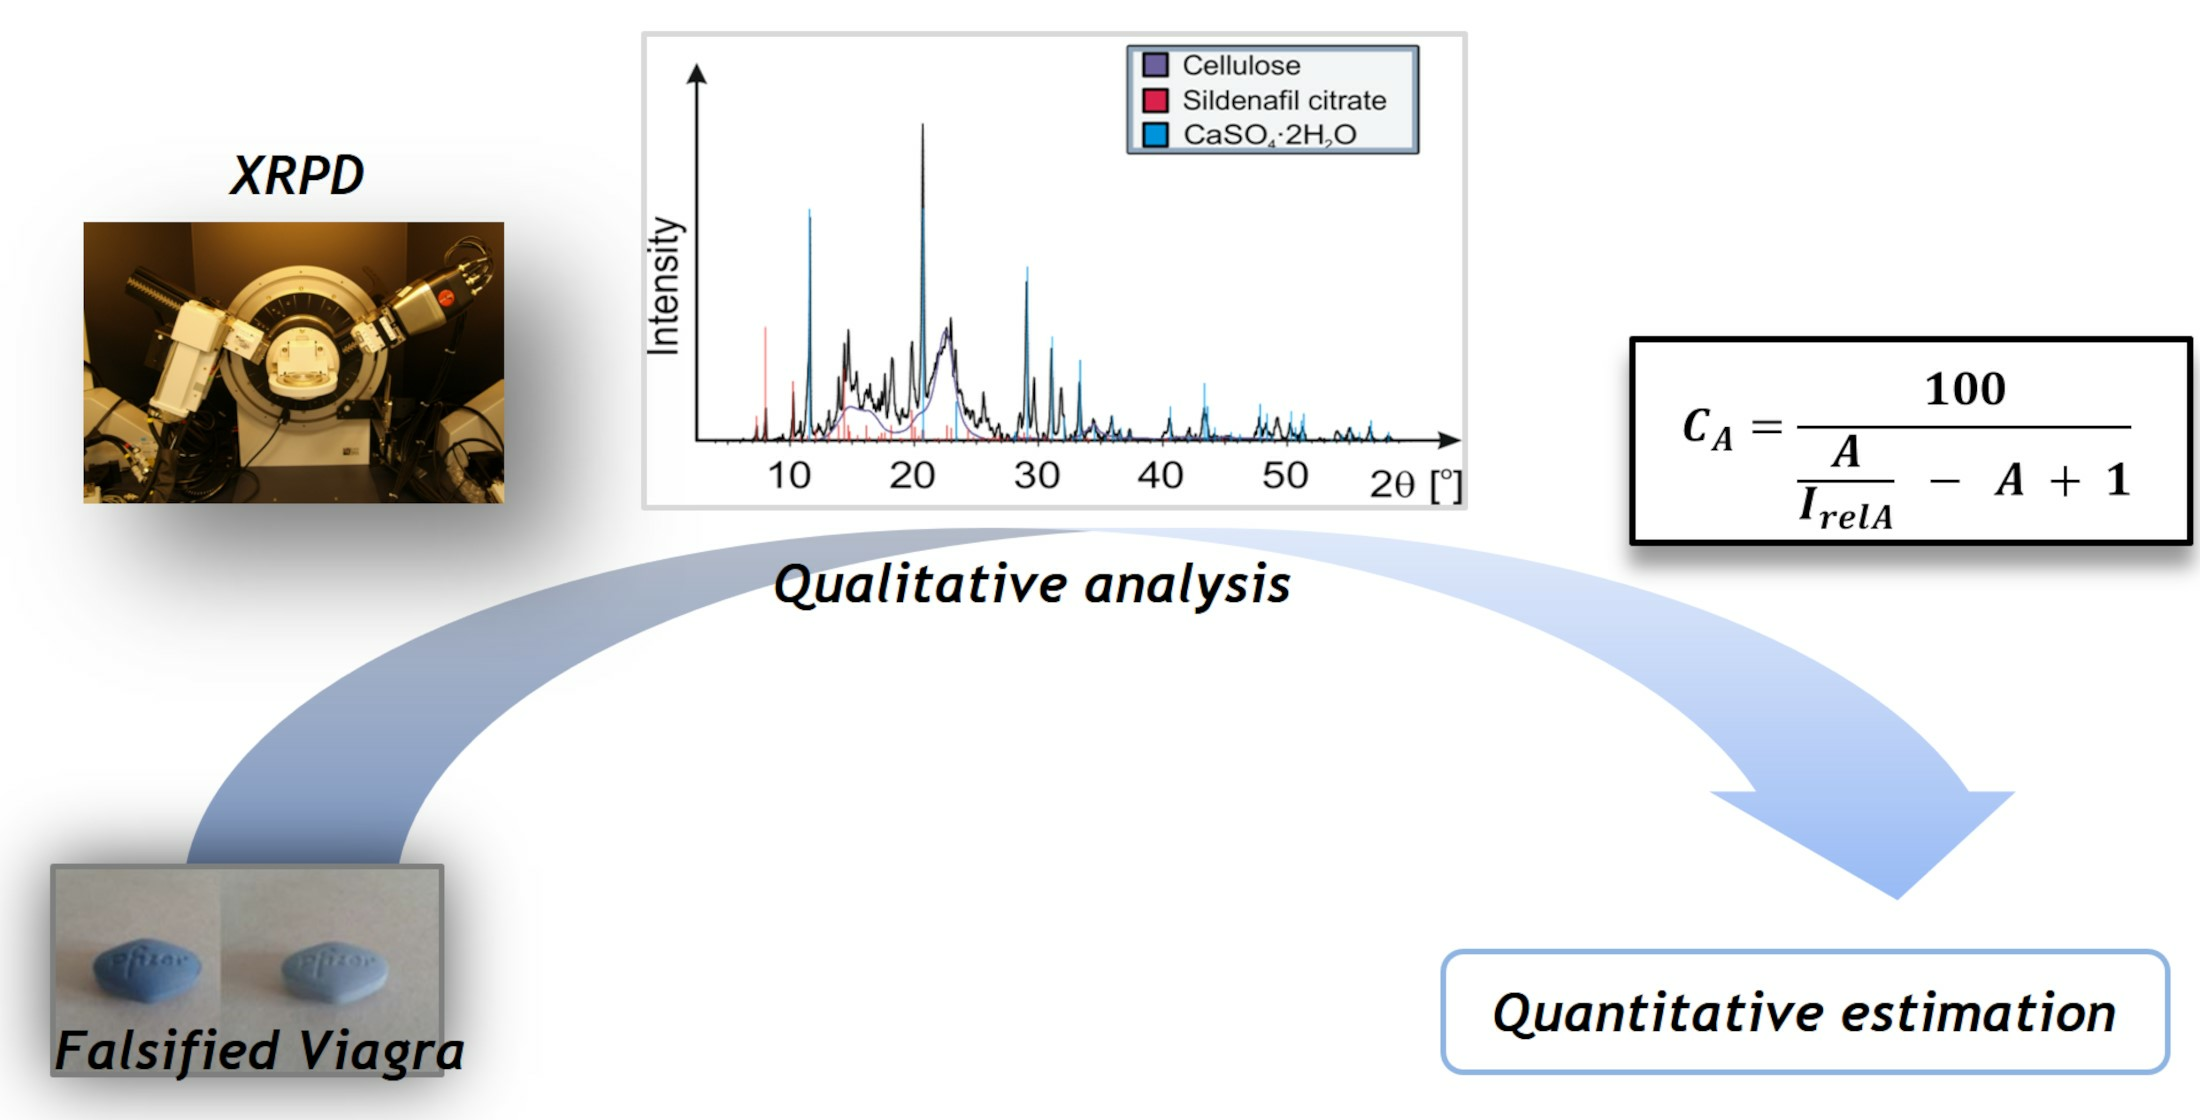
CA =
f(
IA) was derived on the basis of theoretical considerations; however, in practice, interactions between phases are observed because of the physicochemical properties of the mixture. The properties can strongly depend on mass concentration. For example, a mixture that contains microcrystalline cellulose can swell. This behavior increases with the amount of microcrystalline cellulose in the sample (see
Figure A2,
Figure A3,
Figure A4,
Figure A5 and
Figure A6 in
Appendix C). However, the equation describes the calibration curve quite well in the range of the investigated concentrations of sildenafil. Calculations with this equation are easy with the use of the freeware GNUPLOT software, although a linear equation could also be used in a very narrow investigated range of concentrations (see
Figure 2a,b and
Appendix F). The intensities of selected reflection(s) for known phase concentrations are input as data variables to calculate the coefficients of the equation. Here, only the parameter
A and the asymptotic standard error Δ
A are determined. The standard error [%] gives an indication of the quality of the fit to experimental data. The
A value can then be used for the inverse calculation to obtain estimated quantities of
CA based on the intensity of the reflection of the investigated powder sample.
The last step is to establish the dose of the active substance. To do so, we have to know the mass of the studied tablet.
3.3.1. Selected Calibration Curves and Input Data
We prepared calibration curves (i), (ii) and (iv) according to the below equation for the reflections mentioned previously. The calibration curves with the lower standard errors were selected for future mass estimation. We have reduced Equation (6) to Equation (7) in order to reduce the number of variables to a single parameter A that determines the behavior of the calibration curve, making it easier to calculate the fit. The parameter indicated by the italic capital letter
A has its physical meaning as a ratio (see Equation (7) and
Appendix E). The capital
A is the parameter descriptor for the ratio of the mass absorption coefficients and the packing factor of the two phases A and B (see
Appendix E). More details including parameter
A for the equation are collected in
Table 1 and
Appendix E.
An exemplary calibration curve is shown in
Figure 2.
3.3.2. Results of Quantitative X-ray Estimation
Based on the relative intensities values presented in
Table 1, we calculated the minimum (
A1) and maximum (
A2) values of the parameter
A by applying an asymptotic standard error. We used the following equations
A1 =
A − Δ
A and
A2 =
A + Δ
A.
CA1 and CA2 were calculated for Equation (7) using A1 and A2, respectively, for each intensity. The lowest and the highest CA1 and CA2 for the same sample were selected for future calculations and the final CA ± ΔCA values were calculated, where CA = (CA1 + CA2)/2 and ΔCA = |CA − CA1|.
The relative intensities calculated and used for further calculations are in
Appendix K in
Table A5 and
Table A6. The estimated concentrations and masses of calcium sulphate and sildenafil citrate on the basis of calibrations curves (i), (ii) and (iv) are collected in
Table 2,
Table 3 and
Table 4.
3.3.3. Correction of Quantitative X-ray Estimation by Determination of Amean
The aforementioned analysis was based on two phases’ curves, whereas in real samples there is a mixture of three or more phases. One can presume that quantitative calibration curve for sildenafil should have a shape somewhere between these two described calibrations curves; in this case, for sildenafil citrate with calcium sulphate and the calibration curve with microcrystalline cellulose (
Figure 5). Then, instead of
A we obtain an
Amean, according to the equation:
In our example,
Amean is equal to (0.397885 + 0.535955)/2 = 0.46692 with Δ
Amean = (0.007359 + 0.01679)/2 = 0.0120745; therefore, there are two border values
A1mean = 0.4548455 and
A2mean = 0.4789945.
Amean is a value for a “virtual calibration curve” for a mixture of three phases calculated from A values for curves (i) and (ii). The final mass and concentration values are summarized in
Table 3 and
Table 4.
We performed many different XRPD quantitative estimations of samples containing different excipients. Here, we have presented only results for a very common mixture of sildenafil citrate with gypsum and cellulose. Our estimated values of sildenafil citrate in
Table 4 are quite close to the nominal masses or nominal concentrations.
3.4. LC-DAD and LC-QTOF-MS Methods Validation
The RSDs of the retention time were 0.09% with DAD and 0.11% with MS detection and the mean mass error was −3.6 ppm. There were not any interferences observed on DAD and MS chromatograms. Parallel detection using two techniques allows us to verify the purity of peaks present on UV chromatograms. The signals of DAD and MS detection were linear in the range from 0.4 to 14 μg·mL
−1 (
r2 = 0.9989) and from 0.08 to 20 μg·mL
−1 (
r2 = 0.9961), respectively. Intra- and inter-day precision and accuracy data are presented in
Table A4 in
Appendix I. Both methods were precise, accurate and linear in a range from 5 to 13 μg·mL
−1. Established methods were applied as reference methods to quantify the content of sildenafil in selected samples. The results of the XRPD estimations are also similar to the results obtained with the DAD and MS methods (
Table 4).
3.5. LOQ and LOD of XRD
The limit of quantitation (LOQ) and limit of detection (LOD) depend on the composition of the sample, how the sample is prepared for measurement and how accurate the measurement is—the measurement time changes the difference between the desired signal and the background. It also depends on what reflection observations have been made. For the LOD, we took peak intensities (calculated as the difference between the maximum of the peak and the background) greater than three standard deviations, determined as the noise of the background around the peak. For the LOQ, the intensity of the peak was six times greater than the background noise. Eventually, we decided that the noise in the background would be calculated twice for a maximum of the intensity of peak, on the left and the right side of each peak, for the same measurement, instead of noise for the “blank sample” in the place where the reflection should be present. Moreover, it is worth noting that for LOD and LOQ, the maximum intensities of the peak were taken; however, semi-quantities analyze the field under the peak. This is important information because from time to time, a different shape of peaks was observed for the same sample, where maximum intensities were significantly different; nevertheless, the area of the peak was often quite similar.
Measurements were repeated several times for the same sample with a well-defined amount of sildenafil citrate in mixtures. There are variations in the intensities of background and reflections for sildenafil citrate in calcium sulphate and mixtures with microcrystalline cellulose. A visualization of data and summary are in
Figure A10,
Figure A11,
Figure A12,
Figure A13 and
Figure A14 and
Table A3 in
Appendix H. There are variations in the intensities of background and reflections for sildenafil citrate in calcium sulphate and mixtures with microcrystalline cellulose.
The LOD was about 3–6% for sildenafil citrate in calcium sulphate and about 1–3% for sildenafil citrate in microcrystalline cellulose when using conventional phase identification measurements. For the XRD measurements used in our semi-quantitative study, the LOQ was determined. We analyzed the intensities of three peaks located at ~7.2°, ~8° and ~10.6°. The LOQ was determined to be ~3%, 1–6% and ~3–6%, respectively, for selected peaks of sildenafil citrate in calcium sulphate. For sildenafil citrate in cellulose, the LOQ was determined to be ~1%, ~1–3% and ~1%, respectively. Although the LOQ for different peaks varies, the LOQ for measurements with the settings used for our semi-quantitative analysis is lower than the LOD for qualitative analysis.
3.6. Summary
Data obtained from X-ray experiments were correlated with results from validated liquid chromatography coupled to a diode array detector and mass spectrometry techniques. The intra- and inter-day variance of the semiquantitative X-ray powder diffraction analysis method was determined by constructing a new set of two calibration curves. One curve is for sildenafil citrates in microcrystalline cellulose and another for sildenafil citrate in gypsum (
Appendix H). The shape of the calibration curve for sildenafil citrate in microcrystalline cellulose is different from the shape of the calibration curve for sildenafil citrate in gypsum.
The difference in shape between the two types of mixtures is expected based on the equation for
CA and based on expectations from experiments (see
Figure 5 and
Appendix C and
Appendix D). There are two mixtures, both of which have different compositions, including density (as a consequence, the mass absorption coefficients for each compound are different in this case) and the packing factor of the crystals, and there may also be a preferred orientation of the crystals in the powder sample. All these elements (according to the equation for
CA) affect the shape of the calibration curve. On certain curves, particular points have sometimes been omitted because of the economic aspect of sildenafil citrate, e.g., points 0.4 or 0.8 contain about 40–80% of sildenafil citrate. On the other hand, we do not expect such a high concentration of sildenafil in medicines or fake medicines.
4. Discussion
A semi-quantitative method of sildenafil content determination using simple X-ray diffraction analysis has been presented. An example of a product containing microcrystalline cellulose and gypsum (calcium sulphate dihydrate) in addition to the API was presented. The use of gypsum was taken into account because of the very frequent occurrences of this compound in falsified Viagra products. The obtained results were additionally compared to results obtained by two validated methods of quantitative sildenafil analyses. Hence, during a phase identification process, we can also determine more or less the accurate amounts of sildenafil in a drug or counterfeit medicine. The obtained results seem to be satisfactory for a preliminary quantification of the API dose, which is very important for establishing health risks for the prospective patient. In the course of studies, we established the importance of radiation absorption in a sample. The proposed method is time- and apparatus-independent and the obtained calibration curves can be used for all samples of similar qualitative composition. Moreover, in our opinion, it can be also used for sildenafil content estimations in the case of samples composed of excipients having similar and not-identical mass absorption coefficients as gypsum.
The method has its deficiencies, the errors of concentration estimations are pretty high and the results can be used only as an indication of falsification and plausible health-threat of the product, especially with a lack of the original sample. In the latter case, the comparison of diffraction patterns of dubious and original products gives an easy and fast answer. There are some difficulties with this method that affect the final result. The main problem is the intensity for 100% of the API against which the other relative intensities are calculated. Sometimes it is not easy to obtain the intensity of the reflection from the diffractogram. This is due to overlapping reflections: different layers of the same phase have similar d values or reflections from different phases have similar d values. Some products, especially in certain concentration ranges of multiphase systems, may have a sample texture. This will affect the intensity of the reflection.
We demonstrated that in powder diffraction, absorption is not the only parameter which affects the reflection intensity-concentration proportionality. The degree of powder packing and compression (PF) is an important factor. However, our proposed parameter A includes both the packing factor and the mass absorption coefficient. The PF factor can correct for errors in the determination of the absorption coefficient. Thus, the first question was: does sildenafil citrate contain water molecules in the crystal structure and is it sildenafil citrate monohydrate? A comparison of the diffraction patterns for crystal structures (sildenafil citrate monohydrate, sildenafil citrate hemihydrate [
37,
38]) and the diffraction pattern from the ICDD database (PDF 00-052-2420 later published in [
39]) shows that they are somewhat similar. The diffraction patterns of both these and other close compositions are similar for many strong reflections, so there is no point in time-consuming examinations (see
Figure A17 and
Figure A18 in
Appendix L). In addition, the study of heating sildenafil citrate monohydrate up to 200 °C was conducted earlier and it can be seen that the intensity of reflections changes significantly around 2θ ~ 7° and ~12° 13.5° for Cu
Kα radiation [
40] (please compare with our investigations in
Figure A18). All calculations were performed for sildenafil citrate powder without water content, which cannot be excluded due to the absorption of water from the air, under the assumption that we are using an API standard of sildenafil citrate (
Appendix A and
Appendix B).
We postulate that
Figure 5a additionally shows that the substances can be exchanged for another, e.g., in the multiphase system the composition can be exchanged like calcium hydrogen phosphate for calcium sulphate or calcium carbonate or into two mixtures of compounds of calcium hydrogen phosphate with cellulose. Then, as long as the reflections from the different phases do not overlap significantly, using parameter A in a given concentration range should still allow the concentration to be estimated fairly well from the intensity of the reflection without the need for a new calibration curve.
The step size and the time per step affect the intensity value. These parameters should be set individually for the experimental configuration to obtain the best ratio between LOD or LOQ and total data collection time (
Figure A15 and
Figure A16 in
Appendix J). The step size depends on the full width at half maximum (FWHM) of the reflection. The well-known rule of at least eight points above the FWHM of the reflection seems to be appropriate. It is best to measure the background to the left and right of the reflection for at least six FWHMs (three reflections) when measuring or selecting an individual reflection.
The intensity of the reflectance for pure API should be measured and corrected from time to time due to, among other things, the wear of the X-ray tube.
It takes time to construct the calibration curve, determine the parameter A for the equations CA = f(IA) and verify the results.
The method can also be worked out for completely different pharmaceutical products, although it must be stated that it is restricted only to those products of relatively high API concentrations/doses of good crystalline character and hence giving strong X-ray diffraction. Advantageously, the calibration curves (
Figure A7,
Figure A9 and
Figure 5a,b) can be easily corrected by changing parameter
A; for example, by calculating the average value of parameter
A (see
Table 1 and
Table 4).
5. Conclusions
The linear regression equation has been derived and generalized to the non-linear regression equation where the coefficients have crystallographic significance. It should be emphasized that this method is not intended to compete with LC-DAD or LC-QTOF-MS. The semi-quantitative method can only be used as a first estimation, after which, if necessary, a well-established and accurate quantification by LC-DAD and LC-QTOF-MS can be performed. On the other hand, this work aims to provide the scientific community with a general formula that allows the use of a calibration curve for a two-component system using non-linear regression. Researchers are encouraged to develop their own semi-quantitative curves for various powder products. The authors believe that despite these rough estimates, the simple and rapid feedback of quantitative information may be useful in detecting counterfeits that pose a high health risk to patients/consumers.
The
A parameter must be determined for the appropriate phase system and measurement conditions. This takes time and requires reagents to obtain calibration curve(s) but, once done, the
A parameter can be used permanently for semi-quantitative estimation as long as the measurement conditions are not changed. This prevents contamination of an evidential sample with external standards. This is critical for evidence material, so that it can be used in the future for repeat measurements or other analyses. A summary of the semi-quantitative X-ray powder diffraction analysis described here is shown in
Figure 1 as a graphical representation of the algorithm.


 ,
, 


