Article

Thermodynamic Properties and Equation of State for Tungsten

by
Nikolay V. Kozyrev
* and
Vladimir V. Gordeev
Laboratory for Physicochemical Fundamentals of Energetic Condensed Systems, Institute for Problems of Chemical and Energetic Technologies, Siberian Branch of the Russian Academy of Sciences (IPCET SB RAS), Biysk 659322, Russia
*
Author to whom correspondence should be addressed.
Crystals 2023, 13(10), 1470; https://doi.org/10.3390/cryst13101470
Submission received: 7 September 2023 / Revised: 25 September 2023 / Accepted: 26 September 2023 / Published: 10 October 2023
(This article belongs to the Special Issue Recent Developments of Inorganic Crystalline Materials)

Abstract

:
A high-temperature equation of state for tungsten was constructed in this study using experimental data on its thermodynamic properties, thermal expansion, compressibility, and bulk compression modulus. The totality of experimental data were optimized by the temperature-dependent Tait equation over a pressure range from 0 up to 1000 kbar and over a temperature range from 20 K to the melting point. An extended Einstein model was used to describe the temperature dependence of thermodynamic and thermophysical parameters. A linear temperature dependence was embraced for the derivative of the isothermal bulk modulus. The resultant equation of state provides a good fit to the whole set of experimental data within measurement uncertainties associated with individual quantities.

1. Introduction

Tungsten has normally a body-centered cubic (bcc) lattice and retains this structure at least up to 3640 kbar [1]. Tungsten was theoretically predicted to transit into a hexagonal close-packed (hcp) modification at 12.5 Mbar [2] and 9.2 Mbar [3] at room temperature, and further into a face-centered cubic (fcc) phase at 14.4 Mbar [2,3].
Tungsten and its alloys are widely used in various science and technology fields. One needs to know the equation of state (EoS) in order to correctly describe the behavior of tungsten and its alloys in a wide range of pressures and temperatures. The experimental data from measurements of different properties of tungsten include measured isothermal compression, thermal expansion, and elastic constants at normal pressure.
A number of papers have been published in which equations of state for tungsten suitable for the estimation of its properties at temperatures ranging from room temperature to the melting point under pressures up to several Mbar were formulated using different approximations [4,5,6,7]. Those works share common shortcomings as follows: the lack of a quantitative evaluation of the estimation error relative to the experimental data used; in most instances, only graphical comparisons are given; all the works only examine the temperature range above room temperature (298.15 K) and do not cover the low-temperature region. It should also be noted that those studies are based on a limited set of the existing experimental data and disregard more recent measurement results.
Therefore, the aim of the present study was to examine and analyze the currently available experimental data, bring the thermodynamic and thermophysical parameters into agreement, and formulate an equation of state for the bcc phase of tungsten.

2. Physicochemical Model

The optimization of the thermophysical and thermodynamic parameters of tungsten was performed taking account of the suggestions reported in [8] by using a model that approximates well and reproduces experimental data for lead [9], aluminum [10], and copper [11] in a wide temperature and pressure range.

2.1. Thermodynamic Functions

The thermodynamic properties of tungsten in the standard state were described in this study by the three-term Einstein equation having an additional correction power term to account for anharmonic effects. The following forms of thermodynamic functions at zero pressure were used:
H T H 0 = i = 1 3 Y i θ i exp ( θ i / T ) 1 + h T m
C P = d H T d T = i = 1 3 ( θ i T ) 2 Y i exp ( θ i / T ) [ exp ( θ i / T ) 1 ] 2 + m h T m 1
S = Δ S 0 + i = 1 3 Y i { θ i T exp ( θ i / T ) exp ( θ i / T ) 1 ln [ exp ( θ i / T ) 1 ] } + m m 1 h T m 1
where T is the absolute temperature; H is the enthalpy; CP is the isobaric heat capacity; S is the entropy; Yi, θi, h, and m are constants (fit parameters); and ΔS0 is the integration constant.
The molar Gibbs energy is defined by the common relation:
G m = H T T S

2.2. Molar Volume

The Tait equation was used for the description of the pressure-dependent molar volume of tungsten [12,13]. Unlike the studies [9,10,11], and accounting for the very high melting temperature of tungsten (Tm = 3687 ± 7 K [14]), a temperature dependence of the pressure derivative of the isothermal bulk modulus was incorporated into the equation. The final form of the equation is written as:
P = B T n T + 1 { exp [ ( n T + 1 ) ( 1 V V T ) ] 1 }
where P is the pressure; V is the volume; BT and VT are the bulk modulus and the molar volume at temperature T and zero pressure; and nT is the pressure derivative of the bulk modulus. This study adopted a linear dependence of nT on temperature:
n T = n 0 + n 1 T
To describe the thermal expansion of tungsten in a wide temperature interval, the following relationship similar to that for enthalpy (1) was used:
ln ( V T S V 0 S ) = i = 1 3 X i Θ i exp ( Θ i / T ) 1 + g T k
where VTS and V0S are the molar volume at zero pressure and temperatures T and T = 0, respectively; Xi, Θi, g, and k are constants. It should be noted that an analogous three-term Einstein function but having another anharmonic term was employed in [15] to describe the thermal expansion of refractory metals, including tungsten.
Thus, the temperature-dependent molar volume in EoS (5) at the specified pressure is defined by the temperature dependences of VT, BT, and nT.

2.3. Isothermal Bulk Modulus

The function chosen in the studies [9,10,11] to describe lead, aluminum, and copper was employed in this study for the description of the isothermal bulk modulus of tungsten. This function is based on the equation that calculates the isothermal compressibility, as suggested in [16]. To ensure that the adiabatic modulus behavior at high pressures is realistic, three summands should be taken into account in summation. The final form of the expression is written as:
B T = B 0 1 + i = 1 3 s i exp ( ω i / T ) 1
where BT and B0 are the bulk compression moduli at temperatures T and 0 K, respectively; wi and si are constants. This equation has an advantage of providing an adequate description of the measured data at low temperatures. Moreover, this equation guarantees the non-negativity of the modulus at very high temperatures.

3. Selected Experimental Data

3.1. Thermodynamic Properties

The thermodynamic functions of tungsten are outlined in the reference literature and review papers [4,17,18,19,20,21,22]. Some studies examined only separate properties such as heat capacity and enthalpy [23] or only heat capacity [24,25]. The comparative values of heat capacity from the cited works are outlined in Table 1.
The isobaric heat capacity (CP) values reported in the different literature sources are in good agreement with each other (the maximum difference not exceeding 0.3%) in the low-temperature region (up to 300 K). The difference increases at higher temperatures, exceeding 20% near the melting point. The difference in the enthalpy values is considerably lower and is 0.03% in the low-temperature region, less than 0.4% in the mid-temperature region (up to 2600 K) and 1.5–1.8% near the melting temperature (except the earlier work [17] in which the difference attained 3.8%).
A more thorough review and analysis of the literature data on the thermodynamic properties of tungsten was carried out in the study [22] which was taken as the basis in this study.

3.2. Thermophysical Properties
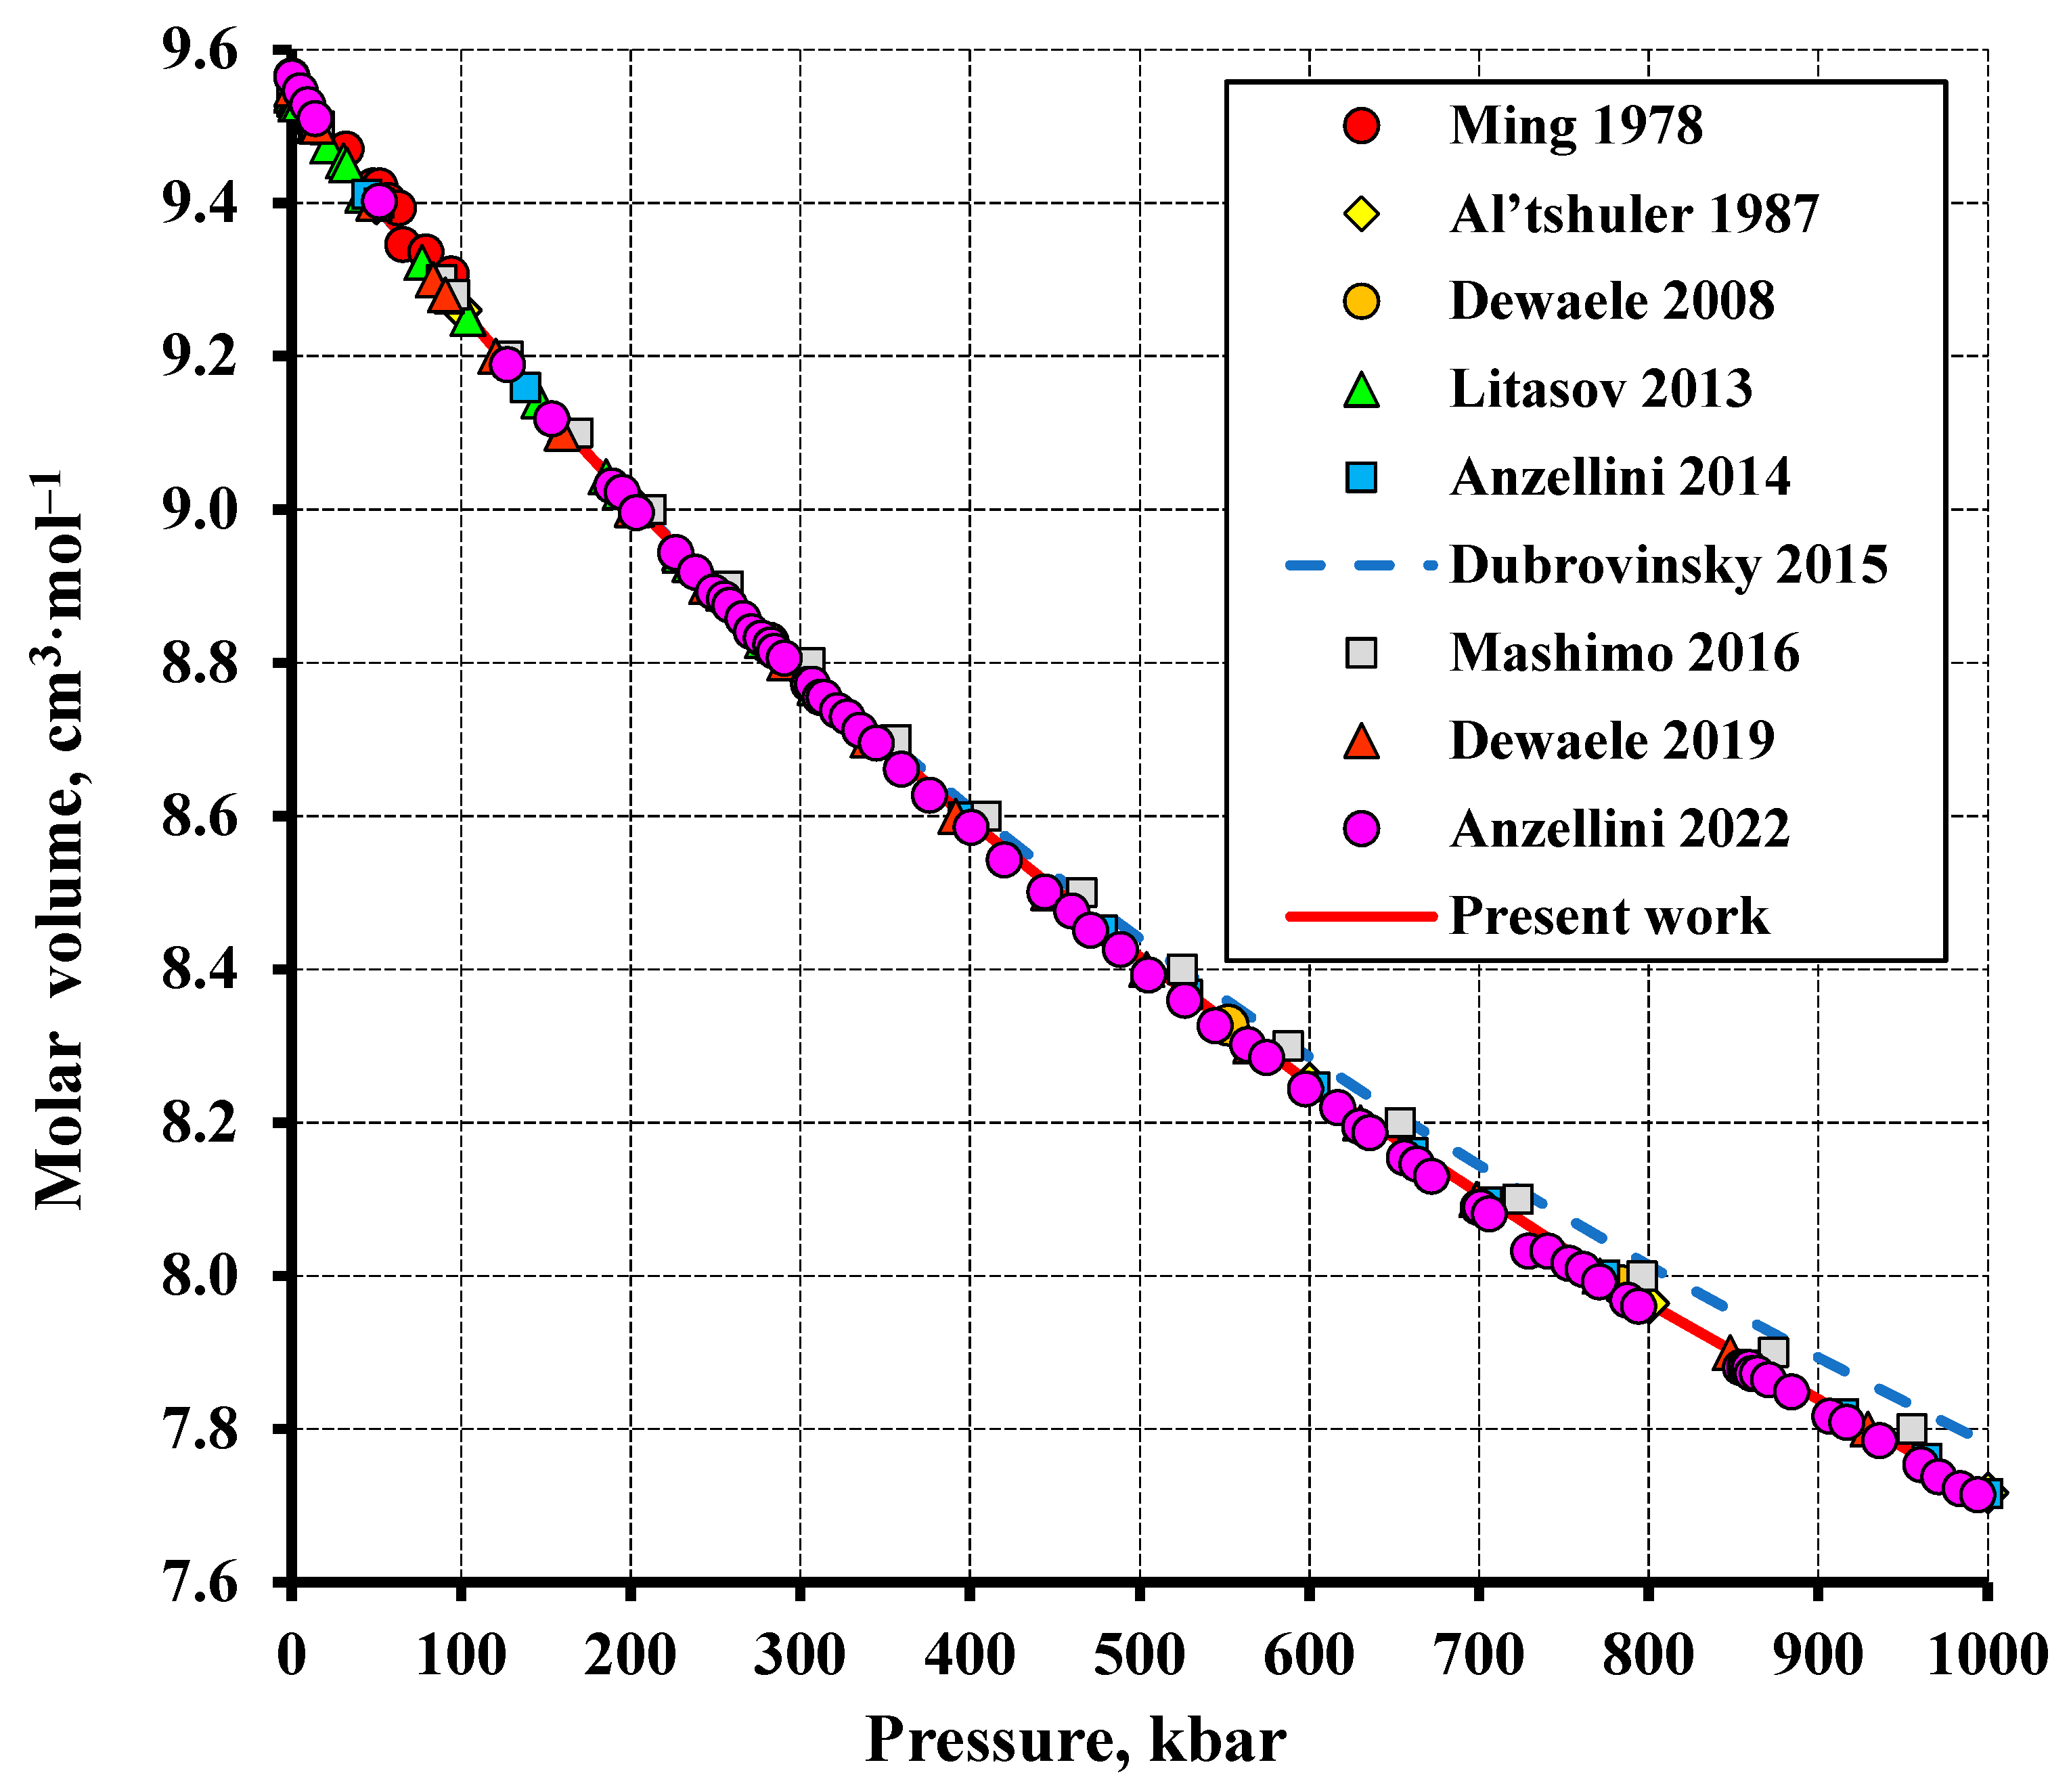
The measured data on thermal expansion, adiabatic bulk modulus, and isothermal compressibility were used in this study to formulate an equation of state for solid tungsten. The isothermal bulk modulus involved in the equation of state is defined by the well-known relation [26]:
B T = ( 1 B S + T V α 2 C P )
where α is the bulk thermal expansion coefficient and BS is the adiabatic bulk modulus.

3.2.1. Molar Volume

In this study, the molar volume estimated by Ablaster [27], who carried out a critical analysis of 38 experimental measurements from the different literature sources, was used as the benchmark value: 9.548 ± 0.002 cm3·mol−1 (density 19.254 g·cm−3) at 293.15 K. The recalculation using the thermal expansion coefficient from the same study gave almost the same molar volume of 9.549 ± 0.002 cm3·mol−1 at standard temperature.

3.2.2. Thermal Expansion

The data on the thermal expansion of tungsten are presented in handbooks and review papers [4,5,15,24,25,28,29,30,31,32,33,34]. The details of the listed studies are given in Table 2.
The discrepancy in the molar volume values reported in the above-listed works does not exceed 0.08% over a temperature range from 50 K to the melting point, except the study [4] in which the discrepancy was slightly higher and was 0.17% at the melting temperature (the data in study [5] were obtained from study [4]). At the same time, the difference in the thermal expansion coefficients reaches 11% up to 1000 K and exceeds 20% near the melting point. Therefore, this study employed the molar volumes from the paper [27], which values exhibit a good alignment with the other reference data.

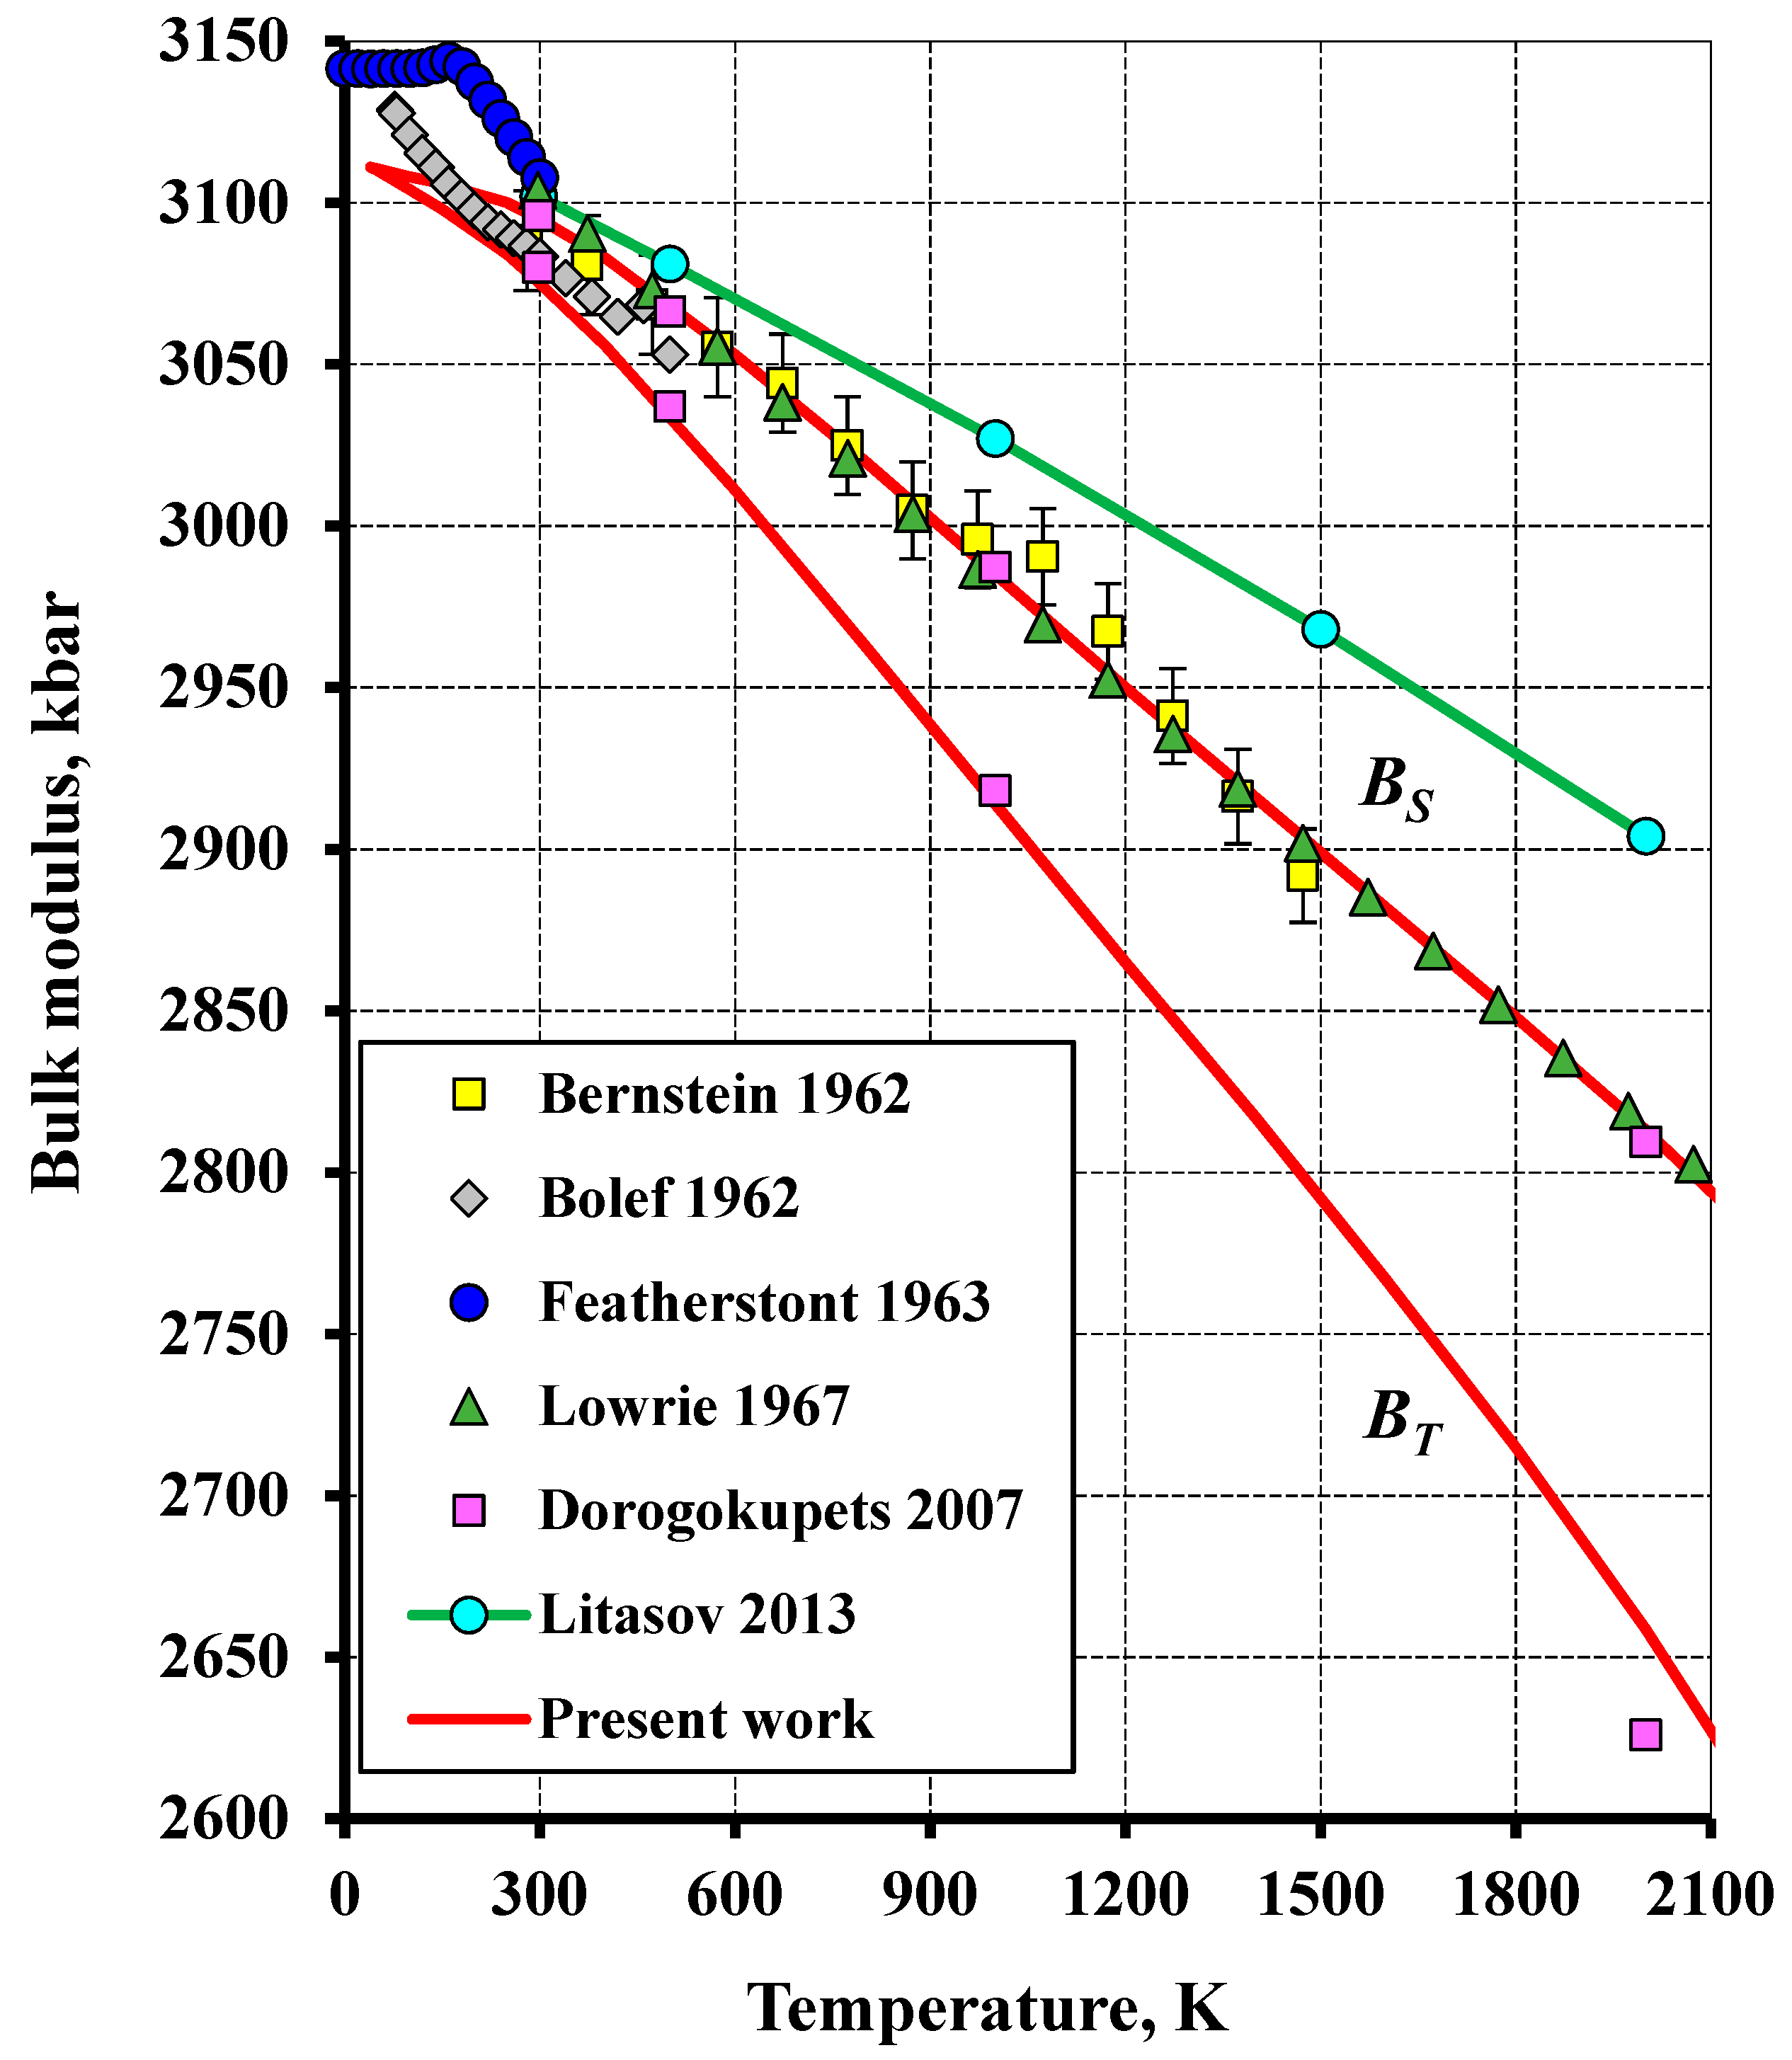
3.2.3. Isothermal Compressibility

The isothermal compressibility of tungsten under static compression was experimentally explored in [32,33,34,35,36,37,38,39,40,41]. Some studies estimated the normal isotherm of tungsten by restoring the shock-wave data [42,43]. The details of the cited studies are set forth in Table 3.
In this study, the optimization was conducted within the pressure range from 0 up to 1000 kbar. To find the EoS parameters for tungsten, we used all the original measured data, except the data from [34,37]. The measurement results reported in [34] were recalculated in the study [40] by using a more precise pressure calibration scale. The data from the study [37] were not utilized because of the overestimated (exaggerated) pressures compared to all the other experimental data available. This is probably associated with an inaccuracy of the equation of state for gold [44], which was used for pressure calibration.

3.2.4. Adiabatic Bulk Modulus

By constructing the equation of state for tungsten, we employed data obtained from the measurement of elastic constants and adiabatic bulk modulus at a temperature of 298.15 K [45,46,47] and at 280–1473 K [48], 77–500 K [49], 0–300 K [50] and 293–2073 [51]. The mean of the adiabatic modulus at room temperature was calculated from all the literature data to be 3110 ± 25 kbar (0.81%).

4. Calculation Procedure

As an optimization criterion, the error function was used that represents a weighted root-mean-squared deviation:
R = 1 N [ i = 1 N w i 2 ( D i c D i m D i m ) 2 ]
where N is the total number of experimental points; Di is the value of different parameters (molar volume, enthalpy, heat capacity, etc.); and wi is the weighting coefficients of these parameters. Indices c and m are the calculated and measured properties, respectively. The weighting coefficients were evaluated using relative measurement errors of different parameters.
The function was minimized by the Nelder–Mead simplex method for multidimensional minimization [52].

5. Results and Discussion

The EoS parameters obtained by the optimization are presented in Table 4. The comparison with experimental data is displayed in Figure 1, Figure 2, Figure 3, Figure 4, Figure 5 and Figure 6.
The estimated heat capacity of tungsten is compared with the other literature data in Figure 1 and Figure 2. The relationship obtained in the present study is a good approximation of the data reported in [22]. The root-mean-square deviation (RMS) of the calculation from the experiment in the temperature range from 50 K to the melting temperature was 0.58%. This deviation of enthalpy was significantly lower: RMS = 0.12% for the whole temperature interval.
It should be noted that the calculated data in the low-temperature region are well consistent with those from all the literature sources outlined in Table 1. The calculation in the high-temperature region through to the melting point almost coincides with the data reported in [24,25] (the error less than 1%) and aligns with the works reported in [4,23] (the error not higher than 3.7%). For the studies [18,19,20,21], the calculation discrepancy from the presented values is considerably higher and reaches 10–18%. The highest discrepancy exceeding 20% is observed when compared to the study [17]. Such differences between the calculated and reference data are explained by the different number of the literature sources considered and by the averaging method of the experimental values. The greatest number of primary experimental data were examined and critically reviewed in the studies [22,24,25] which agree excellently with each other and with the calculated data obtained in the present study.
Figure 3 and Figure 4 depict the bulk thermal expansion coefficient of tungsten plotted versus temperature. The calculated relationship gives a good fit to the data reported in [27]. The root-mean-square deviation (RMS) between the calculated data and the experiment at temperatures ranging from 20 K to the melting point was 0.66%. The molar volume calculation showed a significantly higher accuracy. The average absolute deviation was 0.001 cm3·mol−1 (RMS = 0.009%). The calculated molar volume at 298.15 K was 9.548 cm3·mol−1, being almost no different from the benchmark value. At the temperature of 0 K, the estimated molar volume of 9.522 cm3·mol−1 differs from that reported in [53] (9.524 cm3·mol−1) by 0.02% and from that reported in [54] (9.5175 cm3·mol−1) by 0.05%.
The low-temperature coefficient of thermal expansion (Figure 3) is in agreement with all the data reviewed, except the study [29]. This is associated with the fact that a small number of experimental data were averaged in the study [29] and exhibited a significant spread in addition.
The calculated thermal expansion coefficient in the high-temperature region (Figure 4) exhibits a rather good correlation with all the literature sources reviewed, except the study [4]. This is because the study [4] adopted a linear temperature dependence of the isobaric thermal expansion coefficient, whereas the experimental data indicate a substantially non-linear character of this dependence.
Figure 5 plots the molar volume of tungsten versus pressure at 298.15 K. The total number of experimental points is 177. The average absolute deviation of the calculation from the experiment was 0.005 cm3·mol−1, RMS = 0.08%. The isothermal bulk modulus at 298.15 K was calculated to be 3072.8 kbar, with a pressure derivative of 4.009, in agreement with the literature data set forth in Table 3, considering the different EoS types used.
Figure 6 plots the molar volume of tungsten versus pressure up to 350 kbar at different temperatures compared to the experimental data from [36]. Since the experimental points at different temperatures are in very close proximity to each other, the figure displays only data at 300, 673, 1073, and 1473 K for visual clarity (the study [36] also performed measurements at 473, 873, 1273, and 1673 K). Moreover, the data at 298.15 K from the other authors are also included. The calculation and experiment are seen to match fairly well with each other. The least root-mean-square deviation of 0.04% was observed at 473 K and increased to 0.09% at 1673 K.
Figure 7 illustrates the bulk modulus plotted versus temperature. The temperature dependence of the adiabatic bulk modulus obtained in this study approximates well the measured data from [51] and agrees with the data reported in [48] within an error. Moreover, this temperature dependence almost coincides with the calculation results presented in [6]. This indicates the adequacy of the model used in the present study, as compared to the studies [4,36] in which the calculated relationships differ noticeably from the experimental data.
It should be noted that the calculated data obtained in the present study and in the paper [6] differ noticeably from the low-temperature ones reported in [49,50]. This might be due to an inaccuracy of the measurements performed in these works. This is evidenced by the incorrect behavior of the adiabatic bulk modulus. For instance, the adiabatic modulus reported in the work [49] begins to increase abruptly as the temperature tends to zero, whereas this parameter rises and then begins to diminish abruptly as the temperature increases from 0 K to 160 K in the study [50].

6. Conclusions

The obtained results show that the proposed model allows the description of the experimental data for tungsten in a wide range of pressures and temperatures within experimental measurement uncertainties. The high prediction accuracy is achieved for the pressure-dependent molar volume, the absolute deviation between the calculation and experiment being 0.005 cm3·mol−1 (RMS = 0.08%). An even higher accuracy is reached for the temperature-dependent molar volume (0.001 cm3·mol−1, RMS = 0.009%) in the temperature range from 20 K to the melting point. The estimated isothermal bulk compression modulus at 298.15 K was 3072.8 kbar, with a derivative pressure of 4.009, which is consistent with the literature data. It worth noting here that the thermophysical and thermodynamic parameters of tungsten have been reconciled with each other by using the well-known thermodynamic relations in a pressure range from 0 up to 1000 kbar and in a temperature range from 20 K to the melting point.

Author Contributions

Conceptualization, investigation, software, writing—original draft preparation, writing—review and editing, supervision: N.V.K.; investigation: V.V.G. All authors have read and agreed to the published version of the manuscript.

Funding

This research was supported by the Ministry of Science and Higher Education of the Russian Federation (grant No. 075-15-2020-803 with the Zelinsky Institute of Organic Chemistry RAS).

Institutional Review Board Statement

Not applicable.

Informed Consent Statement

Not applicable.

Data Availability Statement

The raw/processed data required to reproduce these findings are available from the author upon request.

Conflicts of Interest

The authors declare no conflict of interest.

References

  1. McMahon, M.I.; Nelmes, R.J. High-pressure structures and phase transformations in elemental metals. Chem. Soc. Rev. 2006, 35, 943–963. [Google Scholar] [CrossRef] [PubMed]
  2. Moriarty, J.A. Ultrahigh-pressure structural phase transitions in Cr, Mo, and W. Phys. Rev. B 1992, 45, 2004–2014. [Google Scholar] [CrossRef] [PubMed]
  3. Soderlind, P.; Ahuja, R.; Eriksson, O.; Johansson, B. Theoretical predictions of structural phase transitions in Cr, Mo, and W. Phys. Rev. B 1994, 49, 9365–9371. [Google Scholar] [CrossRef] [PubMed]
  4. Gustafson, P. Evaluation of the thermodynamic properties of tungsten. Int. J. Thermophys. 1985, 6, 395–409. [Google Scholar] [CrossRef]
  5. Saxena, S.K.; Zhang, J. Thermochemical and pressure-volume-temperature systematics of data on solids, examples: Tungsten and MgO. Phys. Chem. Miner. 1990, 17, 45–51. [Google Scholar] [CrossRef]
  6. Dorogokupets, P.I.; Oganov, A.R. Ruby, metals, and MgO as alternative pressure scales: A semiempirical description of shockwave, ultrasonic, x-ray, and thermochemical data at high temperatures and pressures. Phys. Rev. B 2007, 75, 024115. [Google Scholar] [CrossRef]
  7. Hrubiak, R. Exploring Thermal and Mechanical Properties of Selected Transition Elements under Extreme Conditions: Experiments at High Pressures and High Temperatures. Ph.D. Thesis, Florida International University, Miami, FL, USA, 2012. [Google Scholar]
  8. Chase, M.W.; Ansara, I.; Dinsdale, A.; Eriksson, G.; Grimvall, G.; Hoglund, H.; Yokokawa, H. Group 1: Heat capacity models for crystalline phases from 0 K to 6000 K. Calphad 1995, 19, 437–447. [Google Scholar]
  9. Kozyrev, N.V.; Gordeev, V.V. Thermodynamic characterization and equation of state for solid and liquid lead. Metals 2022, 12, 16. [Google Scholar] [CrossRef]
  10. Kozyrev, N.V.; Gordeev, V.V. Thermodynamic properties and equation of state for solid and liquid aluminum. Metals 2022, 12, 1346. [Google Scholar] [CrossRef]
  11. Kozyrev, N.V. Thermodynamic properties and equation of state for solid and liquid copper. Int. J. Thermophys. 2023, 44, 1–18. [Google Scholar] [CrossRef]
  12. MacDonald, J.R. Review of some experimental and analytical equations of state. Rev. Modern Phys. 1969, 41, 316–349. [Google Scholar] [CrossRef]
  13. Dymond, J.H.; Malhotra, R. The Tait equation: 100 years on. Int. J. Thermophys. 1988, 9, 941–951. [Google Scholar] [CrossRef]
  14. Bedford, R.E.; Bonnier, G.; Maas, H.; Pavese, F. Recommended values of temperature on the International Temperature Scale of 1990 for a selected set of secondary reference points. Metrologia 1996, 33, 133–154. [Google Scholar] [CrossRef]
  15. Wang, K.; Reeber, R.R. The role of defects on thermophysical properties: Thermal expansion of V, Nb, Ta, Mo and W. Mater. Sci. Eng. 1998, R23, 101–137. [Google Scholar] [CrossRef]
  16. Deffrennes, G.; Oudot, B. A self-consistent model to describe the temperature dependence of the bulk modulus, thermal expansion and molar volume compatible with 3rd generation CALPHAD databases. Calphad 2021, 74, 102291. [Google Scholar] [CrossRef]
  17. Kirillin, V.A.; Sheindlin, A.E.; Chekhovskoi, V.Y.; Petrov, V.A. Thermodynamic properties of tungsten in the temperature range of 0–3500 K. Russ. J. Phys. Chem. A 1963, 37, 2249–2256. (In Russian) [Google Scholar]
  18. Stull, D.R.; Prophet, H. JANAF Thermochemical Tables, 2nd ed.; NBS: Washington, DC, USA, 1971.
  19. Glushko, V. Termodinamicheskie Svoistva Individual’nykh Veshchestv In Thermodynamic Properties of Individual Substances, 3rd ed.; Nauka: Moscow, Russia, 1982; Volume 4, Book 2. (In Russian) [Google Scholar]
  20. Barin, I. Thermochemical Data of Pure Substances, 3rd ed.; VCH Verlagsgesellschaft mbH: Weinheim, Germany, 1995. [Google Scholar]
  21. Chase, M.W. NIST-JANAF Thermochemical Tables, 4th ed.; Journal of Physical and Chemical Reference Data; American Chemical Society: Washington, DC, USA, 1998; Volume 9, pp. 1–1951. [Google Scholar]
  22. Arblaster, J.W. Thermodynamic properties of tungsten. J. Phase Equilib. Diff. 2018, 39, 0689. [Google Scholar] [CrossRef]
  23. Chekhovskoi, V.Y. Enthalpy and Heat Capacity of Tungsten in the 400–3600 K Temperature Range. Teplofizika Vysokikh Temperatur 1980, 18, 1191–1195. (In Russian) [Google Scholar]
  24. White, G.K.; Minges, M.L. Thermophysical properties of some key solids: An update. Int. J. Thermophys. 1997, 18, 1269–1327. [Google Scholar] [CrossRef]
  25. Bodryakov, V.Y. Correlation of temperature dependences of thermal expansion and heat capacity of refractory metal up to the melting point: Tungsten. High Temp. 2015, 53, 643–648. [Google Scholar] [CrossRef]
  26. Grigoriev, I.S.; Meilikhov, E.Z. Handbook of Physical Quantities; CRC Press: Boca Raton, FL, USA, 1996. [Google Scholar]
  27. Ablaster, J.W. Selected Values of the Crystallographic Properties of the Elements; Materials Park-ASM International: Cleveland, OH, USA, 2018. [Google Scholar]
  28. Gray, D.E. American Institute of Physics Handbook, 3rd ed.; McGraw-Hill: New York, NY, USA, 1972. [Google Scholar]
  29. Novikova, S. Teplovoe Rasshirenie Tverdykh Tel [Thermal Expansion of Solids]; Nauka: Moscow, Russia, 1974; 293p. (In Russian) [Google Scholar]
  30. Touloukian, Y.S.; Kirby, R.K.; Taylor, R.E.; Desai, P.D. Thermal Expansion Metallic Elements and Alloys. In Thermophysical Properties of Matter; The TPRC Data Series; IFI/Plenum: New York, NY, USA, 1975. [Google Scholar]
  31. Slack, G.A.; Bartram, S.F. Thermal expansion of some diamond like crystals. J. Appl. Phys. 1975, 46, 89–98. [Google Scholar] [CrossRef]
  32. Vaidya, S.N.; Kennedy, G.C. Compressibility of 18 metals to 45 kbar. J. Phys. Chem. Solids 1970, 31, 2329–2345. [Google Scholar]
  33. Ming, L.; Manghnani, M.H. Isothermal compression of bcc transition metals to 100 kbar. J. Appl. Phys. 1978, 49, 208–212. [Google Scholar] [CrossRef]
  34. Dewaele, A.; Loubeyre, P.; Mezouar, M. Equations of state of six metals above 94 GPa. Phys. Rev. B 2004, 70, 094112. [Google Scholar] [CrossRef]
  35. Dewaele, A.; Torren, M.; Loubeyre, P.; Mezouar, M. Compression curves of transition metals in the Mbar range: Experiments and projector augmented-wave calculations. Phys. Rev. B 2008, 78, 104102. [Google Scholar] [CrossRef]
  36. Litasov, K.D.; Gavryushkin, P.N.; Dorogokupets, P.I.; Sharygin, I.S.; Shatskiy, A.; Fei, Y.; Rashchenko, S.V.; Seryotkin, Y.V.; Higo, Y.; Funakoshi, K.; et al. Thermal equation of state to 33.5 GPa and 1673 K and thermodynamic properties of tungsten. J. Appl. Phys. 2013, 113, 133505. [Google Scholar] [CrossRef]
  37. Anzellini, S.; Dewaele, A.; Occelli, F.; Loubeyre, P.; Mezouar, M. Equation of state of rhenium and application for ultra-high pressure calibration. J. Appl. Phys. 2014, 115, 043511. [Google Scholar] [CrossRef]
  38. Dubrovinsky, L.; Dubrovinskaia, N.; Bykova, E.; Bykov, M.; Prakapenka, V.; Prescher, C.; Glazyrin, K.; Liermann, H.P.; Hanfland, M.; Ekholm, M.; et al. The most incompressible metal osmium at static pressures above 750 gigapascals. Nature 2015, 525, 226–242. [Google Scholar] [CrossRef]
  39. Qi, X.; Cai, N.; Chen, T.; Wang, S.; Li, B. Experimental and theoretical studies on the elasticity of tungsten to 13 GPa. J. Appl. Phys. 2018, 124, 075902. [Google Scholar] [CrossRef]
  40. Dewaele, A. Equations of state of simple solids (including Pb, NaCl and LiF) compressed in helium or neon in the Mbar range. Minerals 2019, 9, 684. [Google Scholar] [CrossRef]
  41. Anzellini, S.; Errandonea, D.; Burakovsky, L.; Proctor, J.E.; Turnbull, R.; Beavers, C.M. Characterization of the high-pressure and high-temperature phase diagram and equation of state of chromium. Sci. Rep. 2022, 12, 6727. [Google Scholar] [CrossRef] [PubMed]
  42. Al’tshuler, L.V.; Brusnikin, S.E.; Kuz’menkov, E.A. Isotherms and Gruneisen functions for 25 metals. J. Appl. Mech. Tech. Phys. 1987, 28, 129–141. [Google Scholar] [CrossRef]
  43. Mashimo, T.; Liu, X.; Kodama, M.; Zaretsky, E.; Katayama, M.; Nagayama, K. Effect of shear strength on Hugoniot-compression curve and the equation of state of tungsten (W). J. Appl. Phys. 2016, 119, 035904. [Google Scholar] [CrossRef]
  44. Yokoo, M.; Kawai, N.; Nakamura, K.G.; Kondo, K.; Tange, Y.; Tsuchiya, T. Ultrahigh-pressure scales for gold and platinum at pressures up to 550 GPa. Phys. Rev. B 2009, 80, 104114. [Google Scholar] [CrossRef]
  45. Ayres, R.A.; Shannette, G.W.; Stein, D.F. Elastic constants of tungsten-rhenium alloys from 77 to 298 K. J. Appl. Phys. 1975, 46, 1526–1530. [Google Scholar] [CrossRef]
  46. Katahara, K.W.; Manghnani, M.H.; Fisher, E.S. Pressure derivatives of the elastic moduli of BCC Ti-V-Cr, Nb-Mo and Ta-W alloys. J. Phys. F. Met. Phys. 1979, 9, 773–790. [Google Scholar] [CrossRef]
  47. Khein, A.; Singh, D.J.; Umrigar, C.J. All-electron study of gradient corrections to the local-density functional in metallic systems. Phys. Rev. B 1995, 51, 4105–4109. [Google Scholar] [CrossRef] [PubMed]
  48. Bernstein, B.T. Elastic properties of polycrystalline tungsten at elevated temperatures. J. Appl. Phys. 1962, 33, 2140. [Google Scholar] [CrossRef]
  49. Bolef, D.I.; De Klerk, J. Elastic constants of single-crystal Mo and W between 77 and 500 K. J. Appl. Phys. 1962, 33, 2311–2314. [Google Scholar] [CrossRef]
  50. Featherstont, F.H.; Neighbours, J.R. Elastic constants of tantalum, tungsten, and molybdenum. Phys. Rev. 1963, 130, 1324–1333. [Google Scholar] [CrossRef]
  51. Lowrie, R.; Gonas, A.M. Single-crystal elastic properties of tungsten from 24 to 1800 °C. J. Appl. Phys. 1967, 38, 4505–4509. [Google Scholar] [CrossRef]
  52. Nelder, J.A.; Mead, R. A simplex method for function minimization. Comput. J. 1965, 7, 308. [Google Scholar] [CrossRef]
  53. Young, D.A.; Cynn, H.; Söderlind, P.; Landa, A. Zero-Kelvin compression isotherms of the elements 1 ≤ Z ≤ 92 to 100 GPa. J. Phys. Chem. Ref. Data 2016, 45, 043101. [Google Scholar] [CrossRef]
  54. Giri, A.K.; Mitra, G.B. Extrapolated values of lattice constants of some cubic metals at absolute zero. J. Phys. D Appl. Phys. 1985, 18, L75–L78. [Google Scholar] [CrossRef]
Figure 1. The low-temperature heat capacity of tungsten in comparison to the literature (Kirillin et al. (1963) [17], Stull and Prophet (1971) [18], Glushko (1982) [19], White and Minges (1997) [24], Chase (1998) [21], Bodryakov (2015) [25], Ablaster (2018) [22]).
Crystals 13 01470 g001
Figure 2. The heat capacity of tungsten in the high-temperature region in comparison to the literature (Gustafson (1985) [4], Kirillin et al. (1963) [17], Stull and Prophet (1971) [18], Glushko (1982) [19], Barin (1995) [20], Chase (1998) [21], Arblaster (2018) [22], Chekhovskoi (1980) [23], White and Minges (1997) [24], Bodryakov (2015) [25]).
Crystals 13 01470 g002
Figure 3. The low-temperature relationship of the thermal expansion coefficient of tungsten with temperature in comparison to the literature (Wang and Reeber (1998) [15], White and Minges (1997) [24], Bodryakov (2015) [25], Arblaster (2018) [27], Gray (1972) [28], Novikova (1974) [29], Touloukian (1975) [30], Slack (1975) [31]).
Crystals 13 01470 g003
Figure 4. The temperature dependence of the thermal expansion coefficient of tungsten in the high-temperature region in comparison to the literature (Gustafson (1985) [4], Wang and Reeber (1998) [15], White and Minges (1997) [24], Bodryakov (2015) [25], Arblaster (2018) [27], Gray (1972) [28], Novikova (1974) [29], Touloukian (1975) [30], Slack (1975) [31]).
Crystals 13 01470 g004
Figure 5. The volume compression of tungsten at 298.15 K compared to the experimental data (Ming (1978) [33], Dewaele (2008) [35], Litasov (2013) [36], Dubrovinsky (2015) [38], Dewaele (2019) [40], Anzellini (2022) [41], Al’tshuler (1987) [42], Mashimo (2016) [43]).
Crystals 13 01470 g005
Figure 6. The volume compression of tungsten up to 350 kbar at different temperatures compared to the experimental data (Vaidya (1970) [32], Ming (1978) [33], Litasov (2013) [36], Qi (2018) [39], Dewaele (2019) [40], Anzellini (2022) [41]).
Crystals 13 01470 g006
Figure 7. The temperature dependence of the isothermal (BT) and adiabatic (BS) bulk moduli of tungsten in comparison to the literature (Bernstein (1962) [48], Bolef and De Klerk (1962) [49], Featherstont and Neighbours (1963) [50], Lowrie (1967) [51], Dorogokupets and Oganov (2007) [6]).
Crystals 13 01470 g007
Table 1. Results taken from basic handbooks and review papers on thermodynamic functions of tungsten (CP, J·mol−1·K−1).
ΔT, KCP (298.15)CP (Tm)Ref.
0–350024.292[17] (Kirillin, 1963)
100–360024.29661.714[18] (Stull, 1971)
298.15–360024.42[23] (Chekhovskoi, 1980)
100–369524.27049.762[19] (Glushko, 1982)
298.15–369524.16053.708[4] (Gustafson, 1985)
20–340024.297[24] (White, 1997)
298.15–368024.29765.664[20] (Barin, 1995)
100–368024.29566.149[21] (Chase, 1998)
1–369555.41[25] (Bodryakov, 2015)
5–368724.25556.525[22] (Arblaster, 2018)
Table 2. Basic handbooks and review papers on thermal expansion data for tungsten.
ΔT, KDataFormRef.
100–2000α, ΔL/L0T[28] (Gray, 1972)
2–3200αT, P[29] (Novikova, 1974)
5–3600α, ΔL/L0T, P, A[30] (Touloukian, 1975)
0–3000αT[31] (Slack, 1975)
298–3695ΔG(P,T)P, A[4] (Gustafson, 1985)
300–3700αT[5] (Saxena, 1990)
10–3500αT, P, A[24] (White, 1997)
50–3600a, αT, P, A[15] (Wang, 1998)
1–3695αT, P[25] (Bodryakov, 2015)
0–3687a, α, V, ρT[27] (Ablaster, 2018)
Note: a—lattice parameter. Form of data presentation: T—Table, P—Plot, A—Approximation.
Table 3. Isothermal compressibility measurement data for tungsten.
ΔP, kbarMethod *1Form *2EoS *3B0, kbarn0Ref.
0–45PCAT, EoSMur3000.8919.101[32] (Vaidya, 1972)
13.5–94DACT, P, EoSBM330704.32[33] (Ming, 1978)
50–4000ShWT[42] (Al’tshuler, 1987)
0–1530DACT, P, EoSVin29604.30[34] (Dewaele, 2004)
281–1970DACT[35] (Dewaele, 2008)
0–335 *4DACT, P, EoSVin3080 (10)4.20 (5)[36] (Litasov, 2013)
0–2000DACP, EoSBM33068 (15)4.53 (4)[37] (Dubrovinsky, 2013)
Vin3019 (12)4.82 (3)
14.2–1440DACT[38] (Anzellini, 2014)
0–4000ShWP, EoSBM331754.05[43] (Mashimo, 2016)
Vin31853.99
13–128UIT[39] (Qi, 2018)
0–1550DACEoSVin29864.37[40] (Dewaele, 2019)
0–1314DACT[41] (Anzellini, 2022)
*1 Method: PCA—piston-cylinder apparatus; DAC—diamond anvil cell; ShW—recalculation of shock-wave measurements; UI—ultrasonic interferometry. *2 Form of data presentation: T—Table, P—Plot. *3 EoS: Mur—Murnaghan, BM3—third-order Birch-Murnaghan, Vin—Vinet. *4 Measurements are performed in the range between 300 and 1673 K.
Table 4. Summary of optimized EoS parameters for tungsten.
EquationParameterValue
Thermodynamic functions
(1)–(3)
Υ1, J·mol−1·K−110.36369
Υ2, J·mol−1·K−115.32115
Υ3, J·mol−1·K−15.215750
θ1, K165.4360
θ2, K297.1887
θ3, K3762.0056
ΔS0, J·mol−1·K−10.090141
h, J·mol−1·Km6.700803 × 10–14
m4.892331
EoS (5, 6)n03.73390
n1, K–0.59.2262 × 10–4
Bulk modulus (8)B0, kbar3117.4
s11.0222 × 10–4
s27.2271 × 10–2
s310.999
ω1, K2.1784
ω2, K1432.695
ω3, K13,956.82
Thermal expansion (7)V0, cm3/mol9.5222
X11.1828 × 10–6
X21.2692 × 10–5
X31.5524 × 10–6
Θ1, K112.2153
Θ2, K253.1136
Θ3, K2150.4715
g, Kk8.8124 × 10–18
k4.305338
Disclaimer/Publisher’s Note: The statements, opinions and data contained in all publications are solely those of the individual author(s) and contributor(s) and not of MDPI and/or the editor(s). MDPI and/or the editor(s) disclaim responsibility for any injury to people or property resulting from any ideas, methods, instructions or products referred to in the content.

