
Impurity Oxygen-Triggered α- → β-Si3N4 Phase Transformation at 1900 °C

 ,
,
Abstract
:
1. Introduction
2. Experimental Procedures
2.1. Starting Powders and Heat Treatment Condition
2.2. Characterizations
3. Results and Discussion
3.1. α- → β -Si3N4 Phase Transformation Behaviors
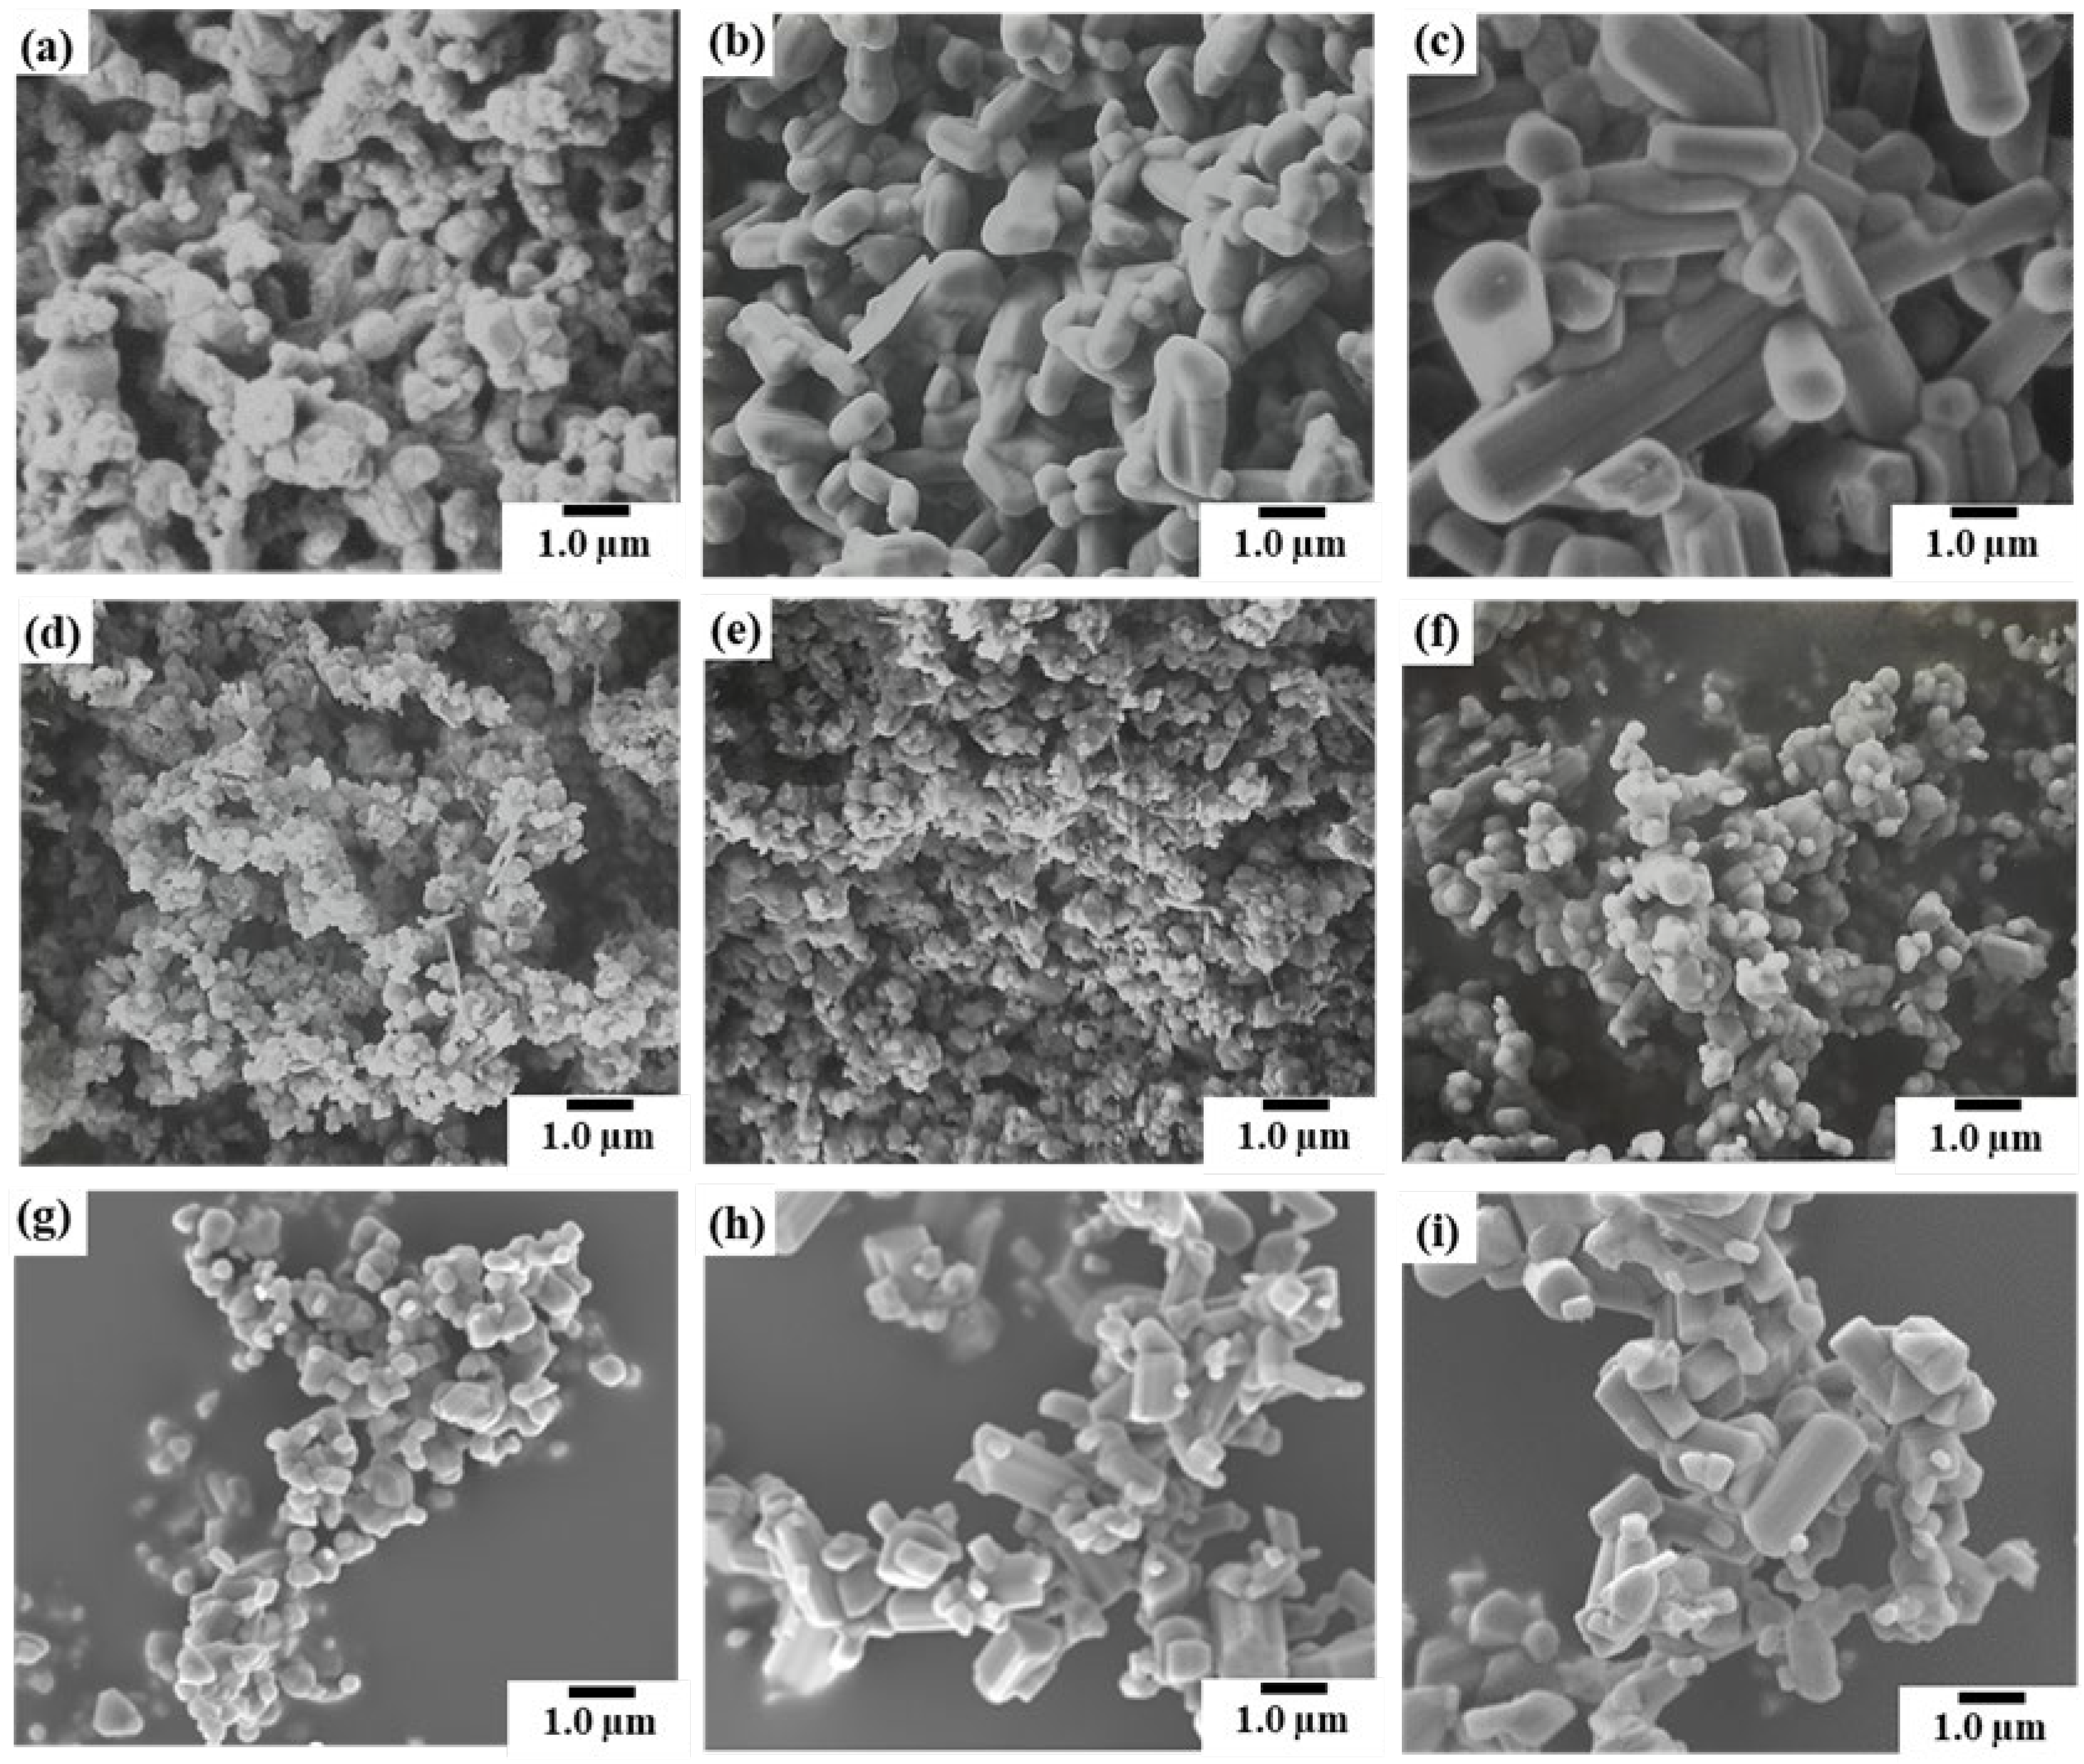
3.1.1. β-Phase Content and Morphological Changes
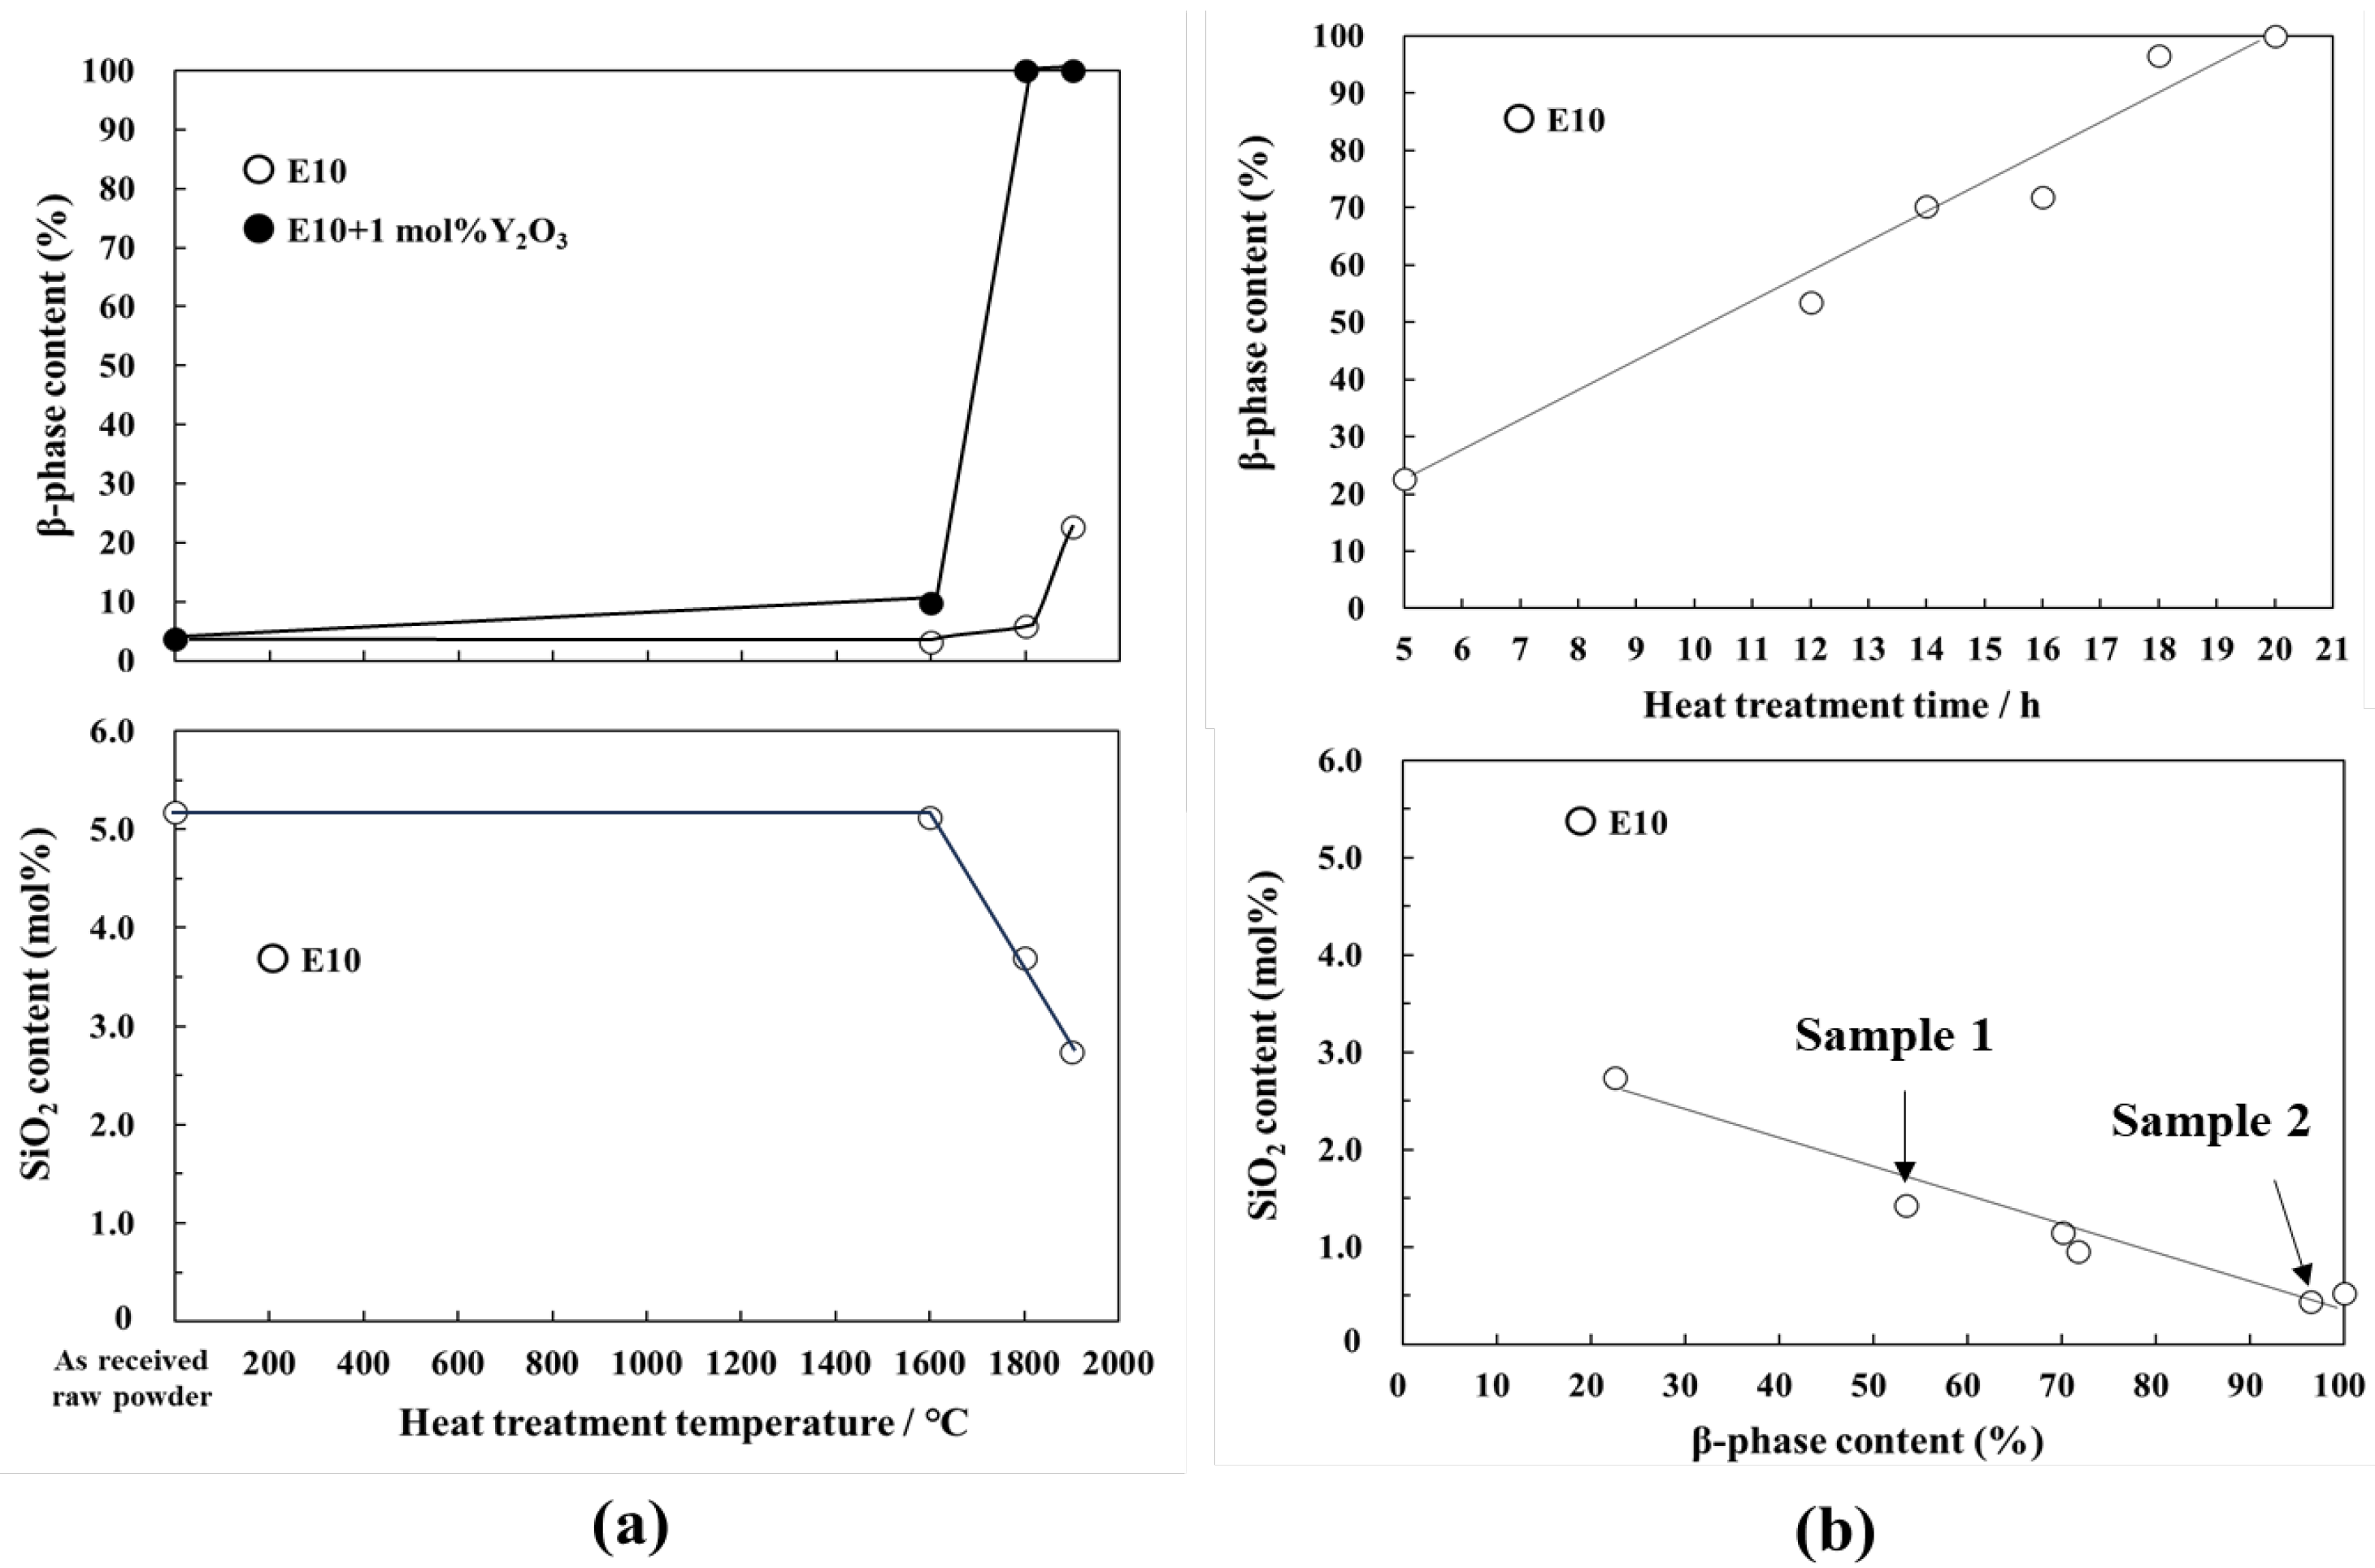
3.1.2. Relation between Chemical Composition and β-Phase Content
3.2. Nanostructure Characterization by HAADF-STEM and STEM-EDS Analyses
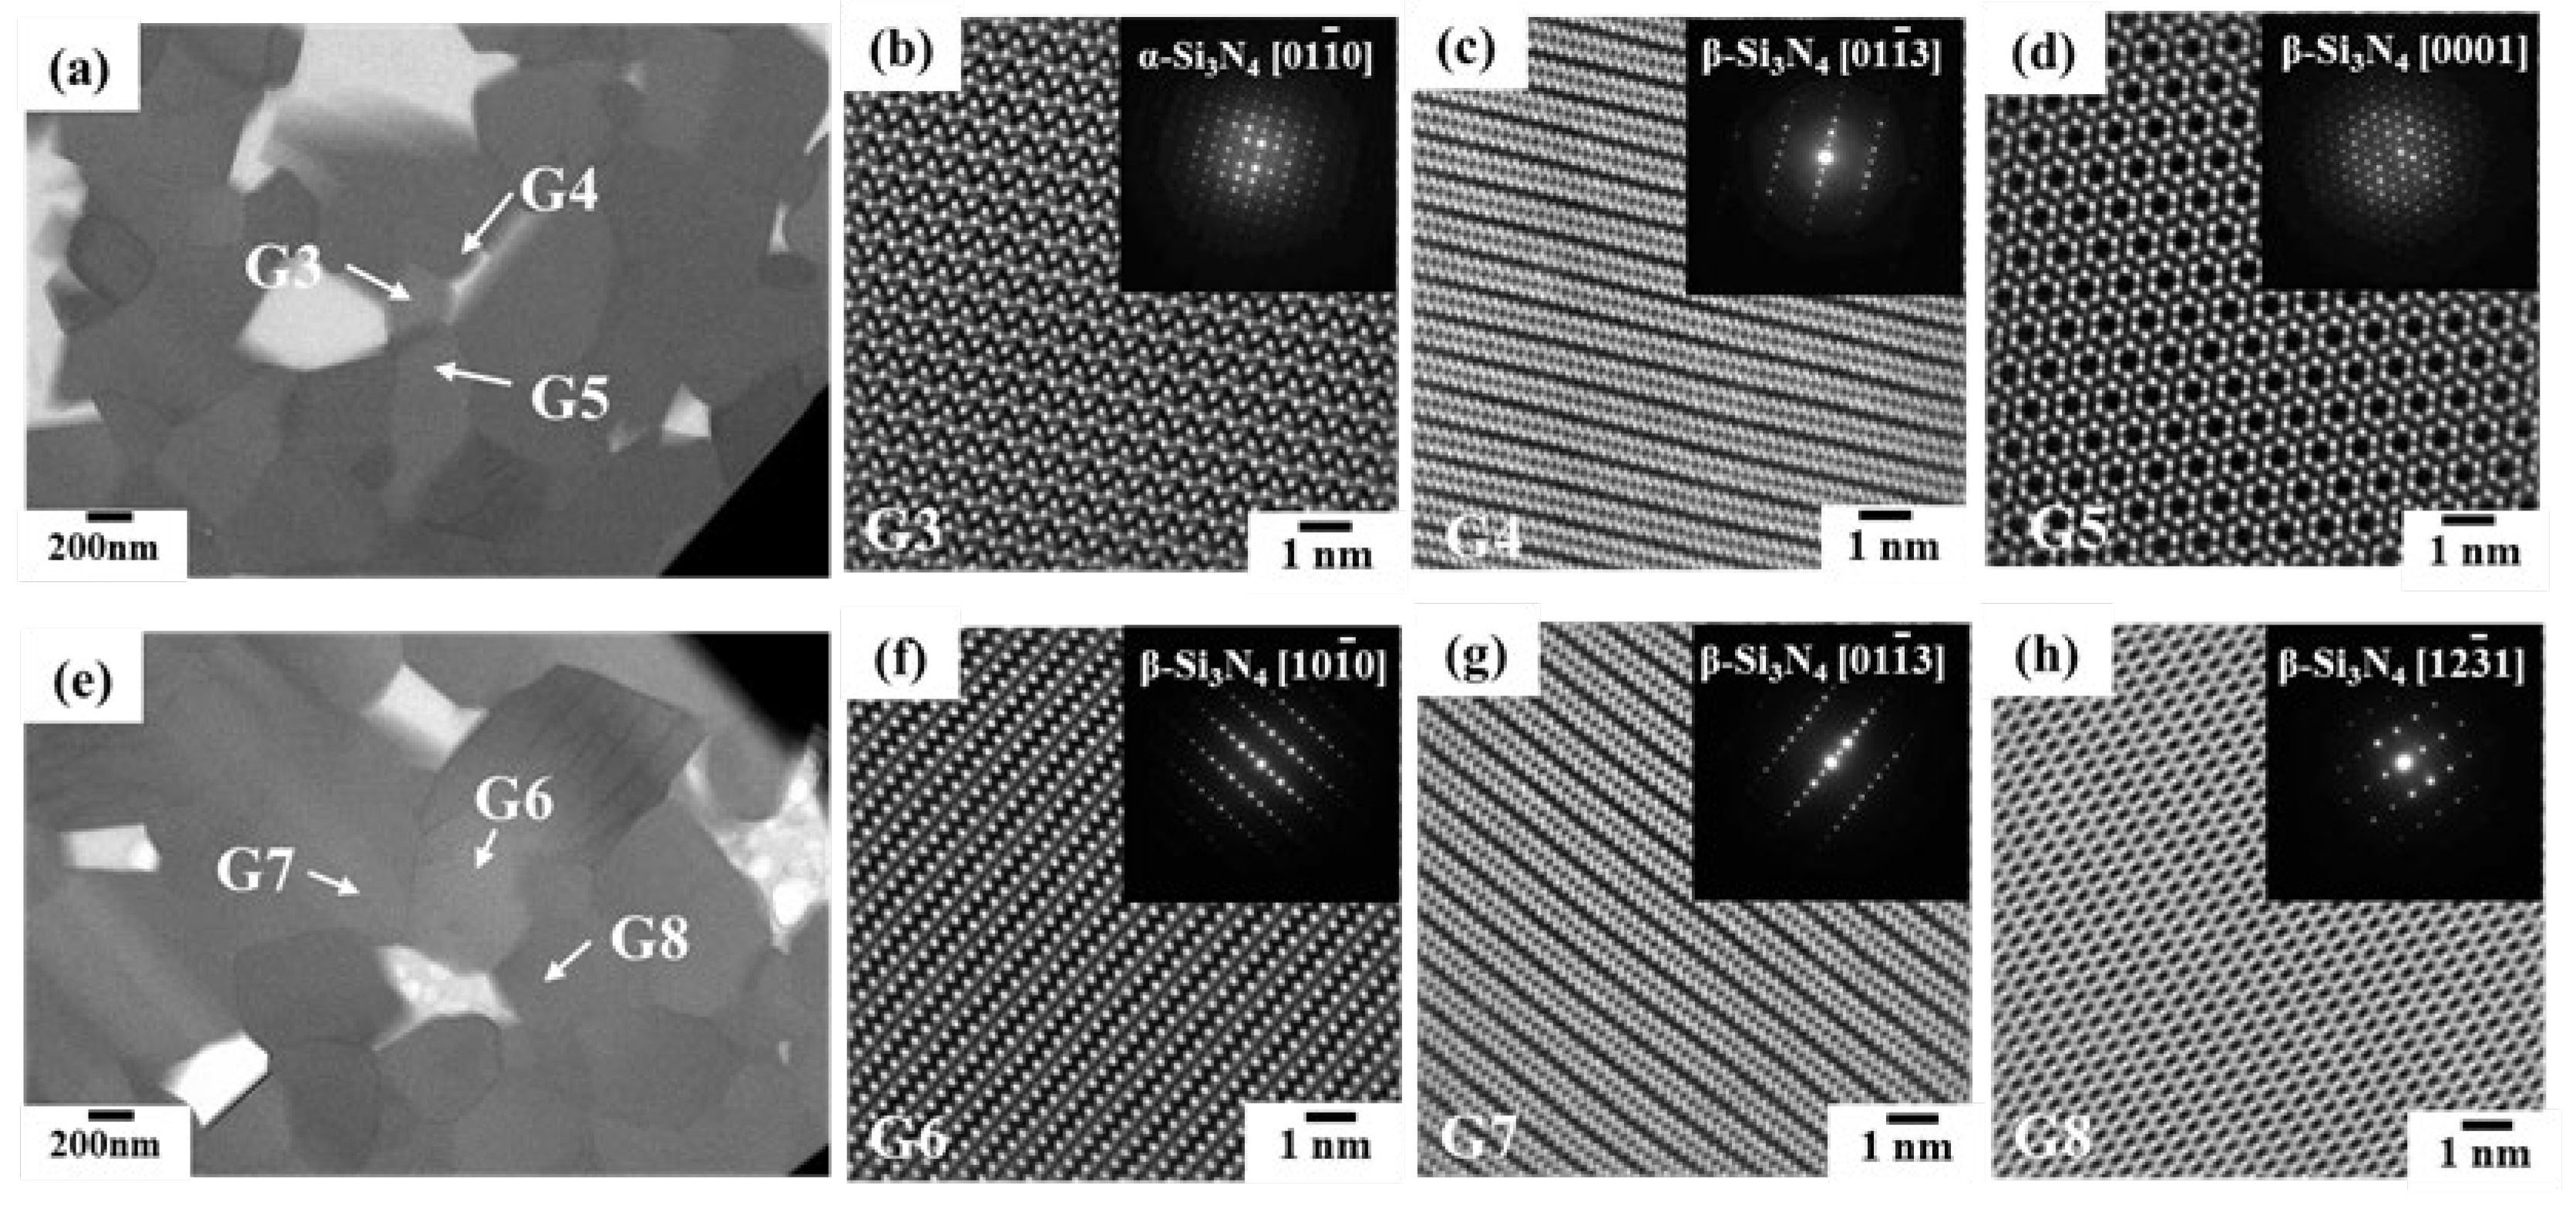
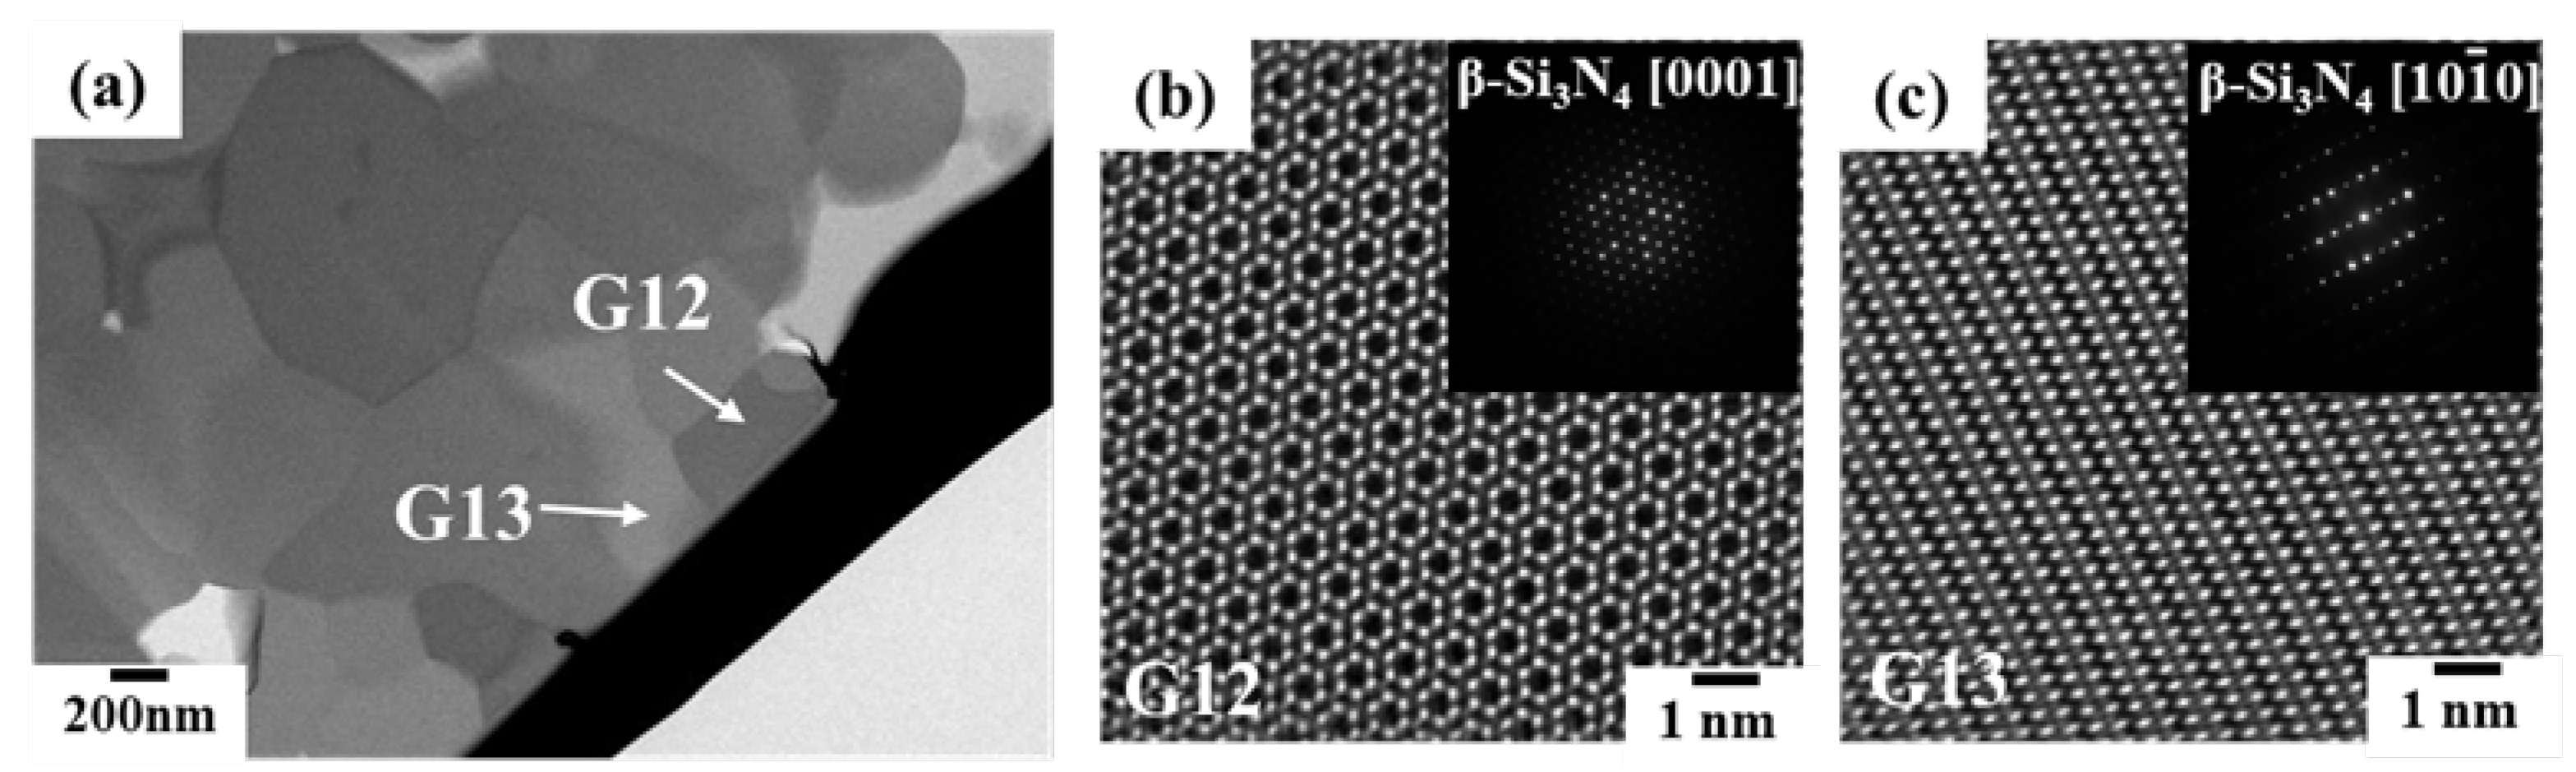
3.2.1. Phase Identification
- (a)
- Sample 1 with β-phase content of 53.5%
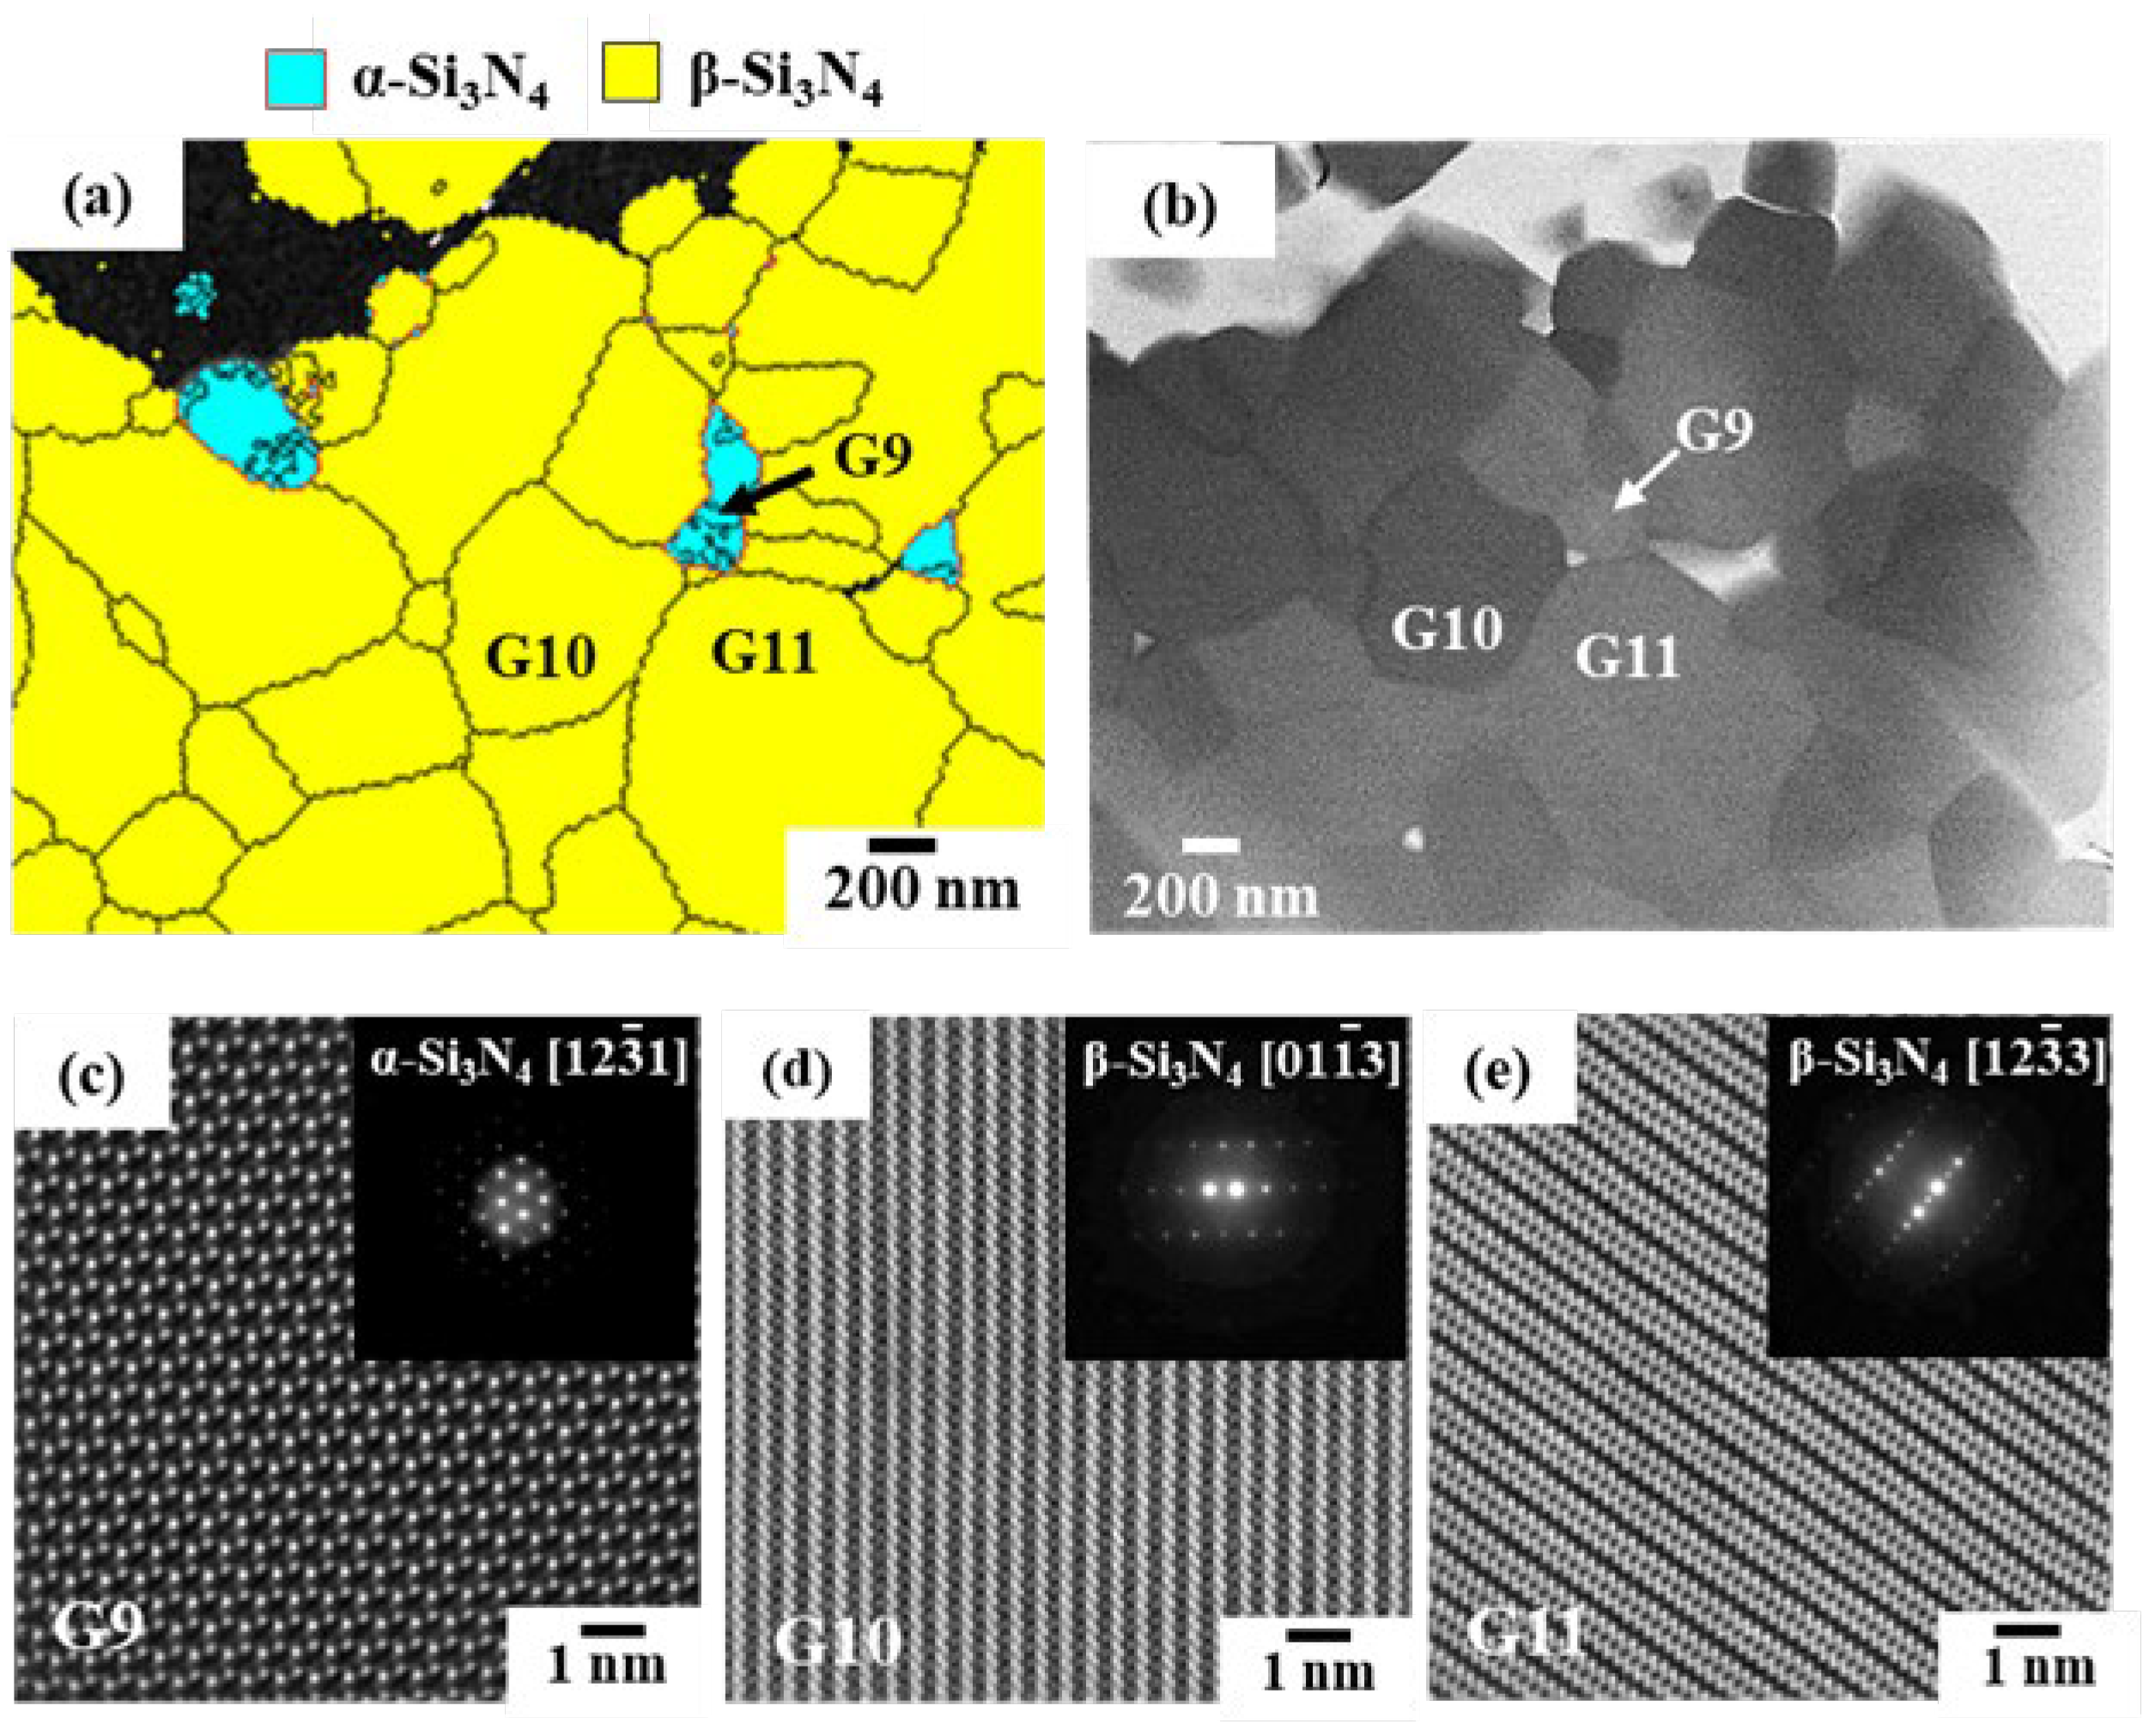
- (b)
- Sample 2 with β-phase content of 96.5%
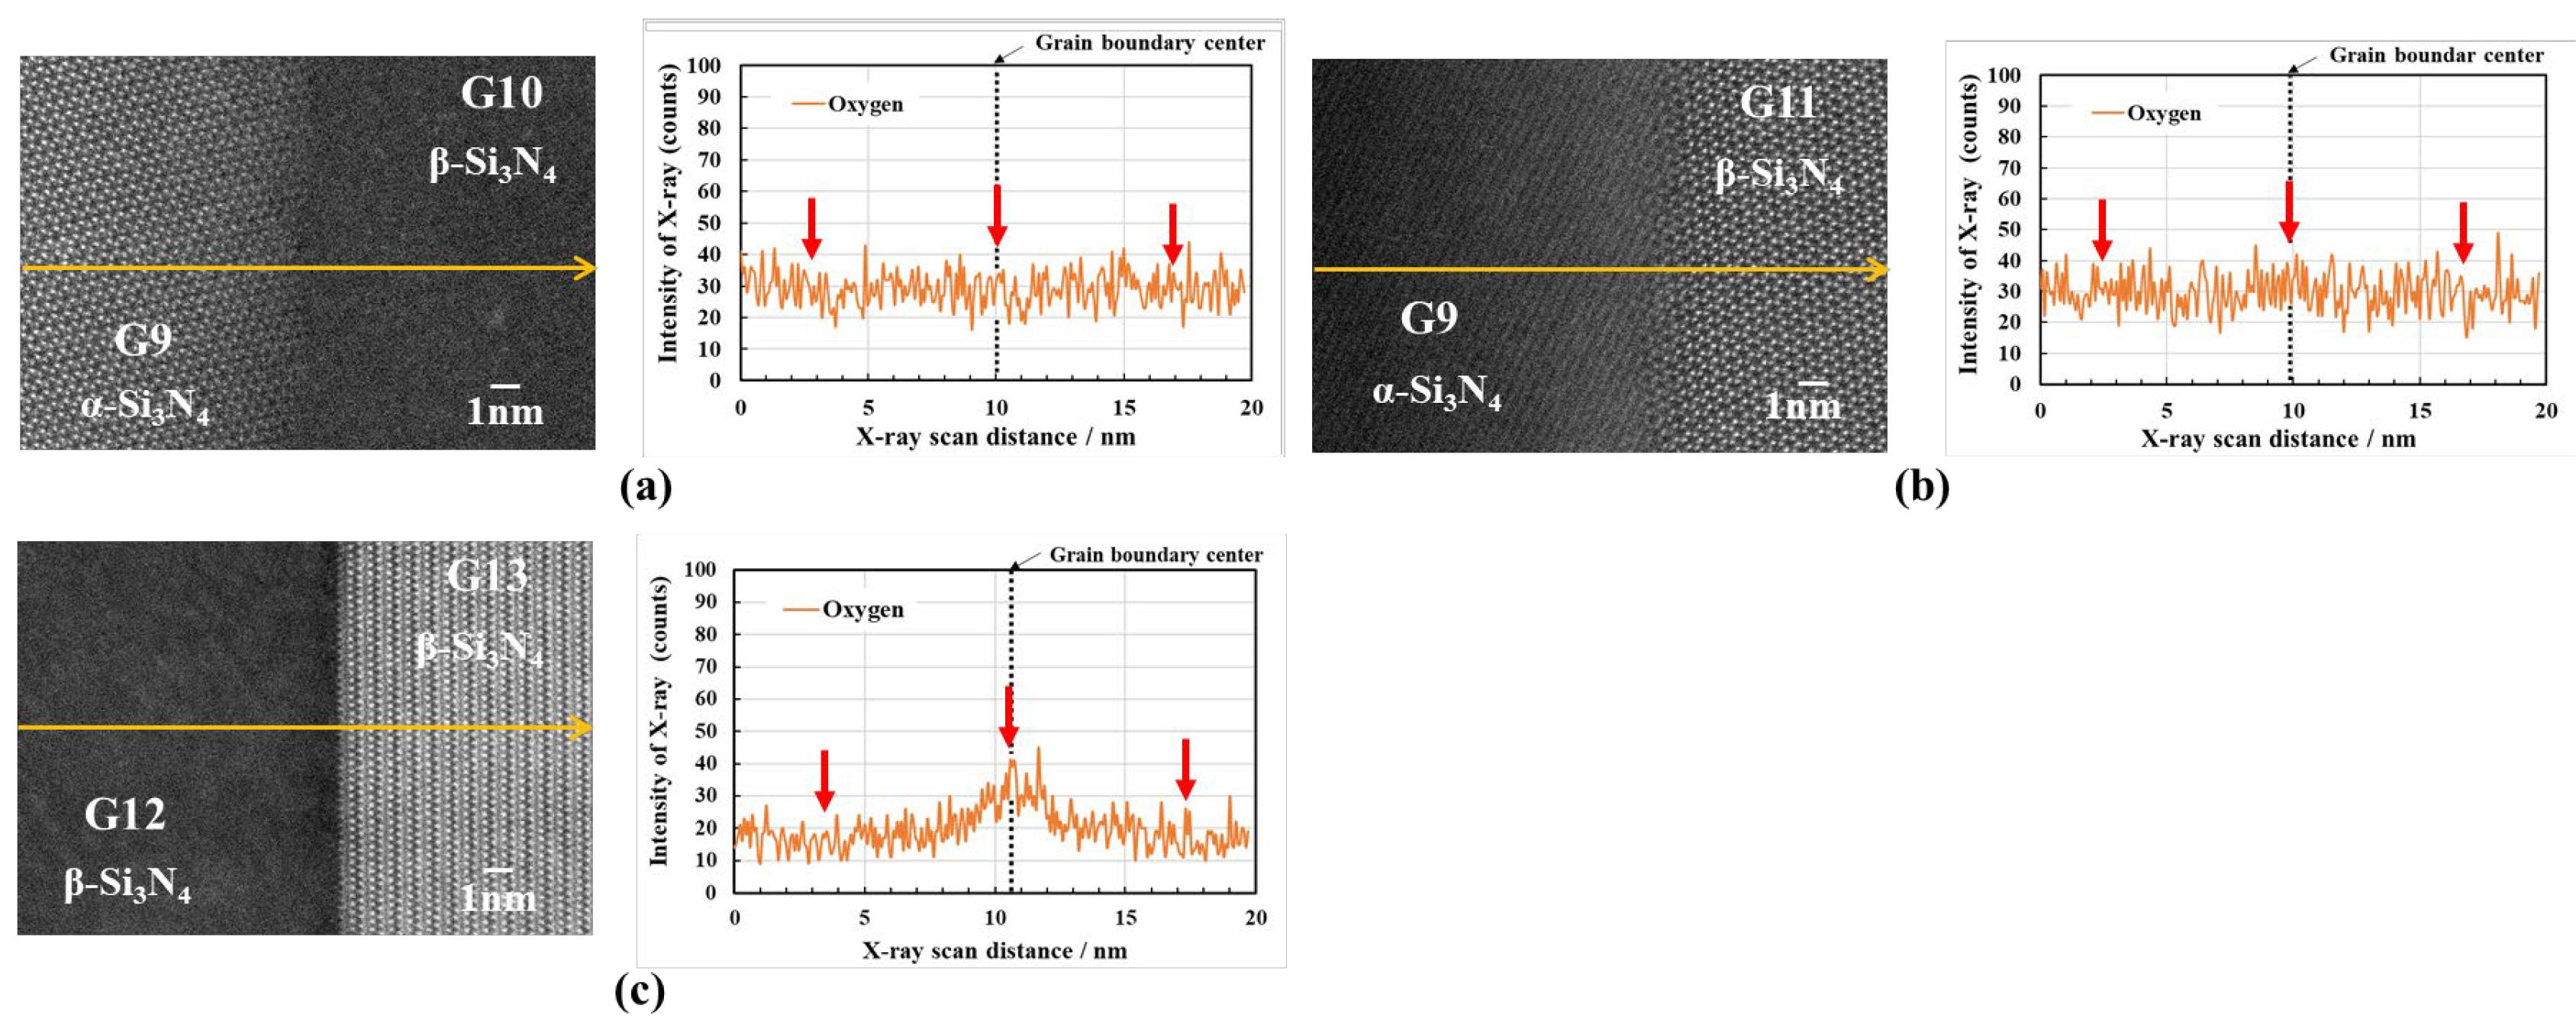
3.2.2. Oxygen Impurity Contents within Si3N4 Crystal Grains and at Two-Grain Boundaries
3.3. Role of Impurity Oxygen in α- → β-Si3N4 Phase Transformation
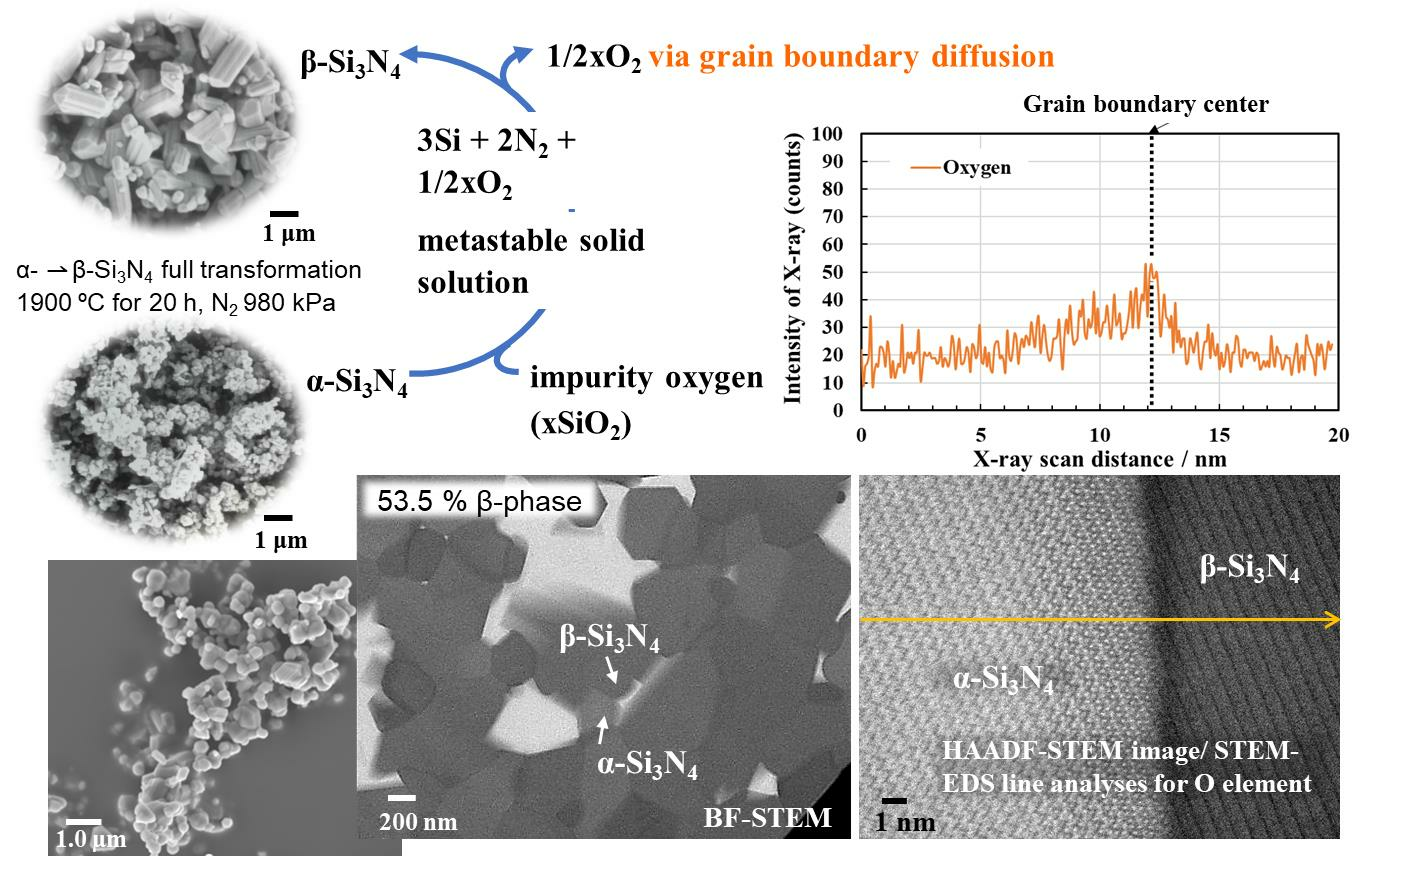
[3Si + 2N2 + 1/2xO2] → β-Si3N4 crystal + 1/2xO2 ↑
4. Conclusions
- (1)
- The α- → β-Si3N4 phase transformation was found to proceed mainly at 1900 °C, and the extensive heat treatment for up to 20 h achieved full transformation to afford rod-like β-Si3N4 polycrystallites. This transformation temperature was found to be 33 °C lower than the theoretical α-Si3N4 dissociation temperature.
- (2)
- The impurity O contents of the powder samples after the 1900 °C heat treatment for 5 h and 20 h were measured to be 0.64 and 0.12 wt%, respectively. At such lower oxygen contents, the silicon oxynitride liquid phase formation at 1900 °C was excluded according to the phase diagram reported for the binary Si3N4-SiO2 system.
- (3)
- The HAADF-STEM, as well as the STEM-EDS analyses performed on the 1900 °C heat-treated powder samples, also revealed no evidence for the formation of the secondary crystalline or glassy phases at the Si3N4 two-grain boundaries.
- (4)
- The HAADF-STEM/STEM-EDS analyses performed on the area near the two-grain boundary clarified that, at the β-phase content of 53. 5%, regardless of the phase combination, the impurity oxygen content at the two-grain boundary was higher than those within the two Si3N4 crystal grains.
- (5)
- As a possible dominant mechanism, the oxide additive-free α- → β-Si3N4 phase transformation at 1900 °C was suggested to be governed by the formation of metastable solid solution between the α-Si3N4 and the impurity oxygen remained at approximately 0.6 wt%, which promoted the dissociation below the theoretical α-Si3N4 dissociation temperature to afford thermodynamically favorable β-Si3N4. Along with the β-Si3N4 formation, the impurity oxygen was concentrated at the Si3N4 crystal grain boundaries and subsequently released from the sample via the grain boundary diffusion.
Supplementary Materials
Author Contributions
Funding
Data Availability Statement
Conflicts of Interest
References
- Yang, Y.; Gomba, L.D.; Rodriguez, R.; Mak, C.; Emadi, A. Automotive Power Module packing: Current Status and Future Trends. IEEE Access 2020, 8, 160126–160144. [Google Scholar] [CrossRef]
- Mustain, H. Si3N4 SUBSTRATE FOR HYBRID/ELECTRIC VEHICLE DRIVE TRAIN INVERTER POWER MODULE Design-to-Cost Si3N4 Ag-Free AMB Metal Ceramic Substrate. Heraeus Electronics—Battery Show North America. September 2022, PowerPoint Presentation (thebatteryshow.com). Available online: https://www.thebatteryshow.com/content/dam/Informa/amg/novi/2022/docs/14_45%20-%20Mustain.pdf (accessed on 1 July 2023).
- Tran, C.V.; La, D.D. Synthesis of silicon nitride ceramic material using direct nitridation process. Int. J. Adv. Eng. Res. Sci. 2018, 5, 101–105. [Google Scholar] [CrossRef]
- Zerr, A.; Miehe, G.; Serghiou, G.; Schwarz, M.; Kroke, E.; Riedel, R.; Fuess, H.; Kroll, P.; Boehler, R. Synthesis of cubic silicon nitride. Nature 1999, 400, 340–342. [Google Scholar] [CrossRef]
- Jiang, J.Z.; Kragh, F.; Frost, D.J.; Ståhl, K.; Lindelov, H. Hardness and thermal stability of cubic silicon nitride. J. Phys. Condens. Matter. 2001, 13, L515. [Google Scholar] [CrossRef]
- Riley, F.L. Silicon nitride and related materials. J. Am. Ceram. Soc. 2000, 83, 245–265. [Google Scholar] [CrossRef]
- Sarin, V.K. On the α-to-β Phase Transformation in Silicon Nitride. Mater. Sci. Eng. 1998, 105–106, 151–159. [Google Scholar] [CrossRef]
- Goto, Y.; Thomas, G. Phase Transformation and Microstructure Change of Si3N4 During Sintering. J. Mater. Sci. 1995, 30, 2194–2200. [Google Scholar] [CrossRef]
- Greskovich, C.; Prochazka, S. Observation on the α → β-Si3N4 transformation. J. Am. Ceram. Soc. 1977, 60, 471–472. [Google Scholar] [CrossRef]
- Bowen, L.J.; Weston, R.J.; Carruthers, T.G.; Brook, R.J. Hot-pressing and α-β phase transformation ins silicon nitride. J. Mater. Sci. 1978, 13, 341–350. [Google Scholar] [CrossRef]
- Kim, J.R.; Kim, C.H. Effects of ZrO2 and Y2O3 dissolved zyttrite on the densification and the α/β phase transformation of Si3N4 in Si3N4-ZrO2 composite. J. Mater. Sci. 1990, 25, 493–498. [Google Scholar] [CrossRef]
- Park, J.Y.; Kim, J.R.; Kim, C.H. Effects of free silicon on the α to β phase transformation in silicon nitride. J. Am. Ceram. Soc. 1987, 70, C240–C242. [Google Scholar] [CrossRef]
- Messier, D.R.; Riley, F.L.; Brook, R.J. The α/β Silicon Nitride Phase Transformation. J. Mater. Sci. 1978, 13, 1119–1205. [Google Scholar] [CrossRef]
- Homma, K.; Okada, H.; Fujikawa, T.; Tatuno, T. HIP sintering of silicon nitride without additives. Yogyo-Kyokai-Shi 1987, 95, 299–334. [Google Scholar] [CrossRef]
- Tanaka, I.; Pezzotti, G.; Miyamoto, Y.; Okamoto, T. Fracture toughness of Si3N4 and its Si3N4 whisker composite without sintering aids. J. Mater. Sci. 1993, 28, 4217–4222. [Google Scholar] [CrossRef]
- Tanaka, I.; Pezzotti, G.; Okamoto, T.; Miyamoto, Y.; Koizumi, M. Hot isostatics press sintering and properties of silicon nitride without additives. J. Am. Ceram. Soc. 1989, 72, 1656–1660. [Google Scholar] [CrossRef]
- Lu, P.; Danforth, S.C.; Symons, W.T. Microstructure and grain-boundary characterization of HIP’ed high-purity silicon nitride. J. Mater. Sci. 1993, 28, 4217–4222. [Google Scholar] [CrossRef]
- Hou, Z.; Wang, H.; Yang, Y.; Song, X.; Chen, S.; Wan, B.S.; Zhao, X.; Shang, M.; Chen, B. High-pressure synthesis of high-performance β-Si3N4 bulk without additives. Ceram. Int. 2020, 46, 12449–12457. [Google Scholar] [CrossRef]
- Bradley, R.S.; Murnro, D.C.; Whitfield, M. The reactivity and polymorphism of selected nitrides at high temperatures and high pressures. J. Inorg. Nucl. Chem. 1966, 28, 1803–1812. [Google Scholar] [CrossRef]
- Hirao, K.; Nagaoka, T.; Brito, M.E.; Kanzaki, S. Microstructure Control of Silicon Nitride by Seeding with Rodlike β-Silicon Nitride Particles. J. Am. Ceram. Soc. 1994, 77, 1857–1862. [Google Scholar] [CrossRef]
- Imamura, H.; Hirao, K.; Brito, M.E.; Toriyama, M.; Kanzaki, S. Further Improvement in Mechanical Properties of Highly Anisotropic Silicon Nitride Ceramics. J. Am. Ceram. Soc. 2000, 83, 495–500. [Google Scholar] [CrossRef]
- Yokota, H.; Ibukiyama, M. Effect of the addition of β-Si3N4 nuclei on the thermal conductivity of β-Si3N4 ceramics. J. Eur. Ceram. Soc. 2003, 23, 1183–1191. [Google Scholar] [CrossRef]
- Liang, Z.H.; Zhang, H.; Gui, L.; Li, J.; Peng, G.; Jiang, G. Effects of whisker-like β-Si3N4 seeds on phase transformation and mechanical properties of α to β-Si3N4 composites using MgSiN2 as additives. Ceram Int. 2013, 39, 2743–2751. [Google Scholar] [CrossRef]
- Dai, J.; Li, J.; Chen, Y.; Yang, L.; Sun, G. Preparation of the rod-like β-Si3N4 particles favoring the self-reinforcing Si3N4 ceramics. Mater. Res. Bull. 2003, 38, 609–615. [Google Scholar] [CrossRef]
- Vućković, A.; Bošković, S.; Matović, B.; Vlajić, M.; Krstic, V. Effect of β- Si3N4 seeds on densification and fracture toughness of silicon nitride. Ceram. Int. 2006, 32, 303–307. [Google Scholar] [CrossRef]
- Hirao, K.; Tsuge, A.; Brito, M.E.; Toriyama, M.; Kanzaki, S. Preparation of Rod-like β-Si3N4 Single Crystal Particles. J. Ceram. Soc. Japan 1993, 101, 1078–1080. [Google Scholar] [CrossRef]
- Imamura, H.; Kawata, T.; Sobue, M.; Hitachi Metals Co., Ltd. Methods for Producing Silicon Nitride and Silicon Nitride Sintered Specimens and Circuit Boards Using Them. Japanese Patent 3775335, 3 March 2006. [Google Scholar]
- Imamura, H.; Kawata, T.; Sobue, M.; Hitachi Metals Co., Ltd. Methods for Producing Silicon Nitride and Silicon Nitride Sintered Specimens and Circuit Boards Using Them. Japanese Patent 4518020, 28 May 2010. [Google Scholar]
- Imamura, H.; Kawata, T.; Honda, S.; Iwamoto, Y. A facile method to produce rodlike β-Si3N4 seed crystallites for bimodal structure controlling. J. Am. Ceram. Soc. 2023, 106, 1694–1705. [Google Scholar] [CrossRef]
- Imamura, H.; Kawata, T.; Honda, S.; Iwamoto, Y. Thermal conductivity improvement in Si3N4 ceramics via grain purification. J. Am. Ceram. Soc. 2023, in press. [CrossRef]
- Pejryd, L. The Effect of Temperature and Yttria Content on the Properties of Hot Isostatically Pressed Si3N4. Mater. Sci. Eng. 1988, 105–106, 169–174. [Google Scholar] [CrossRef]
- Shin-Etsu Chemical Co., Ltd. (Homepage on the Internet). Production Introduction of Rare-Earth Oxides. Available online: https://www.rare-earth.jp/en/product.html (accessed on 25 September 2023).
- Gazzara, C.P.; Messier, D.R. Determination of Phase Content of Si3N4 by X-ray Diffraction Analysis. Bull. Am. Ceram. Soc. 1977, 56, 777–780. [Google Scholar]
- Clarke, D.R.; Thomas, G. Grain Boundary Phases in a Hot-Pressed MgO Fluxed Silicon Nitride. J. Am. Ceram. Soc. 1995, 60, 491–494. [Google Scholar] [CrossRef]
- Kleebe, H.J.; Cinibulk, M.K.; Cannon, R.M.; Rühle, M. Statistical Analysis of the intergranular Film Thickness in Silicon Nitride Ceramics. J. Am. Ceram. Soc. 1993, 76, 1969–1977. [Google Scholar] [CrossRef]
- Kleebe, H.J. Structure and Chemistry of interface in Si3N4 Ceramics Studied by TEM. J. Ceram. Soc. Japan 1997, 105, 453–475. [Google Scholar] [CrossRef]
- Kim, S.K.; Zhang, Z.; Kasiser, U. Local symmetry braking of a thin crystal structure of β-Si3N4 as revealed by spherical aberration corrected high-resolution transmission electron microscopy images. J. Electron Microsc. 2012, 61, 145–157. [Google Scholar] [CrossRef]
- Babini, G.N.; Bellosi, A.; Vincenzini, P. Densification and α-β Transformation Mechanisms during Hot Presing of Si3N4-Y2O3-SiO2 Compositions. Mater. Chem. Phys. 1984, 11, 365–400. [Google Scholar] [CrossRef]
- Yang, J.F.; Shan, S.Y.; Janssen, R.; Schneider, G.; Ohji, T.; Kanzaki, S. Synthesis of fibrous β-Si3N4 structured porous ceramics using carbothermal nitridation of silica. Acta. Mater. 2005, 53, 2981–2990. [Google Scholar] [CrossRef]
- Zakorzhevskii, V.V. Effect of Oxygen Impurities and Synthesis Temperature on the Phase Composition of the Products of Self-Propagating High-Temperature Synthesis of Si3N4. Inorg. Mater. 2018, 54, 349–353. [Google Scholar] [CrossRef]
- Weiss, J.; Lukas, H.L.; Lorenz, J.; Petzow, G.; Krieg, H. Calculation of heterogeneous phase equilibria in oxide-nitride systems: I. The quaternary system C-Si-N-O. Calphad Comput. Coupling Phase Digar Thermochem. 1981, 5, 125–140. [Google Scholar] [CrossRef]
- Hillert, M.; Jonsson, S.; Sundman, B. Thermodynamic Calculation of the Si-N-O system. Int. J. Mater. Res. 1992, 83, 648–654. [Google Scholar] [CrossRef]
- Dai, J.; Li, J.; Chen, Y. The phase transformation behavior of Si3N4 with single Re2O3 (Re = Ce, Nd, Sm, Eu, Gd, Dy, Er, Yb) additive. Mater. Chem. Phys. 2003, 80, 356–359. [Google Scholar] [CrossRef]
- Hiraga, K.; Tsuno, K.; Shindo, D.; Hirabayashi, M.; Hayashi, S.; Hirai, T. Structure of α- and β-Si3N4 observed by 1MV electron microscopy. Philos. Mag. A 1983, 47, 483–489. [Google Scholar] [CrossRef]
- Ziegler, A.; Kisielowski, C.; Hoffmann, M.J.; Ritchie, R.O. Atomic Resolution Transmission Electron Microscopy of the intergranular Structure of a Y2O3-containing Silicon Nitride Ceramic. J. Am. Ceram. Soc. 2003, 86, 1777–1785. [Google Scholar] [CrossRef]
- Priest, H.H.; Burns, F.C.; Priest, G.L.; Skaar, E.C. The Oxygen Content of Alpha Silicon Nitride. J. Am. Ceram. Soc. 1973, 56, 395. [Google Scholar] [CrossRef]
- Seiferit, H.J.; Peng, J.Q.; Lukas, H.L.; Aldinger, F. Phase equilibria and thermal analysis of Si-C-N ceramics. J. Alloys Compd. 2001, 320, 251–261. [Google Scholar] [CrossRef]
- Xu, B.; Dong, J.; McMillan, P.F.; Shebanova, O.; Salamat, A. Equilibrium and metastable phase transitions in silicon nitride at high pressure: A first-principles and experimental study. Phys. Rev. B 2011, 84, 014113. [Google Scholar] [CrossRef]
- Liang, J.J.; Topor, L.; Navrotsky, A.; Mitomo, M. Silicon Nitride: Enthalpy of formation of α and β-poly-morphs and the effect of C and O impurities. J. Mater. Res. 1999, 14, 1959–1968. [Google Scholar] [CrossRef]
- Iwamoto, Y. Microstructure Control of Si-Based Non-Oxide Ceramics through Precursor Design. Ph.D. Thesis, Graduate School of Frontier Sciences, Department of Advanced Materials Science, The University of Tokyo, Tokyo, Japan, 2004. [Google Scholar] [CrossRef]


Disclaimer/Publisher’s Note: The statements, opinions and data contained in all publications are solely those of the individual author(s) and contributor(s) and not of MDPI and/or the editor(s). MDPI and/or the editor(s) disclaim responsibility for any injury to people or property resulting from any ideas, methods, instructions or products referred to in the content. |
© 2023 by the authors. Licensee MDPI, Basel, Switzerland. This article is an open access article distributed under the terms and conditions of the Creative Commons Attribution (CC BY) license (https://creativecommons.org/licenses/by/4.0/).
Share and Cite
Imamura, H.; Kura, K.; Kawata, T.; Honda, S.; Asaka, T.; Iwamoto, Y. Impurity Oxygen-Triggered α- → β-Si3N4 Phase Transformation at 1900 °C. Crystals 2023, 13, 1572. https://doi.org/10.3390/cryst13111572
Imamura H, Kura K, Kawata T, Honda S, Asaka T, Iwamoto Y. Impurity Oxygen-Triggered α- → β-Si3N4 Phase Transformation at 1900 °C. Crystals. 2023; 13(11):1572. https://doi.org/10.3390/cryst13111572
Chicago/Turabian StyleImamura, Hisayuki, Kazuhiro Kura, Tsunehiro Kawata, Sawao Honda, Toru Asaka, and Yuji Iwamoto. 2023. "Impurity Oxygen-Triggered α- → β-Si3N4 Phase Transformation at 1900 °C" Crystals 13, no. 11: 1572. https://doi.org/10.3390/cryst13111572