1. Introduction
The requirements for the characteristics of functional materials of electron technics, based on a nonlinear optical single crystal of lithium niobate (LN, LiNbO3), are increasing all the time. This increase requires the modification of existing and the development of new technologies for obtaining nominally pure large crystals of good optical quality, high compositional uniformity, and with a low photorefractive effect. Stoichiometric (SLN, R = [Li]/[Nb] = 1) and near-stoichiometric (NSLN, R ≈ 1) LN crystals are promising, since they have a lower value of the coercive field (≈2.3 kV/mm) compared to congruent crystals (≈23 kV/mm, CLN, R = 0.946). Thus, SLN and NSLN crystals are suitable as frequency converters of laser radiation on periodically polarized domain structures.
Several technological approaches are currently applied to obtain SLN crystals. SLN crystals can be grown using the Czochralski method from a melt with a significant excess of lithium (58.6 mol% Li
2O) [
1]. The main disadvantage of the method is the low growth rate. It also requires suppressing concentration supercooling. The crystals grown using this technology are small, have a high photorefractive effect, and have a large inhomogeneity of the refractive index along the growth axis. The strong difference between the composition of the growing crystal and the melt determines the nonuniformity of the refractive index. Such crystals are rarely suitable for applications. SLN crystals can also be grown using the Czochralski method using a double crucible method. An LN charge enriched with lithium (~58–60 mol% Li
2O) is melted in an external crucible, then the melt is transferred to the reactor with a movable platinum partition; the crystal is grown in the volume of the reactor. The added melt, or sometimes charge, should have a strictly stoichiometric composition. The composition of the melt should not change during the growth of an SLN crystal. The disadvantages of this method are the technical complexity of replenishing the charge in the crucible and the automation of its supply [
2,
3]. NSLN crystals can also be obtained using the Vapor Transport Equilibration (VTE) method. The method is based on the diffusion of gaseous lithium into the structure of the grown crystal. This increases the stoichiometry of the sample [
4]. However, this method does not uniformly increase the stoichiometry throughout the crystal (especially large crystals), therefore, the method is only suitable for thin wafers.
Crystals of high compositional uniformity with different ratios of Li/Nb (including SLN crystals) can be obtained with High Temperature Top Seeded Solution Growth (HTTSSG) technology. NSLN crystals grow from a congruent charge (R = 0.946) with the addition of alkali metals fluxes; flux limits the evaporation of lithium from the melt surface, and this ensures the growth of Me
2O (Me–Na, K, Rb, Cs) using HTTSSG [
5,
6]. K
2O flux is the most commonly used flux. The advantages of HTTSSG are a decrease in the crystallization temperature and the presence of an alkaline flux. The large-sized NSLN crystals have a high compositional uniformity. The disadvantage of the HTTSSG is the high concentration of potassium in the grown crystals (1 × 10
−2 – 2 × 10
−2 wt%). It can be compared with the concentration of traces of numerous impurities in a crystal. Potassium ions have a large radius (1.38 Å) and are unable to enter the O
6 oxygen octahedra of the LN crystal structure. Potassium becomes a mechanically trapped impurity localized on crystal defects.
Existing technologies for growing LN single crystals have disadvantages. This is why, today, a lot of studies have been dedicated to the search for new technologies for growing and doping LN crystals. All of these works are aimed at a better understanding of the connection between the growth technology and crystal properties. Such studies help to create LN-based materials with the given properties in a fairly wide range. The relationship between the melt and solid crystal was considered in reference [
7], in MgO-doped LN prepared using the micro-pulling-down method. The authors of reference [
8] prepared pressed pellets of LN:Pr, LN:Mg,Pr, obtained from nanopowders; the powders were prepared by high-energy ball milling with subsequent annealing. An interface electric field was applied during the growth of CLN and LN:Mg crystals using the micro-pulling-down technique in [
9]. Fano-resonant Si nanoparticles were introduced into a co-doped LN:Mg:Er single crystal using ion implantation and subsequent thermal annealing in reference [
10]. A series of MgO-doped LN crystals were simultaneously grown in one furnace using the modified vertical Bridgman method in reference [
11]. Mg-doped NSLN crystals were prepared by Li-rich growth and VTE in reference [
12]. The authors of reference [
13] showed the growth of LN:Pr:Mg co-doped crystal using the Bridgman method and studied the optical properties of the crystals. These are only a few examples of the most recent studies. Thus, the search for new LN growth methods is still highly relevant.
A new technological approach to obtaining NSLN crystals was recently developed in the ICT KSC RAS. The method essence is doping the LN charge with boron-containing compounds [
14,
15]. The concentration of boron cations in LN crystals grown from such a charge is at a trace level (~4 × 10
−4 mol%). The concentration is comparable with that of numerous uncontrollable impurities of other elements [
14]. The nonmetallic element B has a small ionic radius (0.15 Å for B(III), 0.25 Å for B(IV), [
16]); it is not a mechanically trapped impurity (like K, for example). Boron occupies the faces of the tetrahedral O
4 voids of the LN structure as a part of [BO
3]
3− groups [
14,
17]. Boron can also incorporate into the oxygen plane of the tetrahedral voids. The O
4 voids are much smaller than the O
6 ones. The main (Li
+ and Nb
5+) impurities and dopant metallic elements localize in the O
6 voids of the LN crystal structure. Metal cations with relatively large ionic radii are unable to localize in the O
4. Thus, only small-radius cations can localize in tetrahedral voids.
The ICT KSC RAS has developed the technology for growing boron-containing NSLN crystals. The technology includes three different ways of introducing the B
3+ dopant. The first method is a direct solid-phase doping of a congruent charge with boron oxide (B
2O
3) [
18]. The second method is a direct solid-phase doping with boric acid (H
3BO
3) [
19]. The third method is a homogeneous doping of Nb
2O
5 with boric acid resulting in the doped Nb
2O
5:B precursor [
20]. LN:B crystals obtained using these technologies have a high compositional and structural uniformity, and a low photorefractive effect [
14,
15,
17]. Their composition and the coercive field magnitude are close to those of a SLN crystal. This is important to create functional nonlinear optical materials for converting laser radiation on periodically polarized micron and submicron domains [
21]. Such materials are currently fabricated with heavily magnesium-doped (≈5.0 mol% MgO) LN crystals [
22,
23]. However, usually, crystals doped with magnesium near the main concentration threshold (≈5.5 mol% MgO [
24]) have a low compositional uniformity [
25] and thus a lot of structural defects [
26].
Direct experimental methods that determine the localization of trace amounts of light non-metallic elements in the crystals structure are absent. For example, the influence of boron on the LN crystals’ structure was studied by XRD, but not directly. The study has compared the structural details of two crystals: NSLN grown by HTTSSG with 5.5 wt% K
2O (NSLN(HTTSSG 5.5 wt% K
2O)) and NSLN doped with boron (LN:B) [
15]. The structural particularities studied in reference [
15] are as follows: the distortion of the anionic sublattice, and the type, number, and location of point defects. During the Rietveld adjustment, we have used vacancy split models, a review of which is given in reference [
27]. Rietveld refinement determines the distribution of basic and doping metal cations, and point defects in the form of irregularly located cations. In addition, Raman spectroscopy revealed the distortion of the anionic lattice of LN:B crystals, the distortion was absent from nominally pure SLN and CLN crystals [
14,
17].
Model calculations provide important information about the fine features of the structure, including the structure of lightly doped crystals. Reference [
28] is dedicated to theoretical studies of an anti-site defect cluster Nb
Li-4V
Li of pure and Mg
2+-, Sc
3+-, and Zr
4+-doped LN. The authors of reference [
29] calculated the Bi site and position in octahedrons; the dependence of optical properties and electronic structures on a dopant concentration in LN:Bi was considered. The authors of reference [
30] calculated the dependence of cations sites and unit cell parameters in differently doped LN crystals. In reference [
31], the authors used ab initio calculations to describe free and defect-bound polarons and bipolarons in LN. They used the calculations to explain the different spectroscopic properties of the crystals under study. Reference [
32] considered polarons at a level of separate defect using calculations. The results were confirmed by the optical properties of real crystals.
Coulomb energy is an easy but effective way to reveal details of the LN structure that are impossible to detect with other methods. A computer simulation of the influence of the doping Mg
2+ cations’ concentration on the formation of intrinsic defects in LN crystals, such as Nb
Li, V
Li, and V
Nb, is presented in reference [
33]. The Coulomb interaction in model calculations is an integral part of modern works devoted to the study of the fine features of the defect structure of a LN crystal [
34,
35]. The mutual Coulomb attraction of small-radius polarons (Nb
4+ and O
−–V
Li) was considered in reference [
34] using the example of a LN:Mg(6.5 mol% MgO) crystal. The authors of reference [
35] determined that a multiply charged dopant (Fe
2+/3+) localized in the LN structure in a lithium octahedron is capable of capturing an electron with a certain force; the force is a mixture of the Coulomb attraction and deformation of the polaron lattice.
Thus, it is possible to qualitatively evaluate the localization of trace amounts of B
3+ in O
4 tetrahedra using model calculations of the electrostatic interaction energy of point charges in a rather small cluster built from several oxygen octahedra (LiO
6, NbO
6, and VO
6). The boron cation can localize in different faces of O
4 tetrahedra. Model calculations of the features of localization of point defects (Nb
Li, Nb
V, V
Nb) in oxygen–octahedral clusters are carried out in this study using the previously obtained structural data. Calculations are made according to the method proposed in reference [
17].
In our work, we subject the B
3+ cations’ positions to the same model calculations in LN:B crystals obtained via different doping methods. These results are compared with the results for a nominally pure NSLN(HTTSSG 5.5 wt% K
2O, [Li
2O] ≈ 49.7 mol% [
36]) crystal. It should be noted that the features of MeO
6 oxygen–octahedral clusters and O
4 tetrahedral voids significantly affect the compositional uniformity, nonlinear optical, and ferroelectric characteristics of the LiNbO
3 crystal.
2. Materials and Methods
LN:B(1) was grown from a charge with 0.02 mol% B2O3 and LN:B(2) was grown from a charge with 0.547 mol% B2O3. Both single crystals were grown in the (001) direction using the Czochralski method on a growth setup Crystall-2 (Voroshilovgradsky zavod electronnogo mashinostroeniya, Voroshilovgrad, USSR). The setup was equipped with inductive heating and a system that is able to control a crystal diameter automatically. Crystals were grown in air from platinum crucibles. Initial components for both syntheses were Li2CO3, Nb2O5, and H3BO3 (99.9, Solikamsk Magnesium Plant, Solikamsk, Russia). Homogeneous doping required HF (99.99, Vekton Ltd., Saint Petersburg, Russia) and NH4OH (25% solution, Komponent-reaktiv Ltd., Moscow, Russia).
The charge for growing LN:B(1) crystal was obtained via homogeneous doping. The Nb
2O
5:B precursor was obtained via introducing a calculated amount of boric acid into a niobium pentoxide fluoride solution [
20,
35]. The solution was prepared by dissolving the Nb
2O
5 in HF. Niobium hydroxide was then precipitated by adding NH
4OH. The precipitate was then mixed with the H
3BO
3. Details are given in reference [
20].
The ratios of the main components must correspond to the congruent composition. The concentration of boron was not taken into account due to its low value (≈10
−4 wt%) while calculating the amount of Li
2CO
3 required for congruent composition with Nb
2O
5:B precursor. A detailed technological scheme of the homogeneous doping is described in reference [
20]. A boron-containing mixture was synthesized using Nb
2O
5:B precursor; LN:B(1) was grown from the congruent charge, synthesized using the precursor.
The charge for growing a LN:B(2) crystal was doped by a direct solid-phase method. A mixture of Li
2CO
3:Nb
2O
5:H
3BO
3 was used in this case [
19]. The amount of Li
2CO
3 and Nb
2O
5 required for the synthesis of the LN:B charge was taken in the ratio corresponding to the congruent composition, and the amount of H
3BO
3 was calculated for the nominally pure Nb
2O
5.
The amount of impurities in charges and samples LN:B(1) and LN:B(2), the exact details of crystal growth can be found in [
15]. Micro- and macro-defects images, and linear dimensions characteristic of boron-doped LN crystals can also be found in references [
14,
17].
XRD patterns of powder crystal samples were recorded on a diffractometer DRON-6 (NPP Burevestnik, Sankt-Petersburg, Russia). A pyrolytic graphite monochromator was located in the primary beams (CuKα radiation, voltage 45 kV, current 25 mA). The XRD patterns were taken in more detail with a step of 0.02° in the reflection areas, and with a step of 0.2° in the background areas. The stability of the registration scheme was controlled when an XRD pattern was obtained. The accuracy of determining the intensity at each point of the diffraction line was no less than 3%. The XRD data of a control NSLN(HTTSSG 5.5 wt% K
2O) crystal are given in reference [
15]. The calculation of the profile characteristics of the XRD patterns was performed by the Pauli method: the XRD patterns were decomposed into the sum of the integral intensities. The structural characteristics—atomic coordinates, thermal motion parameters, site population factors—were refined using the Rietveld method (i.e., the full profile analysis). The following programs were used: MRIA and FULL PROF. XRD patterns of powder samples and structural characteristics of the studied LN:B(1) and LN:B(2) crystals were first given in reference [
15].
The calculation of the total energy of the Coulomb interaction of point charges (U, eV) of a LN oxygen–octahedral structure fragment, with the B
3+ cation considered in the sp
2-hybrid state, was performed according to the Coulomb potential [
17]:
where z
1 and z
2 are the values of charge of interacting particles; r
12 is the distance between centers of interacting charges [Å]; and k is a constant. It is expressed by the formula (eV⋅Å) [
17]:
where e is electron charge and ε
0 is vacuum permittivity.
The considered system (cluster) consists of six oxygen octahedra in two layers (I and II): Li
IO
6, Nb
IO
6, V
IO
6, Li
IIO
6, Nb
IIO
6, and V
IIO
6. Lithium, niobium, and vacant octahedra lay in the first (I) and second (II) layers of the cluster, respectively. These oxygen octahedra form two tetrahedral voids in this configuration. The system is not electrically neutral. Model calculations consider a cluster “pulled out” from a large electrically neutral system. This was made to study the changes in the energy of the B
3+ cation interaction with the closest surrounding fragment of the LiNbO
3 crystal structure (including Nb
Li, Nb
V, and V
Nb defects in the crystal structure). We moved the position of B
3+ in the faces of vacant tetrahedral voids and calculated the corresponding interaction energy. The position of the boron cation is considered to be equidistant from each of the vertices of the occupied face of the vacant tetrahedral void in the calculations. The framework of the cluster is formed by 20 oxygen anions O
2−. The number and localization of the main metal cations in the cluster—lithium (Li
+) and niobium (Nb
5+)—varies and depends on the type and number of defects introduced into the cluster. The structural defects Nb
Li and Nb
V were detected in real LN:B(1) and LN:B(2) crystals by XRD analysis. These defects determined the choice of models for describing the localization of intrinsic point defects in the studied crystals: the model of niobium vacancies (M2 [
27,
37]) and the empty octahedra filling model (M3 [
1,
27]). We considered the formation of several types of defects in this work: Nb
Li4+ (niobium antisite, a niobium cation localized in a lithium octahedron), Nb
V5+ (a niobium cation localized in a vacant octahedron), and V
Nb5− (a vacancy in a niobium octahedron formed as a part of the charge compensation for defects Nb
Li4+ and Nb
V5+).
The steps of adjustment of real XRD data in the calculation are described in the Results and Discussion section.
3. Results and Discussion
The XRD patterns of LN:B(1) and LN:B(2) samples are similar and correspond to the XRD pattern of a nominally pure LN crystal, as can be seen in
Figure 1. LN is characterized by the R3c symmetry space group (two formula units for a rhombohedral cell and six for a hexagonal one) [
1,
15,
38,
39,
40]. The results of refinement of the unit cell periods of the studied LN:B(1) and LN:B(2) crystal samples, and a control NSLN(HTTSSG 5.5 wt% K
2O), are given in
Table 1 [
15].
Table 1 shows that the values of the unit cell parameters of LN:B(1) and LN:B(2) crystals are close to each other and approach the values for the NSLN(HTTSSG 5.5 wt% K
2O) crystal. This may indicate that the structure of LN:B(1) and LN:B(2) crystals is close to that of the LN crystal of near-stoichiometric composition.
The structural characteristics of LN:B crystals (atomic coordinates and site population factors G) characterize the distribution of cations over O
6 oxygen octahedra. These characteristics are given in
Table 2 [
15].
Table 2 shows that Nb
Li and Nb
V point structural defects are present in LN:B crystals regardless of the doping method. The site populations of these defects are close in LN:B crystals of different genesis: for the LN:B(1) G(Nb
Li) is 0.016 and G(Nb
V) is 0.009; for the LN:B(2) crystal G(Nb
Li) is 0.018 and G(Nb
V) is 0.01. The situation is quite different with the population of the lithium G(Li) and niobium G(Nb) sites of these crystals. G(Li) is almost identical for LN:B(1) and LN:B(2) crystals (0.98 and 0.99), but G(Nb) differs more significantly: 0.97 for a LN:B(1) crystal and 0.93 for the LN:B (2) crystal, as shown in
Table 2. The difference can be explained by the high complexing ability of boron. Boron derivatives have a complex effect on the crystal-melt system. In particular, they bind impurity metal cations, form borates, and prevent their transition into a growing crystal. This has been confirmed by the calculation of the isobaric-isothermal potential for the formation of impurity metal borates in a boron-containing LN melt [
15]. Boron derivatives also equalize the distribution coefficients of lithium and niobium when the crystal grows; they bind excess niobium cations in a boron-containing congruent melt [
14]. The concentration of boron cations in the LN:B(2) melt was probably able to bind a larger amount of niobium cations than the concentration in the LN:B(1) melt.
The R values in the LN:B(1) and LN:B(2) crystals were calculated using the site population factors (G(Li), G(Nb), G(Nb
Li), G(Nb
V)); R = 0.985 and 1.033, respectively. Thus, doping of a congruent charge with boron increases the stoichiometry of the grown LN crystal and R approaches unity. Moreover, the population of regular lithium sites in the structure is higher than the population of niobium sites for both variants of doping of LN:B crystals, as shown in
Table 2. However, according to the G(Li)/G(Nb) ratio, the LN:B(1) crystal is closer to the stoichiometric composition than the LN:B(2) crystal.
Table 2 also shows that niobium cations incorporate into lithium and vacant octahedra and form Nb
Li and Nb
V structural defects. This distorts the ideal order of alternation of the main cations and vacancies along the polar axis and makes the cation sublattice less stoichiometric. This additionally increases the defectiveness of the cationic sublattice of LN:B crystals [
14].
The interatomic distances of metal–oxygen (Me-O, Å) was calculated in oxygen–octahedral MeO
6 clusters in NSLN(HTTSSG 5.5 wt% K
2O) and in LN:B(1) and LN:B(2) crystals using refined atoms coordinates and unit cell periods, as shown in
Table 3 [
15].
Table 3 shows that long and short Me-O distances in LiO
6 and NbO
6 octahedra of the LN:B(1) crystal correlate with the corresponding values in the NSLN(HTTSSG 5.5 wt% K
2O) crystal. Me-O bond lengths change the most noticeably in the LN:B(2) crystal. This indicates a greater distortion of O
6 oxygen octahedra in this crystal than in the other one, as shown in
Table 3. The authors of reference [
41] found that six lithium borates (LiB
3O
5, Li
2B
4O
7, LiBO
2, Li
6B
4O
9, Li
4B
2O
5, and Li
3BO
3), one niobium borate (Nb
3BO
9), and three phases of lithium niobate (LiNb
3O
8, LiNbO
3, and Li
3NbO
4) can be formed in the ternary phase system Li
2O-Nb
2O
5-B
2O
3. The homogeneous doping includes the step of introducing a boron-containing agent (H
3BO
3) directly into niobium pentoxide while Nb
2O
5 is separated from a fluoride niobium-containing solution. This ensures the formation of only one borate (Nb
3BO
9) during the preparation of the doped precursor. The B-O and Nb-O bonds in this borate will differ less in length, because the formation of seven different borates is possible during direct solid-phase doping [
41]. Certain boron- and niobium-containing complexes form in the boron-containing melt during the solid-phase synthesis of the Li
2CO
3:Nb
2O
5:B mixture. The complexes are interconnected by covalent bonds. The lithium niobate melt consists of clusters (mostly polyhedra, octahedra, and tetrahedra [
1]). They determine such structural characteristics of the grown crystal as the geometry and composition of MeO
6 oxygen–octahedral clusters [
14]. According to the experimental data (
Table 3), the LiO
6 and NbO
6 polyhedra are distorted to the least extent in the LN:B(1) crystal in comparison to the LN:B(2) crystal. Thus, homogeneous doping is more advantageous than the solid-phase method. Homogeneous doping can provide more perfect LN crystals. Their composition is close to stoichiometric, and the photorefractive effect in them is low. Thus, samples 1 and 2, grown from a boron-doped melt, are expected to have optical homogeneity at least as good as CLN crystal and noticeably better than NSLN(HTTSSG 5.5 wt% K
2O) crystal.
The laser conoscopy and photoinduced light scattering (PILS) patterns data [
15] have confirmed the high optical quality of the LN:B(1) and LN:B(2) crystals; the photorefractive effect in the crystals is much lower than in NSLN(HTTSSG 5.5 wt% K
2O). A detailed analysis of laser conoscopy and PILS patterns has revealed that the LN:B(1) is more optically homogeneous crystal than LN:B(2) [
15].
Growing LiNbO
3 from a charge containing boron equalizes the distribution coefficients of lithium and niobium in the single crystals. This increases their stoichiometry and reduces the concentration of traces of uncontrolled metal impurities (Al, Ca, Pb, etc.) in the bulk of the crystal since metal borates form in the melt with the impurities [
15]. Moreover, boron cations incorporate into the faces of tetrahedral voids in the LN crystal structure, and reduce the concentration of Nb
Li point structural defects. These defects are the deepest electron traps in nominally pure LN crystals. Electron traps are responsible for the photorefractive effect. The amount of antisite niobium decreases in LN:B crystals to a concentration of boron cations introduced into the crystal structure [
14,
17]. This amount is not too great; the concentration of boron in LN crystals is about 4 × 10
−4 wt%. However, the photorefractive effect in such crystals is quite low. In fact, the photorefractive response in LN:B is at the same level as in the LN crystals doped with threshold concentrations of known non-photorefractive cations. The threshold concentration in these cases is quite high: 4.5 mol% for MgO, 6 mol% for ZnO, 1.5 mol% for Sc
2O
3 and In
2O
3, 4 mol% for HfO
2, and 6 mol% for ZrO
2 [
42].
We have considered several possible cationic compositions of model clusters of LN:B(1) and LN:B(2) crystals. The following issues were taken into account when forming the clusters [
15]: unit cell periods,
Table 1; the type and coordinates of the considered defects (Nb
Li, Nb
V),
Table 2; and interatomic distances Me-O,
Table 3. The building of separate clusters for each studied crystal is the first step in the adjustment of real XRD data for calculations.
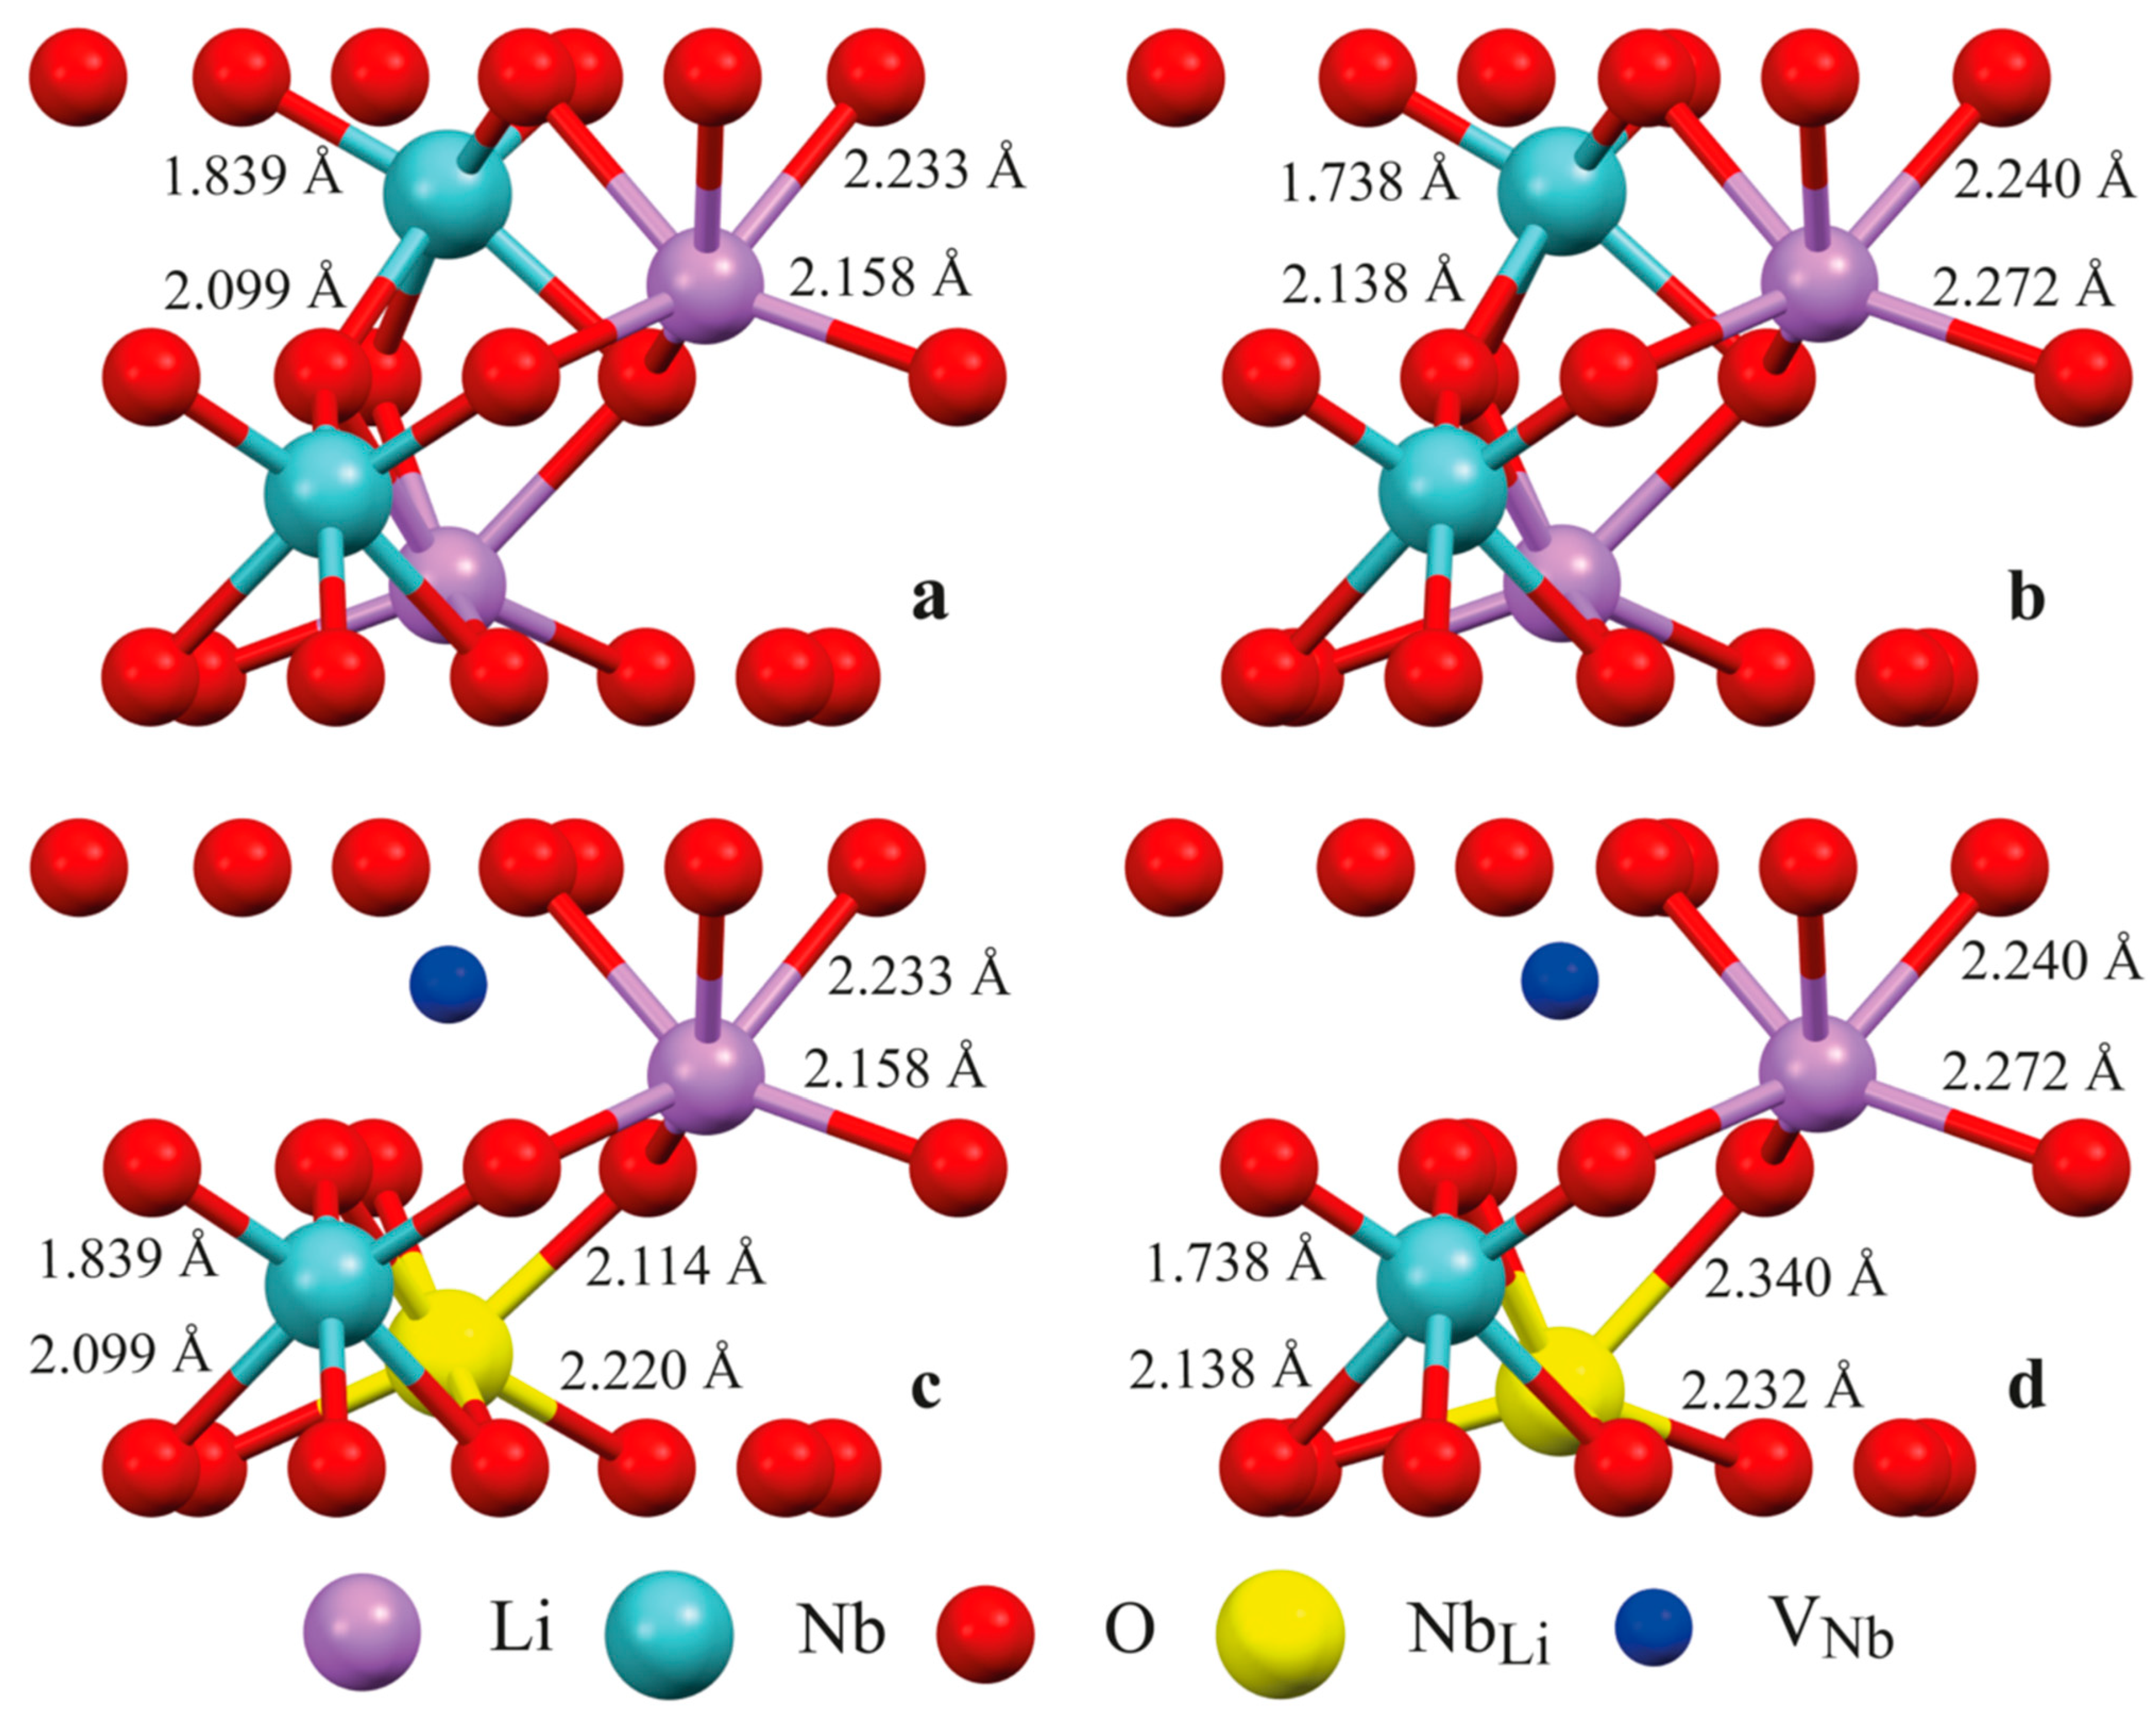
Figure 2 shows the structure of some clusters. Clusters 1.1, 2.1 (
Figure 2a,c), 2.2, 3.1, and 3.2 model a fragment of the LN:B(1) crystal structure, and Clusters 1.2, 2.3 (
Figure 2b,d), 2.4, 3.3, and 3.4 model a fragment of the LN:B(2) crystal structure using real XRD data (
Table 1,
Table 2 and
Table 3, [
15]). Clusters 1.1 and 1.2 demonstrate the ideal (characteristic of a stoichiometric crystal) alternation of Li, Nb, and V along the polar axis of the crystal, as shown in
Figure 2a,b and
Figure 3. Clusters 2.1 and 2.3 contain an antisite Nb
Li defect in layer I and a compensating [
27,
37] V
Nb in layer II, as can be seen in
Figure 2c,d. Clusters 2.2 and 2.4, conversely, contain a Nb
Li defect in layer II and the V
Nb defect in layer I. The case of the implementation of different models is considered in Clusters 3.1–3.4. In this case, the model M3 of niobium vacancies [
27,
37] and the model M2 of filling empty octahedra [
1,
27] are combined. According to the empty octahedron model, some of the niobium cations fall into the vacant octahedron with the formation of Nb
V point defects. Clusters 3.1 and 3.3 contain the Nb
V defect in layer I, and the V
Nb in layer II. Clusters 3.2 and 3.4, conversely, contain the Nb
V defect in layer II, and the V
Nb defect in layer I.
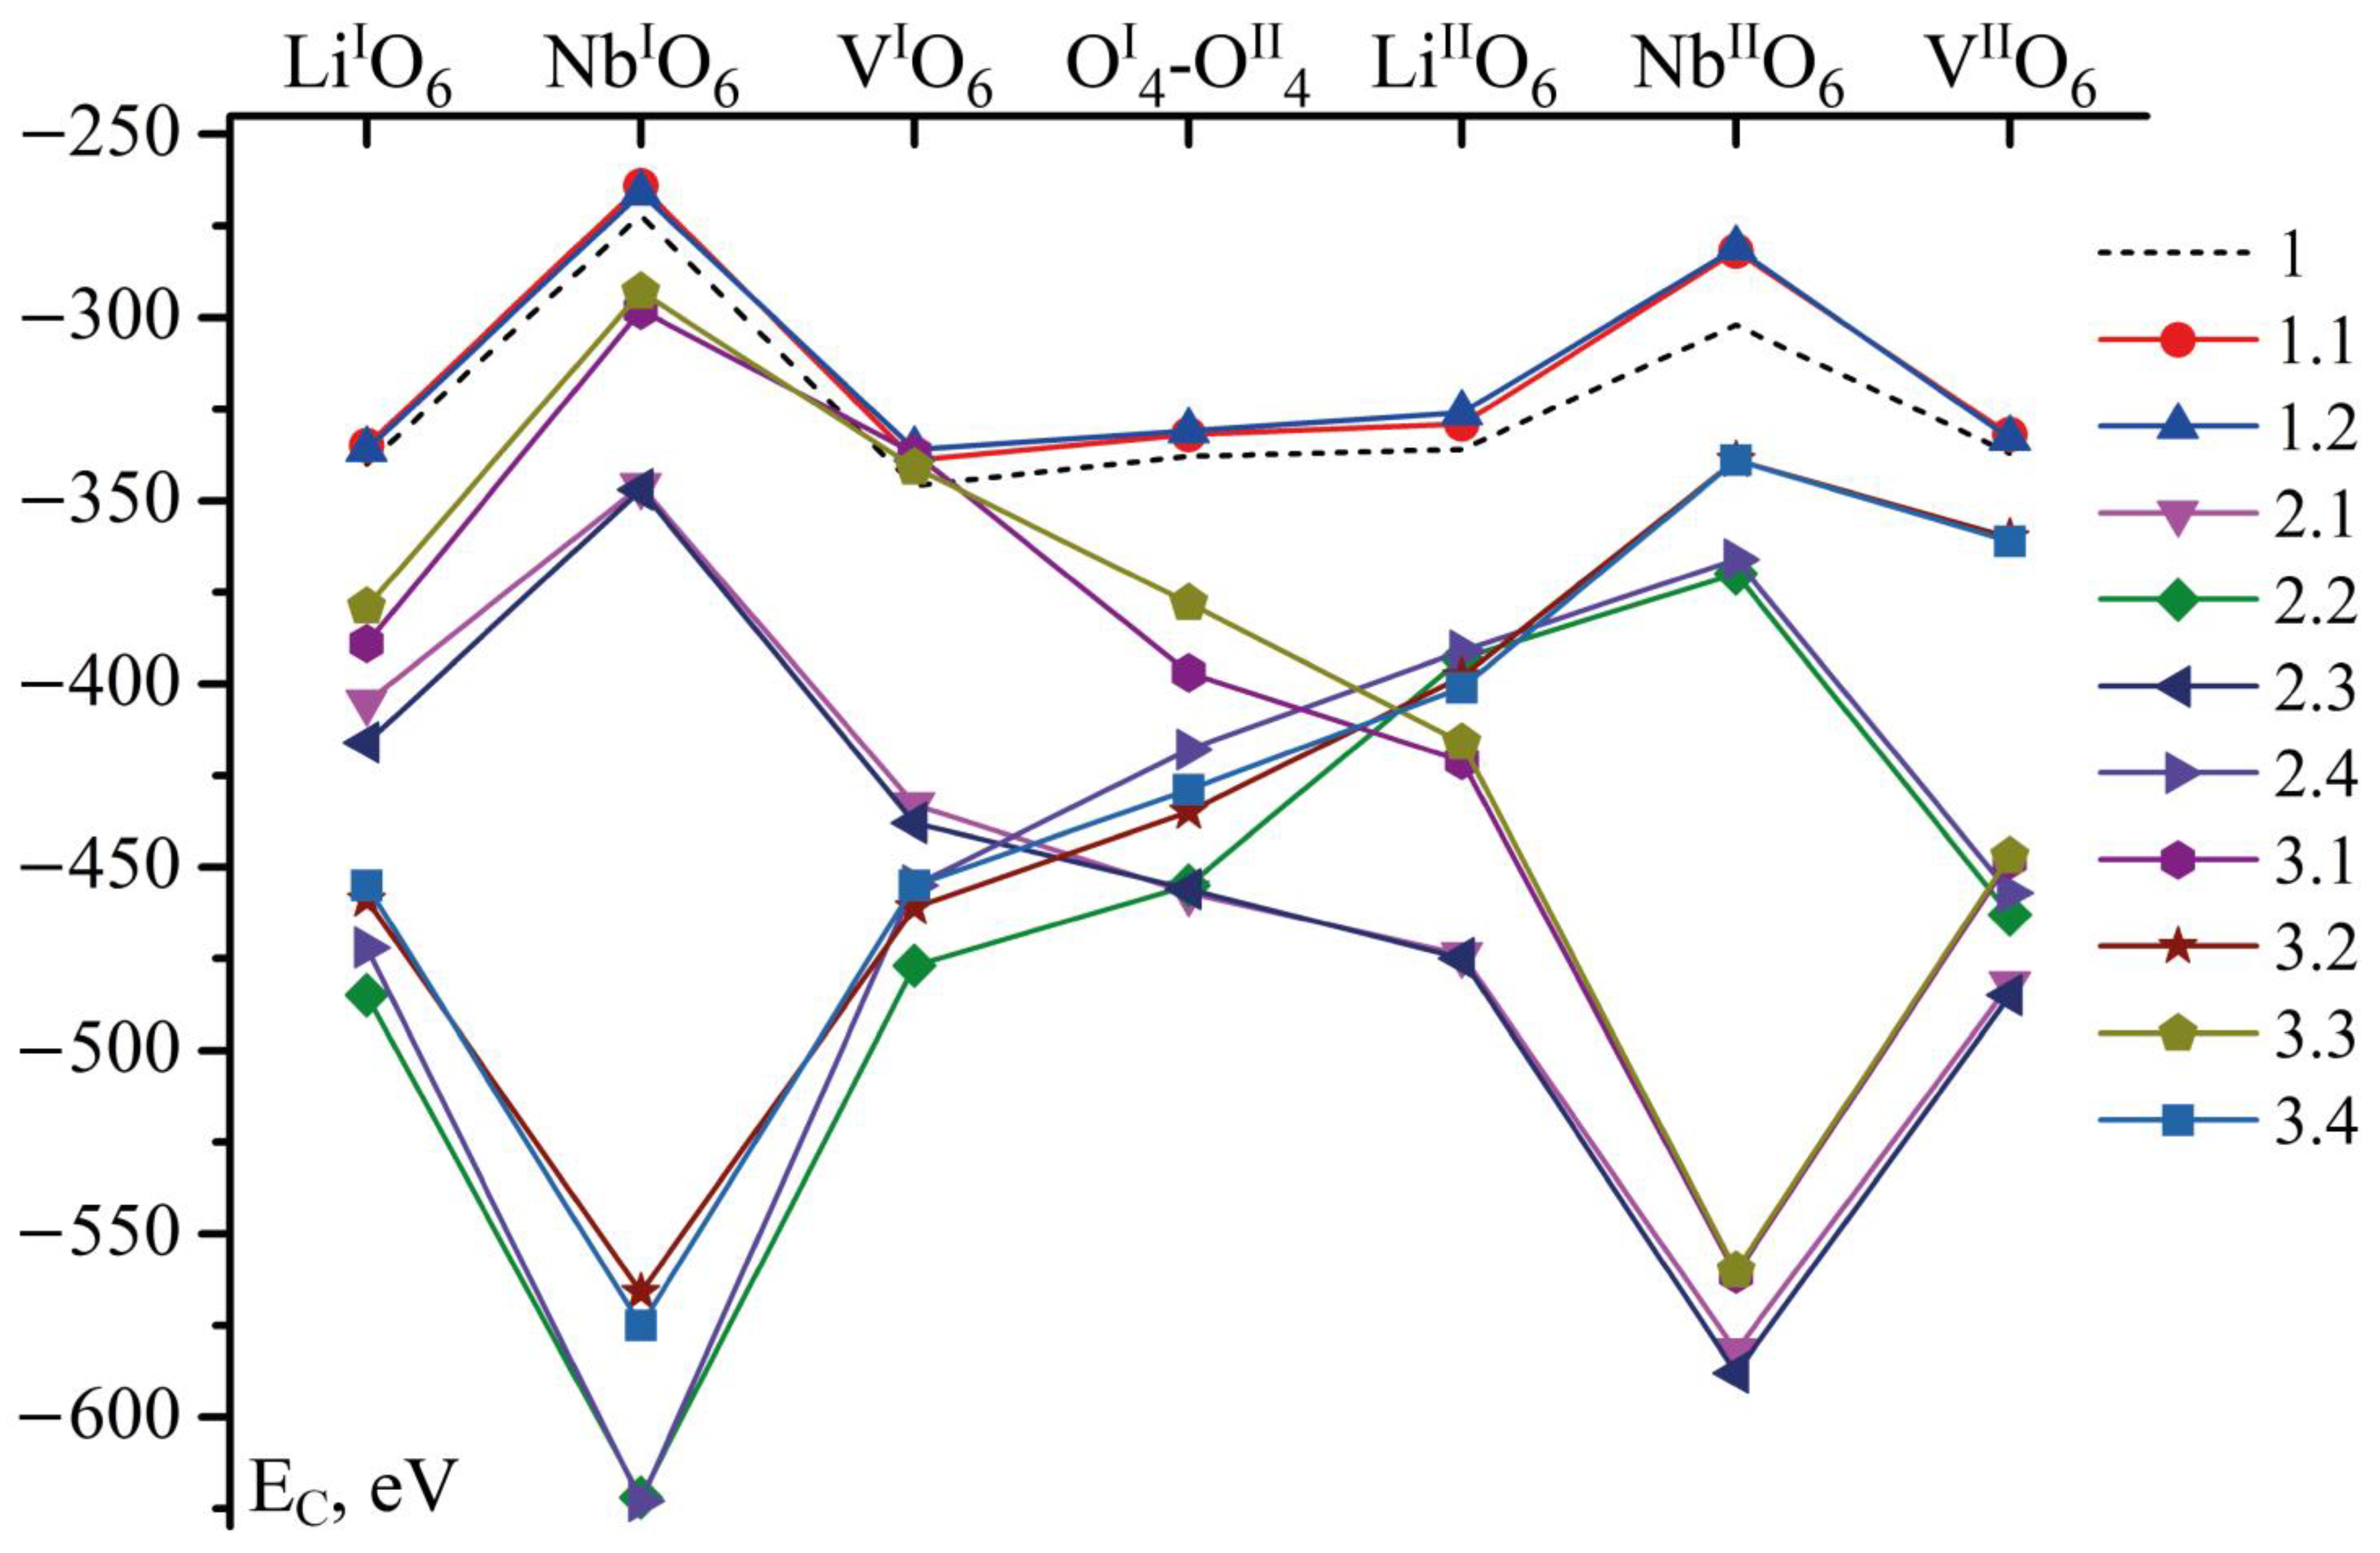
The model calculations of the Coulomb energy of boron (E
C, eV) interacting with the whole cluster are given in
Table 4 and in
Figure 4. We compare these calculations with the results of earlier model calculations given as Cluster 1 [
14,
17]. The earlier results were obtained based on the unit cell periods of a congruent crystal (
a and
c, 5.1483 and 13.8631 Å, respectively [
1]). In those calculations, we have placed lithium and niobium cations in the corresponding octahedra, and structural defects have not been considered at all.
Figure 3 shows Cluster 1.1 in more detail. First of all, it demonstrates layers I and II. In addition, it shows what the designations Li
IO
6, Nb
IO
6, and V
IIO
6, etc., in
Table 4 mean. Designations with I, such as Li
IO
6, Nb
IO
6, etc., show the location of boron in lower tetrahedron faces (faces 235, 345, and 245 in
Figure 3), designation with II (Li
IIO
6, Nb
IIO
6, etc.) in upper tetrahedron faces (faces 123, 134, and 124 in
Figure 3). The designation O
I4-O
II4 means that boron occupies a tetrahedral face in the oxygen plane in the middle of two tetrahedra (face 234 in
Figure 3). As one can see,
Figure 3 demonstrates the exact face boron occupies in a tetrahedron during calculations. Tetrahedral faces are simultaneously the faces of octahedra occupied by atom, defect or vacant. We have named the corresponding tetrahedral face by the atom, defect or vacancy in the octahedron than shares this face with the tetrahedron. Thus, the designation Li
IO
6 in
Table 4 means that B
3+ is placed into a tetrahedron face joint with the octahedron (O
6) occupied by lithium in its own site (Li) located in the layer I (
I); Nb
LiIIO
6 into octahedron (O
6), occupied by a niobium in lithium site defect (Nb
Li), located in layer II (
II), etc. Designations of the tetrahedra faces occupied by boron, in
Table 4, for other Clusters are similar to that shown, in
Figure 3, for Cluster 1.1.
The dependence of E
C on B
3+ cation position in Clusters 1.1 and 1.2 (E
C(1.1) and E
C(1.2)) is similar to the dependence in Cluster 1 (E
C(1)), as shown in
Figure 4 and
Table 4. However, E
C(1.1) and E
C(1.2) in each of the B
3+ possible positions is 4–21 eV higher than the corresponding E
C(1). Such a slight increase in E
C(1.1) and E
C(1.2) can be explained as follows. A congruent crystal (Cluster 1) grows from a congruent charge, i.e., the ratio of the main components in the melt and the crystal growing from it coincides (R = [Li]/[Nb] = 0.946). Obtaining stoichiometric (R = 1) and near-stoichiometric (0.946 < R < 1 [
1,
24]) crystals is a complex technological task; the complexity is caused by some features of the phase diagram of the Li
2O-Nb
2O
5 system in the region of the LN phase [
24,
43,
44]. The stoichiometric composition of the LN phase is at the edge of the homogeneity region, and a pronounced maximum is absent from the intersection of the solidus and liquidus lines. This leads to a partial dissociation of the compound. Therefore, even very weak doping of the melt with a chemically active element B
3+ greatly changes the composition of the melt. This changes the type and concentration of reactive ionic complexes in the melt. The complexes determine the crystal structure during LN crystallization. The layer crystal-melt changes most seriously. This inevitably increases the energy of such a system. Therefore, the E
C(1.1) and E
C(1.2) energies are greater than E
C(1). Thus, despite this increase in the energy, B
3+ cations in Clusters 1.1 and 1.2 (
Table 4 and
Figure 4) will prefer to localize in the same tetrahedra faces as in Cluster 1: in lithium (Li
IO
6, Li
IIO
6), vacant (V
IO
6, V
IIO
6) octahedra, or in the middle oxygen plane (O
I4-O
II4).
The dynamics of the E
C(2.1–3.4) strongly differ from those of E
C(1), E
C(1.1), and E
C(1.2), as shown in
Table 4 and
Figure 4. E
C in Clusters 2.1–3.4 is significantly smaller (sometimes more than two times) than that in Clusters 1, 1.1, and 1.2. Regular clusters without defects have E
C values around −250–−350 eV, whilst some of E
C values of clusters with a defect can reach −620 eV and even less. This fact means that boron is more likely to be embedded near a defect than in a regular structure. For boron, according to our calculations, this is energetically favorable. Later, we will prove that B is more likely to occupy a position near an empty octahedron, and not just regularly empty, but defectively empty (V
Nb). Thus, boron decreases the distortion of such an octahedron and strengthens the whole anion sublattice at a local level of separate clusters. Moreover, it has a charge +3, this decreases the charge tension caused by V
Nb defects, since V
Nb brings an extra -5 charge to the crystal lattice. The defects V
Nb are supposed to compensate for Nb
Li and Nb
V in the whole crystal but, locally, the defects strongly distort the electrical field of a crystal. The B
3+ cation favorably incorporating near V
Nb5− decreases this local charge tension. Thus, B not only structures the LN melt upon doping [
14], but also positively influences the local substructure of a doped LN crystal despite its small concentration. This is probably one of the reasons why boron-doped LN crystals are optical damage resistant.
The exceptions are energies of B localized in: Nb
IO
6 position for Clusters 2.1 and 2.3; Nb
IO
6 and Nb
VIO
6 positions for Clusters 3.1 and 3.3; and Nb
IIO
6 position for Clusters 3.2 and 3.4, as shown in
Table 4 and
Figure 4. E
C of these exceptions are close to E
C in Clusters 1, 1.1, and 1.2 in positions V
IO
6 and V
IIO
6. As we have already mentioned above, these positions of B cation are the most probable ones in Clusters 1, 1.1, and 1.2, since their Coulomb energy is lower than energies of other positions of boron,
Figure 4.
The minimum E
C in Clusters 2.1 and 2.3 corresponds to the boron position V
NbIIO
6: −582 and −588 eV, respectively. The minimum E
C in Clusters 2.2 and 2.4 also corresponds to the position of boron in the tetrahedral face joint with the niobium vacancy octahedron, but this time is located in layer I, V
NbIO
6: −622 and −623 eV, respectively, as shown in
Table 4 and
Figure 4.
Cluster pairs built on the XRD data of different crystals (LN:B(1) and LN:B(2)), but with the same defect in one layer (I or II), have very similar E
C values in similar positions; the difference between them is only 13 eV or even less, as shown in
Table 4. We speak about Cluster pairs 2.1 and 2.3, 2.2 and 2.4, 3.1 and 3.3, and 3.2 and 3.4. Sometimes the energy minimum belongs to LN:B(1) (Clusters 2.1, 2.2, 3.1, and 3.2), and in other cases to LN:B(2) (Clusters 2.3, 2.4, 3.3, and 3.4). However, a greater difference in these pairs is determined only in several points: V
IO
6 E
C(2.4) − E
C(2.2) = 22 eV; O
I4-O
II4 E
C(2.4) − E
C(2.2) = 37 eV; and O
I4-O
II4 E
C(3.3) − E
C(3.1) = 19 eV. Clusters with lower energies (2.2 and 3.1) belong to LN:B(1) crystal. Hence, homogeneous doping forms a certain mutual arrangement of the structural units of the cationic and anionic sublattices of the LN crystal. With this arrangement, the minimal interaction of the Coulomb energy of trace amounts of boron cations with the crystal structure is deeper in LN:B(1) than in LN:B(2).
E
C(3.1) and E
C(3.3) are minimum when the B
3+ cation is localized in the V
NbIIO
6 position, −561 and −560 eV, respectively, as shown in
Table 4. In Clusters 3.2 and 3.4 E
C is minimum when the B
3+ cation is localized in the V
NbIO
6 position, −566 and −575 eV, respectively, as shown in
Table 4. Thus, boron will favorably occupy a position near a vacant niobium octahedron (V
NbIO
6 and V
NbIIO
6) while incorporating into a defect-containing cluster.
Despite the symmetry of defect positioning in oxygen layers I and II for each crystal and each defect type (Cluster 2.1 has a NbLi defect in layer I, Cluster 2.2–in layer II, all other configuration is the same, both clusters refer to one crystal LN:B(1)), the most energetically favorable boron positions are not symmetric in similar clusters. Thus, Coulomb energy is sensitive to the mutual location of defects along the polar axis. This is true, at least, in LN clusters as small as those used in our study.
Figure 4 and
Table 4 show that E
C depends on boron localization in the faces of vacant tetrahedral voids, the type of structural defects, and the doping technology. The most interesting dependence is on the doping technology. Thus, we have to compare real LN:B(1) and LN:B(2) crystals in terms of the E
C. However,
Table 4 demonstrates boron localization energy only in separate clusters, not in the whole crystal. Real crystals contain a lot of described clusters. We have developed a method that allows us to evaluate the probability of boron occupying all sites. The method includes the second adjustment of real XRD data into our model.
In order to evaluate real crystals data we have to consider site population factors for intrinsic cations (G(Li), G(Nb)) and defects (G(Nb
Li), G(Nb
V)), as shown in
Table 2 [
15]. We also have to take into consideration the fraction of vacant octahedra not occupied by Nb
V. We are thus led to the second step of real XRD data adjustment in our calculations.
The main volume of the LN:B(1) and LN:B(2) crystal is the alteration of cations, vacancies, and defect corresponding to the perfect Clusters 1.1 and 1.2, respectively. This perfect structure contains some small amounts of defect clusters of different configurations scattered in the bulk of the crystal. So, if we want to calculate the contribution of each type of cluster to the whole real crystal, we have to take population factors into consideration.
The formula for the calculation of the real contribution of energy of each boron position (
) to the whole crystal for Clusters 1.1 and 1.2 is as follows (Cluster 1.1 is given as an example):
where
is the Coulomb interaction energy of a boron cation located in the Li
IO
6 face of a tetrahedron of Cluster 1.1,
is a corresponding value from
Table 4, and K
1.1 is a coefficient taking into account the site population factors of the main metal cations and defects in the structure of the considered Cluster 1.1 (see
Table 2 for data for crystal LN:B(1)). The coefficient is calculated using the formula:
where G(Li
Li) is the population factor of Li atoms in lithium sites, G(Nb
Nb) is the population factor of Nb atoms in niobium sites, and G(V
V) is the amount of strictly vacant octahedra in vacant sites calculated using the formula:
where G (Nb
V) is the population factor of Nb atoms occupying vacant octahedra.
Strictly speaking, we cannot discuss vacancy ‘population’, since these are octahedra free of any cations; they are not populated. However, LN structure vacancies are crucial; we must take their amount into consideration.
Calculations of
and K
i for all possible boron positions (in Li
IO
6, Nb
IO
6, V
IO
6, O
I4-O
II4, Li
IIO
6, Nb
IIO
6, and V
IIO
6 faces of tetrahedra), made for Clusters 1.1 and 1.2 according to Formulas (3)–(5), are given in
Table 5. In the case of Cluster 1.2, corresponding data were taken from
Table 2.
The calculations for Clusters 2.1–2.4 were similar, but they included data for corresponding defect (Nb
Li) and compensated for niobium vacancy (V
Nb). The formula for Cluster 2.1 is given as an example; Clusters 2.2–2.4 were calculated correspondingly:
where
is the Coulomb interaction energy of a boron cation located in the Nb
LiIO
6 face of a tetrahedron of Cluster 2.1,
is a corresponding value from
Table 4, and K
2.1−2 is a coefficient calculated using the formula:
where G(Nb
Li) is the population factor of Nb atoms occupying lithium octahedra, and G(V
Nb) is the amount of vacant niobium octahedra calculated as:
The coefficient K
2.1−2 is used because the structure of Clusters 2.1 and 2.2 is different only in the mutual location of defects; all other data (the amount of defects in the cluster, the site population factor for them) are the same. The coefficients are identical for Clusters 2.3 and 2.4 (K
2.3−4), 3.1 and 3.2 (K
3.1−2), and 3.3 and 3.4 (K
3.3−4). The coefficients and calculations according to the Formula (7) are given in
Table 5.
Clusters 3.1–3.4 contain a defect Nb
V, which should be taken into consideration in calculations. The Coulomb energy calculation in Cluster 3.1 is given as an example; all other calculations for Clusters 3.2–3.4 were made similarly, but with the according data from
Table 2 and
Table 4:
where
is the Coulomb interaction energy of a boron cation located in the Li
IO
6 face of a tetrahedron of Cluster 3.1,
is a corresponding value from
Table 4, and coefficient K
3.1−2 was calculated using the formula:
where G(i) is the corresponding population factor for the corresponding crystal (LN:B(1) or LN:B(2)). The results of the calculations are given in
Table 5.
We have obtained
and summed them for each studied crystal in each position:
Thus, we have summed all numbers in the columns of
Table 5 for each LN:B crystal. The results are given in
Figure 5.
Figure 5 shows that the localization of B
3+ cations in LN:B(1) and (2) crystals (0.02 and 0.547 mol% B
2O
3 in the charge) is most probable in the three positions in the faces of vacant tetrahedral voids. The first position is the localization of B
3+ cations in the faces of vacant tetrahedral voids, which are similar to lithium ones (Li
IO
6, Li
IIO
6); the second position is the localization of B
3+ cations in the faces of vacant tetrahedral voids, which have vacant (V
IO
6, V
IIO
6) octahedra; and the third position is the localization of B
3+ cations on the oxygen plane, which is common for adjacent tetrahedra (O
I4-O
II4). The obtained data are in a good agreement with the results of references [
14,
17]. The absolute energy minimum corresponds to the position of the B
3+ cation in the V
IO
6 face of the vacant tetrahedral void of the LN:B(1) crystal obtained via homogeneous doping, as shown in
Figure 5.
Thus, the technology of homogeneous doping, compared to the technology of direct solid-phase doping, leads to a general decrease in the energy of the Coulomb interaction of the B
3+ cation with the crystal fragment surrounding it (
Figure 5), regardless of its localization in the considered Clusters 1.1–3.4, as can be seen in
Figure 4 and
Figure 5,
Table 4 and
Table 5. The obtained data are in a good agreement with the results of XRD analysis presented in reference [
15]. The R = [Li]/[Nb] value for the LN:B(1) crystal calculated on the basis of site population factors (
Table 2 [
15]) is 0.985. It is close to the value R of a stoichiometric crystal. The interatomic distances <Me-O> in the clusters of the main motif (NbO
6, LiO
6), and in the clusters of the sublattice of point defects (Nb
LiO
6) of the LN:B(1) crystal, are closer to the interatomic distances of the NSLN(HTTSSG 5.5 wt% K
2O) (
Table 3) compared to those for the LN:B(2) crystal [
15].

 ,
, 


